uruguay. geography history and government the historical independence process had two big phases;...
TRANSCRIPT

Uruguay

Geography

Geography

Geography

History and Government
• The historical independence process had two big phases; first the country became a regional unit ( Banda Oriental ) and later, on July 18, 1830, an independent nation.
• During the first years of being an independent country Uruguay received a great number of immigrants.
• Uruguay enjoys a solid democracy and an excellent social environment.
• There are three main political parties.

Population evolution
1369.4
1439.0
1532.3
1419.0
1516.2
1631.5
1975 1985 1996
Pe
op
le
Male Female
Population
2.788,4 2.955,2 3.163,8
Source :INE

Density of Populationper Km2
15.9
16.8
18.0
14
15
16
17
18
19
1975 1985 1996
Population
Source :INE

Distribution
28.9
22.7
28.6
19.8
0
5
10
15
20
25
30
35
Montevideo Rest of the country Montevideo Rest of the country
%
Population
Male Female
Source :INE

Ratio between Women Income per cap. Vs Mens Income

Population
Demographic Evolution Rate
0
5
10
15
20
25
1950 1960 1970 1980 1990 2000 2010 2020
%
Birth
Mortality
Source :INE

Population
Life Expectancy
60
62
64
66
68
70
72
74
76
78
80
1950 1960 1970 1980 1990 2000 2010 2020
Ye
ars
Female
Male
Total
Source :INE

Global Birth Rate by Country/5 Yrs

Literacy level
• The official eduacational system is compulsory up to secondary level.
• Its third basic principle is that it should not be influenced by ideological or religious beliefs of any kind.
• The rate of literacy in the country is very high.

Literacy level

The Uruguayan Economy
• Uruguay has an efficient service sector.
• This strategy is made possible as a result of a political and social environment .
• A frame of policies and incentives to promote the expansion of exports.
• Mechanisms which make possible to promote the growth and diversification of agriculture and manifacturing for export.

The Uruguayan Economy
• The private sector is considered to have a fundamental role in the future growth of the economy.
• The current economy policies sustain as an essential resource for achieving the established objectives.
• The Uruguay of today is engaged in a policy of Latin American integration.

I ncome in U$S
3290
3752
5556
5770
6348
67956592
63286004
5482
47634189
28153007
3597
1989 1990 1991 1992 1993 1994 1995 1996 1997 1998 1999 2000 2001 2002 2003
U$
SIncome per Capita
Source :INE

Variance in %
-12
-10
-8
-6
-4
-2
0
2
4
6
8
1993 1994 1995 1996 1997 1998 1999 2000 2001 2002 2003
%
Gross Domestic Product
Brazil devaluation
Aftosa
Argentinian crisisFinancial crisis
Source :INE

Electricity, Gas , Water
5%
Manufacturer I ndustry
20%
Goods and services15%
Others11%
Transportation & Comunications
11%
Trade, Restaurants , Hotels13%
Goverment Services9%
Finance & I nsurance12%
Building4%
Gross Domestic Product
Source :INE
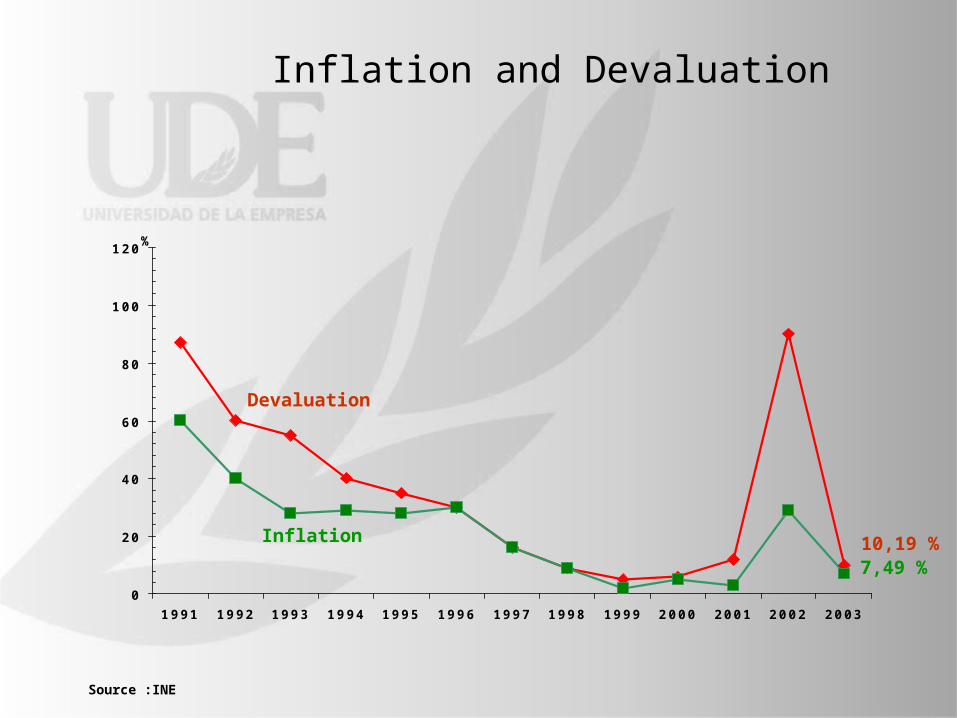
Inflation and Devaluation
0
20
40
60
80
100
120
1991 1992 1993 1994 1995 1996 1997 1998 1999 2000 2001 2002 2003
%
Devaluation
Inflation
7,49 %10,19 %
Source :INE

Unemployment
Annual Average
16.916.915.3
13.6
11.310.1
11.411.910.3
9.28.3
0
2
4
6
8
10
12
14
16
18
0
2
4
6
8
10
12
14
16
18
Montevideo 8.4 9.2 10.8 12.3 11.6 10.2 11.8 13.5 15.5 17.0 16.7
I nterior 8.2 9.2 9.7 11.4 11.3 9.9 10.7 13.3 15.0 16.9 17.1
Total Country 8.3 9.2 10.3 11.9 11.4 10.1 11.3 13.6 15.3 16.9 16.9
1993 1994 1995 1996 1997 1998 1999 2000 2001 2002 2003
Source :INE
Trade Balance
• As in the financial sphere, since the mid 70´s Uruguay has undertaken a progressive liberalization of its trade relations.
• Imports , tariffs were reduced and quotas and other barriers were eliminated.
• There are no non – tariff barriers.
• Export promotion made it possible to break with the extreme dependence on a very limited number of commodities.
