us beverages americas/united states equity research beverage
TRANSCRIPT

DISCLOSURE APPENDIX AT THE BACK OF THIS REPORT CONTAINS IMPORTANT DISCLOSURES, ANALYST CERTIFICATIONS, LEGAL ENTITY DISCLOSURE AND THE STATUS OF NON-US ANALYSTS. US Disclosure: Credit Suisse does and seeks to do business with companies covered in its research reports. As a result, investors should be aware that the Firm may have a conflict of interest that could affect the objectivity of this report. Investors should consider this report as only a single factor in making their investment decision.
23 March 2017Americas/United States
Equity ResearchBeverage
US Beverages THEMEResearch Analysts
Laurent Grandet212 538 7901
Clay Crumbliss, CFA212 538 1076
Conchita Gonzalez de Castejon, HOLT212 325 2547
Face-off with DPS and TAP; What a Difference an Acquisition Can MakeComparing Dr Pepper Snapple (Outperform, $111) and Molson Coors (Neutral, $106) might seem like apples and oranges, but we point out more similarities than might initially meet the eye. Both companies just underwent major acquisitions that will help shape the future trajectory of each. Based on a comparison using both qualitative and quantitative metrics, we conclude that overall DPS has a more favorable fundamental outlook and less risk than TAP.
■ Comparable businesses. Both are North America-centric with similar market caps around $20B, both have structural issues within their core business that is impairing top line growth, and both generate strong free cash flow.
■ DPS bought growth while TAP increased scale. In our view, Dr Pepper Snapple’s acquisition of Bai Brands and Molson Coors’ acquisition of the remaining 58% of the MillerCoors JV represent an inflection point that puts these two companies on very different paths. DPS gains 2-3% point of profitable top line growth while TAP will be dependent on synergies and cost cutting while still trying to stabilize the top line.
■ Better fundamentals for DPS and more risks for TAP. While the acquisition of Bai is dilutive to the concentrate model margin (65%), it's accretive to the Packaged Beverages segment margin and is incremental to the already strong organic growth profile. In addition, the risk profile improves now that DPS fully controls one of its top-performing Allied Brands. For TAP, we see limited, if any, upside to the already communicated synergies and cost cutting targets while we also think that sales growth will remain challenged owing to its over-exposure to underperforming US beer segments. This poses a risk to both the top line and the margin structure if the cost structure continues to be deleveraged.
■ Raising DPS target price; TAP not as cheap as it looks. We maintain our Outperform rating on DPS and Neutral rating on TAP. We are raising our target price for DPS to $111, assuming a 21x PE. We maintain our $106 target price on TAP, which assumes a 17x on core earnings (in-line with historical average) plus the $11 present value of the cash tax benefit.
■ HOLT® valuation favors DPS over TAP. The HOLT® proprietary analysis indicates that both acquisitions (Bai and MillerCoors) have been accretive to CFROI® and economic profit and that the market-implied expectations embedded in current prices look demanding for TAP and conservative for DPS. The HOLT® DCF indicates that DPS is a more favorable investment than TAP, on a relative basis.

23 March 2017
US Beverages 2
Why the Face-Off Makes SenseComparable Core Business Dynamics and ChallengesWe recognize that Dr Pepper Snapple and Molson Coors have no category overlap, but we think it's fair to compare the two based on what they have in common.
Similar market cap: both are of similar market size with DPS at $18B and TAP at $21B. This means that they tend to be grouped into the same size index and technical factors (i.e. fund flows) that impact one, likely impacts the other as well.
North American centric businesses representing more than 90% of DPS and about 80% of TAP will little or no opportunity to grow internationally. DPS doesn't own the rights to its largest brands outside the US (Dr Pepper brand is owned by Coca-Cola, 7Up is owned by PepsiCo, and the Snapple rights were just bought back). Internationally, Miller and Coors are just in their infancies.
Figure 1: Dr Pepper Snapple has around 93% of sales in the US and Canada
Figure 2: Molson Coors has nearly 80% of sales in the US and Canada
US90%
Mexico6%
Canada3%Other1%
Total DPS Sales by Geography
US64%
Canada15%
UK10%
Int'l11%
Total TAP Sales by Geography
Source: Company data, Credit Suisse estimates Source: Company data, Credit Suisse estimates
Cash generation: both companies generate significant free cash flow around the $1B level with similar conversion rates of 10-12%.
Balance sheet strength: prior to the recent acquisitions, each had a healthy balance sheet with relatively low leverage at around 2x for both TAP and DPS.
Consumers' challenges: each faces similar challenges in terms of top line growth in their core portfolios. Both the US mainstream beer and CSD / juice categories are under pressure from consumer consumption trends, disruptive entrepreneurial innovations, and macro factors. In the US, Molson Coors portfolio is entirely beer, cider, hard sodas, which has certainly has pockets of growth, but in general is flat to declining. 85% of Molson Coors' beer sales are in economy and light, which are the most challenged segment in terms of growth and the lowest priced.
Dr Pepper Snapple has a large exposure to the CSD category and juice drinks in US retail. The rest of portfolio is in non-carbonated beverages, which is dominated by the Allied

23 March 2017
US Beverages 3
Brands (~15% of total). These brands tend to be more on-trend with consumer preferences and are growing on average at 15-20% (ex Bai).
Figure 3: Dr Pepper Snapple is heavily skewed to CSD in US retail, the majority of which is Dr Pepper
Figure 4: Molson Coors is 85% exposed to the Light and Economy segments of US retail beer
CSD70%
Shelf-stable Juice15%
Tea5%
Water8%
Sports Drinks
2%
DPS US Retail Sales SplitPremium
5%
Light64%
Econ21%
Imports2%
Craft8%
Molson Coors US Beer Retail Split
Source: Company data, Credit Suisse estimatesGives DPS credit for 100% of Allied Brand sales.
Source: Nielsen Beverage Alcohol Database, Credit SuisseAs of 31 December 2016.
2016 Acquisitions Provided Different Benefits to DPS and TAPIn 2016 Dr Pepper Snapple completed the acquisition of Bai Brands and Molson Coors closed on its acquisition of the portion of the MillerCoors JV that it did not already own.
Dr Pepper SnappleDr Pepper Snapple bought growth, not scale. As part of its Allied Brands portfolio, DPS was previously distributing the majority of Bai volume and it owned 3% of it (purchased in 2015 for $15M). When the owners of Bai began exploring a sale process, Dr Pepper Snapple management had to decide if it wanted to acquire the brand outright or loose it from the system. As we said prior to the deal being announced, the BAI acquisition made a lot of sense for DPS if the price was between $1.3B and $1.5B rather than the $2B communicated in the press at the time. Bai was and is still growing at a very fast high-double digit rate so the growth that it brings to the DPS top line is clearly meaningful, despite the brand still being relatively small (we estimate around ~$300M).

23 March 2017
US Beverages 4
Figure 5: Bai has been one of the more successful Allied Brands in the portfolio
0
20
40
60
80
100
4 W/E02/01/14
4 W/E06/21/14
4 W/E11/08/14
4 W/E03/28/15
4 W/E08/15/15
4 W/E01/02/16
4 W/E05/21/16
4 W/E10/08/16
4 W/E02/25/17
Ret
ail A
CV
(%)
Select Allied Brands Retail Distribution
Bai Vita Coco Big Red Body Armor Neuro
Source: Company data, Credit Suisse estimates
We estimate that now fully integrated into the algorithm, Bai adds an incremental 2-3 pts of top line growth as DPS was only distributing around 70% of the total brand volume. As Bai grows larger it improves the mix and growth profile of the higher margin Owned Brands portfolio leading to our consolidated 5% organic growth assumption by 2018.
In addition, Bai has done a good job expanding into adjacencies and plenty of room to run in categories such as premium juice, water, tea, soft drinks, and water. This will help drive incremental growth opportunities and build the brand’s awareness with consumers.
Figure 6: Selected summary of the Bai Brands product lineup
Source: Company websites, Credit Suisse
We are encouraged that DPS management will invest heavily behind the brand and its extensive innovation pipeline while keeping the Bai head office and team separated. While this amounts to a heavy spending step-up initially in 2017 (+$170M including $80M of marketing), we think it is critical to maintain the "startup" spirit of Bai and the brand building to ultimately reinvigorate the growth trajectory of the company and realize an adequate return on investment.

23 March 2017
US Beverages 5
Figure 7: We estimate Bai will approach 10% of DPS retail sales by 2019
2%
3%
6%
8%
0%
2%
4%
6%
8%
2015A 2016A 2017E 2018E
Per
cent
of T
otal
Sal
es (%
)
Bai as a Percent of Total DPS Sales
Source: Company data, Credit Suisse estimates
Molson Coors Molson Coors bought scale, not growth. As part of AB InBev’s deal to acquire SABMiller, it needed to divest of the controlling interest in the MillerCoors JV. As a result, TAP agreed to acquire the 58% of the JV it didn't already own. Although we think Molson Coors management found significant strategic and financial merit in the transaction, we view it as a transaction of necessity that ultimately did not change much fundamentally for Molson Coors (other than now being fully consolidated).
In our view, Miller and Coors don't have complementary portfolios, and we see similar strengths in light and economy while both also having similar weaknesses with a lack of significant presence in imports, and more specifically Mexican imports.
Figure 8: Overlaps and gaps in the portfolio with limited imports range and no Mexican beerSegment Size Miller Coors Comments
Premium $5B Under-indexed with only 7% share of segment
Light $10.5B 43% share combined / #2 and #3 brands in a flat segment
Economy $5.3B 28% share of a declining segment
MillerCoors Comments
Import $6B 2-3% share / no Mexican imports
Craft $3.9B ~14% share / Blue Moon is losing share in a crowded segment
Source: Nielsen Beverage Alcohol Database, Credit Suisse.As of 31 December 2016; shares are representative of the segment.

23 March 2017
US Beverages 6
With scale comes potential cost savings and synergies. Molson Coors management has guided to $550M of combined synergies and cost savings through 2019, split 50/50 between cost savings and transaction synergies. It’s not clear how much the company expects to drop to the bottom line, but we think there is a high likelihood that the majority of that will need to be reinvested in the business as the competitive environment in the US heats up.
We see limited, if any, upside to the synergy target. First, the MillerCoors JV had already achieved cumulative synergies of nearly $550M by 2011 and has realized nearly $700M in additional cumulative cost savings to date. Also, our math suggests that the announced synergies and cost savings, if realized and assuming no re-investment, will put the US segment gross profit and SG&A nearly at parity (on a per hl basis) with the benchmark.
Margins still optically lag the benchmark. We have attempted to understand what makes the MillerCoors margin profile seemingly weaker than ABI's in the United States. Pro forma for the full $550M of expected synergies and cost savings and without factoring in any reinvestment needs (as shown in grey), the gap to ABI US narrows to 10pts (from 17pts), with the majority of the improvement coming from SG&A savings (500 bps) and the other 200 bps coming from gross margin.
Figure 9: After $550M of costs savings and synergies, the majority of the gap to ABI's operating margin will be due to the structurally lower gross margin
10%
15%
20%
25%
30%
35%
40%
MillerCoors Gross Margin SG&A Expense ABI US
Ope
ratin
g M
argi
n (%
)
MillerCoors Margin Bridge to ABI US., pre- and post-synergies
MillerCoors, pre-synergy MillerCoors, post-synergy
18%
25%
10%
8% 7% 2% 36%
Source: Company data, Credit Suisse estimates.Post-synergies assumes most of the $275M of on-going cost saving will benefit cost of goods with the remainder of cost savings and all the $275M of synergies benefiting operating expenses; assumes no re-investment.Note: ABI US gross margin adjusted for differences in accounting methodologies (Canadian results have been removed).
In terms of SG&A margins, this effectively puts MillerCoors on par (~2pts difference) with the benchmark, while SG&A expense per hectoliter improved to be on par with ABI US. As a percent of sales, the 2% variance represents just under $200M of possible additional savings upside. However, we think this would be unlikely to be achieved without closing two of the three headquarters (Denver, Chicago, or Montreal) the company said it would maintain.
We further analyzed gross margin and our analysis suggests that closing the remaining 8pt gross margin gap would be very difficult because the difference is mostly driven by lower revenue per hectoliter (hl) and not inflated COGS. In fact, the post-synergy COGS per hl would actually be lower for MillerCoors at $61 than ABI US at $62. This is significant

23 March 2017
US Beverages 7
given that ABI is broadly considered among the best when it comes to cost cutting, procurement, and supply chain efficiency.
Figure 10: The lower gross margin is not a result of inflated COGS
Figure 11: MillerCoors net revenue per hl is 14% lower than ABI US owing to lower portfolio pricing
64 61 62
100 96
0
20
40
60
80
100
120
MC*, pre-syn
MC*, post-syn
ABI US STZ beer SAM
Cos
ts ($
per
HL)
Cost of Goods per HL
111 130
201 194
0
50
100
150
200
250
MillerCoors* ABI US STZ beer SAM
Sal
es ($
per
HL)
Net Revenue per HL
Source: Company data, Credit Suisse estimates.Note: ABI US cost of goods adjusted for differences in accounting methodologies (Canadian results have been removed).*MillerCoors includes Pabst contract brewing results; post-synergies includes transaction synergies and costs savings, ignoring any reinvestment.All shown CS estimates for FY16E (except STZ shown for FY17E).
Source: Company data, Credit Suisse estimates.Note: ABI US removes results from Canadian operations.*MillerCoors includes Pabst contract brewing results that are dilutive to core net revenue / HL; post-synergies includes transaction synergies and costs savings, ignoring any reinvestmentAll shown CS estimates for FY16E (except STZ shown for FY17E).
The acquisition doesn’t solve the portfolio problem. We think the gross margin will remain structurally disadvantaged because of the positioning of the portfolio and the lower average price points. MillerCoors generates $111 of net revenues per hl, roughly 15% lower than ABI US at $130 (Figure 11). As we showed before in this report, MillerCoors has around 85% of its portfolio in the light and economy segments versus ABI US at 65%. Furthermore, ABI US has 30% of its portfolio in the premium segment, whereas MillerCoors has only around 5%.
23 March 2017
US Beverages 8
Divergent Future PathsTop Line Growth Solidified for DPS Figure 12: P&L comparison dashboard
FY16A FY18E($ in millions, expect per share) DPS TAP DPS TAP
Revenue 6,440 10,983 7,112 10,930
Organic Growth 4% (1%) 5% 0%
Operating Margins 21.5% 15.8% 22.4% 17.7%
EPS Growth 9% 3% 16% 8%
Source: Company data, Credit Suisse.
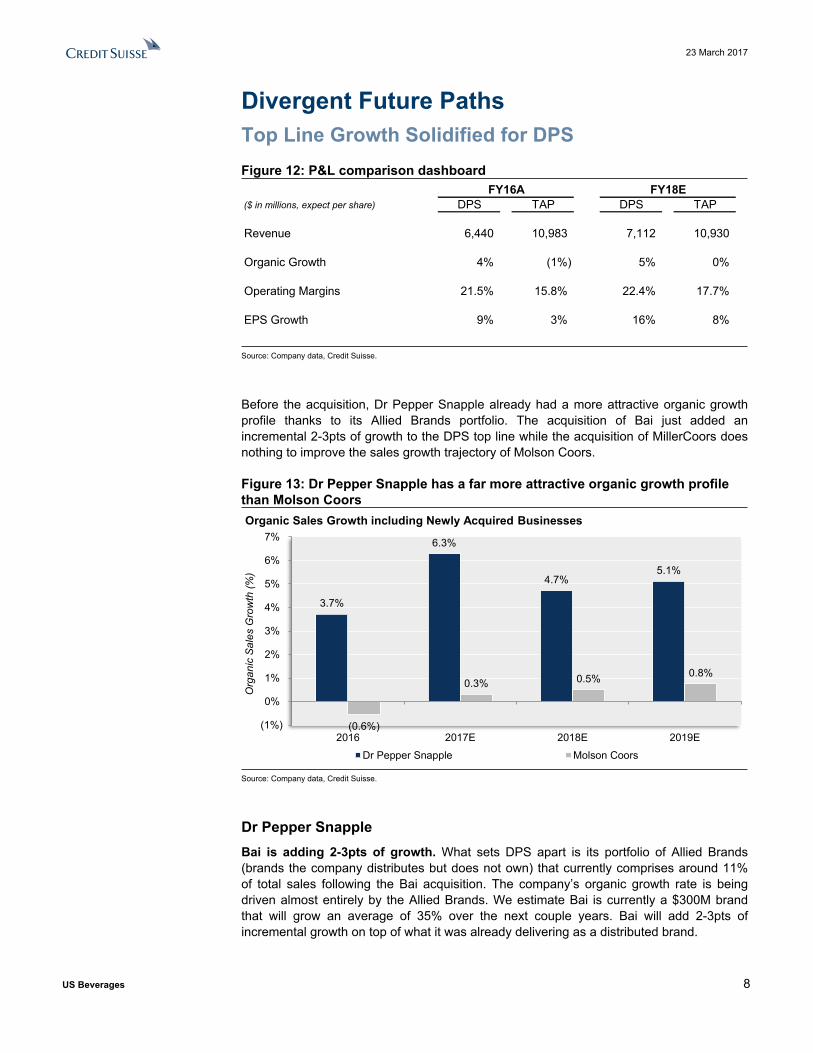
Before the acquisition, Dr Pepper Snapple already had a more attractive organic growth profile thanks to its Allied Brands portfolio. The acquisition of Bai just added an incremental 2-3pts of growth to the DPS top line while the acquisition of MillerCoors does nothing to improve the sales growth trajectory of Molson Coors.
Figure 13: Dr Pepper Snapple has a far more attractive organic growth profile than Molson Coors
3.7%
6.3%
4.7% 5.1%
(0.6%)
0.3% 0.5% 0.8%
(1%)
0%
1%
2%
3%
4%
5%
6%
7%
2016 2017E 2018E 2019E
Org
anic
Sal
es G
row
th (%
)
Organic Sales Growth including Newly Acquired Businesses
Dr Pepper Snapple Molson Coors
Source: Company data, Credit Suisse.
Dr Pepper SnappleBai is adding 2-3pts of growth. What sets DPS apart is its portfolio of Allied Brands (brands the company distributes but does not own) that currently comprises around 11% of total sales following the Bai acquisition. The company’s organic growth rate is being driven almost entirely by the Allied Brands. We estimate Bai is currently a $300M brand that will grow an average of 35% over the next couple years. Bai will add 2-3pts of incremental growth on top of what it was already delivering as a distributed brand.

23 March 2017
US Beverages 9
Meaningful international opportunities to advance Bai. While Bai still has meaningful runway in the US, we think it’s encouraging to hear management discussing the potential for international expansion. Recall that DPS does not own the rights to many of its brands outside the US and Mexico, so the optionality to take Bai abroad is positive. We suspect management would use markets that it knows well such as Mexico and Canada to conduct tests, but could later use those findings to expand in places like Western Europe and parts of developed Asia / Australia. It’s not clear who DPS would partner with for international distribution given it doesn’t have those capabilities abroad, but we figure many options exist like Suntory in Europe (owns Schweppes, which is a DPS sister brand) who doesn’t have the healthier portfolio that Bai could offer.
Molson CoorsUnfavorable category dynamics: Growth dynamics vary widely in the U.S. beer market. In general, we find that there is a positive relationship between premium pricing and higher growth, meaning that on average, economy beers (lower price) are stable to declining, while imports and craft beers (higher price) are growing the fastest. We think the underperformance of below-premium brands has been largely related to consumers trading up to craft and imports (especially Mexican import brands), with Millennials turning their backs on American light beers. We expect this trend will continue and forecast Light and Economy segment sales to be flat to down low-single digits over the coming few years. The US retail portfolio of the MillerCoors JV has been declining at a compound annual rate of 1% since 2012 while the beer category was growing at a 2% rate. The company underperformed the market in almost all segments over that time period, with the exception of the Light segment where it has had some recent success taking share from Bud Light. In the absence of any major portfolio shifts, we remain skeptical that the US business will hit its goal to grow volumes by 2019.
Blue Moon is a bright spot. Blue Moon was one of the original craft beers and has been a consistent performer in the US market, where nearly 50% of its volumes are sold on-premise. However, the craft beer segment has been slowing lately and Blue Moon, along with other larger craft brands such as Samuel Adams and Sierra Nevada, have been losing share of the segment. We like the decision the company made to incorporate Blue Moon into the core business, moving it out from under the Tenth & Blake innovation structure. Blue Moon is a $340M retail brand and we expect it can grow 2-3% through CY19.
Margin Gap Narrowing but DPS Still More ProfitableDr Pepper Snapple enjoys higher margins owing largely to the concentrate business; however, the gap with TAP is slowing narrowing as Molson Coors gains from the expected $550M of synergies / cost cutting. On the other hand, Bai is dilutive to the concentrate model but we generally see less downside risk to DPS margins over time. In our view, there is a higher degree of risk for Molson Coors’ margin as the company may need to invest more of the savings to sustain volumes and avoid the risk of deleveraging the cost structure.

23 March 2017
US Beverages 10
Figure 14: DPS is more profitable than TAP but the gap is narrowing slowly
21.5% 21.0% 22.4% 22.5%
15.8% 16.8%
17.7% 18.6%
5%
10%
15%
20%
25%
2016 2017E 2018E 2019E
Ope
ratin
g M
argi
ns (%
)
Operating Margins
Dr Pepper Snapple Molson Coors
Source: Company data, Credit Suisse estimates
Dr Pepper SnappleHigh-margin concentrate model. The company enjoys 21-22% consolidated operating margins owing to the ~65% margins of the concentrate business (20% of sales). This compares to the average Packaged Beverage margin of 17% that is weighed down by the Allied Brands (structurally lower around ~13% by our estimate). In addition, we estimate the Dr Pepper brand makes up around 80% of the Concentrate segment and 30% of the Packaged Beverages segment, generating just over $1B of operating profit, or more than 80% of the total company operating profit.
Bai adding margins to packaged goods segment. In addition, a major advantage of Bai is that it helps absorb much of the volume deleverage for the declining portion of Packaged Beverage segment. Together with the Allied Brands this creates an estimated halo-effect that has boosted the segment margins above those of PepsiCo beverage. – we estimate that in the absence of the Allied Brands (all else equal) that margins are ~400 bps higher than they would be otherwise.
Molson CoorsStructurally lower margins than benchmark. As we explained earlier, the relatively lower operating margin is due in less part to a disadvantaged cost structure, but rather to the lower price point of the US portfolio owing to its large exposure to the domestic Light and Economy beer segments. We think that there is minimal upside unless the company undertakes more aggressive efforts to premiumize its US portfolio. Our analysis suggests that if Molson Coors were to realize all the synergies and cost cutting (assuming no reinvestment), the operating margin gap with ABI in the US would only narrow to 10pts from 17pts currently which seems very unlikely. In our model, we assume that roughly 60% of synergies / cost cutting will be reinvested in SG&A initiatives to sustain and grow the business.
Margin downside risk. We see two primary risks to the margins. The first is that ABI is losing share in the US (Bud Light) and we expect ABI will become more competitive to protect that share. This poses a significant risk to Molson Coors because it will need to reinvest much of the savings in order to remain competitive with Coors Light and Miller Lite. The second is that if volumes continue to decline, there is meaningful deleverage to

23 March 2017
US Beverages 11
the fixed cost structure. This means that the company may need to eventually close additional facilities (recently closed brewery in Eden, NC) to reduce the overhead expense. In addition, currently around 10% of US volumes are associated with contract manufacturing for Pabst. These volumes are lower priced and lower margin than the core US portfolio, but it helps absorb capacity. The current contract effectively extends through 2022, but could potentially be at risk beyond that.
Stronger Business Algorithm for DPS Reflected in EPS GrowthDr Pepper SnappleStrong and stable financial algorithm. We are modeling a 10% EPS CAGR through FY19, which is a very respectable earnings growth rate for any staples company. Our financial algorithm of 5-7-10 (sales, operating profit, EPS) over the next three years is driven by the strong sales growth potential, operating leverage from higher volumes, fixed cost absorption from the Allied Brands, consistent debt repayment, and continued share repurchases.
Molson CoorsEPS growth driven by cost savings. We are modeling a 6% EPS CAGR through FY19. With sales flat over the same period, the earnings growth is being driven entirely by deal synergies and cost savings almost entirely in the US business. However, once the savings come through it will become increasingly more difficult for the company to maintain that algorithm in the absence of sales growth.
Both Companies Generate Strong Free Cash, but DPS Uses It in a More Shareholder-Friendly MannerFigure 15: Balance sheet and cash flow comparison dashboard
FY16A FY18E($ in millions, expect per share) DPS TAP DPS TAP
Cash Flow 759 823 1,034 1,311
CapEx (% of sales) 2.8% 3.1% 1 2.8% 6.5%
ROIC 13.4% 5.1% 13.1% 5.4%
Leverage (post-acquisition) 2.7x 4.8x 2.1x 3.7x
FCF / Interest 5.8x 2.2x 6.7x 3.7x
Buybacks and Dividends 905 353 855 355
Source: Company data, Credit Suisse.1. TAP did not have to support JV capex – 6-8% of sales is the average capex spend for brewers
Dr Pepper Snapple has more manageable leverage but Molson Coors generates more cash, albeit on a larger revenue base. The difference is Molson Coors needs to divert

23 March 2017
US Beverages 12
most of the free cash flow to pay down debt over the coming years, whereas DPS will distribute it to shareholders. We think this represents a lower risk to equity holders.
Figure 16: We expect DPS to allocate more than 80% of its cash outlay to shareholders
Figure 17: Conversely, we expect DPS to allocate more nearly 60% of its cash outlay to delevering
Delever19%
Divs38%
Share Repo43%
DPS Cash Allocation FY17-19
Delever58%
Divs42%
TAP Cash Allocation FY17-19
Source: Company data, Credit Suisse estimates Source: Company data, Credit Suisse estimates
Figure 18: We expect DPS to de-lever to around 2x and TAP to 3.7x by the end of 2018
Figure 19: DPS pays out around 100% of FCF to shareholders where TAP pays only around 30%
2.7x
2.1x
4.8x
3.7x
0x
1x
2x
3x
4x
5x
FY16A FY18E
Net
Deb
t to
EB
ITD
A (x
)
Leverage
Dr Pepper Snapple Molson Coors
10%
30%
50%
70%
90%
110%
130%
2016 2017 2018 2019
Sha
reho
lder
Ret
urns
/ FC
F (%
)
Shareholder Return as a Percent of Free Cash
Dr Pepper Snapple Molson Coors
Source: Company data, Credit Suisse estimates Source: Company data, Credit Suisse estimates
Dr Pepper Snapple■ Dr Pepper brand delivering the cash. We estimate that the Dr Pepper brand
generates around 70% of the total free cash flow with its strong operating margins. In addition, with an estimated 80% of volumes coming from the on-premise channel, Dr Pepper is a stable and consistent business. This provides plenty of cash to drive growth in the remainder of the business and return to shareholders.

23 March 2017
US Beverages 13
■ Net debt to EBITDA down to nearly 2x by 2018. We expect it to decline to nearly 2x by FY18 driven primarily by EBITDA growth (we assume $50M / $300M of debt repayment in FY17 / FY18). This seems manageable given our expectation for roughly $850M of free cash flow generation this year. In addition, this provides plenty of balance sheet flexibility should management decide to make additional tack-on acquisitions.
■ Shareholder friendly approach. Since 2013, the company has allocated around 80% of its capital outlay to share repurchases and dividends. The company raised its dividend at the beginning of FY16 and recently announced another 9% increase. We also expect more than $500M of share repurchases in FY17 (following $500M in FY16). Over the coming three years, we expect DPS to return around 100% of its free cash to shareholders.
Molson Coors■ Strong free cash generation despite high capex requirements. We are modeling
free cash flow of $1.1B and $1.3B in FY17 and FY18, respectively, in-line with company guidance. This also includes $275M of annual transaction cash tax benefits. We expect Molson Coors to spend $750M of capex in FY18, or 6.5% of sales (compared to DPS at less than 3%). Beer brewers in general tend to have higher capex requirements as a percent of sales – on average, ABI at 9%, Heineken at 7%, Carlsberg at 7%, and Boston Beer at 7%.
■ Net debt to EBITDA down to 3.7x by 2018. The company raised more than $9B of debt to fund the acquisition of MillerCoors. This has left it with a significant debt burden that will require attention over the coming years. Our model assumes $250M / $600M / $600M of repayments in FY17 / FY18 / FY19 (given the company has shifted the cash allocation priority to deleveraging) and we expect net debt to EBITDA to decline from 4.8x today to ~3.0x by the end of FY19. The company has suspended share buybacks and froze the dividend at $0.41 per share (or ~$350M per year) so we see some marginal upside to our deleveraging assumptions if the company can continue to deliver free cash in excess of $1B.
■ Volume declines are a risk to cash flow. This might sound like an obvious point but given the bull thesis is largely focused on the cash generation, it’s an important consideration. Our math suggests that, all else equal and assuming no cost savings, an annual volume decline of 1% over the next three years could reduce the US operating margin by ~50 bps which could impact FCF by around $50-75M per year versus our base model (revised down from our previous estimate due to change in our fixed cost assumption).

23 March 2017
US Beverages 14
Relative Valuation ComparisonRaising target price for DPS. We are raising our target price on DPS to $111 assuming a 21x PE. We think the stock now merits a higher multiple because the company has secured its most promising Allied Brand, which adds incremental growth of 2-3% and marginally reduces the risk associated with not controlling those brands. In addition, the company still generates nearly $1B of cash driven by its portfolio crown-jewel, Dr Pepper.
Pricing TAP in-line with historical average. Our 17x PE (on core earnings, before transaction cash tax benefit) is in-line with how the stock has traded over the past two years (adjusted for acquisition noise). We think this is fair because, as we’ve outlined herein, we don’t think the acquisition changes the fundamental trajectory of the business. We think this valuation gives fair value to the expected future cash flows while acknowledging the higher degree of risk associated with a challenged top line environment and an increasing competitive landscape in US mainstream beer. Our $106 target price (unchanged) incorporates the $11 present value of the transaction cash tax benefit on top of the core value (17x our CY18 EPS).
Figure 20: Our DPS $111 target price is supported by a combination of valuation methodologies
Figure 21: Our TAP $106 target price is supported by a combination of valuation methodologies
100 105 110 115 120 125 130
EV / EBITDA
PE
SOTP
DCF
Price per share ($)
CS Valuation Methodologies for DPS
CS Target Price
20x 22x
13.0x 15.0x
90 95 100 105 110 115 120 125 130
EV / EBITDA*
PE*
SOTP
DCF
Price per share ($)
CS Valuation Methodologies for TAP
CS Target Price
16x 19x
11.5x 12.5x
Source: Company data, Credit Suisse estimates Source: Company data, Credit Suisse estimatesNote: All valuations shown include the present value of the transaction cash tax benefit, which amounts to $2.4B, or $11 per share (2 turns to PE and 1 turn of EV / EBITDA)* Multiples shown reflect the value of the core operations; total value includes cash tax benefit
Assumptions:Dr Pepper Snapple■ DCF: Assumes cash flow projections from our model in FY17-19 with a 9-12% FCF
growth rate for the next 7 years (through year 10); then assumes a 2% growth rate in perpetuity at an 8% WACC.
■ SOTP: The low end assumes Dr Pepper brand gets a 15x EBITDA multiple and the Owned Brands get 10x (parity with Allied Brands). The high end assumes the Dr Pepper brand gets a 17x EBITDA multiple and the Owned Brands get 12x (premium to Allied Brands).
■ PE: Assumes a 20-22x range on our CY18 EPS. The low end assumes the bottom of the beverage trading range and the high end is still a discount to KO.

23 March 2017
US Beverages 15
■ EV / EBITDA: Assumes a 13-15x range on our CY18 EBITDA. The low end assumes the bottom of the beverage trading range and the high end is still a discount to KO.
Molson Coors■ DCF: Assumes cash flow projections from our model in FY17-19 with a 9-11% FCF
growth rate for the next 7 years (through year 10); then assumes a 2% growth rate in perpetuity at an 8% WACC – inclusive of the transaction cash tax benefit.
■ SOTP: The low end assumes the US business gets an 11.5x EBITDA multiple (15% premium to SAM) and 11x in Canada (parity with US). The high end assumes the US business gets a 14x EBITDA multiple and 12x in Canada.
■ PE: Assumes a 16-19x range on the earnings power of the core operations plus the $11 value of the transaction cash tax benefit. The business has historically traded at an average of 17x but the bull case suggests that the stability of cash flows merits a higher multiple so we stretch the high end to 19x.
■ EV / EBITDA: Assumes an 11.5-12.5x range on the earnings power of the core operations plus the $11 value of the transaction cash tax benefit. This is broadly in-line with ABI and a premium to Heineken and Carlsberg (European staples tend to trade a discount to the US).

23 March 2017
US Beverages 16
HOLT® Supports Our View that DPS Screens More Favorably than TAPWe have used HOLT to assess the impact on value creation of DPS and TAP's respective acquisitions, quantify what's priced into current stock prices, and run HOLT DCF valuation based on our forecasts. Our takeaways are:
■ Both acquisitions (Bai and MillerCoors) are accretive to CFROI and economic profit
■ Market-implied expectations embedded in current prices look relatively demanding for TAP and conservative for DPS
■ HOLT valuation based on our projections indicates ~33% downside for TAP and ~26% upside for DPS
HOLT is a Credit Suisse proprietary framework that measures companies' performance using Cash Flow Return on Investment (CFROI®): an adjusted return on capital metric that removes accounting and inflation distortions to allow for global comparability across sectors, regions and time.
Assessing the Impact of the Acquisitions on Profitability and Economic Value Creation Both acquisitions (Bai and MillerCoors) have been accretive to returns on capital:
■ Bai's acquisition is expected to have a small negative impact on margins, offset by a material improvement in asset efficiency, which should drive returns for DPS up from 21% in 2016 to 28% in 2017
■ The consolidation of MillerCoors led to an increase in both margins and asset efficiency for TAP, resulting in a sharp increase in returns on capital from 15% in 2015 to 21% in 2016

23 March 2017
US Beverages 17
Figure 22: Impact of acquisitions on returns on capital and drivers
Source: HOLT.
0.871.10 0.96 0.91
0.0
0.5
1.0
1.5
2.0
2015 2016 2017 2018
Sales / Invested capital CS Analyst projections
17 1724 25
0
10
20
30
2015 2016 2017 2018Historical EBITDA margins CS Analyst Projections
1521 19 18
0
10
20
30
40
2015Historical CFROI CS Analyst Projections
DPS TAP
Pre-acquisition Post-acquisition Pre-acquisition Post-acquisition
24 25 24 26
0
10
20
30
2015 2016 2017 2018Historical EBITDA margins CS Analyst Projections
24 2128 32
0
10
20
30
40
2015 2016 2017 2018Historical CFROI CS Analyst Projections
1.341.14
1.55 1.65
0.0
0.5
1.0
1.5
2.0
2015 2016 2017 2018Sales / Invested capital CS Analyst Projections
EBITDA Margin (%)
Asset Efficiency (Sales/ Invested capital)
Returns on capital - CFROI (%)
Source: Credit Suisse HOLT®. Note: DPS's forecasts are based on analysts' projections to fully capture the impact of Bai's acquisition that closed in 2017. TAP also based on analyst forecasts for consistency purposes.
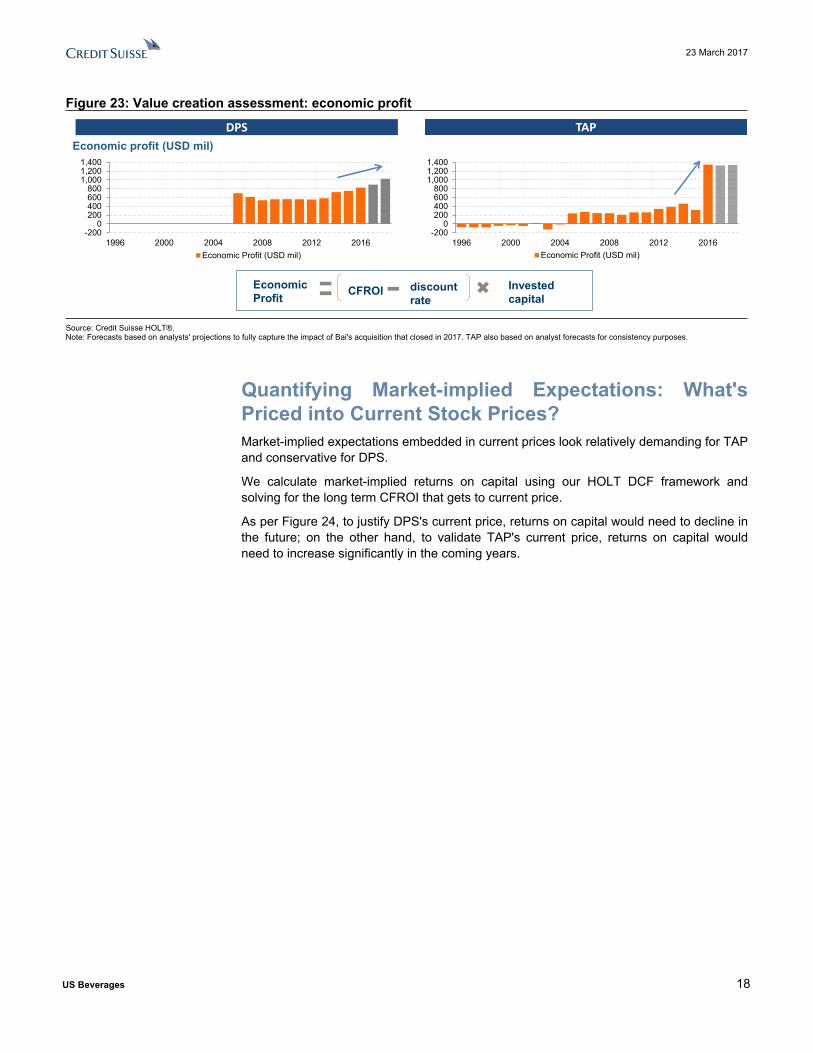
Positive return on capital spread (above cost of capital) in conjunction with growth in invested capital results in value creation. Economic profit incorporates the asset growth component and measures the value creation in excess of the cost of capital; it is calculated as (CFROI – discount rate) x Invested capital.
As shown in Figure 23, both acquisitions have led to an increase in economic profit.
23 March 2017
US Beverages 18
Figure 23: Value creation assessment: economic profit
-2000
200400600800
1,0001,2001,400
1996 2000 2004 2008 2012 2016Economic Profit (USD mil)
-2000
200400600800
1,0001,2001,400
1996 2000 2004 2008 2012 2016Economic Profit (USD mil)
Economic profit (USD mil)DPS TAP
Economic Profit CFROI discount
rateInvested capital
Source: Credit Suisse HOLT®. Note: Forecasts based on analysts' projections to fully capture the impact of Bai's acquisition that closed in 2017. TAP also based on analyst forecasts for consistency purposes.
Quantifying Market-implied Expectations: What's Priced into Current Stock Prices?Market-implied expectations embedded in current prices look relatively demanding for TAP and conservative for DPS.
We calculate market-implied returns on capital using our HOLT DCF framework and solving for the long term CFROI that gets to current price.
As per Figure 24, to justify DPS's current price, returns on capital would need to decline in the future; on the other hand, to validate TAP's current price, returns on capital would need to increase significantly in the coming years.

23 March 2017
US Beverages 19
Figure 24: Market-implied returns on capital (CFROI)
0
10
20
30
1996 2000 2004 2008 2012 2016 2020 2024Historical CFROI CS Analyst ProjectionsDiscount rate Historical medianMarket Implied CFROI (HOLT Default)
0
10
20
30
1996 2000 2004 2008 2012 2016 2020 2024Historical CFROI CS Analyst ProjectionsDiscount rate Historical medianMarket Implied CFROI (HOLT Default)
Returns on capital (CFROI) & Discount Rate (%)
DPS
TAP
Market-implied CFROI (green dot) indicates the future level of returns
priced into today’s stock price
DPS’s market-implied returns are very low, indicating material upside
potential
TAP’s market-implied returns are high relative to history and near term forecasts, indicating rich
valuation
Source: Credit Suisse HOLT®. Note: Forecast shown is based on analysts' projections to fully capture the impact of Bai's acquisition that closed in 2017. TAP also based on analyst forecasts for consistency purposes. Market-implied CFROI is based on HOLT default.
Quantifying the Warranted Value Using HOLT DCF and Research ForecastsHOLT valuation based on our projections indicates ~33% downside for TAP and ~26% upside for DPS. We have linked our projections to the HOLT valuation model, to quantify the implied returns on capital and warranted value based on HOLT DCF.
Dr Pepper SnappleCFROI® (chart at the top of Figure 25), is forecasted to improve from 28% in 2017 to 34% by 2019, mainly driven by improvement in asset efficiency.
Based on our projections and long term estimates, HOLT DCF indicates a warranted price of $122 per share, 26% upside to the current market price.

23 March 2017
US Beverages 20
Figure 25: CS Research forecasts for DPS through HOLT – operating projections and warranted value
Current Price: USD 96.58 Warranted Price: USD 121.64 Valuation date: 22-Mar-17
HOLT perspective of operating projections implied by Research forecast
Warranted upside/downside sensitivity to growth and marginsLong term sales growth
USD 1% 3% 5% 7% 9%Summary of CS Research projections and key operating drivers
Dec 15A Dec 16A Dec 17E Dec 18E Dec 19ESales Growth, % 2.6 2.5 5.3 4.9 5.3
EBITDA Mgn, % 24.0 25.4 24.4 25.7 25.6Asset Turns, x 1.34 1.1 1.5 1.6 1.8
CFROI®, % 23.6 21.0 28.2 31.9 34.1Disc Rate, % 3.9 3.6 3.4 3.4 3.4Asset Grth, % 11.9 19.7 -24.0 -3.9 -3.8
Value/Cost, x 6.8 5.3 10.0 10.1 10.1Economic PE, x 28.6 25.1 35.4 31.8 29.6Leverage, % 20.1 23.1 24.2 23.8 21.3
HO
LT
- C
redi
t Sui
sse
Ana
lyst
Sce
nario
Dat
a
DR PEPPER SNAPPLE GROUP INC (DPS)
Long
term
EB
ITD
A m
argi
ns
22% 39.76 58.62 84.85 121.43
234.83
172.98
24% 51.38 73.17 103.29 145.17 203.98
26% 62.94 87.64 121.64 168.79
296.37
28% 74.47 102.06 139.93 192.34 265.62
30% 85.99 116.46 158.19 215.87
For display purposes, these charts have been capped as follows. CFROI levels are kept within 0% and 15%.
More than 10%
downsideWithin 10% More than
10% upside
Source: Credit Suisse HOLT®. CFROI and HOLTare trademarks or registered trademarks of Credit Suisse Group AG or its affiliates in the United States and other countries.
0
5
10
15
20
25
30
35
40
2012 2014 2016 2018 2020 2022 2024 2026Historical Forecast based on Research projection
Long term projection Discount Rate
CFROI & Discount Rate (in %)
0
5
10
15
20
25
30
2012 2014 2016 2018 2020 2022 2024 2026Historical Forecast based on Research projection Long term projection
EBITDA Margin (in %)
0
1
2
3
4
5
6
2012 2014 2016 2018 2020 2022 2024 2026Historical Forecast based on Research projection Long term projection
Sales Growth (in %)
0.0
0.5
1.0
1.5
2.0
2012 2014 2016 2018 2020 2022 2024 2026Historical Forecast based on Research projection Long term projection
Asset Turns (x)
-30-25-20-15-10
-505
10152025
2012 2014 2016 2018 2020 2022 2024 2026
Historical Forecast based on Research projection Long term projection
Asset growth (inflation adjusted, in %)
Source: Credit Suisse HOLT®. Note: Valuation uses 10 years explicit forecast. After this period, returns on capital and growth fade slowly to reach cost of capital and GDP growth respectively. Given DPS' strong track record of sustainability of returns (DPS qualifies as SuperEcap in HOLT), we have modified the fade rate from 10% to 5% annually.
Molson CoorsCFROI® (chart at the top of Figure 26), is forecasted to decline from 21% in 2016 to 18% by 2019, driven by a material decline in asset efficiency that offsets our forecasted margin improvement.
Based on our projections and long term estimates, HOLT DCF indicates a warranted price of $65 per share, 33% downside to the current market price.

23 March 2017
US Beverages 21
Figure 26: CS Research forecasts for TAP through HOLT – operating projections and warranted value
Current Price: USD 98.03 Warranted Price: USD 65.53 Valuation date: 22-Mar-17
HOLT perspective of operating projections implied by Research forecast
Warranted upside/downside sensitivity to growth and marginsLong term sales growth
USD -3% -1% 1% 3% 5%Summary of CS Research projections and key operating drivers
Dec 15A Dec 16A Dec 17E Dec 18E Dec 19ESales Growth, % -14.0 207.9 -0.9 0.4 0.7
EBITDA Mgn, % 16.4 17.4 23.9 24.6 25.6Asset Turns, x 0.87 1.1 1.0 0.9 0.9
CFROI®, % 14.5 21.2 19.2 18.4 17.9Disc Rate, % 3.7 4.5 4.3 4.3 4.3Asset Grth, % -10.2 139.4 11.8 3.6 4.4
Value/Cost, x 4.3 6.4 3.9 3.6 3.3Economic PE, x 29.4 30.3 20.5 19.7 18.6Leverage, % 17.7 37.3 36.3 35.2 34.0
HO
LT
- C
redi
t Sui
sse
Ana
lyst
Sce
nario
Dat
a
MOLSON COORS BREWING CO (TAP)
Long
term
EB
ITD
A m
argi
ns
22% 10.33 22.52 39.06 61.51
133.35
92.13
24% 18.90 33.16 52.26 77.94 112.75
26% 27.69 43.95 65.53 94.38
174.53
28% 36.64 54.83 78.84 110.85 153.93
30% 45.68 65.77 92.19 127.32
More than 10%
downsideWithin 10% More than
10% upside
Source: Credit Suisse HOLT®
Source: Credit Suisse HOLT®. CFROI and HOLTare trademarks or registered trademarks of Credit Suisse Group AG or its affiliates in the United States and other countries.
0
5
10
15
20
25
2012 2014 2016 2018 2020 2022 2024 2026Historical Forecast based on Research projection
Long term projection Discount Rate
CFROI & Discount Rate (in %)
0
5
10
15
20
25
30
2012 2014 2016 2018 2020 2022 2024 2026Historical Forecast based on Research projection Long term projection
EBITDA Margin (in %)
-15
-5
5
15
25
35
2012 2014 2016 2018 2020 2022 2024 2026Historical Forecast based on Research projection Long term projection
Sales Growth (in %)
0.0
0.2
0.4
0.6
0.8
1.0
1.2
2012 2014 2016 2018 2020 2022 2024 2026Historical Forecast based on Research projection Long term projection
Asset Turns (x)
-20
-10
0
10
20
30
40
2012 2014 2016 2018 2020 2022 2024 2026
Historical Forecast based on Research projection Long term projection
Asset growth (inflation adjusted, in %)
Source: Credit Suisse HOLT®. Note: Valuation uses 10 years explicit forecast. After this period, returns on capital and growth fade slowly to reach cost of capital and GDP growth respectively. For comparison with DPS, we have also adjusted the FadeGiven DPS' strong track record of sustainability of returns (DPS qualifies as SuperEcap in HOLT), we have modified the fade rate from 10% to 5% annually.

23 March 2017
US Beverages 22
Americas/United StatesSoft Drinks
Dr Pepper Snapple Group (DPS)Rating OUTPERFORMPrice (22-Mar-17, US$) 96.98Target price (US$) (from 105.00) 111.0052-week price range (US$) 98.51 - 82.38Market cap (US$ m) 17,756Target price is for 12 months.
Research Analysts
Laurent Grandet212 538 7901
Clay Crumbliss, CFA212 538 1076
Raising Target Price to $111We are raising our target price on DPS to $111 assuming a 21x PE. We think the stock now merits a higher multiple because the company has secured its most promising Allied Brand, which adds incremental growth of 2-3% and marginally reduces the risk associated with not controlling those brands. In addition to better growth prospects, the company still generates nearly $1B of cash driven by its portfolio crown-jewel, Dr Pepper.
A key risk to our target price and Outperform rating is the unexpected loss of, or material growth deceleration for, an Allied Brand.
Share price performance
D PS.N S& P 5 0 0 IN D EX
A p r - 1 6 Ju l - 1 6 O ct - 1 6 Jan - 1 78 0
9 0
1 0 0
1 1 0
On 22-Mar-2017 the S&P 500 INDEX closed at 2348.44Daily Mar22, 2016 - Mar22, 2017, 03/22/16 = US$89.37
Quarterly EPS Q1 Q2 Q3 Q42016A 0.94 1.25 1.17 1.042017E 0.99 1.22 1.19 1.152018E 1.16 1.40 1.34 1.40
Financial and valuation metricsYear 12/16A 12/17E 12/18E 12/19EEPS (CS adj.) (US$) 4.39 4.54 5.28 5.77Prev. EPS (US$) - - - -P/E (x) 22.1 21.4 18.4 16.8Revenue (US$ m) 6,440.0 6,780.4 7,112.4 7,486.6EBITDA (US$ m) 1,608 1,655 1,829 1,919EV/EBITDA (current) 12.7 12.4 11.2 10.7FCF yield (%) 4.2 4.9 6.0 6.3Net debt (US$ m) 2,691 4,031 3,852 3,720ROIC (%) 19 15 17 18
Number of shares (m) 183 IC (current, US$ m) 4,825EV/IC (x) 3.6 Net debt (Next Qtr., US$ m) 4,020.1Dividend (current, US$) 2.27 Net debt/EBITDA (12/16A) 1.7Dividend yield (%) 2.19BV/share (Next Qtr., US$) 11.5Source: Company data, Thomson Reuters, Credit Suisse estimates

23 March 2017
US Beverages 23
AppendixValuation Exhibits
Figure 27: DCF for Dr Pepper Snapple($MM) 2017 2018 2019 2020 2021 2022 2023 2024 2025 2026 TV
FCF 866 1,034 1,059 1,165 1,282 1,410 1,551 1,706 1,877 2,064 35,091Growth 19% 2% 10% 10% 10% 10% 10% 10% 10% 2%PV of FCF 801 887 841 856 872 888 905 922 939 956 16,254
Enterprise Value 25,122Less: Net Debt 4,031Equity value 21,091
per share $113
Source: Company data, Credit Suisse estimates
Figure 28: DCF for Molson Coors ($MM) 2017 2018 2019 2020 2021 2022 2023 2024 2025 2026 TV
FCF 1,093 1,311 1,474 1,621 1,783 1,961 2,157 2,373 2,610 2,871 48,815Growth 20% 12% 10% 10% 10% 10% 10% 10% 10% 2%PV of FCF 1,012 1,124 1,170 1,191 1,213 1,236 1,259 1,282 1,306 1,330 22,611
Enterprise Value 34,734Less: Net Debt 11,512Equity value 23,223
per share $107
Source: Company data, Credit Suisse estimates
Figure 29: Sum of the Parts for Dr Pepper Snapple
Sum of the Parts CS FY18E ValueTotal Segment
($ in millions) Sales ($) EBITDA ($) Margin (%) EBITDA (x) Ent V ($) Notes
Dr Pepper brand 2,584 1,163 45% 16.0x 18,602 Blend concentrate (80%) and packaged (20%)Concentrates (ex DP) 265 158 60% 18.0x 2,849 Concentrate multiple discount to KOPackaged Bevs (ex DP) 3,821 667 17% 10.8x 7,224
Owned Brands 3,019 554 18% 11.0x 6,097 Premium to average bottler multipleAllied Brands 802 113 14% 10.0x 1,127 Average bottler multiple
LatAm 426 111 26% 10.0x 1,107Corporate 0 (278) NA 14.0x (3,891) Segment average
Total 7,095 1,821 26% 14.2x 25,890
Less: Current Net Debt 4,031 Post-Bai acquisitionTotal Equity Value 21,859
Current Shares 186Value per Share 1 $117
Source: Company data, Credit Suisse estimates

23 March 2017
US Beverages 24
Figure 30: Sum of the Parts for Molson Coors
Sum of the Parts CS FY18E Value
($ in millions) Sales ($) EBITDA ($) Margin (%) EBITDA (x) Ent V ($) Notes
MillerCoors (US) 7,673 1,833 24% 12.5x 22,909 Prem to SAM; disc to STZ beerCanada 1,414 469 33% 11.5x 5,399 Disc to US segmentEurope 1,705 467 27% 10.0x 4,675 In-line with Heineken; Prem to CarlsbergInternational 179 1 1% 10.0x 9 In-line with Heineken; Prem to CarlsbergCorporate (40) (86) 216% 11.0x (948) Average of segments
Total 10,930 2,684 25% 11.9x 32,044
Plus: PV of Tax Benefit 2,418
Less: Current Net Debt 11,512Total Equity Value 22,950
Current Shares 216Value per Share 1 $106
Source: Company data, Credit Suisse estimates
TAP Valuation BreakdownThe core value of the operations: a 17x PE on our CY18 CS-Adjusted EPS of $5.54.
The transaction tax benefit: a net present value of $2.4B, or $11 per share assuming a 15 year horizon and an 8% WACC.
Figure 31: We apply a 17x multiple on our CY18 CS-Adj EPS to derive our core valuation
Trading Price Tax Benefit Ex Tax NPVCurrent Valuation
Stock Price $98 $11 $87NTM CS-Adj EPS $5.15
Multiple 16.9x
Target Price Tax Benefit Ex Tax NPVForward Valuation
Target Price $106 $11 $94CY18 CS-Adj EPS $5.54
Multiple 17.0x
Source: Credit Suisse estimates
For the current $11 value of the cash tax benefit, we simply conduct a DCF analysis on the $276M annual benefit over the next 15 years at an 8% WACC. This is in-line with management's stated net present value of $2.4B.
In Figure 32 we show that, all else equal, over time the value of shares (represented by the "target price") will revert to the value of the core operations ("core value") as the value of the tax benefit decays. In other words, the cash tax benefit is temporary and incremental to the value of the company over the 15-year lifespan.

23 March 2017
US Beverages 25
Figure 32: TAP hypothetical valuation over time assuming no multiple expansion or earnings growth as the value of the cash tax benefit decays
0
2
4
6
8
10
12
90
95
100
105
110
1 2 3 4 5 6 7 8 9 10 11 12 13 14 15 16
Pric
e pe
r Sha
re ($
)
Pric
e pe
r sha
re ($
)
TAP Valuation per Share Horizon
Target Price [Left] Core Value [Left] Tax Benefit [Right]
Source: Credit Suisse estimates

23 March 2017
US Beverages 26
Companies Mentioned (Price as of 22-Mar-2017)Anheuser-Busch InBev (ABI.BR, €102.8)Boston Beer Co. Inc. (SAM.N, $149.3)Carlsberg (CARLb.CO, Dkr617.0)Constellation Brands Inc. (STZ.N, $164.2)Dr Pepper Snapple Group (DPS.N, $96.98, OUTPERFORM, TP $111.0)Heineken (HEIN.AS, €79.38)Molson Coors Brewing Co (TAP.N, $97.51, NEUTRAL, TP $106.0)PepsiCo, Inc. (PEP.N, $112.02)Suntory Beverage & Food (2587.T, ¥4,675)The Coca-Cola Company (KO.N, $42.38)
Disclosure AppendixAnalyst Certification I, Laurent Grandet, certify that (1) the views expressed in this report accurately reflect my personal views about all of the subject companies and securities and (2) no part of my compensation was, is or will be directly or indirectly related to the specific recommendations or views expressed in this report.
3-Year Price and Rating History for Dr Pepper Snapple Group (DPS.N)
DPS.N Closing Price Target Price Date (US$) (US$) Rating 23-Apr-14 54.48 58.00 N 24-Jul-14 60.98 62.00 23-Oct-14 66.95 68.00 12-Feb-15 78.30 80.00 14-May-15 77.66 NR 15-Sep-16 90.22 108.00 O * 22-Nov-16 87.50 R 01-Feb-17 90.41 108.00 O 08-Feb-17 92.78 105.00 * Asterisk signifies initiation or assumption of coverage.
Target Price Closing Price DPS.N
01- Jan- 2015 01- Jan- 2016 01- Jan- 201750
70
90
110
N EU T RA LN O T RA T ED
O U T PERFO RMREST RIC T ED
3-Year Price and Rating History for Molson Coors Brewing Co (TAP.N)
TAP.N Closing Price Target Price Date (US$) (US$) Rating 14-Aug-14 74.90 84.00 O * 10-Feb-15 73.21 80.00 14-May-15 75.05 NR 23-Jan-17 96.19 106.00 N * * Asterisk signifies initiation or assumption of coverage.
Target Price Closing Price TAP.N
01- Jan- 2015 01- Jan- 2016 01- Jan- 201760
80
100
120
O U T PERFO RMN O T RA T ED
N EU T RA L
The analyst(s) responsible for preparing this research report received Compensation that is based upon various factors including Credit Suisse's total revenues, a portion of which are generated by Credit Suisse's investment banking activitiesAs of December 10, 2012 Analysts’ stock rating are defined as follows:Outperform (O) : The stock’s total return is expected to outperform the relevant benchmark* over the next 12 months.Neutral (N) : The stock’s total return is expected to be in line with the relevant benchmark* over the next 12 months.Underperform (U) : The stock’s total return is expected to underperform the relevant benchmark* over the next 12 months. *Relevant benchmark by region: As of 10th December 2012, Japanese ratings are based on a stock’s total return relative to the analyst's coverage universe which consists of all companies covered by the analyst within the relevant sector, with Outperforms representing the most attractive, Neutrals the less attractive, and Underperforms the least attractive investment opportunities. As of 2nd October 2012, U.S. and Canadian as well as European ratings are based on a stock’s total return relative to the analyst's coverage universe which consists of all companies covered by the analyst within the relevant sector, with Outperforms representing the most attractive, Neutrals the less attractive, and Underperforms the least attractive investment opportunities. For Latin American and non-Japan Asia stocks, ratings are based on a stock’s total return relative to the average total return of the relevant country or regional benchmark; prior to 2nd October 2012 U.S. and Canadian ratings were based on (1) a stock’s absolute total return potential to its current share price and (2) the relative attractiveness of a stock’s total return potential within

23 March 2017
US Beverages 27
an analyst’s coverage universe. For Australian and New Zealand stocks, the expected total return (ETR) calculation includes 12-month rolling dividend yield. An Outperform rating is assigned where an ETR is greater than or equal to 7.5%; Underperform where an ETR less than or equal to 5%. A Neutral may be assigned where the ETR is between -5% and 15%. The overlapping rating range allows analysts to assign a rating that puts ETR in the context of associated risks. Prior to 18 May 2015, ETR ranges for Outperform and Underperform ratings did not overlap with Neutral thresholds between 15% and 7.5%, which was in operation from 7 July 2011.Restricted (R) : In certain circumstances, Credit Suisse policy and/or applicable law and regulations preclude certain types of communications, including an investment recommendation, during the course of Credit Suisse's engagement in an investment banking transaction and in certain other circumstances.Not Rated (NR) : Credit Suisse Equity Research does not have an investment rating or view on the stock or any other securities related to the company at this time.Not Covered (NC) : Credit Suisse Equity Research does not provide ongoing coverage of the company or offer an investment rating or investment view on the equity security of the company or related products.Volatility Indicator [V] : A stock is defined as volatile if the stock price has moved up or down by 20% or more in a month in at least 8 of the past 24 months or the analyst expects significant volatility going forward.Analysts’ sector weightings are distinct from analysts’ stock ratings and are based on the analyst’s expectations for the fundamentals and/or valuation of the sector* relative to the group’s historic fundamentals and/or valuation:Overweight : The analyst’s expectation for the sector’s fundamentals and/or valuation is favorable over the next 12 months.Market Weight : The analyst’s expectation for the sector’s fundamentals and/or valuation is neutral over the next 12 months.Underweight : The analyst’s expectation for the sector’s fundamentals and/or valuation is cautious over the next 12 months. *An analyst’s coverage sector consists of all companies covered by the analyst within the relevant sector. An analyst may cover multiple sectors.
Credit Suisse's distribution of stock ratings (and banking clients) is:
Global Ratings DistributionRating Versus universe (%) Of which banking clients (%)Outperform/Buy* 45% (64% banking clients)Neutral/Hold* 38% (61% banking clients)Underperform/Sell* 14% (53% banking clients)Restricted 2%*For purposes of the NYSE and FINRA ratings distribution disclosure requirements, our stock ratings of Outperform, Neutral, and Underperform most closely correspond to Buy, Hold, and Sell, respectively; however, the meanings are not the same, as our stock ratings are determined on a relative basis. (Please refer to definitions above.) An investor's decision to buy or sell a security should be based on investment objectives, current holdings, and other individual factors.
Important Global Disclosures Credit Suisse’s research reports are made available to clients through our proprietary research portal on CS PLUS. Credit Suisse research products may also be made available through third-party vendors or alternate electronic means as a convenience. Certain research products are only made available through CS PLUS. The services provided by Credit Suisse’s analysts to clients may depend on a specific client’s preferences regarding the frequency and manner of receiving communications, the client’s risk profile and investment, the size and scope of the overall client relationship with the Firm, as well as legal and regulatory constraints. To access all of Credit Suisse’s research that you are entitled to receive in the most timely manner, please contact your sales representative or go to https://plus.credit-suisse.com . Credit Suisse’s policy is to update research reports as it deems appropriate, based on developments with the subject company, the sector or the market that may have a material impact on the research views or opinions stated herein.Credit Suisse's policy is only to publish investment research that is impartial, independent, clear, fair and not misleading. For more detail please refer to Credit Suisse's Policies for Managing Conflicts of Interest in connection with Investment Research: https://www.credit-suisse.com/sites/disclaimers-ib/en/managing-conflicts.html . Credit Suisse does not provide any tax advice. Any statement herein regarding any US federal tax is not intended or written to be used, and cannot be used, by any taxpayer for the purposes of avoiding any penalties.
Target Price and RatingValuation Methodology and Risks: (12 months) for Dr Pepper Snapple Group (DPS.N)
Method: Our $111 target price for DPS assumes a 21x P/E multiple on our CY18 EPS estimate. This represents a discount to US Staples peers and our SOTP analysis supports this valuation. We think the multiple is justified by the accelerated performance of Bai and the Allied Brands portfolio, although we think the multiple still has an overhang given the risk associated with a strategy that is at least partially dependent upon the performance of non-core (and non-controlled) assets. We assign an Outperform rating because we think the risk-reward is favorable relative to our stock coverage.
Risk: Risk factors that could impede achievement of our $111 target price and cause us to lower our Outperform rating include 1) increased regulation, 2) accelerated declines of CSD category in the US, 3) loss or decline of Allied Brands, or 4) unexpected ingredient inflation including corn-based sweeteners and aluminum.
Target Price and RatingValuation Methodology and Risks: (12 months) for Molson Coors Brewing Co (TAP.N)
Method: Our $106 target price for TAP assumes a 17x multiple on our CY18 CS-adjusted EPS estimate to derive the core value plus an $11 per share net present value for the transaction cash tax benefit). This represents a discount to US Staples peers, broadly in-line with the historical average discount. We think this fair given the structurally lower margins and low- to no-growth profile. We assign a Neutral rating because we think the risk-reward is appropriately balanced given the current earnings power of the business.

23 March 2017
US Beverages 28
Risk: Risk factors that could impede achievement of our $106 target price and/or cause us to lower our Neutral rating include 1) increased competitive pressures, 2) continued underperformance of the US domestic light and economy beer segments, and 3) failure to integrate MillerCoors, achieve promised synergies, or repay debt.
Please refer to the firm's disclosure website at https://rave.credit-suisse.com/disclosures/view/selectArchive for the definitions of abbreviations typically used in the target price method and risk sections. See the Companies Mentioned section for full company names The subject company (DPS.N, ABI.BR, KO.N, PEP.N, STZ.N, SAM.N) currently is, or was during the 12-month period preceding the date of distribution of this report, a client of Credit Suisse.Credit Suisse provided investment banking services to the subject company (DPS.N, ABI.BR, KO.N, PEP.N) within the past 12 months.Credit Suisse provided non-investment banking services to the subject company (DPS.N, KO.N) within the past 12 monthsCredit Suisse has managed or co-managed a public offering of securities for the subject company (DPS.N, ABI.BR, KO.N) within the past 12 months.Credit Suisse has received investment banking related compensation from the subject company (DPS.N, ABI.BR, KO.N, PEP.N) within the past 12 monthsCredit Suisse expects to receive or intends to seek investment banking related compensation from the subject company (DPS.N, TAP.N, ABI.BR, KO.N, PEP.N, STZ.N, SAM.N) within the next 3 months.Credit Suisse has received compensation for products and services other than investment banking services from the subject company (DPS.N, KO.N) within the past 12 monthsCredit Suisse has a material conflict of interest with the subject company (PEP.N) . Laurent Grandet was formerly employed by Pepsico Inc. within the past 12 months and received compensation from the company during that period.For other important disclosures concerning companies featured in this report, including price charts, please visit the website at https://rave.credit-suisse.com/disclosures or call +1 (877) 291-2683. For date and time of production, dissemination and history of recommendation for the subject company(ies) featured in this report, disseminated within the past 12 months, please refer to the link: https://rave.credit-suisse.com/disclosures/view/report?i=291060&v=-6zkmyrtv7tut6uefwi202xdkz . Important Regional Disclosures Singapore recipients should contact Credit Suisse AG, Singapore Branch for any matters arising from this research report.The analyst(s) involved in the preparation of this report may participate in events hosted by the subject company, including site visits. Credit Suisse does not accept or permit analysts to accept payment or reimbursement for travel expenses associated with these events.Restrictions on certain Canadian securities are indicated by the following abbreviations: NVS--Non-Voting shares; RVS--Restricted Voting Shares; SVS--Subordinate Voting Shares.Individuals receiving this report from a Canadian investment dealer that is not affiliated with Credit Suisse should be advised that this report may not contain regulatory disclosures the non-affiliated Canadian investment dealer would be required to make if this were its own report.For Credit Suisse Securities (Canada), Inc.'s policies and procedures regarding the dissemination of equity research, please visit https://www.credit-suisse.com/sites/disclaimers-ib/en/canada-research-policy.html.The following disclosed European company/ies have estimates that comply with IFRS: (ABI.BR).Credit Suisse has acted as lead manager or syndicate member in a public offering of securities for the subject company (DPS.N, ABI.BR, KO.N) within the past 3 years.Principal is not guaranteed in the case of equities because equity prices are variable.Commission is the commission rate or the amount agreed with a customer when setting up an account or at any time after that.This research report is authored by:Credit Suisse Securities (USA) LLC............................................................................................................Laurent Grandet ; Clay Crumbliss, CFAImportant Credit Suisse HOLT Disclosures With respect to the analysis in this report based on the Credit Suisse HOLT methodology, Credit Suisse certifies that (1) the views expressed in this report accurately reflect the Credit Suisse HOLT methodology and (2) no part of the Firm’s compensation was, is, or will be directly related to the specific views disclosed in this report.The Credit Suisse HOLT methodology does not assign ratings to a security. It is an analytical tool that involves use of a set of proprietary quantitative algorithms and warranted value calculations, collectively called the Credit Suisse HOLT valuation model, that are consistently applied to all the companies included in its database. Third-party data (including consensus earnings estimates) are systematically translated into a number of default algorithms available in the Credit Suisse HOLT valuation model. The source financial statement, pricing, and earnings data provided by outside data vendors are subject to quality control and may also be adjusted to more closely measure the underlying economics of firm performance. The adjustments provide consistency when analyzing a single company across time, or analyzing multiple companies across industries or national borders. The default scenario that is produced by the Credit Suisse HOLT valuation model establishes the baseline valuation for a security, and a user then may adjust the default variables to produce alternative scenarios, any of which could occur.Additional information about the Credit Suisse HOLT methodology is available on request.The Credit Suisse HOLT methodology does not assign a price target to a security. The default scenario that is produced by the Credit Suisse HOLT valuation model establishes a warranted price for a security, and as the third-party data are updated, the warranted price may also change. The default variable may also be adjusted to produce alternative warranted prices, any of which could occur.CFROI®, HOLT, HOLTfolio, ValueSearch, AggreGator, Signal Flag and “Powered by HOLT” are trademarks or service marks or registered trademarks or registered service marks of Credit Suisse or its affiliates in the United States and other countries. HOLT is a corporate performance and valuation advisory service of Credit Suisse.

23 March 2017
US Beverages 29
Important disclosures regarding companies or other issuers that are the subject of this report are available on Credit Suisse’s disclosure website at https://rave.credit-suisse.com/disclosures or by calling +1 (877) 291-2683.

23 March 2017
US Beverages 30
This report is produced by subsidiaries and affiliates of Credit Suisse operating under its Global Markets Division. For more information on our structure, please use the following link: https://www.credit-suisse.com/who-we-are This report may contain material that is not directed to, or intended for distribution to or use by, any person or entity who is a citizen or resident of or located in any locality, state, country or other jurisdiction where such distribution, publication, availability or use would be contrary to law or regulation or which would subject Credit Suisse or its affiliates ("CS") to any registration or licensing requirement within such jurisdiction. All material presented in this report, unless specifically indicated otherwise, is under copyright to CS. None of the material, nor its content, nor any copy of it, may be altered in any way, transmitted to, copied or distributed to any other party, without the prior express written permission of CS. All trademarks, service marks and logos used in this report are trademarks or service marks or registered trademarks or service marks of CS or its affiliates.The information, tools and material presented in this report are provided to you for information purposes only and are not to be used or considered as an offer or the solicitation of an offer to sell or to buy or subscribe for securities or other financial instruments. CS may not have taken any steps to ensure that the securities referred to in this report are suitable for any particular investor. CS will not treat recipients of this report as its customers by virtue of their receiving this report. The investments and services contained or referred to in this report may not be suitable for you and it is recommended that you consult an independent investment advisor if you are in doubt about such investments or investment services. Nothing in this report constitutes investment, legal, accounting or tax advice, or a representation that any investment or strategy is suitable or appropriate to your individual circumstances, or otherwise constitutes a personal recommendation to you. CS does not advise on the tax consequences of investments and you are advised to contact an independent tax adviser. Please note in particular that the bases and levels of taxation may change. Information and opinions presented in this report have been obtained or derived from sources believed by CS to be reliable, but CS makes no representation as to their accuracy or completeness. CS accepts no liability for loss arising from the use of the material presented in this report, except that this exclusion of liability does not apply to the extent that such liability arises under specific statutes or regulations applicable to CS. This report is not to be relied upon in substitution for the exercise of independent judgment. CS may have issued, and may in the future issue, other communications that are inconsistent with, and reach different conclusions from, the information presented in this report. Those communications reflect the different assumptions, views and analytical methods of the analysts who prepared them and CS is under no obligation to ensure that such other communications are brought to the attention of any recipient of this report. Some investments referred to in this report will be offered solely by a single entity and in the case of some investments solely by CS, or an associate of CS or CS may be the only market maker in such investments. Past performance should not be taken as an indication or guarantee of future performance, and no representation or warranty, express or implied, is made regarding future performance. Information, opinions and estimates contained in this report reflect a judgment at its original date of publication by CS and are subject to change without notice. The price, value of and income from any of the securities or financial instruments mentioned in this report can fall as well as rise. The value of securities and financial instruments is subject to exchange rate fluctuation that may have a positive or adverse effect on the price or income of such securities or financial instruments. Investors in securities such as ADR's, the values of which are influenced by currency volatility, effectively assume this risk. Structured securities are complex instruments, typically involve a high degree of risk and are intended for sale only to sophisticated investors who are capable of understanding and assuming the risks involved. The market value of any structured security may be affected by changes in economic, financial and political factors (including, but not limited to, spot and forward interest and exchange rates), time to maturity, market conditions and volatility, and the credit quality of any issuer or reference issuer. Any investor interested in purchasing a structured product should conduct their own investigation and analysis of the product and consult with their own professional advisers as to the risks involved in making such a purchase. Some investments discussed in this report may have a high level of volatility. High volatility investments may experience sudden and large falls in their value causing losses when that investment is realised. Those losses may equal your original investment. Indeed, in the case of some investments the potential losses may exceed the amount of initial investment and, in such circumstances, you may be required to pay more money to support those losses. Income yields from investments may fluctuate and, in consequence, initial capital paid to make the investment may be used as part of that income yield. Some investments may not be readily realisable and it may be difficult to sell or realise those investments, similarly it may prove difficult for you to obtain reliable information about the value, or risks, to which such an investment is exposed. This report may provide the addresses of, or contain hyperlinks to, websites. Except to the extent to which the report refers to website material of CS, CS has not reviewed any such site and takes no responsibility for the content contained therein. Such address or hyperlink (including addresses or hyperlinks to CS's own website material) is provided solely for your convenience and information and the content of any such website does not in any way form part of this document. Accessing such website or following such link through this report or CS's website shall be at your own risk.
This report is issued and distributed in European Union (except Switzerland): by Credit Suisse Securities (Europe) Limited, One Cabot Square, London E14 4QJ, England, which is authorised by the Prudential Regulation Authority and regulated by the Financial Conduct Authority and the Prudential Regulation Authority. Germany: Credit Suisse Securities (Europe) Limited Niederlassung Frankfurt am Main regulated by the Bundesanstalt fuer Finanzdienstleistungsaufsicht ("BaFin"). United States and Canada: Credit Suisse Securities (USA) LLC; Switzerland: Credit Suisse AG; Brazil: Banco de Investimentos Credit Suisse (Brasil) S.A or its affiliates; Mexico: Banco Credit Suisse (México), S.A. (transactions related to the securities mentioned in this report will only be effected in compliance with applicable regulation); Japan: by Credit Suisse Securities (Japan) Limited, Financial Instruments Firm, Director-General of Kanto Local Finance Bureau ( Kinsho) No. 66, a member of Japan Securities Dealers Association, The Financial Futures Association of Japan, Japan Investment Advisers Association, Type II Financial Instruments Firms Association; Hong Kong: Credit Suisse (Hong Kong) Limited; Australia: Credit Suisse Equities (Australia) Limited; Thailand: Credit Suisse Securities (Thailand) Limited, regulated by the Office of the Securities and Exchange Commission, Thailand, having registered address at 990 Abdulrahim Place, 27th Floor, Unit 2701, Rama IV Road, Silom, Bangrak, Bangkok10500, Thailand, Tel. +66 2614 6000; Malaysia: Credit Suisse Securities (Malaysia) Sdn Bhd; Singapore: Credit Suisse AG, Singapore Branch; India: Credit Suisse Securities (India) Private Limited (CIN no.U67120MH1996PTC104392) regulated by the Securities and Exchange Board of India as Research Analyst (registration no. INH 000001030) and as Stock Broker (registration no. INB230970637; INF230970637; INB010970631; INF010970631), having registered address at 9th Floor, Ceejay House, Dr.A.B. Road, Worli, Mumbai - 18, India, T- +91-22 6777 3777; South Korea: Credit Suisse Securities (Europe) Limited, Seoul Branch; Taiwan: Credit Suisse AG Taipei Securities Branch; Indonesia: PT Credit Suisse Securities Indonesia; Philippines:Credit Suisse Securities (Philippines ) Inc., and elsewhere in the world by the relevant authorised affiliate of the above.Additional Regional DisclaimersHong Kong: Credit Suisse (Hong Kong) Limited ("CSHK") is licensed and regulated by the Securities and Futures Commission of Hong Kong under the laws of Hong Kong, which differ from Australian laws. CSHKL does not hold an Australian financial services licence (AFSL) and is exempt from the requirement to hold an AFSL under the Corporations Act 2001 (the Act) under Class Order 03/1103 published by the ASIC in respect of financial services provided to Australian wholesale clients (within the meaning of section 761G of the Act). Research on Taiwanese securities produced by Credit Suisse AG, Taipei Securities Branch has been prepared by a registered Senior Business Person. Australia (to the extent services are offered in Australia): Credit Suisse Securities (Europe) Limited (“CSSEL”) and Credit Suisse International (“CSI”) are authorised by the Prudential Regulation Authority and regulated by the Financial Conduct Authority (“FCA”) and the Prudential Regulation Authority under UK laws, which differ from Australian Laws. CSSEL and CSI do not hold an Australian Financial Services Licence (“AFSL”) and are exempt from the requirement to hold an AFSL under the Corporations Act (Cth) 2001 (“Corporations Act”) under Class Order 03/1099 published by the Australian Securities and Investments Commission (“ASIC”), in respect of the financial services provided to Australian wholesale clients (within the meaning of section 761G of the Corporations Act). This material is not for distribution to retail clients and is directed exclusively at Credit Suisse's professional clients and eligible counterparties as defined by the FCA, and wholesale clients as defined under section 761G of the Corporations Act. Credit Suisse (Hong Kong) Limited (“CSHK”) is licensed and regulated by the Securities and Futures Commission of Hong Kong under the laws of Hong Kong, which differ from Australian laws. CSHKL does not hold an AFSL and is exempt from the requirement to hold an AFSL under the Corporations Act under Class Order 03/1103 published by the ASIC in respect of financial services provided to Australian wholesale clients (within the meaning of section 761G of the Corporations Act). Credit Suisse Securities (USA) LLC (CSSU) and Credit Suisse Asset Management LLC (CSAM LLC) are licensed and regulated by the Securities Exchange Commission of the United States under the laws of the United States, which differ from Australian laws. CSSU and CSAM LLC do not hold an AFSL and is exempt from the requirement to hold an AFSL under the Corporations Act under Class Order 03/1100 published by the ASIC in respect of financial services provided to Australian wholesale clients (within the meaning of section 761G of the Corporations Act). Malaysia: Research provided to residents of Malaysia is authorised by the Head of Research for Credit Suisse Securities (Malaysia) Sdn Bhd, to whom they should direct any queries on +603 2723 2020. Singapore: This report has been prepared and issued for distribution in Singapore to institutional investors, accredited investors and expert investors (each as defined under the Financial Advisers Regulations) only, and is also distributed by Credit Suisse AG, Singapore Branch to overseas investors (as defined under the Financial Advisers Regulations). Credit Suisse AG, Singapore Branch may distribute reports produced by its foreign entities or affiliates pursuant to an arrangement under Regulation 32C of the Financial Advisers Regulations. Singapore recipients should contact Credit Suisse AG, Singapore Branch at +65-6212-2000 for matters arising from, or in connection with, this report. By virtue of your status as an institutional investor, accredited investor, expert investor or overseas investor, Credit Suisse AG, Singapore Branch is exempted from complying with certain compliance requirements under the Financial Advisers Act, Chapter 110 of Singapore (the “FAA”), the Financial Advisers Regulations and the relevant Notices and Guidelines issued thereunder, in respect of any financial advisory service which Credit Suisse AG, Singapore Branch may provide to you. UAE: This information is being distributed by Credit Suisse AG (DIFC Branch), duly licensed and regulated by the Dubai Financial Services Authority (“DFSA”). Related financial services or products are only made available to Professional Clients or Market Counterparties, as defined by the DFSA, and are not intended for any other persons. Credit Suisse AG (DIFC Branch) is located on Level 9 East, The Gate Building, DIFC, Dubai, United Arab Emirates. EU: This report has been produced by subsidiaries and affiliates of Credit Suisse operating under its Global Markets Division In jurisdictions where CS is not already registered or licensed to trade in securities, transactions will only be effected in accordance with applicable securities legislation, which will vary from jurisdiction to jurisdiction and may require that the trade be made in accordance with applicable exemptions from registration or licensing requirements. Non-US customers wishing to effect a transaction should contact a CS entity in their local jurisdiction unless governing law permits otherwise. US customers wishing to effect a transaction should do so only by contacting a representative at Credit Suisse Securities (USA) LLC in the US. Please note that this research was originally prepared and issued by CS for distribution to their market professional and institutional investor customers. Recipients who are not market professional or institutional investor customers of CS should seek the advice of their independent financial advisor prior to taking any investment decision based on this report or for any necessary explanation of its contents. This research may relate to investments or services of a person outside of the UK or to other matters which are not authorised by the Prudential Regulation Authority and regulated by the Financial Conduct Authority and the Prudential Regulation Authority or in respect of which the protections of the Prudential Regulation Authority and Financial Conduct Authority for private customers and/or the UK compensation scheme may not be available, and further details as to where this may be the case are available upon request in respect of this report. CS may provide various services to US municipal entities or obligated persons ("municipalities"), including suggesting individual transactions or trades and entering into such transactions. Any services CS provides to municipalities are not viewed as "advice" within the meaning of Section 975 of the Dodd-Frank Wall Street Reform and Consumer Protection Act. CS is providing any such services and related information solely on an arm's length basis and not as an advisor or fiduciary to the municipality. In connection with the provision of the any such services, there is no agreement, direct or indirect, between any municipality (including the officials,management, employees or agents thereof) and CS for CS to provide advice to the municipality. Municipalities should consult with their financial, accounting and legal advisors regarding any such services provided by CS. In addition, CS is not acting for direct or indirect compensation to solicit the municipality on behalf of an unaffiliated broker, dealer, municipal securities dealer, municipal advisor, or investment adviser for the purpose of obtaining or retaining an engagement by the municipality for or in connection with Municipal Financial Products, the issuance of municipal securities, or of an investment adviser to provide investment advisory services to or on behalf of the municipality. If this report is being distributed by a financial institution other than Credit Suisse AG, or its affiliates, that financial institution is solely responsible for distribution. Clients of that institution should contact that institution to effect a transaction in the securities mentioned in this report or require further information. This report does not constitute investment advice by Credit Suisse to the clients of the distributing financial institution, and neither Credit Suisse AG, its affiliates, and their respective officers, directors and employees accept any liability whatsoever for any direct or consequential loss arising from their use of this report or its content. Principal is not guaranteed. Commission is the commission rate or the amount agreed with a customer when setting up an account or at any time after that. Copyright © 2017 CREDIT SUISSE AG and/or its affiliates. All rights reserved. Investment principal on bonds can be eroded depending on sale price or market price. In addition, there are bonds on which investment principal can be eroded due to changes in redemption amounts. Care is required when investing in such instruments. When you purchase non-listed Japanese fixed income securities (Japanese government bonds, Japanese municipal bonds, Japanese government guaranteed bonds, Japanese corporate bonds) from CS as a seller, you will be requested to pay the purchase price only.