u.s. department of the interior u.s. geological survey sustainability of ground-water use in the san...
TRANSCRIPT

U.S. Department of the InteriorU.S. Geological Survey
Sustainability of Ground-Water Use in the San Pedro River
Basin, Cochise County, Arizona
James Leenhouts, Ph.D.
IAEA/GEF IW Learn/USGS Aquifer Exchange
April 19, 2007

The Upper San Pedro Basin
San Pedro River flows north from near Cananea, Mexico to Gila River
4,480 km2 area above Tombstone gage 1,810 km2 in
Mexico 2,670 km2 in U.S.
Fort Huachuca

The Problem: Competing Assets
The San Pedro’s riparian system (SPRNCA) Federally protected in 1988 One of shrinking number of free-
flowing perennial rivers in the Southwest
The human community National asset: Fort Huachuca Growing population Great climate, beautiful environs

Streamflow at Charleston
Total uses
0
10
20
30
40
50
60
1900 1910 1920 1930 1940 1950 1960 1970 1980 1990 2000YEAR
GR
OU
ND
-WA
TE
R
WIT
HD
RA
WA
LS,
in C
UB
IC
HE
CT
OM
ET
ER
S
0
10000
20000
30000
40000
GR
OU
ND
-WA
TE
R
WIT
HD
RA
WA
LS,
in A
CR
E-F
EE
T
Pumping
Streamflow
Fort Huachuca

Zero flow at Charleston, Summer 2005
June-July 2005 Charleston Streamflow
0
2
4
6
8
10
6/1/05 6/16/05 7/1/05 7/16/05 7/31/05
Str
eam
flo
w (
cfs)


Investigations
Geohydrologic studies Improve the conceptual model Detailed investigation of physical system Synthesis in ground-water model
Riparian water needs studies Multidisciplinary study Related hydrologic variables to riparian condition Quantified riparian ET

Geohydrologic Studies
Water levels
Streamflow
Aquifer storage change - microgravity
Geophysical exploration
Unsaturated zone flow
Stream temperature monitoring
Lacoste and Romberg Model D
Relative-gravity meter

Investigations Network

WE
TL
AN
DS
ST
RE
AM
BEDROCK
ETET
RECHARGE
RE
CH
AR
GE
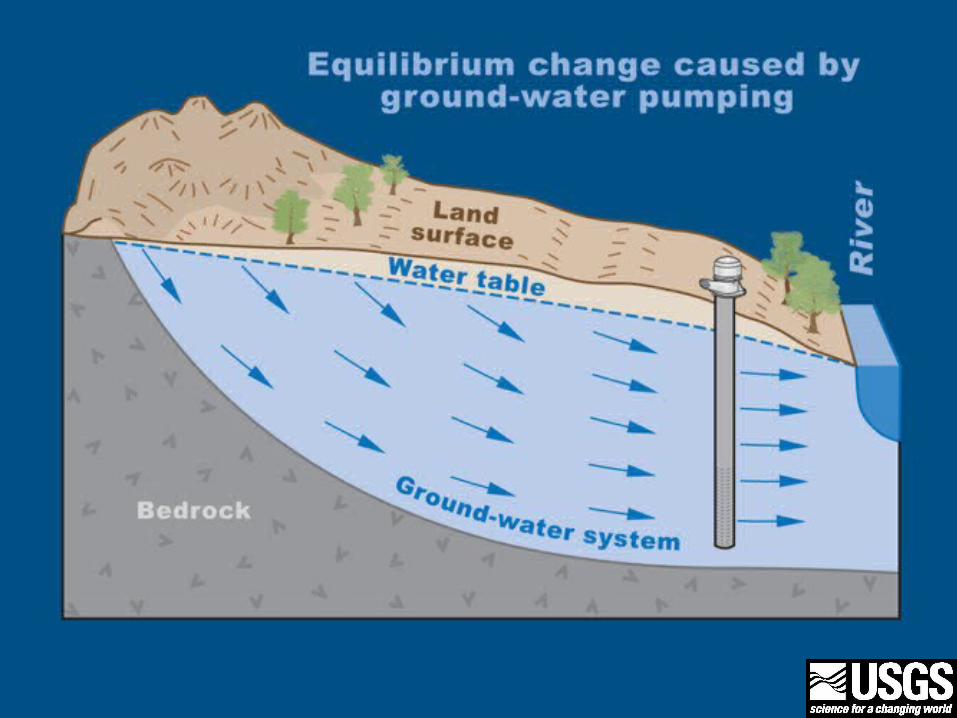
CURRENT CONCEPTUAL CURRENT CONCEPTUAL GROUND-WATER FLOW GROUND-WATER FLOW
SYSTEM SYSTEM
Spring
limestone
EPHEMERALSTREAM
RECHARGE
EPHEMERALSTREAM
RECHARGE
EAST WEST

WE
TL
AN
DS
ST
RE
AM
BEDROCK
SCHEMATIC SCHEMATIC REPRESENTATION OF REPRESENTATION OF
GROUND-WATER FLOW GROUND-WATER FLOW MODELMODEL
BEDROCK
LAYER 3
RECHARGE
RE
CH
AR
GE
ETET
EAST WEST
EPHEMERALSTREAM
RECHARGE
EPHEMERALSTREAM
RECHARGE
RE
CH
AR
GE
RE
CH
AR
GE
LAYER 5LAYER 4
LAYER 2
LAYER 1
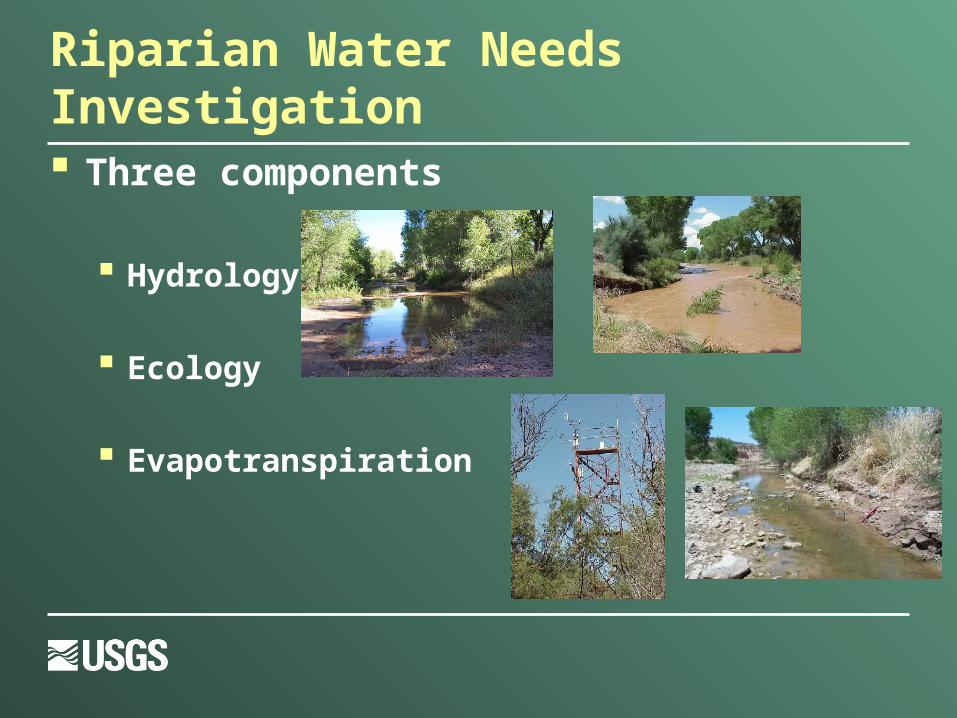
Riparian Water Needs Investigation
Three components
Hydrology
Ecology
Evapotranspiration

Riparian Condition Class Relates
hydrology to ecology
Provides science to inform policy

The Mandate: Sustainable Yield
Stipulated by Congress
Not safe yield --> pumping = recharge
Sustainable Ground-Water Yield “…the development and use of ground water in a
manner that can be maintained for an indefinite time without causing unacceptable environmental, economic, or social consequences.”

The Players
Upper San Pedro Partnership 21 local, state, federal, and non-
governmental agencies Goal is to identify and implement
solutions to assure reasonable water supply for the river and the people
AZ congressional delegation
Other groups
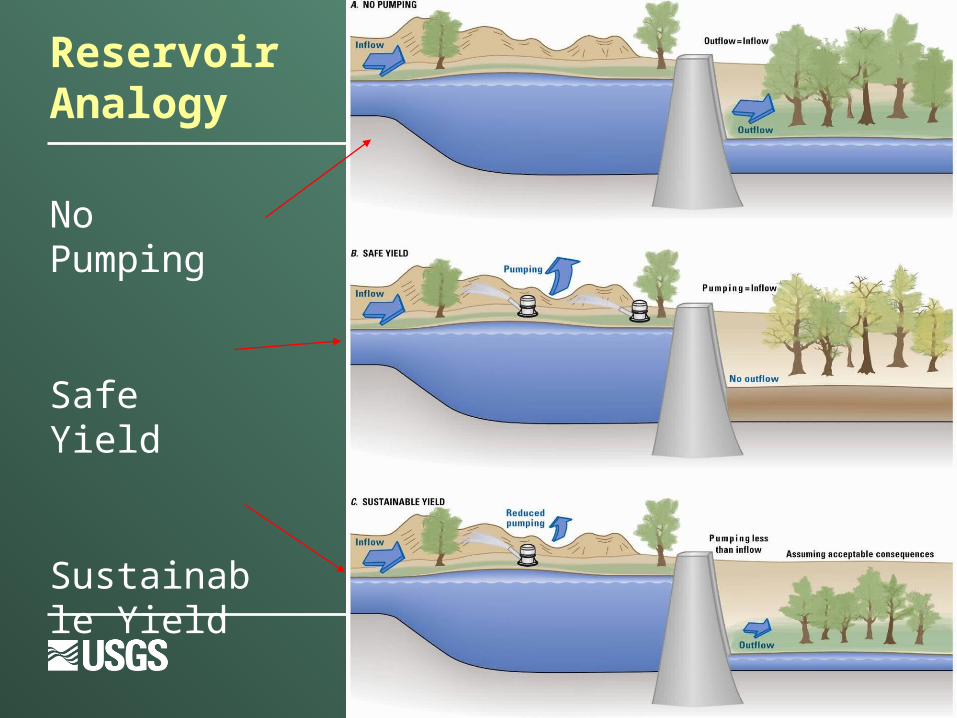
Reservoir Analogy
No Pumping
Safe Yield
Sustainable Yield

Initial Criteria for Sustainability
Unacceptable consequences:
The riparian system ceases to function
Unavailability of water causes Fort Huachuca to close

Sustainable yield
How much water: Do the people need? Does the riparian system
need? Temporal effects Spatial effects Climatic effects
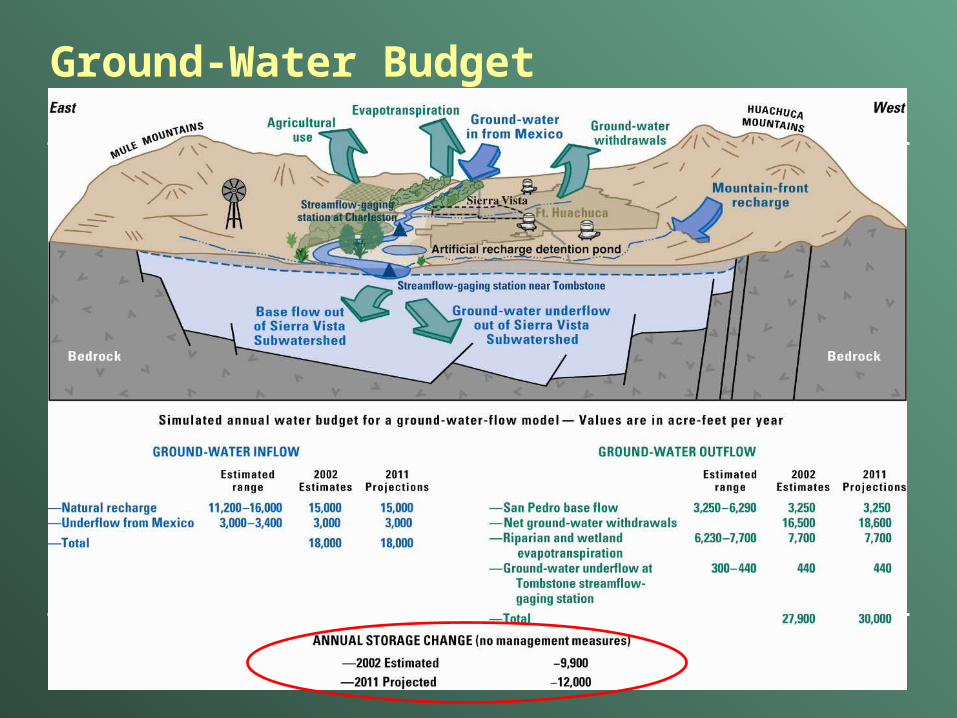
Ground-Water Budget

Sustainable yield – initial goalAn Aquifer-Storage Approach

Sustainability – defined spatially
Define indicators and thresholds Indicators – variables that inform status Thresholds – markers beyond which sustainability
fails
Environment SocioeconomicIndicator Threshold Indicator Threshold
Ground-water levels – regional aquifer ? ? ?Streamflow ? ? ?Spring discharge ? ? ?Ground-water levels – alluvial aquifer
Defined by water-needs study ? ?

Assessing Progress = Monitoring
Water budget aspects
Tabulation of pumping Continued refinement of
inflow and outflow values
System-response aspects
Water levels Microgravity Spring and stream
discharge Vertical gradients

Sustainable Yield – Adaptive Management
Iterative interaction
Management Action
Monitoring
Analysis

Science Informing Policy
Spatial definition of ground-water management
“Capture map”

Semiarid: Only half of the residents drive camels
Questions?

Reaching the Goal
Broad categories of water management measures:
Conservation Growing population
Recharge Needs source of water
Importation Potential legal issues
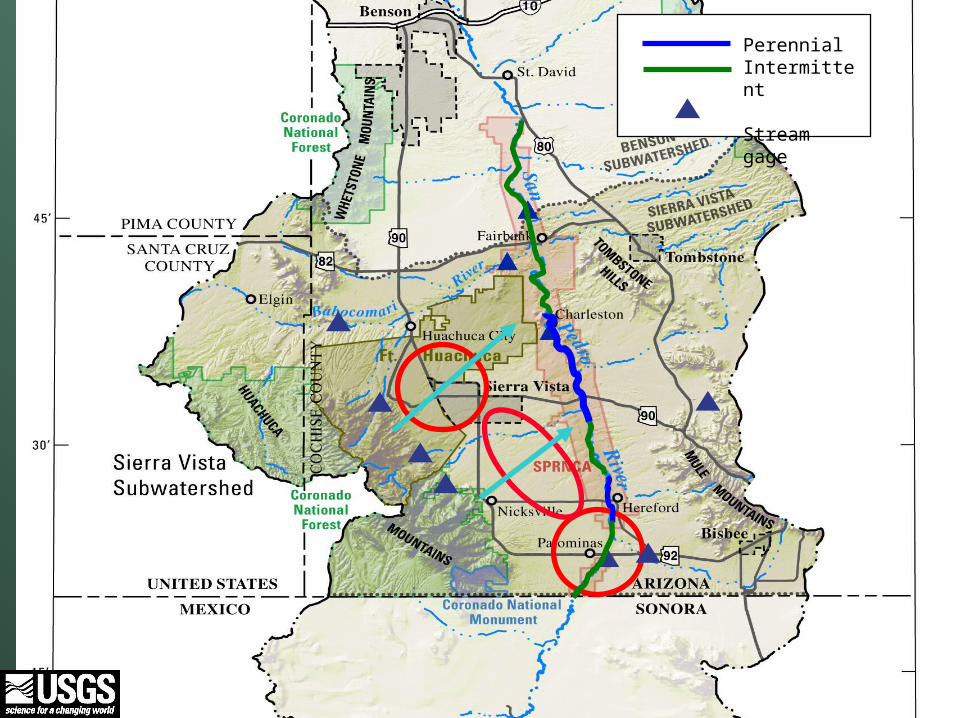
PerennialIntermittent
Stream gage

Who, What, Where, When, How?
June-July 2005 Charleston Streamflow
0
2
4
6
8
10
6/1/05 6/16/05 7/1/05 7/16/05 7/31/05
Str
eam
flo
w (
cfs)

Interaction of Multiple Factors
Summer (June) 7-Day Low Flow at Charleston, 1936-2005
0
1
2
3
4
5
6
7
8
9
10
1930 1940 1950 1960 1970 1980 1990 2000
Str
eam
flo
w, c
ub
ic-f
eet
-pe
r-s
ec.
June 7-day low flow
5-year average
2005 streamflow data not yet verified.

Annual Section 321 Reports
See the 2004 Section 321 report at:http://water.usgs.gov/Section321.2004_050705.pdf

Sustainability: “…the development and use of ground water in a
manner that can be maintained for an indefinite time without causing unacceptable environmental, economic, or social consequences.”

Outline
Introduction to basin – talk about SPRNCA – usual superlatives, Fort, Cities The issues – declining streamflows, zero flow. Discussion of the players Capture Description of work done – model, water needs. Sustainable yield goal – Section 321 Status of water budget – include reservoir analogy to sustainable yield Science to policy section
Section 321 reports Capture maps Level change maps Gravity maps