cochise conservation and recharge network (ccrn)
TRANSCRIPT
COCHISE CONSERVATION AND RECHARGE NETWORK (CCRN)Ephemeral Streamflow, Groundwater, and Palominas Facility Monitoring
Presentation to Upper San Pedro Partnership (USPP) Technical CommitteeJune 19, 2019
CCRN MONITORINGAcknowledgements
Thank you Upper San Pedro Partnership for having us here today!
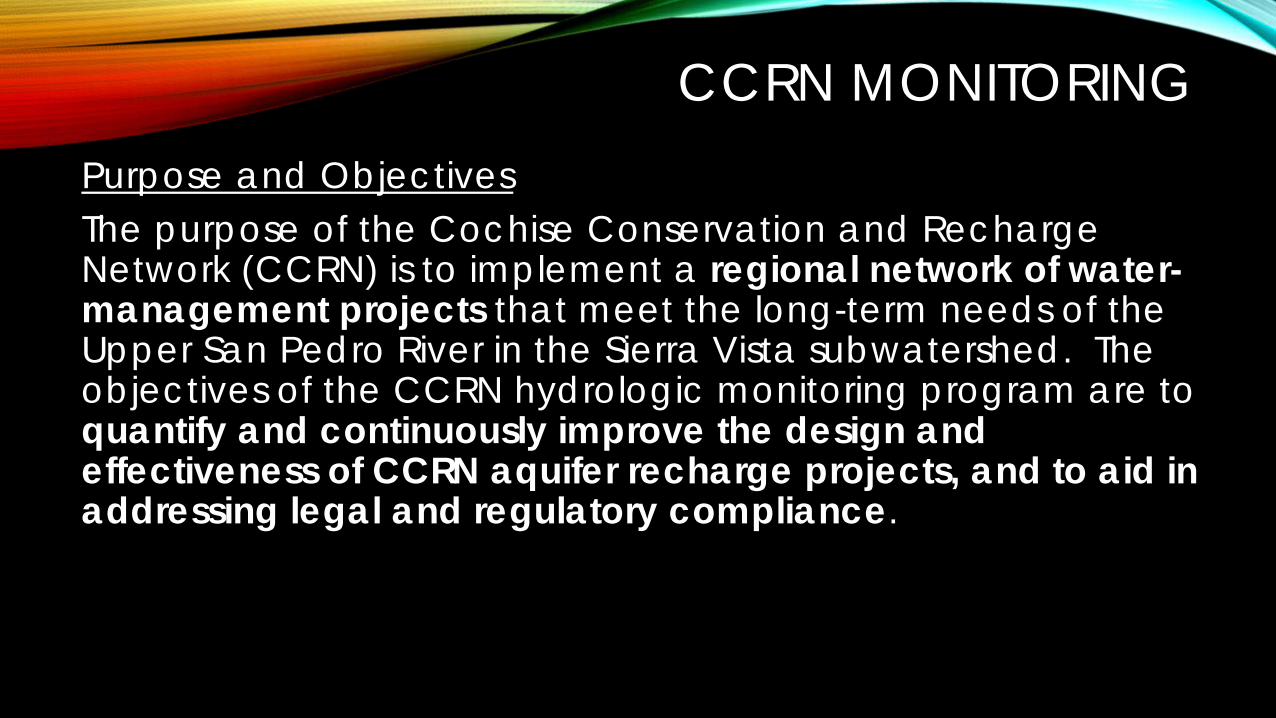
CCRN MONITORINGPurpose and ObjectivesThe purpose of the Cochise Conservation and Recharge Network (CCRN) is to implement a regional network of water-management projects that meet the long-term needs of the Upper San Pedro River in the Sierra Vista subwatershed. The objectives of the CCRN hydrologic monitoring program are to quantify and continuously improve the design and effectiveness of CCRN aquifer recharge projects, and to aid in addressing legal and regulatory compliance.
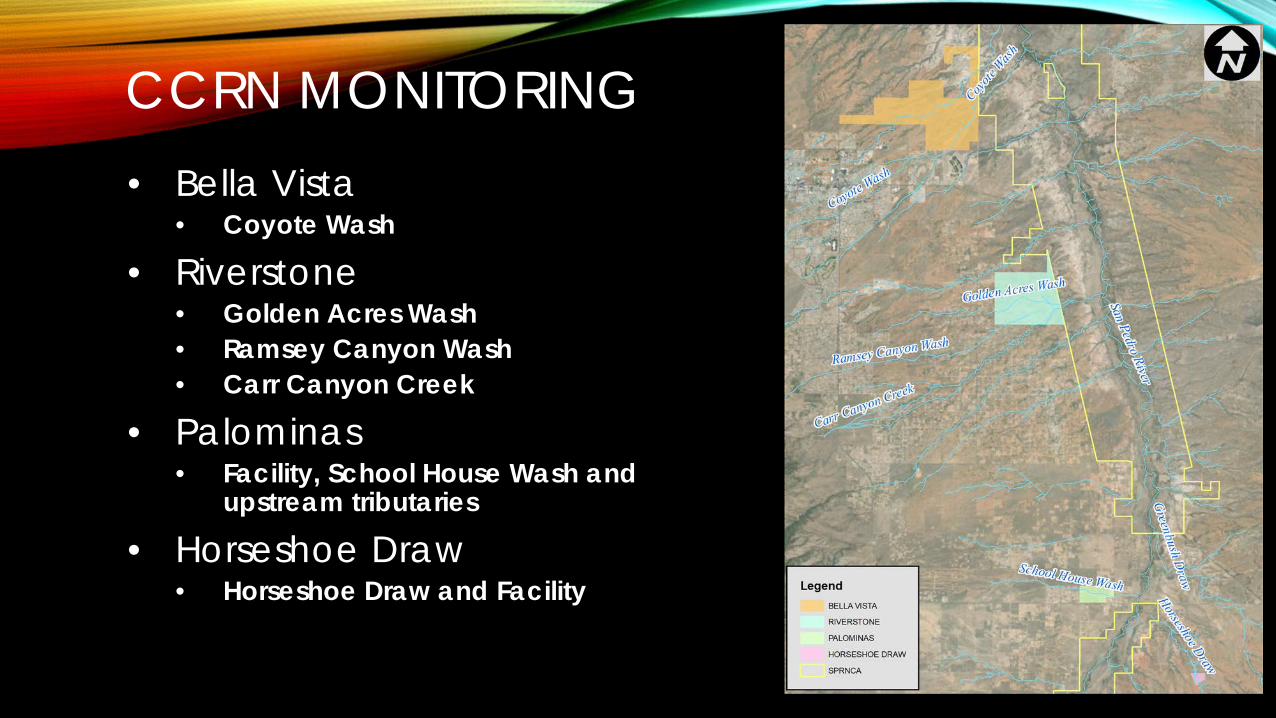
• Bella Vista• Coyote Wash
• Riverstone• Golden Acres Wash• Ramsey Canyon Wash• Carr Canyon Creek
• Palominas • Facility, School House Wash and
upstream tributaries
• Horseshoe Draw• Horseshoe Draw and Facility
CCRN MONITORING
CCRN MONITORINGReasons for Monitoring (“Why”)1. Document and track groundwater elevations, trends, gradients,
etc. for either baseline conditions (pre-project) or observed effects (post-project)
2. Measure precipitation at various locations throughout contributing watersheds
3. Estimate natural surface water runoff flow rates and annual delivery volumes for baseline conditions
4. Estimate project facility inflow and outflow rates and annual volumes
5. Estimate aquifer recharge volumes resulting from constructed facilities, and compare pilot project recharge enhancement features

PRESSURE TRANSDUCERS• Installed in vented steel pipe
housing • Measure weight of water above
sensor, derive depth• Deployed at various locations
throughout monitored watersheds• Co-located (generally) with
barometric pressure PT to compensate for atmospheric pressure
CCRN MONITORING
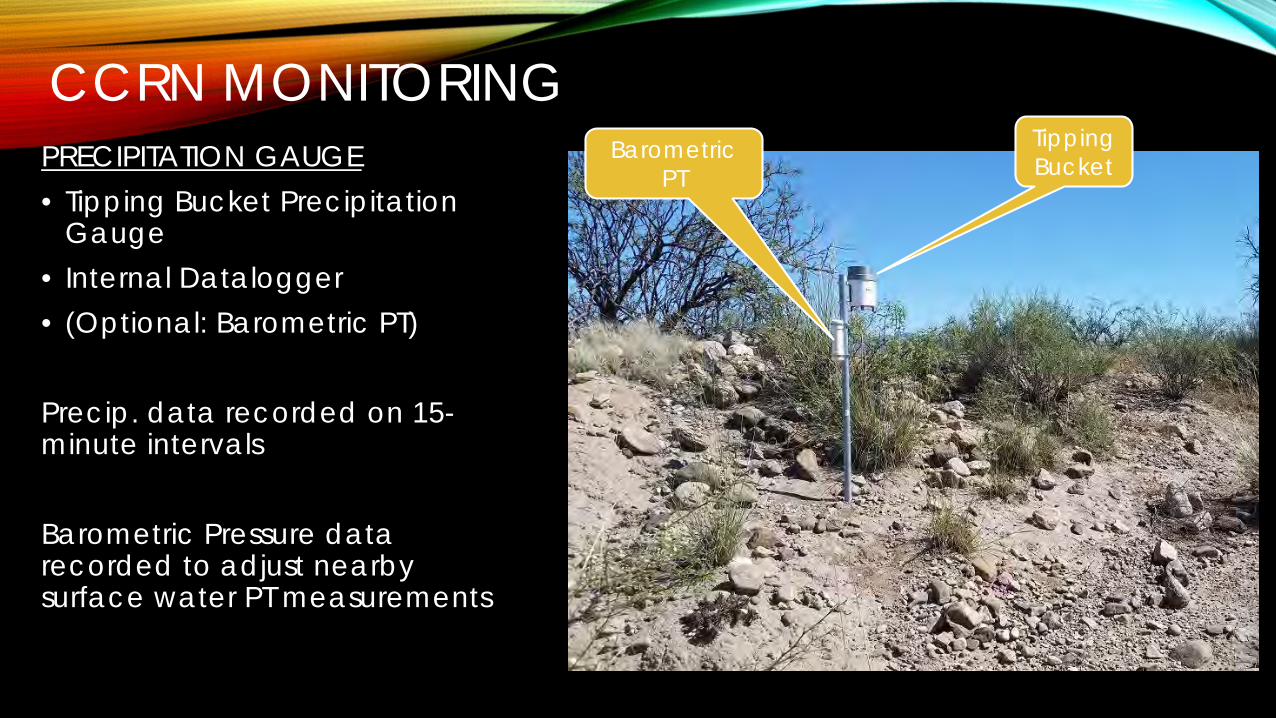
CCRN MONITORINGPRECIPITATION GAUGE• Tipping Bucket Precipitation
Gauge• Internal Datalogger• (Optional: Barometric PT)
Precip. data recorded on 15-minute intervals
Barometric Pressure data recorded to adjust nearby surface water PT measurements
Tipping Bucket
Barometric PT
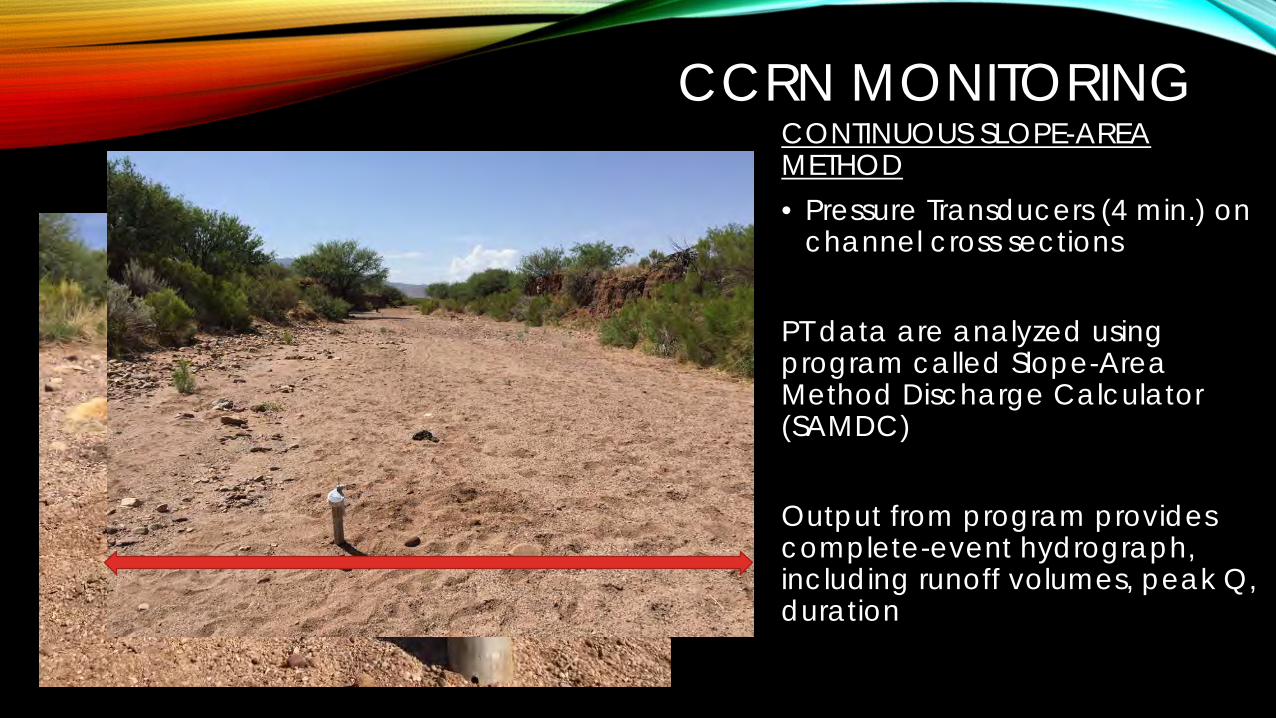
CCRN MONITORINGCONTINUOUS SLOPE-AREA METHOD• Pressure Transducers (4 min.) on
channel cross sections
PT data are analyzed using program called Slope-Area Method Discharge Calculator (SAMDC)
Output from program provides complete-event hydrograph, including runoff volumes, peak Q, duration
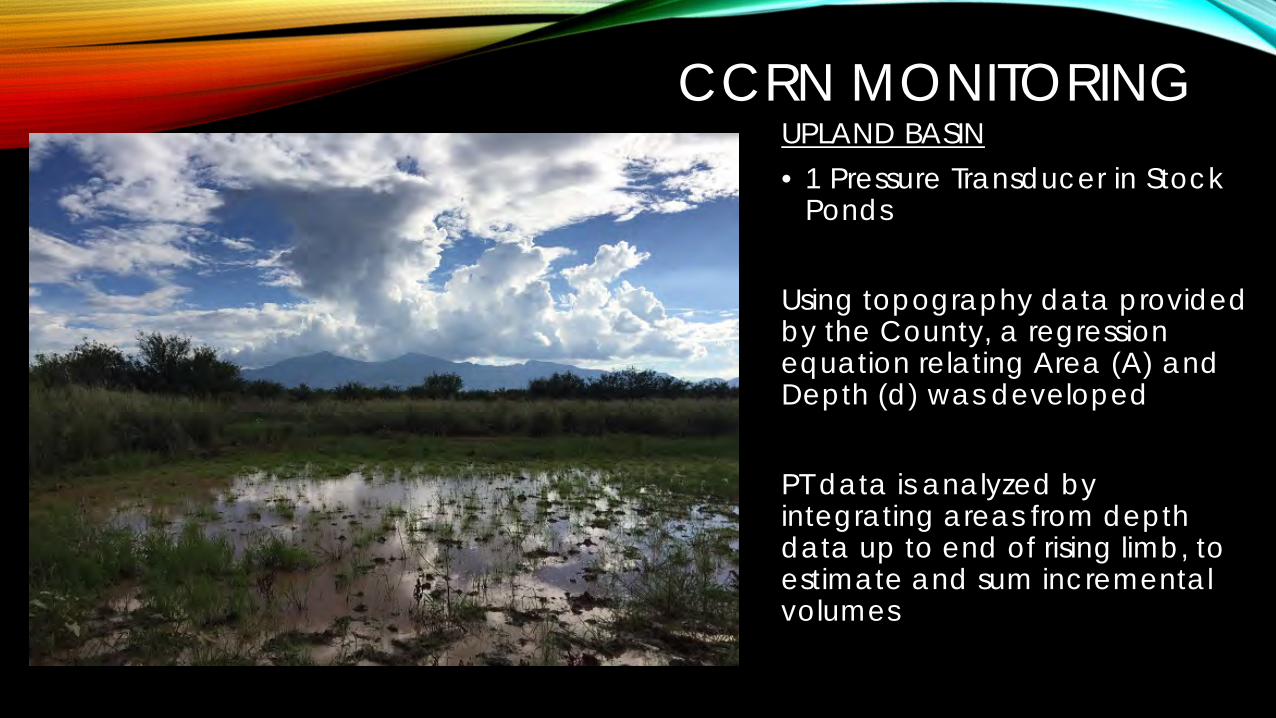
CCRN MONITORINGUPLAND BASIN • 1 Pressure Transducer in Stock
Ponds
Using topography data provided by the County, a regression equation relating Area (A) and Depth (d) was developed
PT data is analyzed by integrating areas from depth data up to end of rising limb, to estimate and sum incremental volumes
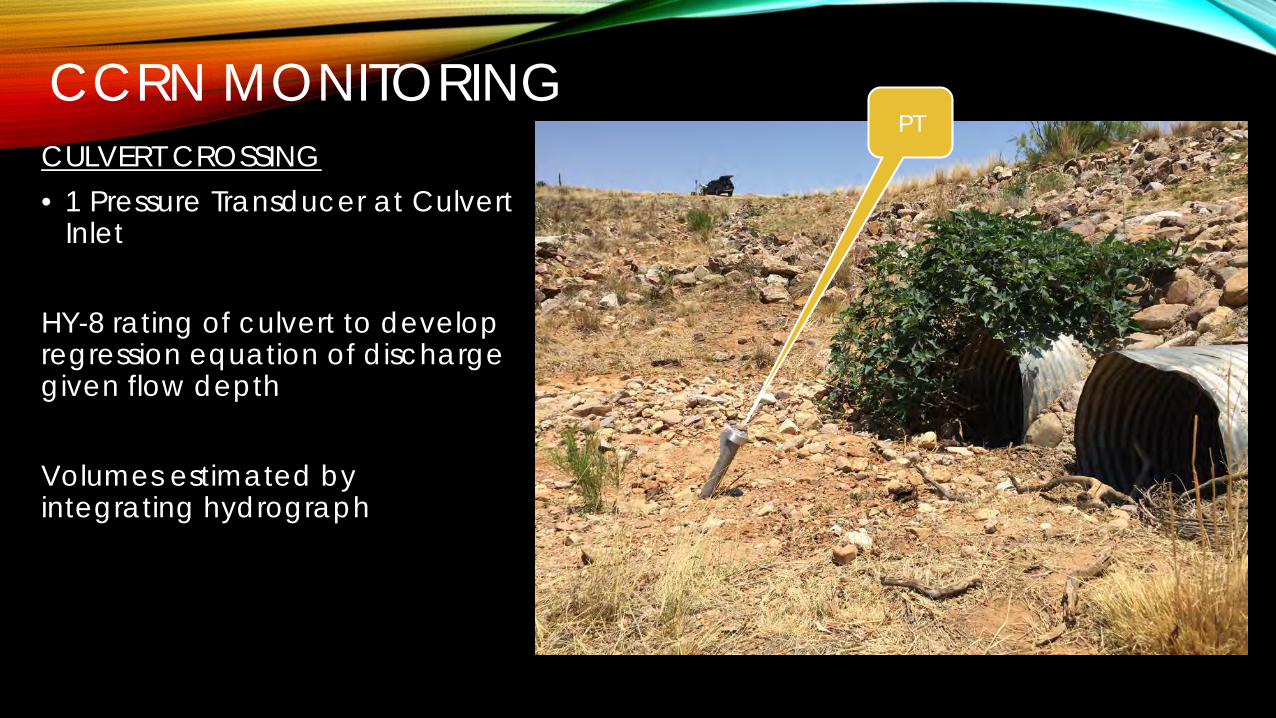
CCRN MONITORINGCULVERT CROSSING • 1 Pressure Transducer at Culvert
Inlet
HY-8 rating of culvert to develop regression equation of discharge given flow depth
Volumes estimated by integrating hydrograph
PT
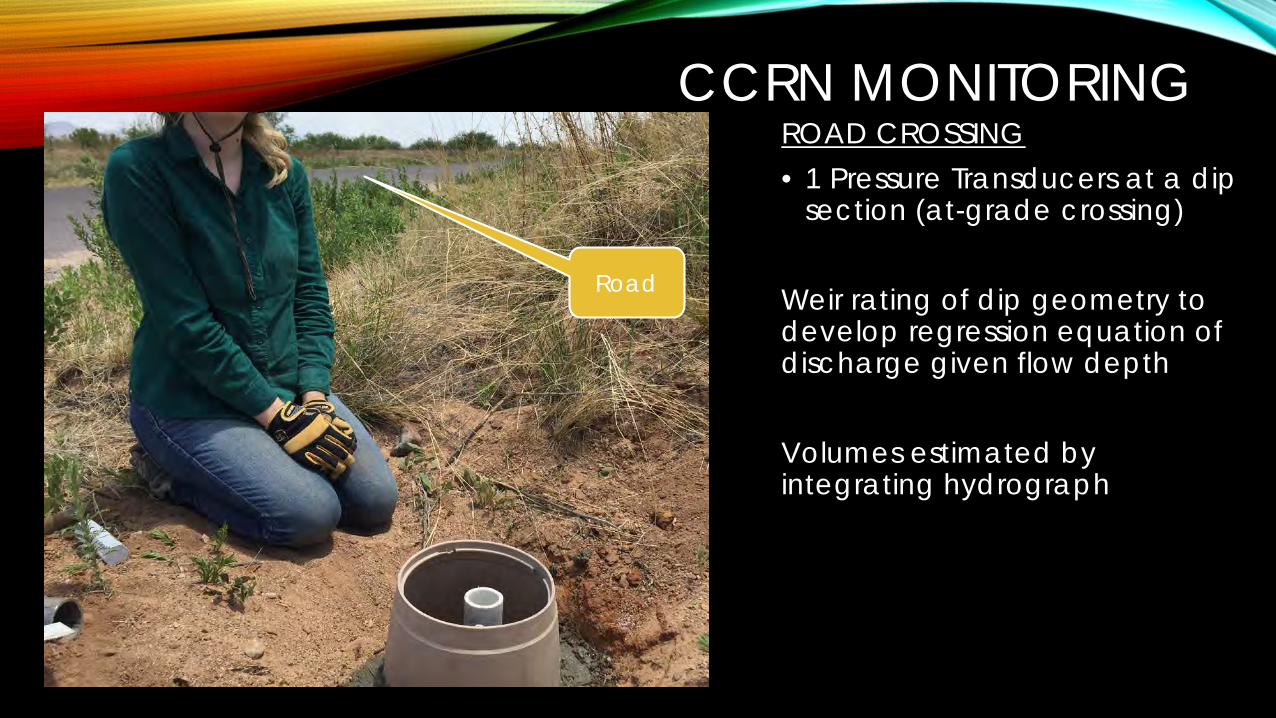
CCRN MONITORINGROAD CROSSING• 1 Pressure Transducers at a dip
section (at-grade crossing)
Weir rating of dip geometry to develop regression equation of discharge given flow depth
Volumes estimated by integrating hydrograph
Road

CCRN MONITORINGHEC-RAS STATION• 2 Pressure Transducers on 3
channel cross sections (downstream used for setting boundary condition)
HEC-RAS rating of cross sections to develop regression equation of discharge given flow depth
Volumes estimated by integrating hydrographs at each sensor
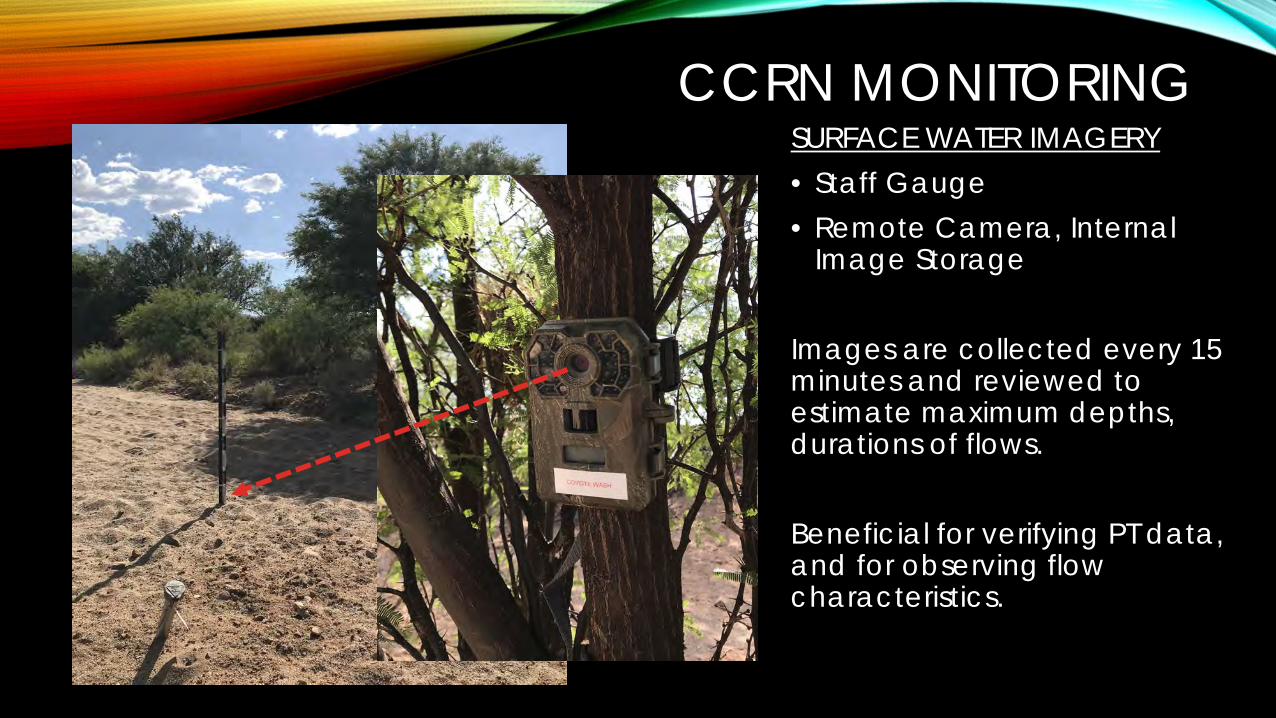
CCRN MONITORINGSURFACE WATER IMAGERY• Staff Gauge• Remote Camera, Internal
Image Storage
Images are collected every 15 minutes and reviewed to estimate maximum depths, durations of flows.
Beneficial for verifying PT data, and for observing flow characteristics.

CCRN MONITORINGINSTRUMENTED BOREHOLES• Level 1: Soil Moisture Sensors
and Datalogger• Level 2: Soil Moisture Sensor,
Advanced Tensiometer and Datalogger
Level 1 Measure and record soil volumetric water content and temperature
Level 2 also measure soil moisture soil water potential
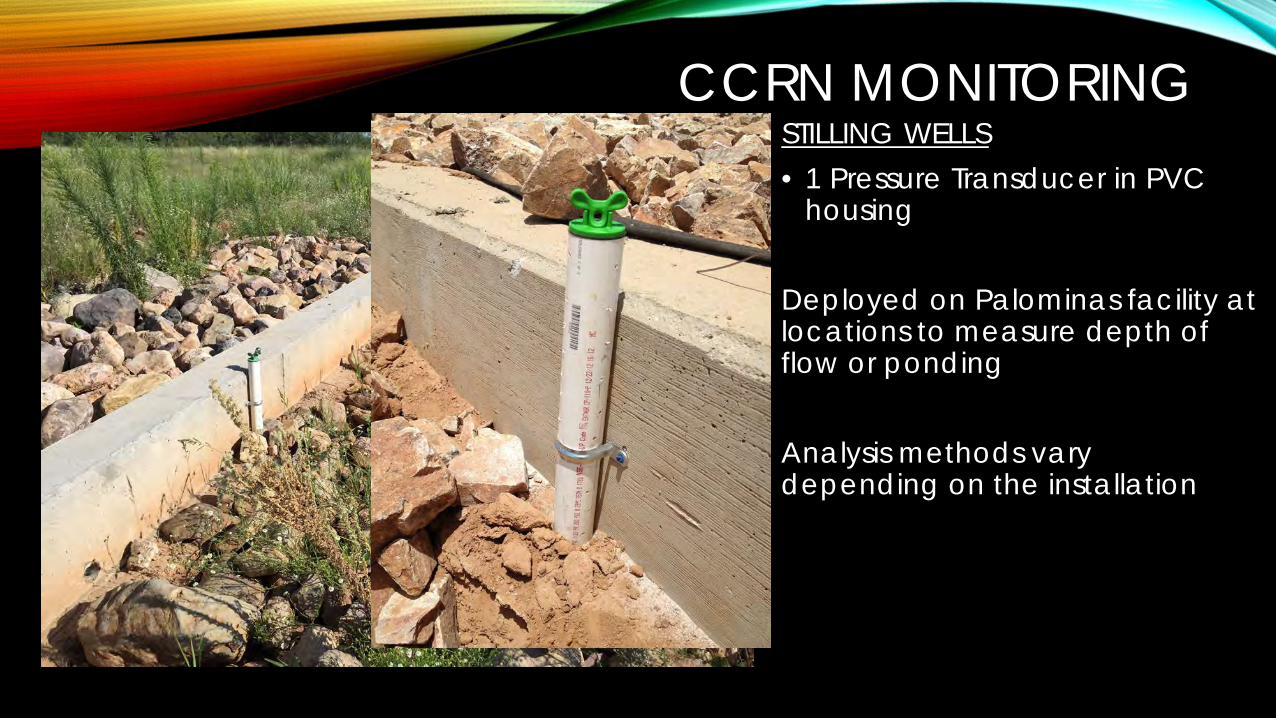
CCRN MONITORINGSTILLING WELLS• 1 Pressure Transducer in PVC
housing
Deployed on Palominas facility at locations to measure depth of flow or ponding
Analysis methods vary depending on the installation

CCRN MONITORINGGROUNDWATER MONITORING WELL• 1 PT lowered into well casing
tethered to a cable• (Optional) measured manually
Measure depth of groundwater above PT, over time
Based on ground elevation measurements or estimates, groundwater elevations are determined
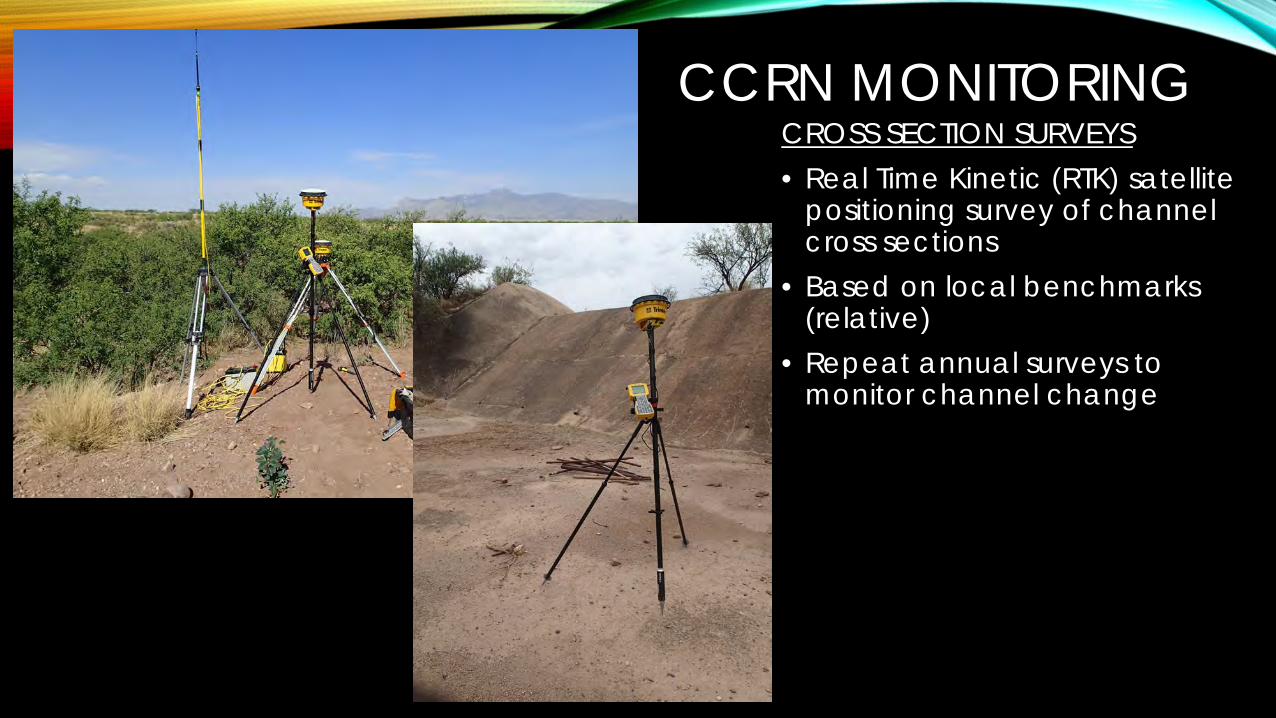
CCRN MONITORINGCROSS SECTION SURVEYS• Real Time Kinetic (RTK) satellite
positioning survey of channel cross sections
• Based on local benchmarks (relative)
• Repeat annual surveys to monitor channel change
CCRNMONITORING
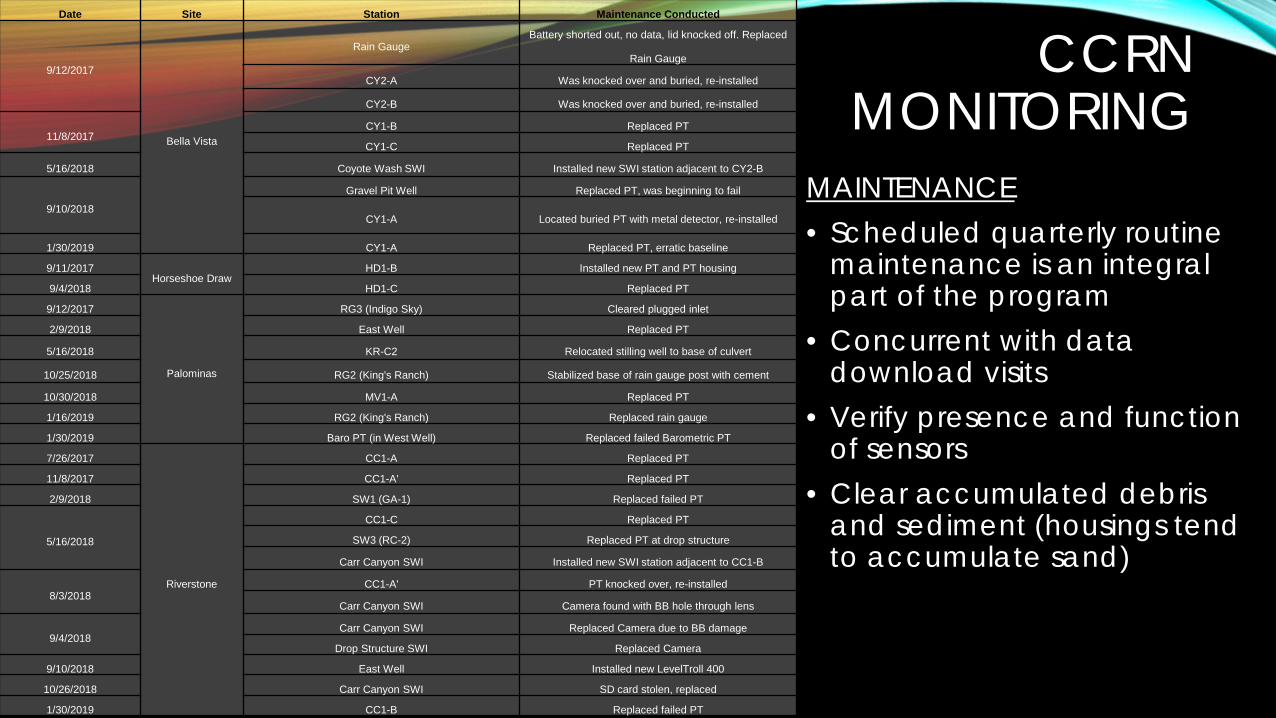
MAINTENANCE• Scheduled quarterly routine
maintenance is an integral part of the program
• Concurrent with data download visits
• Verify presence and function of sensors
• Clear accumulated debris and sediment (housings tend to accumulate sand)
Date Site Station Maintenance Conducted
9/12/2017
Bella Vista
Rain GaugeBattery shorted out, no data, lid knocked off. Replaced
Rain Gauge
CY2-A Was knocked over and buried, re-installed
CY2-B Was knocked over and buried, re-installed
11/8/2017CY1-B Replaced PT
CY1-C Replaced PT
5/16/2018 Coyote Wash SWI Installed new SWI station adjacent to CY2-B
9/10/2018
Gravel Pit Well Replaced PT, was beginning to fail
CY1-A Located buried PT with metal detector, re-installed
1/30/2019 CY1-A Replaced PT, erratic baseline
9/11/2017Horseshoe Draw
HD1-B Installed new PT and PT housing
9/4/2018 HD1-C Replaced PT
9/12/2017
Palominas
RG3 (Indigo Sky) Cleared plugged inlet
2/9/2018 East Well Replaced PT
5/16/2018 KR-C2 Relocated stilling well to base of culvert
10/25/2018 RG2 (King's Ranch) Stabilized base of rain gauge post with cement
10/30/2018 MV1-A Replaced PT
1/16/2019 RG2 (King's Ranch) Replaced rain gauge
1/30/2019 Baro PT (in West Well) Replaced failed Barometric PT
7/26/2017
Riverstone
CC1-A Replaced PT
11/8/2017 CC1-A' Replaced PT
2/9/2018 SW1 (GA-1) Replaced failed PT
5/16/2018
CC1-C Replaced PT
SW3 (RC-2) Replaced PT at drop structure
Carr Canyon SWI Installed new SWI station adjacent to CC1-B
8/3/2018CC1-A' PT knocked over, re-installed
Carr Canyon SWI Camera found with BB hole through lens
9/4/2018Carr Canyon SWI Replaced Camera due to BB damage
Drop Structure SWI Replaced Camera
9/10/2018 East Well Installed new LevelTroll 400
10/26/2018 Carr Canyon SWI SD card stolen, replaced
1/30/2019 CC1-B Replaced failed PT

RESULTSPrior monitoring period: calendar years 2017 & 2018

CCRN MONITORINGRESULTS: BELLA VISTAPrecipitation Summary
Year Precipitation Depth (in.)
Classification(below <10.3 in. average 19.1 in.<above)
NCDC 2012, 20152017 8.4 Dry2018 14.8 Average
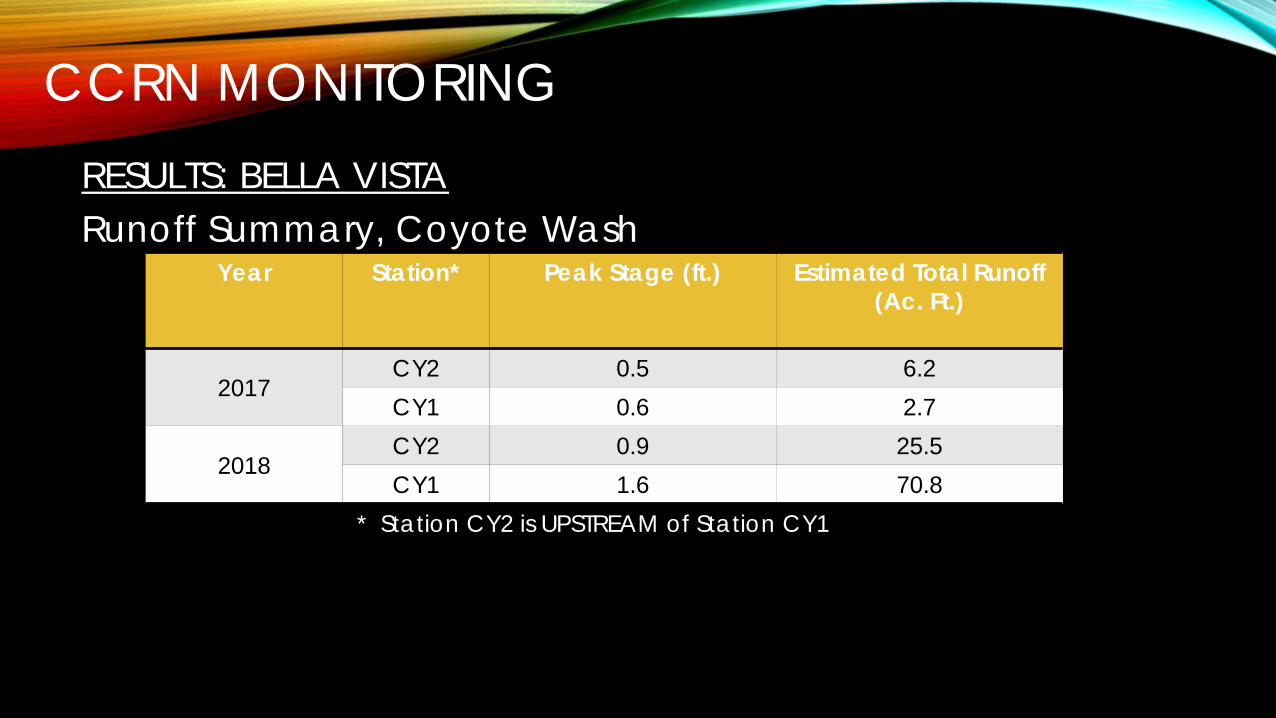
CCRN MONITORINGRESULTS: BELLA VISTARunoff Summary, Coyote Wash
Year Station* Peak Stage (ft.) Estimated Total Runoff (Ac. Ft.)
2017CY2 0.5 6.2CY1 0.6 2.7
2018CY2 0.9 25.5CY1 1.6 70.8
* Station CY2 is UPSTREAM of Station CY1
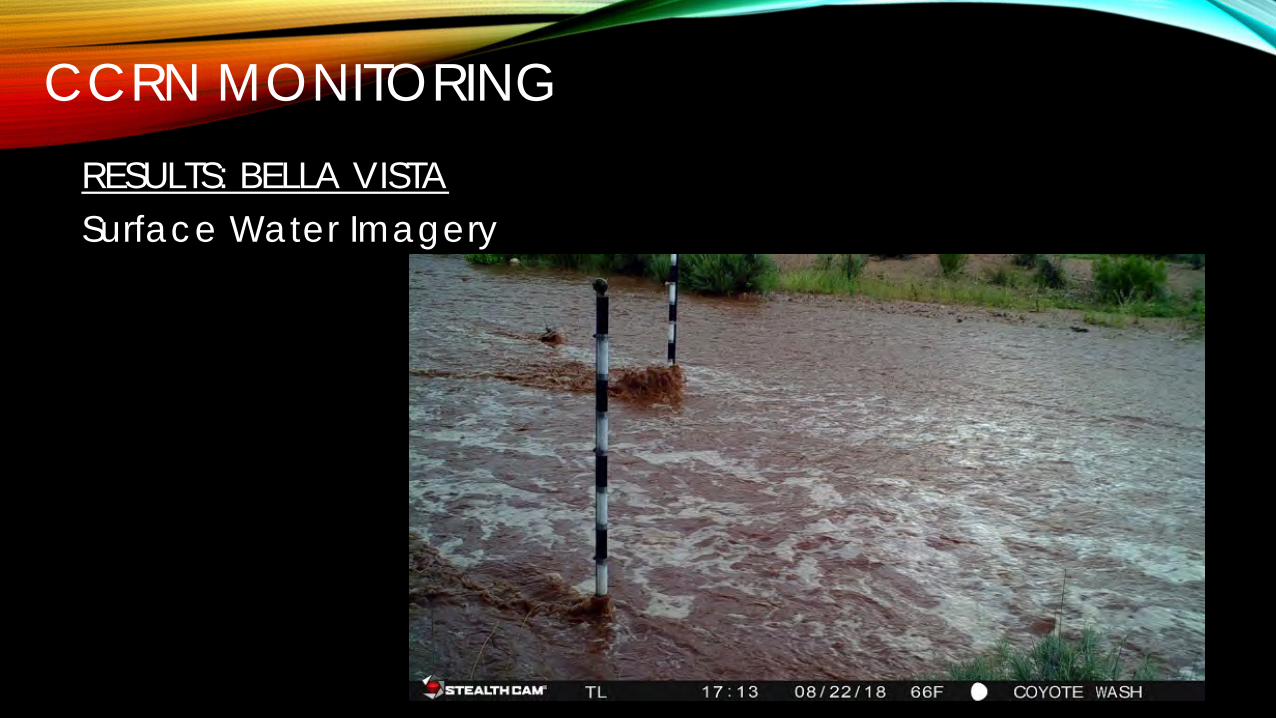
CCRN MONITORINGRESULTS: BELLA VISTASurface Water Imagery
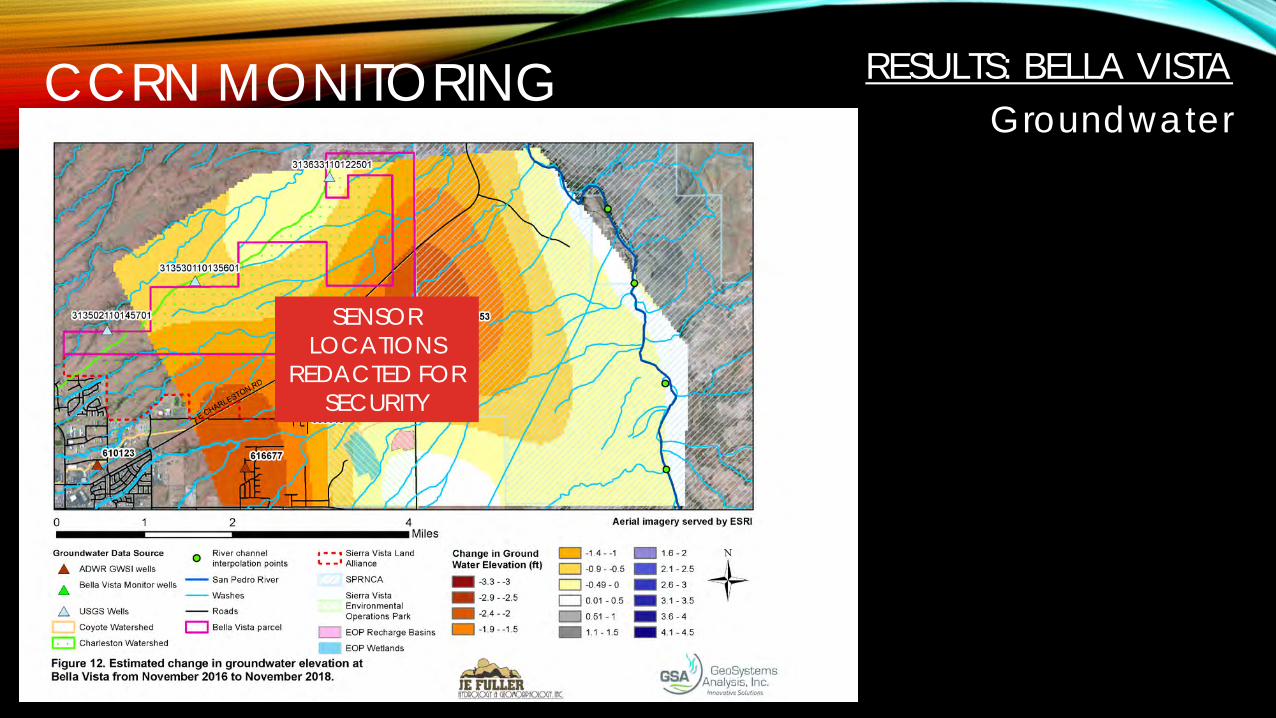
CCRN MONITORING RESULTS: BELLA VISTAGroundwater
SENSOR LOCATIONS
REDACTED FOR SECURITY

CCRN MONITORINGRESULTS: RIVERSTONEPrecipitation Summary
Year Precipitation Depth (in.)
Classificationbelow <10.3 in. average 19.1 in.<above
(NCDC 2012, 2015)2017 8.6 Dry2018 12.3 Average

CCRN MONITORINGRESULTS: RIVERSTONERunoff Summary, Carr, Ramsey Canyon, Golden Acres Wash
Year Station* Peak Stage (ft.) Estimated Total Runoff (Ac. Ft.)
2017
CC1 0.7 1.9SW-1 0.0 0.0SW-2 1.6 1.3SW-3 0.0 0.0
2018
CC1 0.8 31.9SW-1 1.3 1.1SW-2 1.3 3.5SW-3 0.0 0.0
*Station SW-2 is UPSTREAM of Station SW-3, which is UPSTREAM of Station CC1
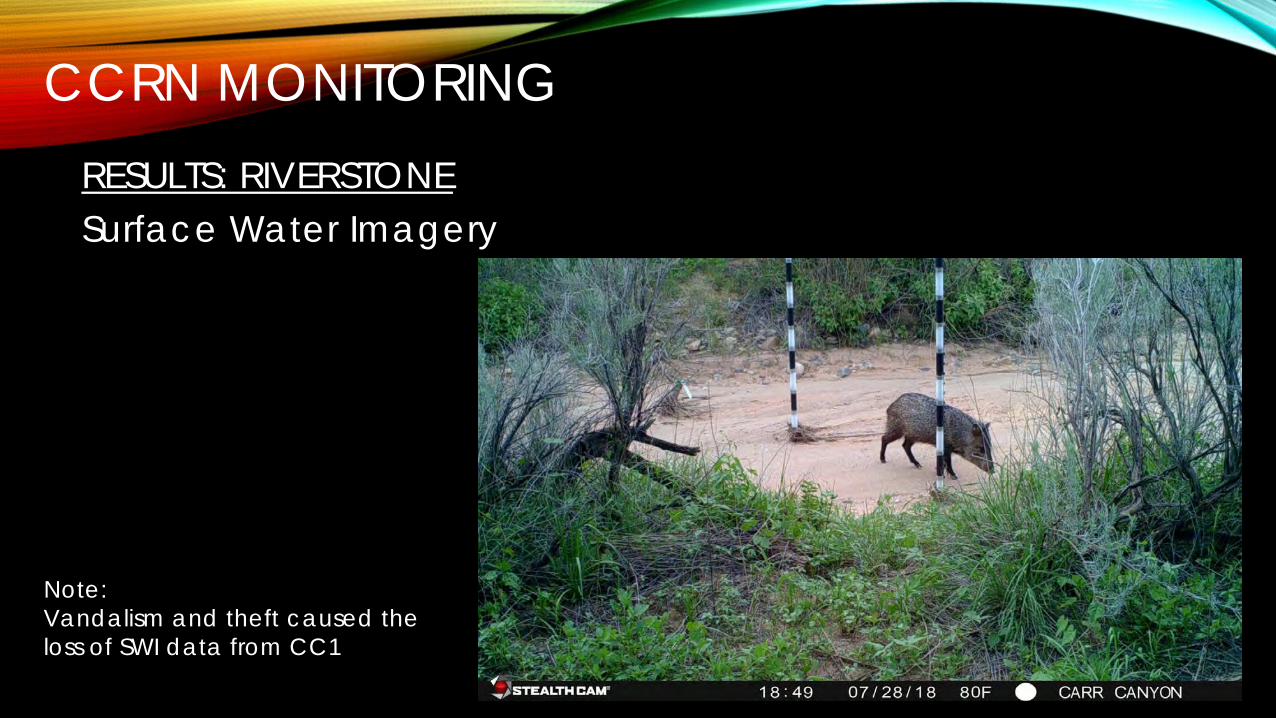
CCRN MONITORINGRESULTS: RIVERSTONESurface Water Imagery
Note:Vandalism and theft caused the loss of SWI data from CC1
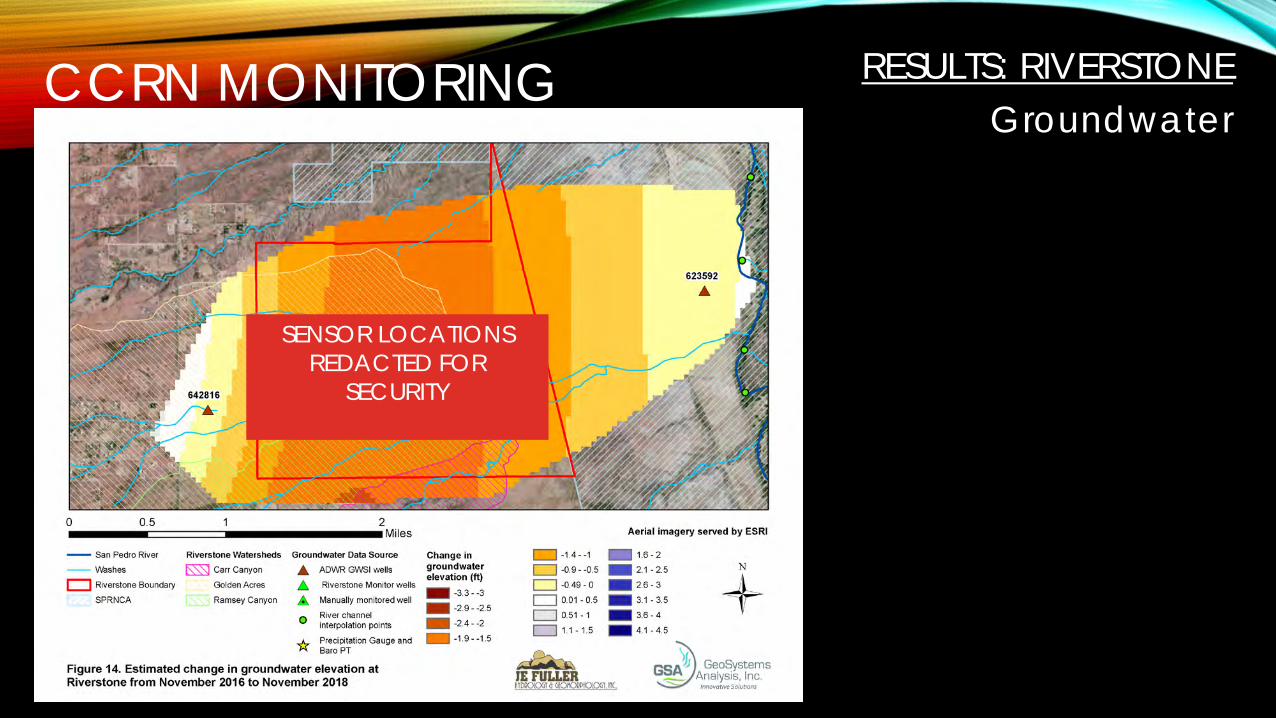
CCRN MONITORING RESULTS: RIVERSTONEGroundwater
SENSOR LOCATIONS REDACTED FOR
SECURITY
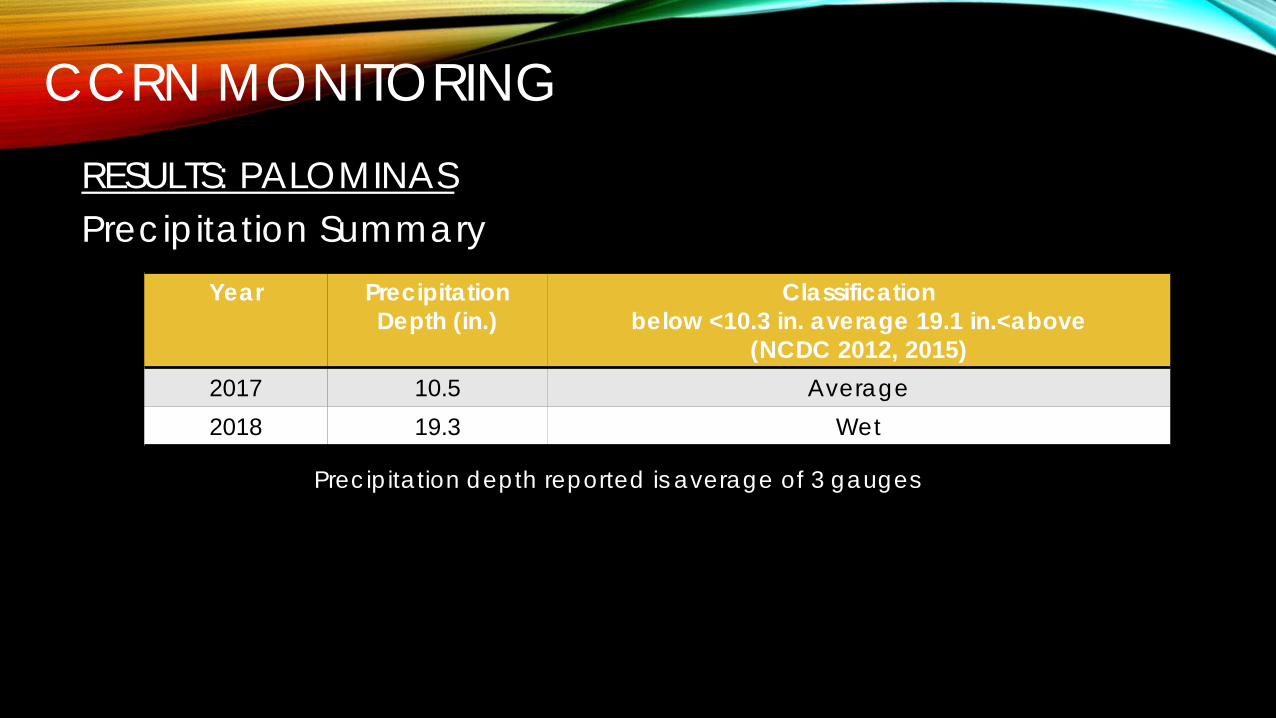
CCRN MONITORINGRESULTS: PALOMINASPrecipitation Summary
Year Precipitation Depth (in.)
Classificationbelow <10.3 in. average 19.1 in.<above
(NCDC 2012, 2015)2017 10.5 Average2018 19.3 Wet
Precipitation depth reported is average of 3 gauges

CCRN MONITORINGRESULTS: PALOMINASRunoff Summary, Schoolhouse Wash
Year Station* Peak Stage (ft.) Estimated Total Runoff (Ac. Ft.)
2017
KR-C1 0.5 3.4KR-C2 0.0 0.1
KR-RC2 0.7 36.3MV-1 1.3 4.4
2018
KR-C1 0.8 1.6KR-C2 0.5 6.0
KR-RC2 0.6 13.3MV-1 0.6 3.3
*Stations are listed UPSTREAM to DOWNSTREAM

CCRN MONITORINGRESULTS: PALOMINASSurface Water Imagery
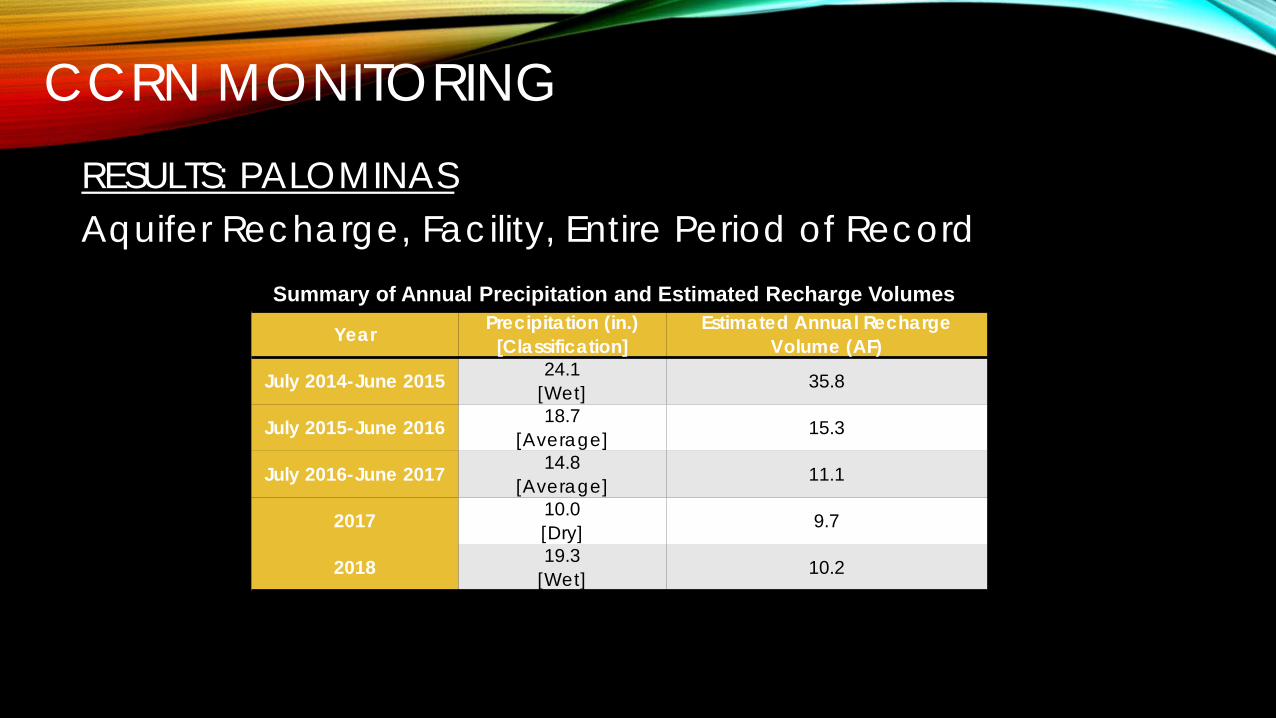
CCRN MONITORINGRESULTS: PALOMINASAquifer Recharge, Facility, Entire Period of Record
Year Precipitation (in.)[Classification]
Estimated Annual Recharge Volume (AF)
July 2014-June 2015 24.1[Wet] 35.8
July 2015-June 2016 18.7[Average] 15.3
July 2016-June 2017 14.8[Average] 11.1
2017 10.0[Dry] 9.7
2018 19.3[Wet] 10.2
Summary of Annual Precipitation and Estimated Recharge Volumes
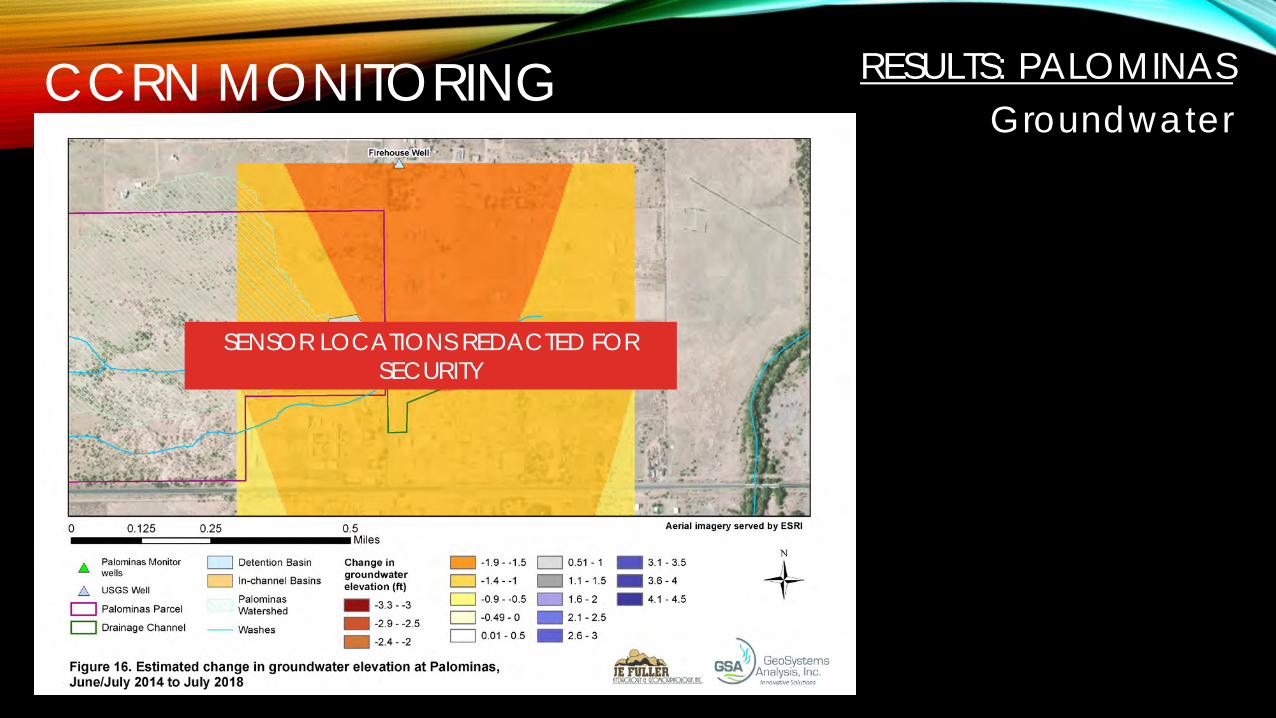
CCRN MONITORING RESULTS: PALOMINASGroundwater
SENSOR LOCATIONS REDACTED FOR SECURITY
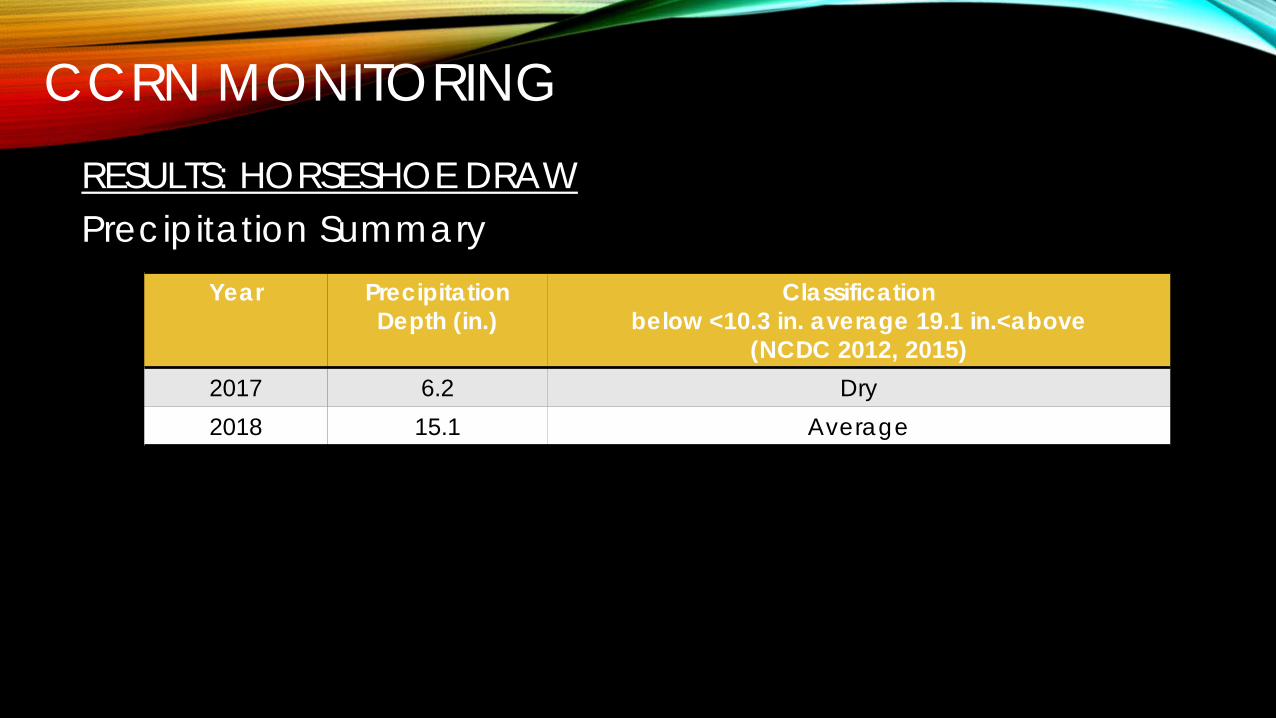
CCRN MONITORINGRESULTS: HORSESHOE DRAWPrecipitation Summary
Year Precipitation Depth (in.)
Classificationbelow <10.3 in. average 19.1 in.<above
(NCDC 2012, 2015)2017 6.2 Dry2018 15.1 Average
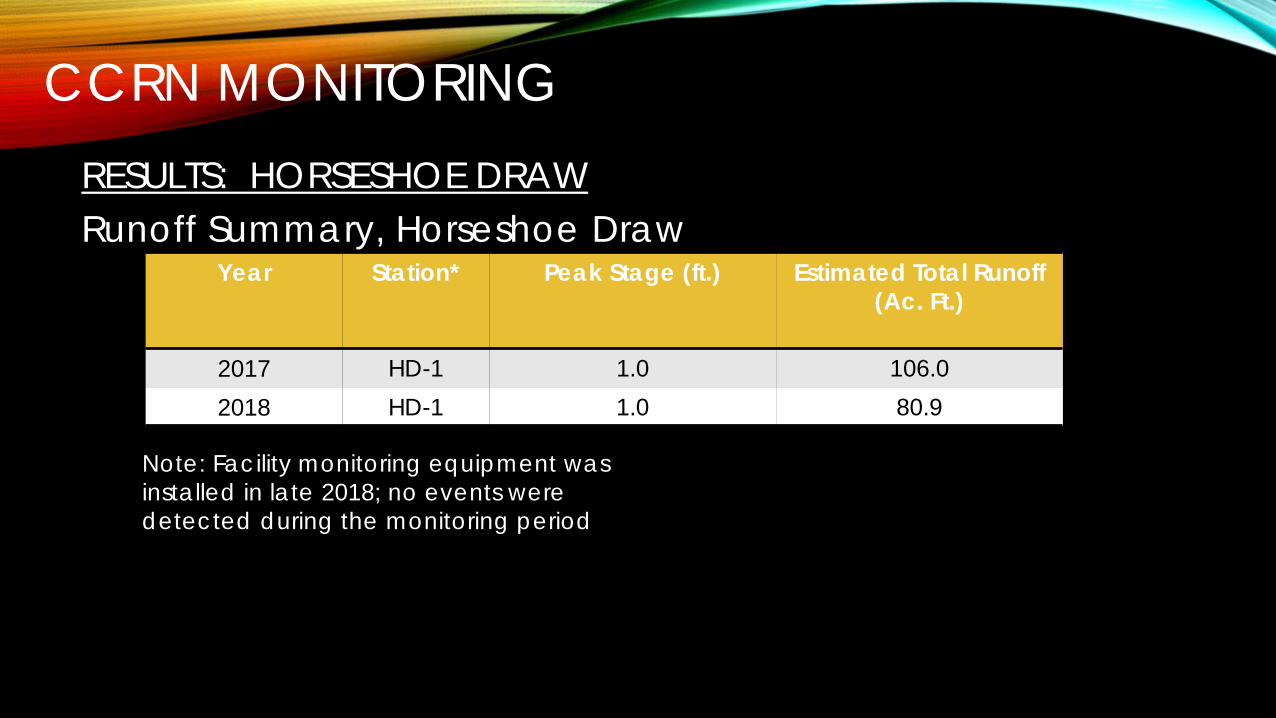
CCRN MONITORINGRESULTS: HORSESHOE DRAWRunoff Summary, Horseshoe Draw
Year Station* Peak Stage (ft.) Estimated Total Runoff (Ac. Ft.)
2017 HD-1 1.0 106.02018 HD-1 1.0 80.9
Note: Facility monitoring equipment was installed in late 2018; no events were detected during the monitoring period
CCRN MONITORINGCONCLUSIONS1. We are testing and refining different types of sensor/station
configurations and data analysis methods to detect and measure surface flows and groundwater conditions.
2. Periodic maintenance is required at all stations to counter equipment failure, damage and theft/vandalism.
3. Low amounts/intensities of rainfall yield low amounts of runoff. To speculate, continued low rainfall periods may cause very low antecedent moisture conditions and compound the low runoff response.
4. Many precipitation events produce little or no runoff detected at our stations.
5. Given the spatial and temporal distribution of precipitation events, some ephemeral streams my be considered influent (water losing).
CCRN MONITORINGCONCLUSIONS (CONT.)6. Groundwater levels generally declined over the monitoring period.7. Palominas recharge facility showed an increase (mound) in
groundwater elevations following Hurricane Odile (Sept. 2014) at monitoring wells near the facility, but followed regional declines thereafter.
8. Additional continued monitoring is recommended to provide a record from which hydrologic modeling methods can be refined.
CCRN MONITORINGSUMMARY*CCRN Hydrologic Monitoring and Modeling:• Precipitation and surface water flow monitoring from 2014-2018 demonstrates
variability in space and time of storms and corresponding runoff events across the Sierra Vista Subwatershed (different watercourses and project locations).
• Acknowledges that annual monitoring may estimate less runoff than models predict, however, the historical period of record data shows high flows have been observed at other locations in the Subwatershed.
• Observations suggest the need to build stormwater projects to take advantage of available water in the best predicted locations and downstream of the greatest magnitudes of runoff.
*Summary of topics discussed during and following the presentation
CCRN MONITORINGSUMMARY (CONT.)*CCRN Design Philosophy and Approach:• Uses the best available and economical methods to gather data and develop
predictive surface water models. • Includes reviews by the USPP Technical Committee. • Acknowledges that stormwater recharge facilities will remain dependent upon
precipitation rates which vary year to year, however, anticipates that recharge project benefits will be relevant over the long-term, regardless of annual local precipitation variability.
*Summary of topics discussed during and following the presentation