u.s. monetary policy: assessing strategy and effectiveness · multiple choice quiz ... '90...
TRANSCRIPT

1
U.S. Monetary Policy: Assessing Strategy and Effectiveness Norges Bank September 27, 2013
Charles L. Evans President and CEO Federal Reserve Bank of Chicago

Overview
1. Strategy for U.S. Monetary Policy
2. Have non-traditional policies at the ZLB been effective?
3. Monetary Policy, Financial Stability and Macro-Prudential policies

Section 1.
Strategy for U.S. Monetary Policy

Multiple Choice Quiz
The objective of Monetary Policy in the U.S. is to: – a. Mechanically adhere to a simple policy rule – b. Implement the popular monetary policy du jour – c. Provide financial and monetary conditions to
facilitate maximum employment and price stability – d. None of the above

Current Scorecard for the U.S.
Unacceptably high unemployment
Inflation is well below long-run inflation objective
Simple policy rules break down at ZLB

Understanding U.S. Monetary Policy
Possible Strategies – Business as usual – Not business as usual at the ZLB
Can require some unpopular monetary policies
Central Bank independence is crucial. If independence means anything… – Pursue best policies to meet statutory objectives – No matter how unpopular [cf Volcker Fed] – And be held accountable to democratically elected officials

1.5
2.0
2.5
2013 2014 2015 2016 2017 2018 2019 2020
Expected Inflation for 2020-2023 (as of 2020)
90
100
110
120
2007 2009 2011 2013 2015
Total PCE Price Index (level)
2% Price-Line from December 2007
Expected Future Three-Year Ahead Inflation (percent)
Total PCE
Source: Inflation forecasts are from the September 18, 2013 FOMC Summary of Economic Projections
Dec. 2007
What if There Was a Single Mandate in U.S.?
Path Implied by Current FOMC Inflation Forecasts
Source: FRB-Chicago Staff Models
Expected Inflation for 2013-2016 (as of 2013)

Long-Run Strategy for Monetary Policy (January 2012 and January 2013)
π* = 2% PCE inflation
Ut* ~ 5¼% - 6% time-varying
SEP long-run central tendency
Balanced approach to reducing deviations of inflation
and employment from long-run objectives

Balanced Approach to the Dual Mandate is Consistent with Mainstream Macroeconomics Loss Function (percent)
L = (π - π*)2 + 0.25 (y – y*)2
L = (π - 2)2 + (u – un)2
FOMC Forecast (September 18, 2013)
Current Value
u=9%
September 2011 value
π=5.5%
2015 2014

0
1
2
3
4
5
6
2011 2012 2013 2014 2015 2016 2017 2018
Taylor Rules: Rt = 2.0 + πt + 0.5(πt – 2) + α gapt Taylor 1999: α = 1.0 Taylor 1993: α = 0.5
Optimal Control: Min (πt – 2)2 + (ut - un )2 + ΔRt
2
The Problem is the Zero Lower Bound Federal Funds Rate (percent)
Optimal Control Taylor 1999 Taylor 1993
Source: Janet L. Yellen, “Perspectives on Monetary Policy,” Boston, June 6 2012

Asset Purchases: The Fed’s Balance Sheet Federal Reserve Assets (Bils. $)
0
500
1000
1500
2000
2500
3000
3500
4000
2007 2008 2009 2010 2011 2012 2013
All Other Assets ($304.8 bil.) Treas. Sec ($2,038.3 bil.) Agency Debt ($64.4 bil.)
Agency MBS ($1,291.5 bil.) Lending and Liquidity Facilities ($2.2 bil.)
11-Sep-2013W

Forward Guidance on the Federal Funds Rate
December 2012: “Economic conditions likely to warrant
exceptionally low level of the funds rate at least as long as
the unemployment rate remains above 6-1/2 percent,
inflation between one and two years ahead is projected to be
no more than a half of a percentage point above the
Committee’s 2 percent long-run goal, and longer-term
inflation expectations continue to be well-anchored.”

0
1
2
3
4
5
6
2013 2014 2015 2016 Long-Run
Taylor '93 Inertial Taylor '99 6.5% threshold, then inertial Taylor '99
Mkt. Exp: 2014 Q4: 0.30 2015 Q4: 0.91 2016 Q4: 1.76
FG and FOMC “Appropriate” Policy Rates
Source: Interest rate forecasts are from the September 18, 2013 FOMC Summary of Economic Projections; market expectations from OIS futures, September 19, 2013
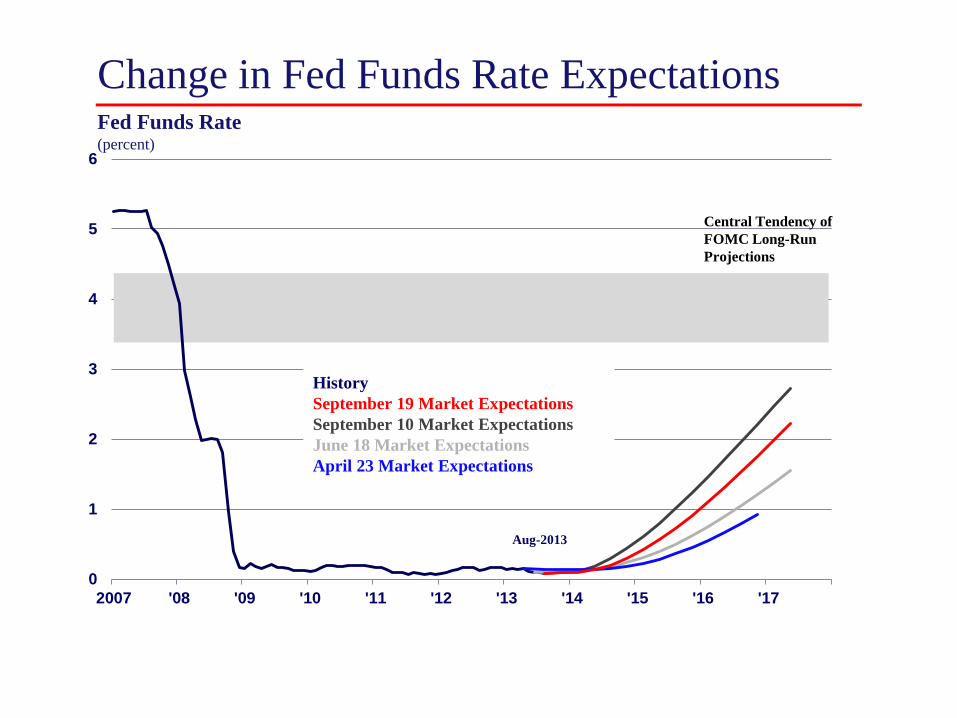
0
1
2
3
4
5
6
2007 '08 '09 '10 '11 '12 '13 '14 '15 '16 '17
Central Tendency of FOMC Long-Run Projections
Fed Funds Rate (percent)
Change in Fed Funds Rate Expectations
History September 19 Market Expectations September 10 Market Expectations June 18 Market Expectations April 23 Market Expectations
Aug-2013

Section 2.
Have non-traditional policies at the ZLB been effective?

Policy Evaluation Common op-ed page policy evaluation:
– “After $3+ trillion of asset purchases and all this forward guidance, there has been no effect on the economic recovery. Therefore nontraditional monetary policy has been impotent.”
Standard economic policy evaluation: – What does economic theory say? – What do the data say? – Have all important factors been accounted for in the data
analysis? (controls) – What assumptions are required for this evaluation to be
meaningful?

Reviewing Data: Facts About Growth
1. Private domestic final purchases
2007:Q4 to
2009:Q2
2009:Q2 to
2010:Q4
2010:Q4 to
2013:Q2
GDP -2.9 2.7 1.9 Contribution to growth: PDFP1 -3.8 2.1 2.3 Gov 0.7 -0.1 -0.5 NX 1.2 -0.5 0.1 CBI -1.0 1.2 0.0
(percent change at an annual rate and contribution to annualized percent change)

Headwinds Contributing to Weak recovery
Fiscal
International
Hangover from housing collapse

Federal + State and Local Purchases Weak
-0.75
-0.5
-0.25
-2E-15
0.25
0.5
0.75
2008 '09 '10 '11 '12 '13
Federal State and Local
Government Contributions to Real GDP Growth (percent)

Historically Unusual
-1
0
1
2
3
1965 '70 '75 '80 '85 '90 '95 2000 '05 '10
Government Contributions to Real GDP Growth (percent)
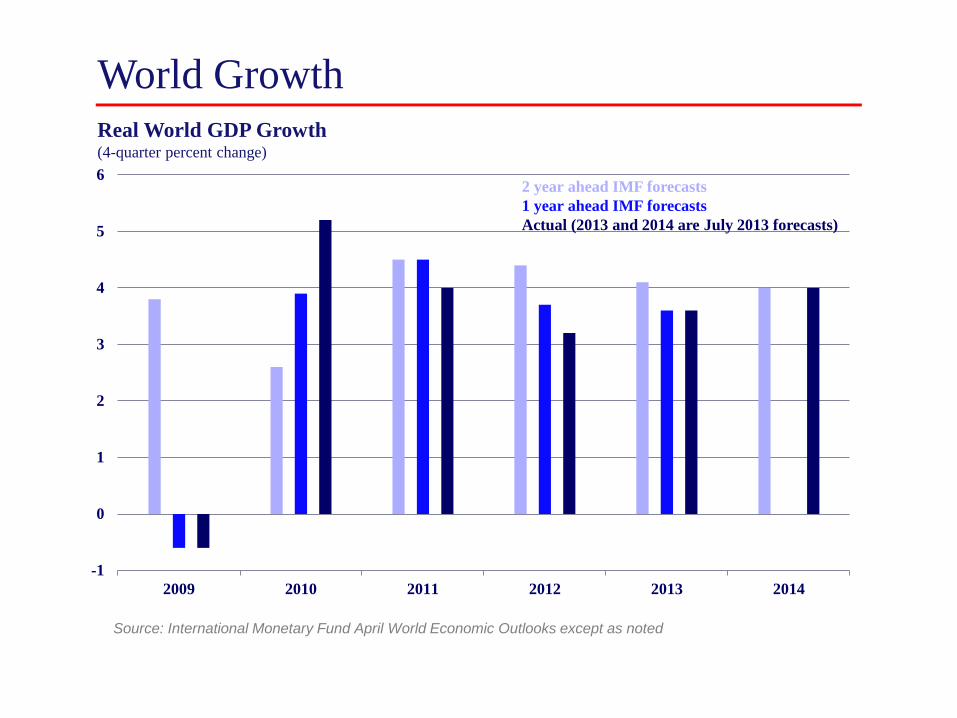
World Growth Real World GDP Growth (4-quarter percent change)
-1
0
1
2
3
4
5
6
2009 2010 2011 2012 2013 2014
2 year ahead IMF forecasts 1 year ahead IMF forecasts Actual (2013 and 2014 are July 2013 forecasts)
Source: International Monetary Fund April World Economic Outlooks except as noted

European Sovereign Debt Spreads
0
5
10
15
20
25
30
2006 '07 '08 '09 '10 '11 '12 '13
France Italy Greece
(spread to German long-term rates)

0
30
60
90
120
150
1975 '80 '85 '90 '95 '00 '05 '10
Owners’ Equity (% of household real estate)
Household Deleveraging Household Liabilities (% of DPI)
Home Mortgages Consumer Credit Other Debt
Q1-2013
30
40
50
60
70
80
1975 '80 '85 '90 '95 2000 '05 '10
Q1-2013

Volatility in Treasury Rates also Informs Economic Factors for Growth
0.75
1.50
2.25
3.00
3.75
4.50
2008 '09 '10 '11 '12 '13
Ten-Year Treasury Bond Yield (percent)
QE 1 Swap lines Jackson Hole QE 2
Debt limit showdown MEP QE 3 JEC

LSAP Effects Wide range of estimates regarding the effect of LSAP on Treasury
rates through – Portfolio balance effect on term premia – Signaling effect on expected future short-term rates
Reasonable estimate is $500 billion of LSAP worth about 25 bps on 10-year Treasury rates

Empirical Facts about Term Premia
Source: Ben Bernanke, “Long-Term Interest Rates,” San Francisco, March 1, 2013

Lessons from the 10-Year Treasury Rate
Change in rates and term premia are larger than what can be explained by reasonable estimates of portfolio balance and forward guidance
Many factors influenced 10-year Treasury rates – Is it plausible that these and other factors had “no effect” on
growth and inflation experience in U.S.? (importance of controls)
We need counterfactual accounting – First class in Econ 101: supply and demand equilibrium – Second class in Econ 101: comparative statics
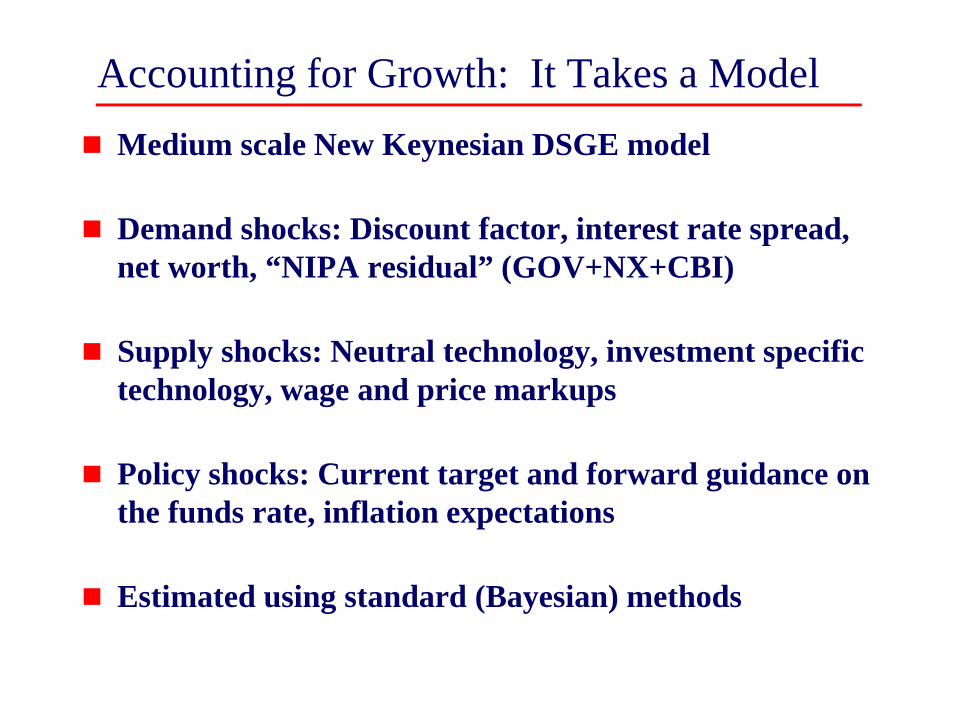
Accounting for Growth: It Takes a Model Medium scale New Keynesian DSGE model
Demand shocks: Discount factor, interest rate spread, net worth, “NIPA residual” (GOV+NX+CBI)
Supply shocks: Neutral technology, investment specific technology, wage and price markups
Policy shocks: Current target and forward guidance on the funds rate, inflation expectations
Estimated using standard (Bayesian) methods

Forward Guidance: Theory and Evidence
Bedrock principle for Monetary Policy: lower rates
support higher economic activity
At the ZLB, does forward guidance lower rates and
increase activity?

Effects of Forward Guidance Estimates from Chicago FED DSGE model

DSGE Model Forecasts of GDP

2008Q1-2009Q2: Great Recession
Conditional Forecast Error Decomposition Demand Policy Total
GDP -8.1 -3.2 -13.4 Consumption -8.2 -1.5 -12.4 Core PCE Inflation -5.4 1.2 -3.0 Federal funds rate -7.9 1.2 -7.5 Percentage point errors in forecasts made in 2007:Q4 for the 2009:Q2: level of GDP and consumption; quarterly percent change (annual rate) in core PCE; quarterly-average federal funds rate.
• Severe downturn for all macro variables compared against expected solid growth for the period.
• Weak Demand drove downturn, particularly the discount factor/beta shock
• Contractionary target and FG policy shocks also a drag on GDP owing to ZLB.

2008Q1-2009Q2: Great Recession
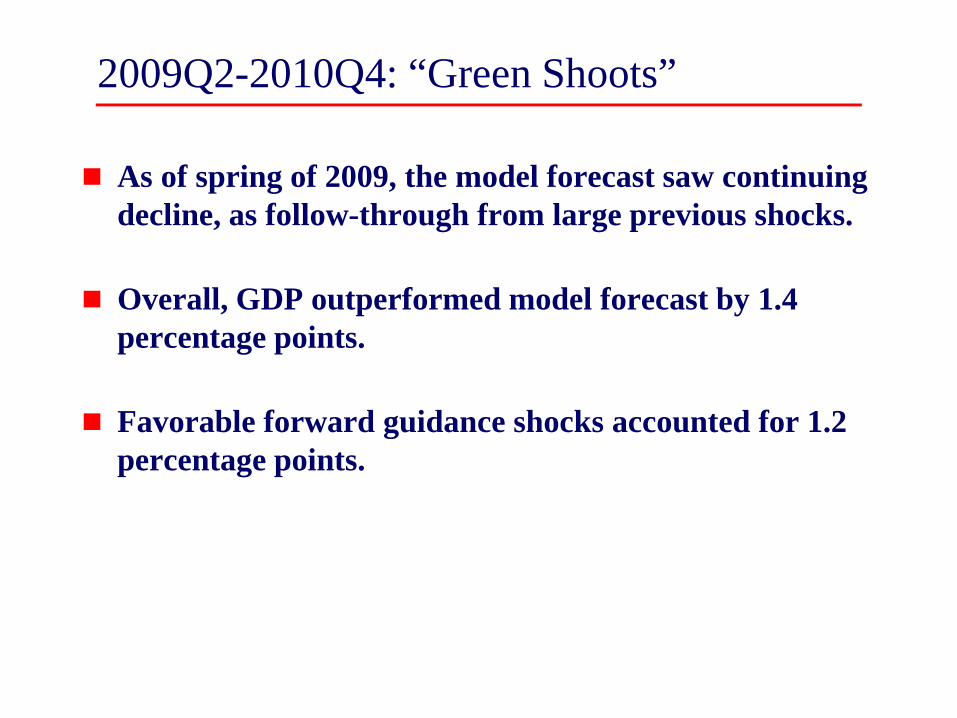
2009Q2-2010Q4: “Green Shoots”
As of spring of 2009, the model forecast saw continuing decline, as follow-through from large previous shocks.
Overall, GDP outperformed model forecast by 1.4 percentage points.
Favorable forward guidance shocks accounted for 1.2 percentage points.

2009Q2-2010Q4: “Green Shoots”

2011Q1-2013Q1: Massive Headwinds Conditional Forecast Error Decomposition
Demand Policy Total GDP -2.1 1.0 -5.1 Consumption 0.9 0.4 -0.6 Core PCE Inflation -0.8 0.4 0.6 Federal funds rate -1.6 -0.2 -1.1 Percentage point errors in forecasts made in 2010:Q4 for the 2013:Q1: level of GDP and consumption; quarterly percent change (annual rate) in core PCE; quarterly-average federal funds rate.
• Model forecast more robust recovery; but output actually fell relative to trend.
• Adverse demand and supply shocks contribute substantially to weak GDP.
• Principle demand shock was model NIPA residual (GOV+NX+CBI).
• Policy shocks offset 1 percentage point of adverse shocks; but past policy shocks also provided uplift for conditional forecast.

2011Q1-2013Q1: Massive Headwinds
Section 3.
Monetary Policy, Financial Stability and Macro-Prudential policies

MP and Financial Stability: Mandates and Tools Tensions from low interest rates
– Appropriate MP accommodation at ZLB – Incentivize additional risk-taking: cross-current
Degrading MP tools to mitigate Financial Instability risks would lead to inflation below target and additional resource slack.
In order to avoid excess risk-taking, use combination of Supervisory oversight, macro-prudential tools (separate from MP tools), and Market Discipline