us pe & vc ipo trends - pitchbookfiles.pitchbook.com/pdf/pitchbook_2016_us_pe_vc_ipo...pe ipo...
TRANSCRIPT
PE IPO activity Analysis of trends in IPO count
and capital raised over recent
years. Page 7
2016 REPORT
In partnership with
US PE & VCIPO TRENDS
VC prior to IPO Breakdowns of VC activity before
public debuts. Page 10
IPO pipeline Tables of upcoming
PE & VC-backed IPOs. Page 16

Credits & ContactPitchBook Data, Inc.
JOHN GABBERT Founder, CEO
ADLEY BOWDEN Vice President,
Market Development & Analysis
Content
NIZAR TARHUNI Senior Analyst
KYLE STANFORD Analyst
DYLAN COX Analyst
ELIZABETH ARMON Analyst
BRYAN HANSON Data Analyst
JENNIFER SAM Senior Graphic Designer
Contact PitchBook pitchbook.com
RESEARCH
EDITORIAL
SALES
COPYRIGHT © 2016 by PitchBook Data, Inc. All rights reserved. No part of this publication may be reproduced in any form or by any means—graphic, electronic, or mechanical, including photocopying, recording, taping, and information storage and retrieval systems—without the express written permission of PitchBook Data, Inc. Contents are based on information from sources believed to be reliable, but accuracy and completeness cannot be guaranteed. Nothing herein should be construed as any past, current or future recommendation to buy or sell any security or an offer to sell, or a solicitation of an offer to buy any security. This material does not purport to contain all of the information that a prospective investor may wish to consider and is not to be relied upon as such or used in substitution for the exercise of independent judgment.
Contents
Introduction 4
Overview 5-6
PE IPOs: Activity 7
PE IPOs: Metrics 8
PE IPOs: Sector 9
VC Prior to IPO 10
VC IPOs: Activity 11
VC IPOs: Metrics 12
VC IPOs: Sector 13
IPO pricing & window 14-15
IPO pipeline 16
Methodology 17
3 PITCHBOOK 2016 PE & VC IPO TRENDS REPORT
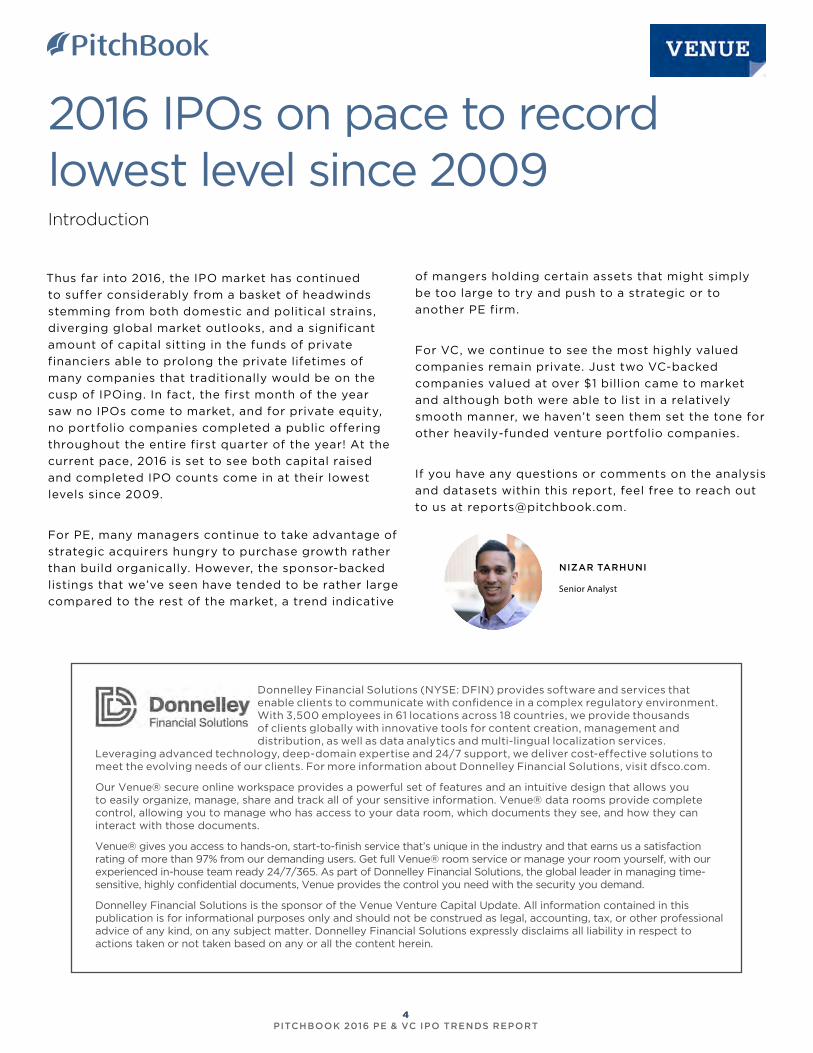
2016 IPOs on pace to record lowest level since 2009Introduction
Donnelley Financial Solutions (NYSE: DFIN) provides software and services that enable clients to communicate with confidence in a complex regulatory environment. With 3,500 employees in 61 locations across 18 countries, we provide thousands of clients globally with innovative tools for content creation, management and distribution, as well as data analytics and multi-lingual localization services.
Leveraging advanced technology, deep-domain expertise and 24/7 support, we deliver cost-effective solutions to meet the evolving needs of our clients. For more information about Donnelley Financial Solutions, visit dfsco.com.
Our Venue® secure online workspace provides a powerful set of features and an intuitive design that allows you to easily organize, manage, share and track all of your sensitive information. Venue® data rooms provide complete control, allowing you to manage who has access to your data room, which documents they see, and how they can interact with those documents.
Venue® gives you access to hands-on, start-to-finish service that’s unique in the industry and that earns us a satisfaction rating of more than 97% from our demanding users. Get full Venue® room service or manage your room yourself, with our experienced in-house team ready 24/7/365. As part of Donnelley Financial Solutions, the global leader in managing time-sensitive, highly confidential documents, Venue provides the control you need with the security you demand.
Donnelley Financial Solutions is the sponsor of the Venue Venture Capital Update. All information contained in this publication is for informational purposes only and should not be construed as legal, accounting, tax, or other professional advice of any kind, on any subject matter. Donnelley Financial Solutions expressly disclaims all liability in respect to actions taken or not taken based on any or all the content herein.
NIZAR TARHUNI
Senior Analyst
Thus far into 2016, the IPO market has continued
to suffer considerably from a basket of headwinds
stemming from both domestic and political strains,
diverging global market outlooks, and a significant
amount of capital sitting in the funds of private
financiers able to prolong the private lifetimes of
many companies that traditionally would be on the
cusp of IPOing. In fact, the first month of the year
saw no IPOs come to market, and for private equity,
no portfolio companies completed a public offering
throughout the entire first quarter of the year! At the
current pace, 2016 is set to see both capital raised
and completed IPO counts come in at their lowest
levels since 2009.
For PE, many managers continue to take advantage of
strategic acquirers hungry to purchase growth rather
than build organically. However, the sponsor-backed
listings that we’ve seen have tended to be rather large
compared to the rest of the market, a trend indicative
of mangers holding certain assets that might simply
be too large to try and push to a strategic or to
another PE firm.
For VC, we continue to see the most highly valued
companies remain private. Just two VC-backed
companies valued at over $1 billion came to market
and although both were able to list in a relatively
smooth manner, we haven’t seen them set the tone for
other heavily-funded venture portfolio companies.
If you have any questions or comments on the analysis
and datasets within this report, feel free to reach out
to us at [email protected].
4 PITCHBOOK 2016 PE & VC IPO TRENDS REPORT

Overview
Despite a recent wave of IPO pricings
giving rise to speculation regarding the
IPO window opening, 2016 collectively
paints a very different picture. Three
quarters through the year, just $7.2
billion was raised across 49 PE and
VC-backed public offerings, reflecting
declines of roughly 49% and 48%,
respectively, relative to the same
period last year. At the current pace,
2016 is set to see both total IPO capital
raised and volume come in at their
lowest levels since 2009, which saw
just over $9 billion raised via 36 public
listings.
With an abundance of capital available
from both PE and venture investors,
the incentives to move forward with
a costly public listing simply aren’t
there, especially when you couple the
rich dry powder environment with an
uncertain global economic, business,
political and exit landscape. Public
flotations tend to perform better
during times where the public markets
are stable and moving consistently
higher, and while equities in the US are
Source: PitchBook
$2 $5 $2 $4 $11
$5 $2 $5 $5 $20
$3 $4 $4 $8 $5 $17
$9 $13
$4 $9 $2 $8 $5 $5 $4 $3
19
26
17
29
22
26
1822
40
23
24
19
22
43
41
49
55 54
36
54
21
46
28
22
6
20 23
1Q 2Q 3Q 4Q 1Q 2Q 3Q 4Q 1Q 2Q 3Q 4Q 1Q 2Q 3Q 4Q 1Q 2Q 3Q 4Q 1Q 2Q 3Q 4Q 1Q 2Q 3Q
2010 2011 2012 2013 2014 2015 2016
Capital Raised ($B) IPO Count
$20
$24
$4 $9 $13
$24
$31
$34
$35
$19
$7
130
144
2836
91
88106
155
199
117
49
2006 2007 2008 2009 2010 2011 2012 2013 2014 2015 2016*
Capital Raised ($B) IPO Count
up YTD, we continue to remain a bit
confused around the main drivers of
equities in this environment. Earnings
and revenue growth have remained
less than optimal, and economists
continue to forecast slow GDP growth,
but the markets have fought off just
about all signs of adversity, whether
those be concerns around monetary
policy, the UK referendum or even the
surprising results of the US presidential
election. On a relative basis, US
equities have certainly outperformed
the bulk of European and Asian stock
markets in 2016, so while at first glance
US public markets may look well
US IPO activity by year
US PE and VC-backed IPO activity by quarter
Source: PitchBook
*As of 9/30/2016
5 PITCHBOOK 2016 PE & VC IPO TRENDS REPORT

The average offering size has fallen for the 4th consecutive year
Median and average offering size of US IPOs
Source: PitchBook
*As of 9/30/2016
0%
10%
20%
30%
40%
50%
60%
70%
80%
90%
100%
2005
2006
2007
2008
2009
2010
2011
2012
2013
2014
2015
2016
*
High
In Range
Low
Over 60% of filings are being priced within their expected range
% of US IPOs pricing above, within and below expected price range
Median ($M)
Average ($M)
$100
$88
$90
$187$163
$148
$0
$50
$100
$150
$200
$250
$300
$350
2006 2007 2008 2009 2010 2011 2012 2013 2014 2015 2016*
suited to handle new listings, we think
a notable driver of US stocks today
stems from an investor base that has
looked to avoid the turbulence we’ve
seen in foreign equities. With that in
mind, companies looking to list will
need to prove to institutional investors
that despite the sluggish macro
environment we highlighted above,
they have the stewardship, capital
expenditure discipline and ultimately
the business model to continue driving
growth and profitability in a slower-
moving market.
One trend we’ve noted when looking
at private financings, especially on
the PE side, has been the split in
the quality of companies PE firms
have chased. The result of this can
be seen in the heightened multiples
PE continues to pay to close deals,
however there continues to remain
a group of second-tier companies
that simply can’t garner the multiples
we’ve seen in recent years. We think
we’ve noticed a similar occurrence
in the IPO markets today. Through
the third quarter of 2016, just under
12% of companies priced at the high
end of their respective IPO range, yet
we saw a rather impressive 60% of
companies hit their target range, the
highest figure we’ve seen since 2008,
which saw nearly 67% of companies
do that. Further, 28% of companies to
list this year priced at the low end of
their range, slightly less than the 30%
and 35% figures we saw in 2015 and
2014, respectively. While total IPO
activity has remained subdued, the
quality of companies willing to move
forward with a public flotation appears
to be improving and such companies
have had success completing offerings
efficiently.
The rest of 2016 might be marked by
continued uncertainty, yet as investors
continue to adjust to a changing
dynamic that involves a new president
in place, along with a potential new
wave of venture-backed companies
prepping to test the markets in 2017,
we’ll begin to gain a better picture of
where institutional investor appetite
lies for new offerings. Performance
on the secondary markets will also be
important to monitor, and that also
applies to listings that see significant
pops in their newly traded stock. While
Twilio was able to come to market and
hold a successful IPO, the fact that
their stock traded up close to 300%
within one month of listing should be
looked at from a couple of different
angles. Primarily, we should credit
the company for standing out and
attracting significant interest, yet we
also think that stock could have been
underpriced by its advisors. With little
IPO activity for bankers to benchmark
against at the moment, the task of
marketing and pitching companies to
institutional investors understandably
may come with significant uncertainty.
To say the least, syndicate desks
will have their hands full finding the
adequate equilibrium in terms of
offering price for future listings next
year.
Source: PitchBook
*As of 9/30/2016
6 PITCHBOOK 2016 PE & VC IPO TRENDS REPORT

$16
$16
$4 $8 $10
$18
$10
$25
$25
$11
$5
71 59
1826
49
42 45
67
78
41
18
2006 2007 2008 2009 2010 2011 2012 2013 2014 2015 2016*
Capital Raised ($B) IPO Count
PE IPOs: Activity
Through the first three quarters of
2016, PE-backed companies accounted
for 37% of IPOs, which is about the
same as 2015, but well below the
portion we saw for most of the last
decade. For comparison, PE-backed
companies made up 72% of US IPOs
in 2009, a number which has declined
fairly consistently since.
18 PE-backed IPOs have been
completed this year, raising a total of
$5 billion, on track for the slowest year
we’ve seen since 2008 in terms of both
the number of IPOs and the funds that
they raise. About half of the capital
raised this year ($2.4 billion) has been
concentrated in the offerings of just
three companies: commercial kitchen
supplier US Foods, pharmaceutical
developer Patheon, and hotel and
casino operator Red Rock Resorts.
Two of these three, US Foods and Red
Rock Resorts either have completed
or are in talks to complete a debt
refinancing post-IPO, a move not
uncommon with companies who have
recently gone public and subsequently
Source: PitchBook
*As of 9/30/2016
$2 $4 $1 $3 $10
$3 $2 $2 $3 $3 $2 $2 $3 $6 $3 $13
$6 $11
$3 $6 $5 $2 $3 $3 $2
9
14
9
17
11 1110 10
18
10
11
6
12
18
12
25
15
27
12
24
6
16
12
7
0
9 9
1Q 2Q 3Q 4Q 1Q 2Q 3Q 4Q 1Q 2Q 3Q 4Q 1Q 2Q 3Q 4Q 1Q 2Q 3Q 4Q 1Q 2Q 3Q 4Q 1Q 2Q 3Q
2010 2011 2012 2013 2014 2015 2016
Capital Raised ($B) IPO Count
US PE-sponsored IPO activity by year
have easier access to the full range of
capital markets.
On a quarterly basis, PE-backed IPOs
have fared better in recent months
than the annual data would suggest.
After a grand total of zero IPOs in the
first quarter, both 2Q and 3Q of this
year produced nine IPOs each—still
far from the record numbers put up
in 2013-2014, but more of a reversion
to the mean rather than a complete
vanishing act.
US PE-sponsored IPO activity by quarter
Source: PitchBook
7 PITCHBOOK 2016 PE & VC IPO TRENDS REPORT

PE IPOs: Metrics
The median offering size for PE-
backed IPOs has come in at $183
million, slightly down from the $186
million number we saw in 2015, yet
relatively high on a historical basis.
Compared to the entire IPO market,
PE-backed offerings raised more than
double the $90 million median we saw
when taking a look at the offering size
from both VC and PE-backed raises.
Larger raises are to be expected
from PE-backed businesses due to
the nature of where these companies
typically lie in their lifecycles. Where
venture capitalists back earlier-stage
companies, PE sponsors can many
times be operating companies that
are multiple decades old. The mature
nature of these businesses culminates
in a group of companies that have
been able to grow their revenues and
respective businesses over a much
longer period. Thus, while PE has
potentially been able to help such
companies boost margins and drive
cash flows, the sheer size of these
companies results in larger capital
raising requirements.
At $863 million, the median
postvaluation of PE-backed companies
completing public listings this year
came in at the highest level we’ve
seen since at least 2005. Although
many sponsors have had success
selling smaller portfolio companies
to other PE counterparts, as well as
to strategics looking to put money to
work acquiring PE-backed companies,
the bulk of that activity occurs along
the core middle market. Moving
forward, sponsor-backed IPOs won’t
likely increase dramatically, yet the
ones that come forward will typically
lay at the upper end of the size
spectrum and thus, offering sizes and
postvaluations should stay high.
PE-sponsored offering sizes show little change over 2015
Median and average offering size of PE-sponsored IPOs
Source: PitchBook
*As of 9/30/2016
PE IPO postvaluations fall for third consecutive year
Median and average IPO postvaluation
Source: PitchBook
*As of 9/30/2016
Median ($M)
Average ($M)
$199
$186
$183
$360
$270 $277
$0
$100
$200
$300
$400
$500
2006 2007 2008 2009 2010 2011 2012 2013 2014 2015 2016*
Median ($M)
Average ($M)
$762
$643
$896
$1,689
$1,361$1,295
$0
$500
$1,000
$1,500
$2,000
$2,500
2006 2007 2008 2009 2010 2011 2012 2013 2014 2015 2016*
8 PITCHBOOK 2016 PE & VC IPO TRENDS REPORT

PE IPOs: Sector
Source: PitchBook
*As of 9/30/2016
B2B has accounted for 25% of all PE-sponsored offerings
% of PE-sponsored IPO activity by sector
Source: PitchBook
*As of 9/30/2016
0%
10%
20%
30%
40%
50%
60%
70%
80%
90%
100%
2006
2007
2008
2009
2010
2011
2012
2013
2014
2015
2016
*
B2B
B2C
Energy
FinancialServices
Healthcare
IT
Materials &Resources
More than 20% of capital raised in IPOs has gone into healthcare
% of IPO capital raised by sector
0%
10%
20%
30%
40%
50%
60%
70%
80%
90%
100%
2006
2007
2008
2009
2010
2011
2012
2013
2014
2015
2016
*
B2B
B2C
Energy
FinancialServices
Healthcare
IT
Materials &Resources
In a year with very few initial public
offerings in the US, the normal
distribution of capital raised by
industry has landed far from the
norm. In the first three quarters
of the year, there were no IPOs
in the IT, energy or materials &
resources sectors. The void of
offerings was expected in the
energy and materials segments,
due to the sustained depression
in commodities prices and lack
of investor confidence that those
prices will recover anytime soon.
In these two sectors, we have seen
more bankruptcies and divestitures
instead of IPOs. The dearth of
offerings by IT companies, however,
is not so easily explained. After the
IPOs of PE-backed companies like
GoDaddy and First Data in 2015,
as well as the heightened interest
in the IT sector shown by PE firms
this year, we expected to see
more tech IPOs in recent quarters.
That being said, the October IPOs
by fintech developer BlackLine
Systems and exploration company
Extraction Oil and Gas show some
renewed interest in these sectors.
Due to the weakness of the overall
market, 41% of capital raised via
PE-backed IPOs this year has been
by B2B companies. The $2.0 billion
raised by B2B PE-backed offerings
so far this year has already
exceeded the $1.9 billion in 2015,
and the sector is on pace to match
the eight IPOs it produced in 2015.
Both years however, are a far cry
from the more than $6 billion
raised across 13 IPOs in 2013.
9 PITCHBOOK 2016 PE & VC IPO TRENDS REPORT
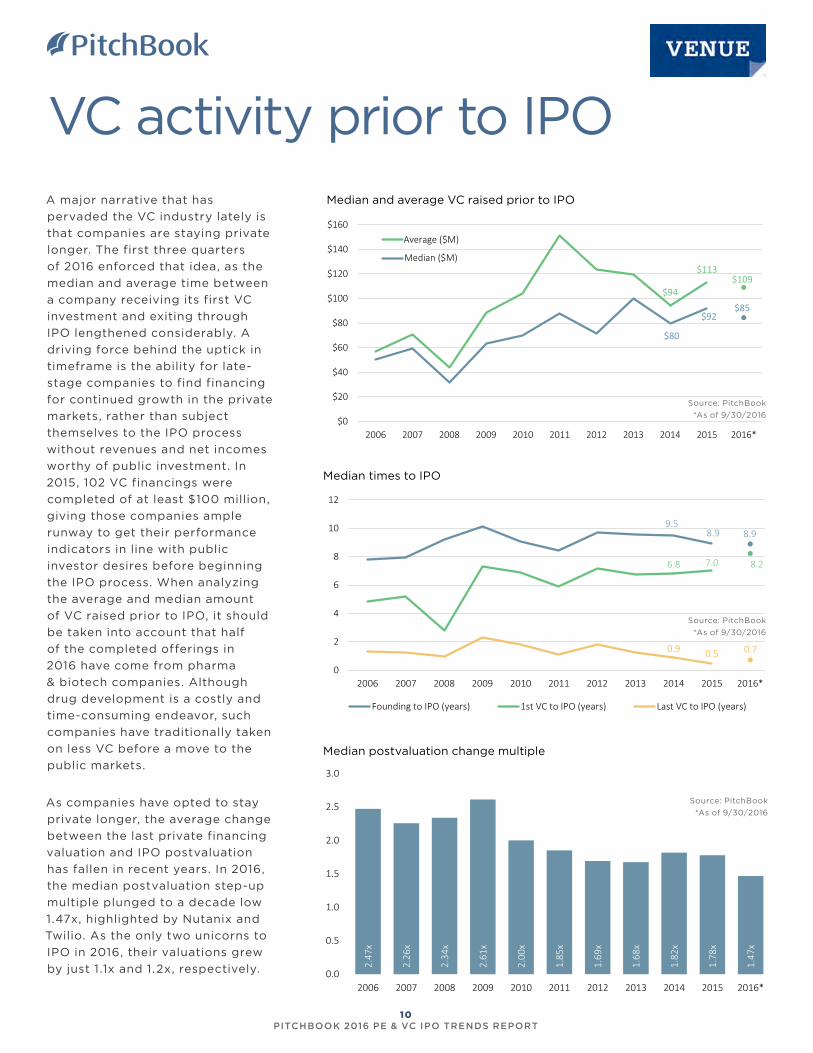
9.58.9 8.9
6.8 7.0 8.2
0.9 0.5 0.7
0
2
4
6
8
10
12
2006 2007 2008 2009 2010 2011 2012 2013 2014 2015 2016*
Founding to IPO (years) 1st VC to IPO (years) Last VC to IPO (years)
VC activity prior to IPO
Median ($M)
Average ($M)
$80
$92$85
$94
$113$109
$0
$20
$40
$60
$80
$100
$120
$140
$160
2006 2007 2008 2009 2010 2011 2012 2013 2014 2015 2016*
Source: PitchBook
*As of 9/30/2016
Source: PitchBook
*As of 9/30/2016
Median and average VC raised prior to IPO
Median times to IPO
Median postvaluation change multiple
2.47
x
2.26
x
2.34
x
2.61
x
2.00
x
1.85
x
1.69
x
1.68
x
1.82
x
1.78
x
1.47
x
0.0
0.5
1.0
1.5
2.0
2.5
3.0
2006 2007 2008 2009 2010 2011 2012 2013 2014 2015 2016*
Source: PitchBook
*As of 9/30/2016
A major narrative that has
pervaded the VC industry lately is
that companies are staying private
longer. The first three quarters
of 2016 enforced that idea, as the
median and average time between
a company receiving its first VC
investment and exiting through
IPO lengthened considerably. A
driving force behind the uptick in
timeframe is the ability for late-
stage companies to find financing
for continued growth in the private
markets, rather than subject
themselves to the IPO process
without revenues and net incomes
worthy of public investment. In
2015, 102 VC financings were
completed of at least $100 million,
giving those companies ample
runway to get their performance
indicators in line with public
investor desires before beginning
the IPO process. When analyzing
the average and median amount
of VC raised prior to IPO, it should
be taken into account that half
of the completed offerings in
2016 have come from pharma
& biotech companies. Although
drug development is a costly and
time-consuming endeavor, such
companies have traditionally taken
on less VC before a move to the
public markets.
As companies have opted to stay
private longer, the average change
between the last private financing
valuation and IPO postvaluation
has fallen in recent years. In 2016,
the median postvaluation step-up
multiple plunged to a decade low
1.47x, highlighted by Nutanix and
Twilio. As the only two unicorns to
IPO in 2016, their valuations grew
by just 1.1x and 1.2x, respectively.
10 PITCHBOOK 2016 PE & VC IPO TRENDS REPORT
$1 $1 $1 $1 $1 $2 $3 $2 $17
$1 $2 $1 $2 $3 $4 $3 $2 $1 $4 $1 $3 $3 $2 $1 $1
10 128
12 1115
812
22
13
13 13
10
25
29
24
40
27 24
30
15
30
16
15
6
1114
1Q 2Q 3Q 4Q 1Q 2Q 3Q 4Q 1Q 2Q 3Q 4Q 1Q 2Q 3Q 4Q 1Q 2Q 3Q 4Q 1Q 2Q 3Q 4Q 1Q 2Q 3Q
2010 2011 2012 2013 2014 2015 2016
Capital Raised ($B)
IPO Count
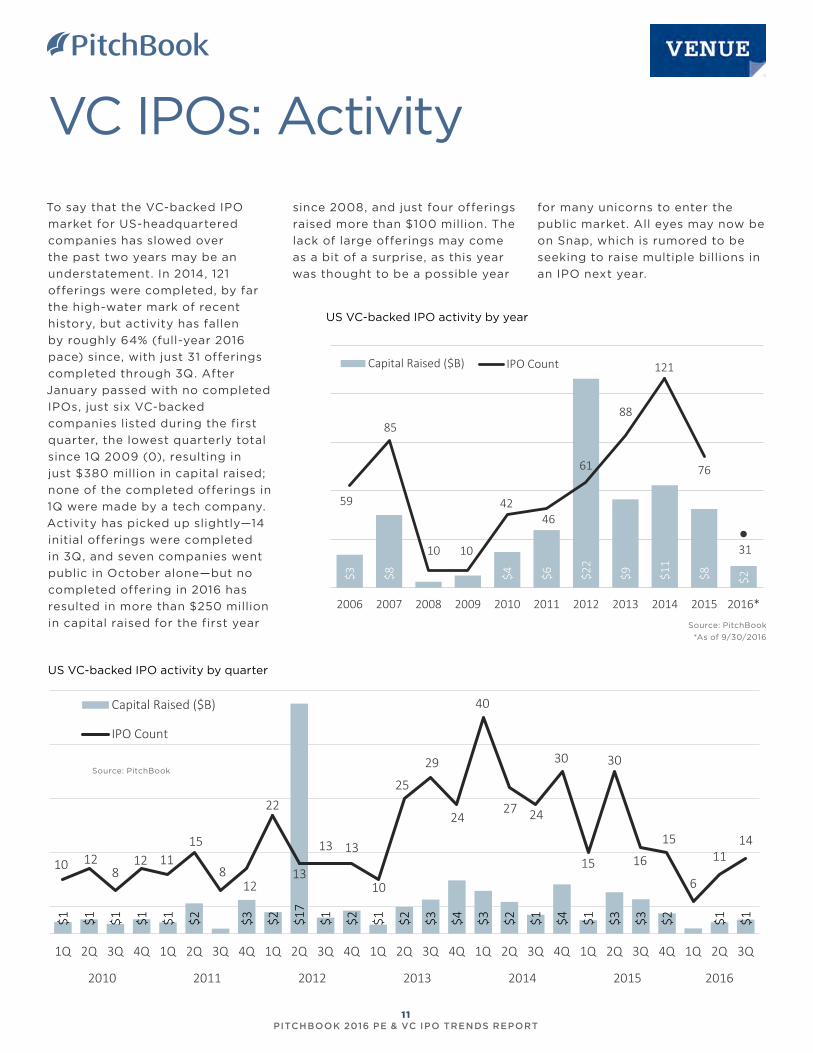
VC IPOs: Activity
Source: PitchBook
$3 $8 $4 $6 $22
$9 $11
$8 $2
59
85
10 10
4246
61
88
121
76
31
0
20
40
60
80
100
120
140
$0
$5
$10
$15
$20
$25
2006 2007 2008 2009 2010 2011 2012 2013 2014 2015 2016*
Capital Raised ($B) IPO Count
US VC-backed IPO activity by year
US VC-backed IPO activity by quarter
To say that the VC-backed IPO
market for US-headquartered
companies has slowed over
the past two years may be an
understatement. In 2014, 121
offerings were completed, by far
the high-water mark of recent
history, but activity has fallen
by roughly 64% (full-year 2016
pace) since, with just 31 offerings
completed through 3Q. After
January passed with no completed
IPOs, just six VC-backed
companies listed during the first
quarter, the lowest quarterly total
since 1Q 2009 (0), resulting in
just $380 million in capital raised;
none of the completed offerings in
1Q were made by a tech company.
Activity has picked up slightly—14
initial offerings were completed
in 3Q, and seven companies went
public in October alone—but no
completed offering in 2016 has
resulted in more than $250 million
in capital raised for the first year
since 2008, and just four offerings
raised more than $100 million. The
lack of large offerings may come
as a bit of a surprise, as this year
was thought to be a possible year
for many unicorns to enter the
public market. All eyes may now be
on Snap, which is rumored to be
seeking to raise multiple billions in
an IPO next year.
Source: PitchBook
*As of 9/30/2016
11 PITCHBOOK 2016 PE & VC IPO TRENDS REPORT

VC IPOs: Metrics
$66$76
$67
$88 $107 $72
$0
$50
$100
$150
$200
$250
$300
$350
$400
$450
2006 2007 2008 2009 2010 2011 2012 2013 2014 2015 2016*
Median Offering Size ($M)
Average Offering Size ($M)
$249 $285 $249
$438$519
$424
$0
$500
$1,000
$1,500
$2,000
$2,500
2006 2007 2008 2009 2010 2011 2012 2013 2014 2015 2016*
Median Postval ($M)
Average Postval ($M)
Source: PitchBook
*As of 9/30/2016
Source: PitchBook
*As of 9/30/2016
Median and average IPO offering size
Median and average IPO postvaluation
Falling well below $100 million, the
average offering size dropped 32%
from last year to $72 million, the
lowest level since 2008. The steep
decline in comparison to recent
years has been accentuated by
the lack of outsized offerings that
previously pushed up the averages.
Four VC-backed companies raised
over $400 million in IPOs in 2015,
along with two companies in
2014—Facebook’s $16 billion IPO
in 2012 is what’s driving the spike
seen in the chart to the right. This
year, however, the largest offering
through 3Q has come in at just
$237 million (Nutanix), while 87%
of completed IPOs have fallen
below the $100 million mark.
While in theory public offerings
still offer a more probable path to
liquidity than acquisitions for the
most heavily funded and valued
companies, they do come along
with the investor scrutiny that
private markets are able to shield
against. Even with $1 billion-plus
valuations, many unicorns continue
to operate in a state of massive
growth that brings along high burn
rates and negative bottom lines.
Rather than face likely criticism
with an IPO, the unicorns that
the industry hoped would make
a public offering this year have
instead opted to tap into easily
accessible late-stage capital from
the private markets once more,
or still have enough runway from
a large financing raised last year.
Those unicorns that did complete
an IPO priced their offerings fairly
conservatively and realized only
moderate valuation climbs. That
said, both names did see their
stocks soar in secondary trading.
12 PITCHBOOK 2016 PE & VC IPO TRENDS REPORT

VC IPOs: Sectors
0%
10%
20%
30%
40%
50%
60%
70%
80%
90%
100%
2006
2007
2008
2009
2010
2011
2012
2013
2014
2015
2016
*
Pharma & Biotech
HC Services & Systems
HC Devices & Supplies
Commercial Services
Consumer Goods &RecreationEnergy
IT Hardware
Media
Software
Other
0%
10%
20%
30%
40%
50%
60%
70%
80%
90%
100%
2006
2007
2008
2009
2010
2011
2012
2013
2014
2015
2016
*
Pharma & Biotech
HC Services & Systems
HC Devices & Supplies
Commercial Services
Consumer Goods &RecreationEnergy
IT Hardware
Media
Software
Other
Source: PitchBook
*As of 9/30/2016
Source: PitchBook
*As of 9/30/2016
Following the market selloff at
the turn of the year, the investor
demand for tech IPOs that
founders had come to expect in
2014 and 2015 lagged considerably.
After a quiet first quarter with
zero tech offerings, the software
and IT hardware sectors have
picked up their pace a bit,
debuting a combined nine VC-
backed companies on US markets.
Twilio’s $150 million raise in 2Q,
and subsequent move to a high
of nearly $71 per share (~400%
growth), was hoped by many to
spur an “open window” for the IPO
market, but just one other tech
company privately valued at $1
billion or more has completed an
offering.
Continuing to represent the
largest share of IPO volume,
pharma & biotech has accounted
for 52% of all offerings this year,
a considerable uptick when
compared with its 17% share
in 2011. The extended drug
development cycle creates a need
for such companies to access
consistent funding that the
traditional VC model might not
be able to support. Establishing a
capital markets presence can be a
major benefit for pharma & biotech
companies as it allows them to
conduct follow-on offerings and
access more immediate capital at
a much quicker pace than what
might be available in the private
realm.
Pharma & biotech has accounted for more than 50% of VC IPOs in 2016
VC-backed IPOs by sector (#)
Despite lack of offerings, software has raised 30% of capital raised in IPOs
VC-backed IPO capital raised by sector ($)
13 PITCHBOOK 2016 PE & VC IPO TRENDS REPORT
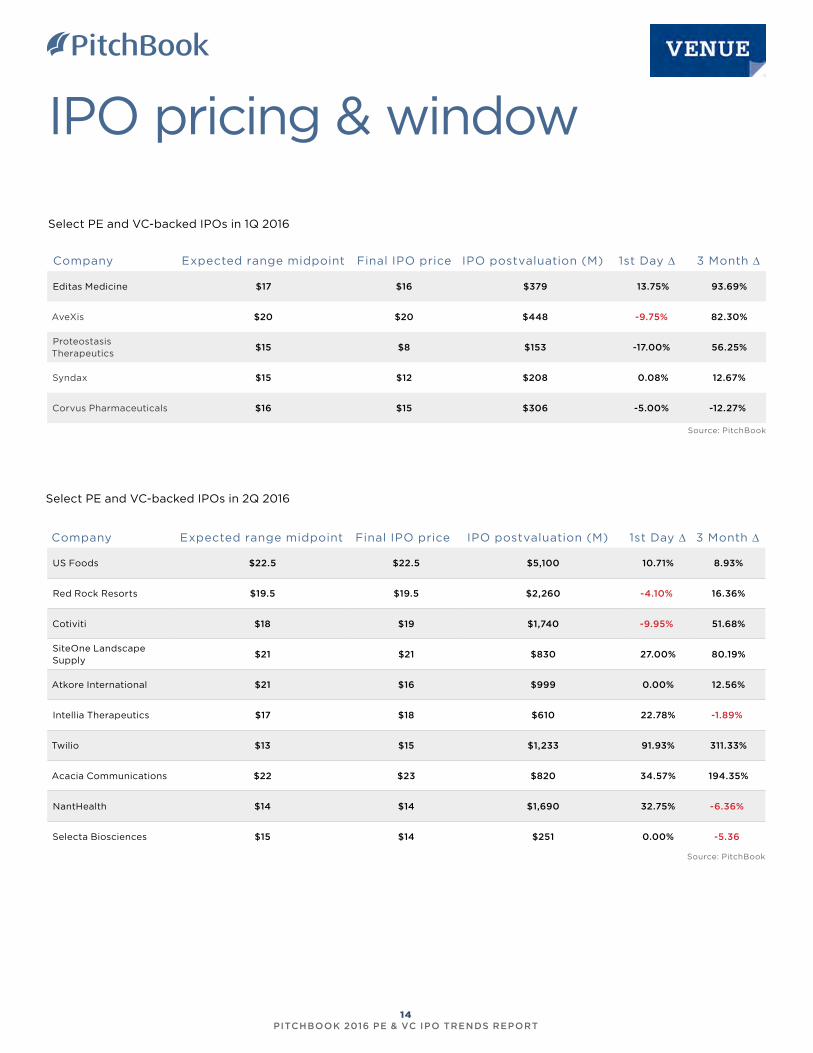
IPO pricing & window
Editas Medicine $17 $16 $379 13.75% 93.69%
AveXis $20 $20 $448 -9.75% 82.30%
Proteostasis Therapeutics
$15 $8 $153 -17.00% 56.25%
Syndax $15 $12 $208 0.08% 12.67%
Corvus Pharmaceuticals $16 $15 $306 -5.00% -12.27%
Company Expected range midpoint Final IPO price IPO postvaluation (M) 1st Day ∆ 3 Month ∆
US Foods $22.5 $22.5 $5,100 10.71% 8.93%
Red Rock Resorts $19.5 $19.5 $2,260 -4.10% 16.36%
Cotiviti $18 $19 $1,740 -9.95% 51.68%
SiteOne Landscape Supply
$21 $21 $830 27.00% 80.19%
Atkore International $21 $16 $999 0.00% 12.56%
Intellia Therapeutics $17 $18 $610 22.78% -1.89%
Twilio $13 $15 $1,233 91.93% 311.33%
Acacia Communications $22 $23 $820 34.57% 194.35%
NantHealth $14 $14 $1,690 32.75% -6.36%
Selecta Biosciences $15 $14 $251 0.00% -5.36
Source: PitchBook
Source: PitchBook
Select PE and VC-backed IPOs in 1Q 2016
Select PE and VC-backed IPOs in 2Q 2016
Company Expected range midpoint Final IPO price IPO postvaluation (M) 1st Day ∆ 3 Month ∆
14 PITCHBOOK 2016 PE & VC IPO TRENDS REPORT
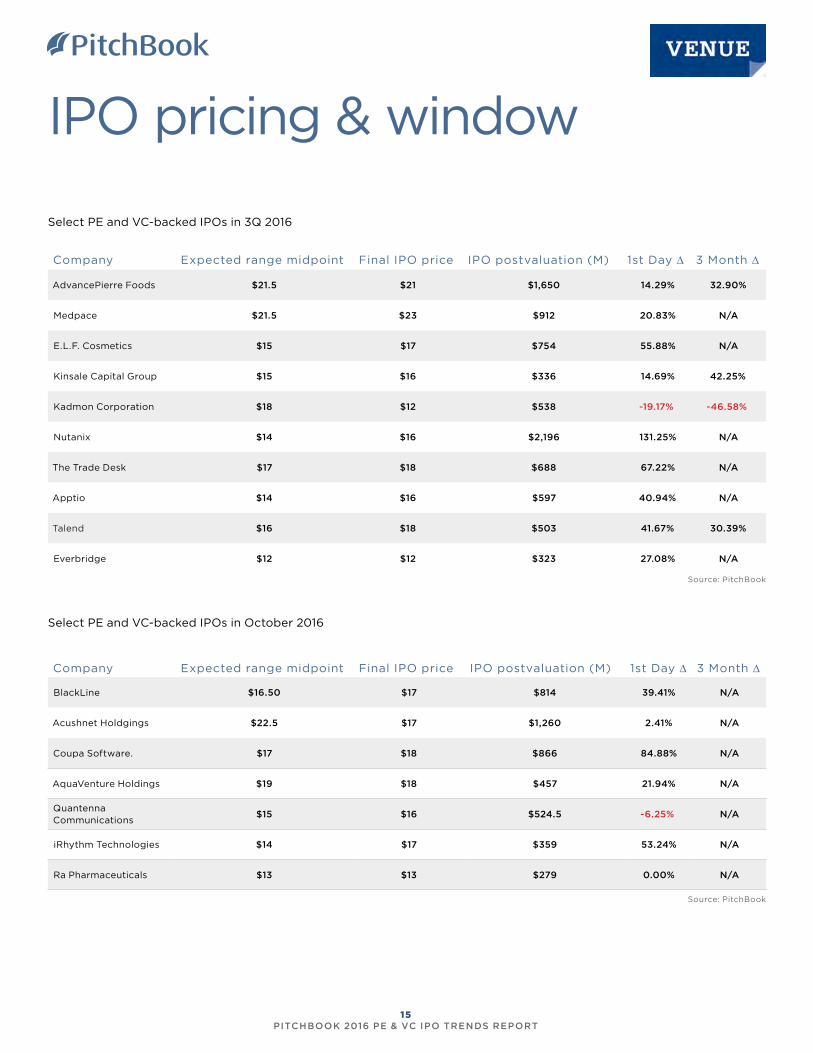
IPO pricing & window
AdvancePierre Foods $21.5 $21 $1,650 14.29% 32.90%
Medpace $21.5 $23 $912 20.83% N/A
E.L.F. Cosmetics $15 $17 $754 55.88% N/A
Kinsale Capital Group $15 $16 $336 14.69% 42.25%
Kadmon Corporation $18 $12 $538 -19.17% -46.58%
Nutanix $14 $16 $2,196 131.25% N/A
The Trade Desk $17 $18 $688 67.22% N/A
Apptio $14 $16 $597 40.94% N/A
Talend $16 $18 $503 41.67% 30.39%
Everbridge $12 $12 $323 27.08% N/A
Select PE and VC-backed IPOs in 3Q 2016
BlackLine $16.50 $17 $814 39.41% N/A
Acushnet Holdgings $22.5 $17 $1,260 2.41% N/A
Coupa Software. $17 $18 $866 84.88% N/A
AquaVenture Holdings $19 $18 $457 21.94% N/A
Quantenna Communications
$15 $16 $524.5 -6.25% N/A
iRhythm Technologies $14 $17 $359 53.24% N/A
Ra Pharmaceuticals $13 $13 $279 0.00% N/A
Select PE and VC-backed IPOs in October 2016
Source: PitchBook
Source: PitchBook
Company Expected range midpoint Final IPO price IPO postvaluation (M) 1st Day ∆ 3 Month ∆
Company Expected range midpoint Final IPO price IPO postvaluation (M) 1st Day ∆ 3 Month ∆
15 PITCHBOOK 2016 PE & VC IPO TRENDS REPORT

IPO pipeline
Company Select investors Sector 2015 revenue ($M) Last buyout date Last buyout size (M)
Company Select Investors Sector
VC raised
to date (M)
2015 Revenue
(M)
Most recent private
postval (M)
Select upcoming PE-sponsored offerings
Select upcoming VC-backed offerings
Albertsons Cerberus Capital Management B2C $5.873 N/A N/A
PSAVGoldman Sachs Alternative Investments, Olympus Partners
B2C $1,487 1/27/2014 $1,020
YETICortec Group, Fifth Street Asset Management
B2C $468.9 6/15/2012 $67
Soul CycleGoldman Sachs, Leonard Green & Partners
B2C $117.7* 5/31/2011 $719
McGraw-Hill Education
Apollo Global Management B2C $1,834 3/22/2013 $2,400
Laureate Education
Sterling Partners, KKR, Point27 Asset Management, StepStone Group
B2C $4,292 7/20/2007 $3,800
Jeld-Wen Onex B2B $3,381 10/3/2011 $1,502
VisterraFlagship Ventures, Polaris Partners, Bill & Melinda Gates Foundation
Pharma & biotech
$69.8 — $111.25
Thar Pharmaceuticals Innovation WorksPharma & biotech
$6.6 — $19.5
Elevate Credit**Sequoia Capital, TCV, Startup Capital Ventures
Financial Services
— $237.7 —
**denotes spinout
Source: PitchBook
Source: PitchBook
*denotes figure for the nine months ended September 30, 2015
16 PITCHBOOK 2016 PE & VC IPO TRENDS REPORT
All datasets in this report cover US-based companies debuting on US exchanges, and unless otherwise noted, they are as of September 30, 2016.
DEFINITIONSPostvaluation: For this report, PitchBook calculated
postvaluation as the total number of outstanding
common shares multiplied by the final IPO price.
Offering size: PitchBook calculates offering size as
the total number of common stock shares offered
multiplied by the final offering price. If the stock has
not achieved a final price, the midpoint of the pricing
range is used. If the pricing range has not been filed,
the proposed maximum aggregate offering price is
used.
Upcoming IPOs: The companies were selected among
the total number of PE and VC-backed companies
that are currently in registration to go public.
Investors were also sampled from the total number of
backers.
PE or VC sponsorship: PitchBook bases PE or VC
sponsorship on whether or not a PE or VC investor
owns an interest in a company that has filed for an
upcoming IPO.
American Depository Shares: When applicable,
PitchBook calculates American Depository Shares
as a representation of ordinary (common) shares,
taking into account whatever representation is
outlined in the company’s SEC filing.
1-day and 3-month performance: In this report, the
first-day performance is calculated by comparing
the offering price to the price at the end of first
trading day; the 90-day performance is calculated
comparing the offering price to the price at the end
of the first three months of trading.
MAKE WAY FOR
SMARTER, ON-THE-FLY MEETING PREP
US +1 206.623.1986
UK +44 (0)207.190.9809
pitchbook.com
Introducing PitchBook Mobile. The same excellent data, technology
and service from the PitchBook Platform, now available on a mobile
device.
Search:
“PitchBook”Available for
Methodology