u.s. sba office of advocacy--small and micro … · small and micro business lending for 2004-2005...
TRANSCRIPT
Small Business and Micro Business Lending in the United States, for Data Years 2004-2005
Offi ce of AdvocacyU.S. Small Business Administration
Advocacy: the voice of small business in governmentwww.sba.gov/advoOffice of Advocacy
December 2006
EMBARGOEDUNTIL DECEMBER 14, 2006

Created by Congress in 1976, the Offi ce of Advocacy of the U.S. Small BusinessAdministration (SBA) is an independent voice for small business within the federalgovernment. Appointed by the President and confi rmed by the U.S. Senate,the Chief Counsel for Advocacy directs the offi ce. The Chief Counsel advancesthe views, concerns, and interests of small business before Congress, the WhiteHouse, federal agencies, federal courts, and state policy makers. Economicresearch, policy analyses, and small business outreach help identify issues ofconcern. Regional Advocates and an offi ce in Washington, D.C., support the ChiefCounsel’s efforts.
For more information on the Offi ce of Advocacy, visit www.sba.gov/advo or call(202) 205-6533. Receive email notices of new Offi ce of Advocacy informationby signing up on Advocacy’s Listservs at http://web.sba.gov/list.
ADVOCACY NEWSLETTER ADVOCACY PRESS ADVOCACY REGULATORY NEWS ADVOCACY RESEARCH

Small and Micro Business Lending for 2004-2005Office of Advocacy, U.S. Small Business Administration
The Office of Advocacy prepares an annual study of institutional lending to small firms. The study provides a review of lending activities based on two types of data that lenders report to their regulating agencies—the Consolidated Reports of Condition and Income (call reports) for June 2005 and the Community Reinvestment Act (CRA) reports for 2004. Because data are available only by the size of the loan, small business loans are defined as business loans under $1 million, and micro busi-ness loans are those under $100,000. The report includes a discussion of developments in the small and micro business lending activities of institutional lenders. The report examines small business lending in the economy by all lenders in the United States. No attempt has been made to distinguish SBA-guar-anteed lenders in the analysis. Lenders are ranked based on their overall lending, not lending under SBA programs.
Part one reviews developments apparent in the call report data from June 2004 through June 2005 and the CRA database for the year 2004. Part two provides directories of the top small and micro business lenders in the 50 states, the District of Columbia, and some U.S. territories. For the reader’s convenience, national tables for multibillion-dollar banks and bank holding companies are presented before state tables for all banks, not because bank holding companies are more important in small busi-ness lending, but because the tables are shorter.
This year’s edition has been expanded to include savings banks and savings and loans associations, in addition to commercial banks. Geographic cover-age has been expanded to include American Samoa, Guam, Puerto Rico, and the U.S. Virgin Islands.
Overall FindingsAmid a slowing economy, the rate of small business lending growth in the United States slowed down in
2005 relative to the previous year. Small business credit cards remained the most dynamic market; the number of small business loans outstanding (for loans under $100,000) grew by 25 percent, from 15.2 million in June 2004 to 19.0 million in June 2005.
Highlights• Total small business loans outstanding for the
8,799 reporting depository institutions in the U.S. and territories were valued at $601 billion for 21.0 million loans in June 2005. This compares with a total of $577.1 billion in value and 17.1 million in number in the previous year. There were 19.0 million micro business loans outstanding in June 2005, val-ued at $138.4 billion; in June 2004 there were 15.2 million micro business loans outstanding valued at $135.9 billion.
• The rate of growth in small business borrowing slowed from the previous year; the value of all small business loans outstanding increased 4.1 percent; the largest increase came from the larger small business loans ($100,000 to $1 million). The smallest loans (under $100,000) rose a meager 1.9 percent in spite of a huge increase in the number of loans.
• The number of small business loans, however, resumed their large increases, growing by 22.6 per-cent between June 2004 and June 2005. The increase was concentrated in the smallest loans, the number of which rose from 15.2 million to 19 million in June 2005. This constituted an increase of 25 percent as compared with a decrease of 11 percent between June 2003 and 2004. (The one-year decline was in large part an accounting phenomenon.)
• Multibillion-dollar lending institutions contin-ued to grow through mergers and acquisitions. Many large lending institutions (most of them bank holding companies—BHCs), saw their total assets increase by 20 percent or more. While the number of multi-billion dollar lending institutions with total domestic
December 2006 No. 288
The opinions and recommendations of the authors of this study do not necessarily reflect official policies of the U.S. Small Business Administration or other agencies of the U.S. government.

assets of more than $10 billion declined from 104 in June 2004 to 101 in June 2005, their share of total assets grew to 73.8 percent (as compared with 72.8 percent the year before).
• The largest lenders continued to focus on the market for loans under $100,000, especially the busi-ness credit card market. This market accounted for 70 percent of the total number of micro business loans in June 2005. The largest lenders’ share of the market for loans between $100,000 and $1 million remained relatively unchanged, in both amount and number.
• The CRA reports confirm large lending institu-tions’ lending growth in 2004 and their continued promotion of small business credit cards. In 2004, the 1,484 CRA-reporting institutions extended 8.1 million loans that were less than $1 million, for a total of $288 billion in small business loans. This compares with 7.8 million loans valued at $271 bil-lion in 2003 extended by 1,562 entities. For micro business loans, 7.5 million micro business loans valued at $95 billion were made in 2004, compared with 7.3 million loans valued at $87 billion in 2003.
Scope and MethodologyThis study provides a review of lending activities for depository institutions in 2004-2005 based on two types of data reported by lending institutions to their regulating agencies—the call reports for June 2005 (for the amount and number of outstanding loans) and the CRA reports for 2004 (for loans made dur-ing the year). Since the reported data are available only by the size of the loan (not by the size of the business), small business loans are defined as busi-ness loans under $1 million; micro business loans are defined as loans under $100,000. Developments in lending activities over time by lending institutions are analyzed based on the call report statistics for several variables. However, because of the changing number of lending institutions required to file CRA reports, year-to-year changes in these institutions’ activities are more difficult to interpret than for the call reports.
Large lending institutions (with total domestic assets of more than $10 billion) are ranked and reported separately, under the presumption that they serve a national market. Rankings by state are made for all reporting lenders on the basis of the designat-ed headquarters state of the reporting lending institu-tions (see Table 5 for the number of institutions in each state). Two ranking methods are used, depend-ing upon the availability of data.
For lending institutions where information on total assets and total business loans are available (those filing call reports), four criteria are used as the basis for a lender’s performance ranking. A summary rank for four decile ranks is computed for each institution in the state rankings. A decile ranking is first used for individual criteria; decile rankings range from 1 to 10. Lending institutions in the top 10 percent of all lenders in the state receive the maximum score of 10; banks in the lowest 10 percent receive a score of 1. Lenders that do not lend to small businesses (loans under $1 million) receive a 0. Four top scores will sum to 40. To make the top score total 100 rather than 40, each score is multiplied by 2.5.
For state lending using the CRA data, lenders were listed in order of the dollar amount of small business loans made in each state in 2003. Large institutions therefore appear at the top. Simple rank-ings were used for multibillon dollar lending institu-tions because only a small number of lenders are involved.
This report was peer reviewed consistent with Advocacy’s data quality guidelines. More informa-tion on this process can be obtained by contacting the director of economic research at [email protected] or (202) 205-6533.
Ordering InformationThe full text of this report and summaries of other studies performed under contract with the U.S. Small Business Administration’s Office of Advocacy are available on the Internet at www.sba.gov/advo/research. Copies are available for purchase from:
National Technical Information Service5285 Port Royal RoadSpringfield, VA 22161(800) 553-6847 or (703) 605-6000www.ntis.govOrder number: PB2007-103423Paper copy A07 ($38.00)Microfiche A02 ($20.00)CD-ROM A00 ($29.00)Electronic download A00 ($22.95)
For email delivery of Advocacy’s newsletter, press, regulatory news, and research, visit http://web.sba.gov/list. For Really Simple Syndication (RSS) feeds, visit www.sba.gov/advo/rsslibrary.html.

Foreword I am pleased to provide the newest edition of the Office of Advocacy’s annual study of lending to small and micro businesses by most depository institutions in the United States. This year, coverage has been expanded in two respects—federal and state savings banks and savings and loans associations are included, and geographic coverage has been extended to the U.S. territories.
This study covers both small business lending (loans of less than $1 million) and micro business lending (loans of less than $100,000) for all reporting institutions and for multibillion-dollar lending institutions for the 2004–2005 period. The source information consists of two types of data reported by depository institutions to their respective regulating agencies—Consolidated Reports of Condition and Income (call reports) for June 2005 and the Community Reinvestment Act (CRA) reports for 2004.
The report provides data on the top institutions lending to small businesses in each state. Advocacy’s website contains additional data listing the lending activity of all lenders in the 50 states, the District of Columbia, and selected U.S. territories (as Tables 3A and 3B expanded). It is useful to both small businesses in search of loans and lenders who seek to compare themselves to their competitors. This study examines small business lending in the economy by all lenders in the United States. No attempt has been made to distinguish SBA-guaranteed lenders in the analysis. Lenders are ranked based on their overall lending, not lending under SBA programs.
The lending studies may also be viewed on the Office of Advocacy’s homepage, www.sba.gov/advo/research/lending.html. If you have questions or comments, write to the Office of Advocacy, U.S. Small Business Administration, Mail Code 3112, 409 Third St., S.W., Washington, D.C. 20416, or fax (202) 205-6928. Technical questions may be addressed to Charles Ou or Victoria Williams, at (202) 205-6530 or by e-mail: [email protected] or [email protected]. We welcome your comments and suggestions.
Chad Moutray
Chief Economist and Director of Economic Research
Small Business and Micro Business Lending, 2004-2005 iii
Contents Introduction 1
Part One: Developments in Small and Micro Business Lending 3
I. Findings from the June 2005 Call Reports 3
A. Small Business Loans Outstanding from All Reporting Lending Institutions 3
B. Total Micro Business Loans Outstanding in the United States 3
C. Small and Micro Business Loans Outstanding from Multibillion-Dollar Lending Institutions 5
II. Findings from Reports by CRA Reporting Institutions for 2004 7
A. Small Business Lending by CRA Reporting Lending Institutions 7
B. Micro Business Lending by CRA Lending Institutions 7
Part Two: Directory of Top U.S. Small and Micro Business Lenders 9
Appendix: Data Notes 12
Ranking Methodology and Table Descriptions 12
Table Descriptions 13
Data Tables Following page 20

Small Business and Micro Business Lending, 2004-2005 iv
Text Tables Table A. Dollar Amount and Number of Small Business Loans, June 2003–June 2005, by
Loan Size 4
Table B. Percent Change in the Dollar Amount of Business Loans by Loan Size, June 2003–June 2005 4
Table C. Percent Change in the Number of Small Business Loans by Loan Size, June 2003–June 2005 5
Table D. Share of Total Assets and Business Loans by Size of All U.S. Depository Institutions, June 2003–June 2005 6
Table E. Comparison of Assets and Business Loans Outstanding for All Lending Institutions as Reported in Call Reports and by CRA-Reporting Institutions 8
Table F. Amount and Number of Loans made by CRA-Reporting Banks in 2002–2004 8
Data Tables All data tables follow page 20, except expanded Tables 3A and 3B. Those two tables show data for all lending institutions in the 50 states, the District of Columbia, and selected territories. They are only available on Advocacy’s website, www.sba.gov/advo/research/lending.html.
Table 1A. Small Business Lending of Large Lending Institutions Based on Call Report Data, June 2005 21
Table 1B. Micro Business Lending of Large Lending Institutions Based on Call Report Data, June 2005 25
Table 2A. Small Business Lending of Large Lending Institutions in the U.S. Based on CRA Data, 2004 27
Table 2B. Micro Business Lending of Large Lending Institutions in the U.S. Based on CRA Data, 2004 29
Table 3A. Top Small Business Lending Institutions by State and Territory Based on Call Report Data, June 2005 31
Table 3A expanded. Small Business Lending by State and Territory Based on Call Report Data, June 2005 www.sba.gov/advo/research/lending.html
Table 3B. Top Micro Business Lending Institutions by State and Territory Based on Call Report Data, June 2005 45
Table 3B expanded. Micro Business Lending by State and Territory Based on Call Report Data, June 2005 www.sba.gov/advo/research/lending.html
Table 4A. Top Small Business Lenders by State and Territory Based on CRA Data, 2004 58
Table 4B. Top Micro Business Lenders by State and Territory Based on CRA Data, 2004 83
Table 5. Number of Reporting Institutions by Asset Size and by State and Territory, 2004–2005 113

Introduction Access to credit is vital for small business survival. The most important institutional supplier of credit to small firms is the banking system, according to the 1998 Survey of Small Business Finances. Of a total of $700 billion in small business credit outstanding from all credit sources at the end of 1998, commercial lenders supplied 57 percent, compared with 12 percent supplied through owners’ loans and 11 percent from finance companies.1
Critical to the health and growth of a small business is knowledge of how lending institutions are meeting small firm credit needs and which lenders are investing in small businesses. Such information helps small businesses save precious time and shop efficiently for credit. It also helps lending institutions to know about the competition in the markets in which they participate.
This annual edition of Small Business and Micro Business Lending in the United States provides current data on small and micro business loans and on the lending institutions that serve them. This study examines small business lending in the economy by all lenders in the United States. No attempt has been made to distinguish SBA-guaranteed lenders in the analysis. Lenders are ranked based on their overall lending, not lending under SBA programs.
The study combines data on both small business and micro business lending to provide a brief review of these activities in 2004–2005. This report is based on two types of data reported by lenders to their respective regulating agencies—the call reports for June 2005 (for information on loans outstanding) and the Community Reinvestment Act (CRA) reports for 2004. Data are available only for the size of the loan and not for the size of the business. As such, the following definitions are used:
• Small business loans are defined as business loans under $1 million.
• Micro business loans are defined as business loans under $100,000.
This year’s study provides an expanded coverage of small business lending in two respects—it includes savings banks and savings and loans associations in addition to commercial banks; and geographic coverage has been expanded to include banks in several U.S. territories: American Samoa, Guam, Puerto Rico, and the U.S Virgin Islands.2
Part One discusses developments in small and micro business lending activities by institutional lenders in the United States. The first section discusses developments apparent in the call report data; the second section discusses developments based on the CRA database. The analysis is based on data for three years, from June 2003 through June 2005 for call reports and from 2002 through 2004 for CRA reports.
Part Two provides directories of the top small and micro business lenders in the states and territories using both the call report and CRA data. For the reader’s convenience, national tables
1See U.S. Small Business Administration, Office of Advocacy, Financing Patterns of Small Firms: Findings from the 1998 Survey of Small Business Finances, 2003, Chart 5, p.14. www.sba.gov/advo/stats/rbssbf_98.pdf. 2 The Bank of the Federated States of Micronesia (FSM), the only non-U.S. FDIC-insured bank, is also included. FSM is a former United Nations Trust Territory administered by the United States until the 1980s.

Small Business and Micro Business Lending, 2004-2005 2
for multibillion-dollar lending institutions are presented before state tables for all lending institutions; this is not because these giants are more important in small business lending, but because the tables for them are shorter.
While these two databases have limitations as indicators of both the supply of loans from lending institutions and the small business demand for loans, their usefulness cannot be denied—they are the only publicly available sources of information on the small business lending activities of individual lending institutions.
Accessing the Study
The current and all previous editions of Advocacy’s lending studies are on the Internet at www.sba.gov/advo/research/lending.html. Paper and microfiche copies are also available for purchase from the National Technical Information Service, telephone (703) 487-4650.
Suggestions
Send written comments or suggestions to the Office of Advocacy, U.S. Small Business Administration, Mail Code 3112, 409 Third St., S.W., Washington, D.C. 20416, or by fax to (202) 205-6928. Technical questions may be addressed to Dr. Charles Ou or Ms. Victoria Williams, at (202) 205-6530 or by email: [email protected] or [email protected].
Small Business and Micro Business Lending, 2004-2005 3
Part One: Developments in Small and Micro Business Lending I. Findings from the June 2005 Call Reports3
A. Small Business Loans Outstanding from All Reporting Lending Institutions
The rate of growth in borrowing from lending institutions slowed down from the previous year. Overall, small business loans (less than $1 million) by depository institutions showed smaller increases between June 2004 and June 2005 than in the previous period. The dollar amount of all small business loans outstanding increased 4.1 percent, from $577 billion in June 2004 to $601 billion in June 2005.4 (See Tables A, B, and C.) Again, the larger increase came from the larger small business loans ($100,000 to $1 million). These increased 4.8 percent, as compared with 1.9 percent for smallest size loans (under $100,000). The number of small business loans, however, resumed their large increases, and increased 22.6 during June 2004 and June 2005 (Table C). Large corporate borrowing contributed to a larger increase in the value of all business loans outstanding. These increased from $1.51 trillion to $1.68 trillion, an 11.1 percent increase, compared with the previous period’s 4.6 percent increase.5 As interest rates rose in the money markets, corporate borrowers returned to lending institutions for short-term and medium-tern financing. Mezzanine borrowing to finance merger and acquisition activities also increased significantly.
B. Total Micro Business Loans Outstanding in the United States
Changes in the value and the number of the micro business loans (under $100,000) remain difficult to interpret, for various reasons.6 However, both the number and the dollar amounts of loans under $100,000 increased during this period—the dollar amounts increased from $136 billion to $138 billion, an increase of 1.9 percent, and the number increased from 15.2 million loans to 19 million loans in June 2005. This is an increase of 25 percent as compared with a decrease of 11 percent between June 2003 and 20047 (Tables B and C). Most major small business credit card lenders continued to promote small business credit cards as indicated by the
3 As discussed in the introduction section, depository institutions covered in this year’s study have been expanded to include federal and state savings banks and savings and loans associations. Lending institutions covered thus include commercial banks (charter types 7 and 8), federal savings banks (charter types 9 through 12), and savings and loans associations (charter types 1 through 4). Credit unions, however, are not included. 4 As compared with $522 billion in June 2004 for commercial banks. See U.S. Small Business Administration, Office of Advocacy, Small Business and Micro Business Lending in the United States for Data Years 2003-2004, 2005, www.sba.gov/advo/research/lending.html. 5 Again, for comparison, total business loans for all reporting commercial banks was $1.38 trillion in June 2004. See Small Business and Micro Business Lending in the United States for Data Years 2003-2004. 6 Because of continued efforts by major small business credit card issuers to consolidate their data reporting practices. Further complicating the interpretation are the merger and acquisition activities of credit card operations among commercial banks, federal saving banks, and commercial finance companies. 7 By comparison, the number and value of smallest business loans were 13.6 million for $125.3 billion in June 2004. See Small Business and Micro Business Lending in the United States for Data Years 2003-2004.

Small Business and Micro Business Lending, 2004-2005 4
increased number of credit card accounts. The small increases in the dollar amount reflect a smaller increase in the demand for short-term financing in a slower economy.
Table A. Dollar Amount and Number of Small Business Loans, June 2003–June 2005, by Loan Size
(Dollars in Billions, Numbers in Millions)
Loan Size 2003 2004 2005 Percent Change
June 2004– June 2005
Under $100,000 Dollars 136.8 135.9 138.4 1.9
Number 17.14 15.24 19.02 24.8
$100,000 to under $1 million Dollars 411.5 441.3 462.3 4.8
Number 1.77 1.89 1.98 5.0
Under $1 million Dollars 548.1 577.1 600.8 4.1
Number 18.91 17.13 21.00 22.6
Total Business Loans Dollars 1,446.0 1,512.6 1,680.8 11.1 Source: U.S. Small Business Administration, Office of Advocacy, Small Business Lending in the United States, various years, and special tabulations of the June 2005 call reports (Consolidated Reports of Condition and Income for U.S. banks and thrift institutions prepared for the Office of Advocacy by James Kolari, Texas A&M University, College Station Texas).
Table B. Percent Change in the Dollar Amount of Business Loans by Loan Size, June 2003–June 2005 Loan size June 2003–
June 2004 June 2004–
June 2005
<$100,000 -0.5 1.9
$100,000-$1 million 7.2 4.8
<$1million 5.3 4.1
>$1 million 4.6 11.1 Source: U.S. Small Business Administration, Office of Advocacy, Small Business Lending in the United States, various years, and special tabulations of the June 2005 call reports (Consolidated Reports of Condition and Income for U.S. banks and thrift institutions prepared for the Office of Advocacy by James Kolari, Texas A&M University, College Station Texas).

Small Business and Micro Business Lending, 2004-2005 5
Table C. Percent Change in the Number of Small Business Loans by Loan Size, June 2003–June 2005 Loan size June 2003–
June 2004 June 2004–
June 2005
<$100,000 -11.1 24.8
$100,000–$1 million 6.6 5.0
<$1 million -9.4 22.6 Source: U.S. Small Business Administration, Office of Advocacy, Small Business Lending in the United States, various years, and special tabulations of the June 2005 call reports (Consolidated Reports of Condition and Income for U.S. banks and thrift institutions prepared for the Office of Advocacy by James Kolari, Texas A&M University, College Station Texas).
C. Small and Micro Business Loans Outstanding from Multibillion-Dollar Lending Institutions
Bank consolidations continued during June 2004 and June 2005 as indicated by the large increase in total domestic assets—in excess of 20 percent growth—for many large lending institutions, mostly large bank holding companies (BHCs). The increasing importance of large lending financial institutions in the United States is indicated in Table D.8 While the number of multibillion-dollar lending institutions with total domestic assets of more than $10 billion declined from 104 in June 2004 to 101 in June 2005, they accounted for 73.8 percent of total assets, 62 percent of total business loans, and 57 percent of small business loans.9 Again, the largest lenders continued to focus on the market for loans under $100,000, especially the business credit card market, accounting for 70 percent of the total number of small loans in June 2005.10 (Table D)
In the market for loans between $100,000 and $1 million, the largest lenders remained relatively passive or, at least, not aggressive. Their share in this market remained almost unchanged, in both amount and number of loans, in spite of the increased asset share, from 72.8 percent in June 2004 to 73.8 percent in June 2005. This poses the question of whether very large banks are moving away from higher-cost small business lending to lower-cost micro business lending in credit cards and credit lines. It will be important to continue monitoring this development as banking concentration continues.
8 Table D is derived by combining the files for reporting institutions and the consolidated holding companies, which consolidated all members of a holding company. Many noncommercial bank members of the holding companies were not consolidated because of missing linked IDs. The number of lending institutions as of June 2005 was 7,624 (compared with a total of 6,572 for banks in 2004), including 1,575 independent institutions and 4,997 financial holding companies. 9 The comparable numbers for banks and BHCs for June 2004 were 72 banks and/or BHCs for 75 percent of total banking assets. See Small Business and Micro Business Lending in the United States for Data Years 2003-2004, Table D. 10 The importance of C&I loans in the business loan portfolio for giant lending institutions is reflected in the statistics; these lenders accounted for 50 percent of total C&I loans under $100,000 while they only accounted for 20 percent of total smallest nonresidential loans (under $100,0000 as of June 30, 2005).

Small Business and Micro Business Lending, 2004-2005 6
Table D. Share of Total Assets and Business Loans by Size of All U.S. Depository Institutions, June 2003–June 2005
(Percent, Except Figures for Number of Institutions) Asset size of institutions
Over $50 Billion
$10 Billion to $50 Billion
Over $10
Billion
$1 Billion to $10 Billion
$500 Million to $1 Billion
Under $500
Million
All Institutions and BHCs
June 30, 2003
Number of Institutions* 26 70 96 405 499 6,859 7,859
Amount 31.46 15.49 46.95 13.76 7.21 32.07 100.0 Micro Business Loans (Under $100,000) Number 42.19 22.44 64.63 15.70 10.21 9.46 100.0
Amount 27.74 15.07 42.81 20.43 9.55 27.20 100.0 Small Business Loans ($100,000-$1 Million) Number 27.25 14.88 42.12 20.24 10.95 26.69 100.0
Amount 28.67 15.18 43.84 18.77 8.97 28.42 100.0 Total Small Business Loans (<$1 Million) Number 40.79 21.74 62.53 16.13 10.28 11.07 100.0
Total Business Loans Amount 46.58 16.09 62.67 17.05 6.09 14.20 100.0
Total Domestic Assets Amount 53.33 15.49 71.19 13.80 4.28 10.73 100.0
June 30, 2004
Number of Institutions* 26 78 104 430 491 6,712 7,737
Amount 32.22 17.03 49.25 13.85 6.43 30.46 100.0 Micro Business Loans (Under $100,000) Number 47.93 21.53 69.47 13.92 6.32 10.29 100.0
Amount 26.93 16.41 43.33 20.92 9.12 26.63 100.0 Small Business Loans ($100,000-$1 Million) Number 26.50 16.02 42.52 20.46 10.49 26.53 100.0
Amount 28.17 16.56 44.73 19.26 8.49 27.53 100.0 Total Small Business Loans (<$1 Million) Number 45.57 20.93 66.50 14.64 6.78 12.08 100.0
Total Business Loans Amount 44.03 17.49 61.52 18.10 5.95 14.43 100.0
Total Domestic Assets Amount 53.93 18.87 72.80 13.33 3.85 10.02 100.0
June 30, 2005
Number of Institutions* 31 70 101 449 541 6,533 7,624
Amount 36.49 13.33 49.82 15.05 6.62 28.51 100.0 Micro Business Loans (Under $100,000) Number 52.00 17.98 69.98 13.86 8.83 7.33 100.0
Amount 30.23 11.76 41.99 21.96 9.95 26.10 100.0 Small Business Loans ($100,000-$1 Million) Number 30.72 11.33 42.05 21.25 9.35 27.36 100.0
Amount 31.67 12.13 43.80 20.37 9.18 26.65 100.0 Total Small Business Loans (<$1 Million) Number 49.99 17.35 67.34 14.55 8.88 9.22 100.0
Total Business Loans Amount 48.99 13.39 62.37 18.18 6.11 13.33 100.0
Total Domestic Assets Amount 58.77 15.00 73.77 13.06 3.92 9.25 100.0
* All members of a holding company are consolidated to the extent the linked IDs permit. Credit unions excluded.
Source: U.S. Small Business Administration, Office of Advocacy, Small Business Lending in the United States, various years, and special tabulations of the June 2005 call reports (Consolidated Reports of Condition and Income for U.S. banks and thrift institutions prepared for the Office of Advocacy by James Kolari, Texas A&M University, College Station Texas).
Small Business and Micro Business Lending, 2004-2005 7
II. Findings from Reports by CRA Reporting Institutions for 2004
A. Small Business Lending by CRA Reporting Lending Institutions
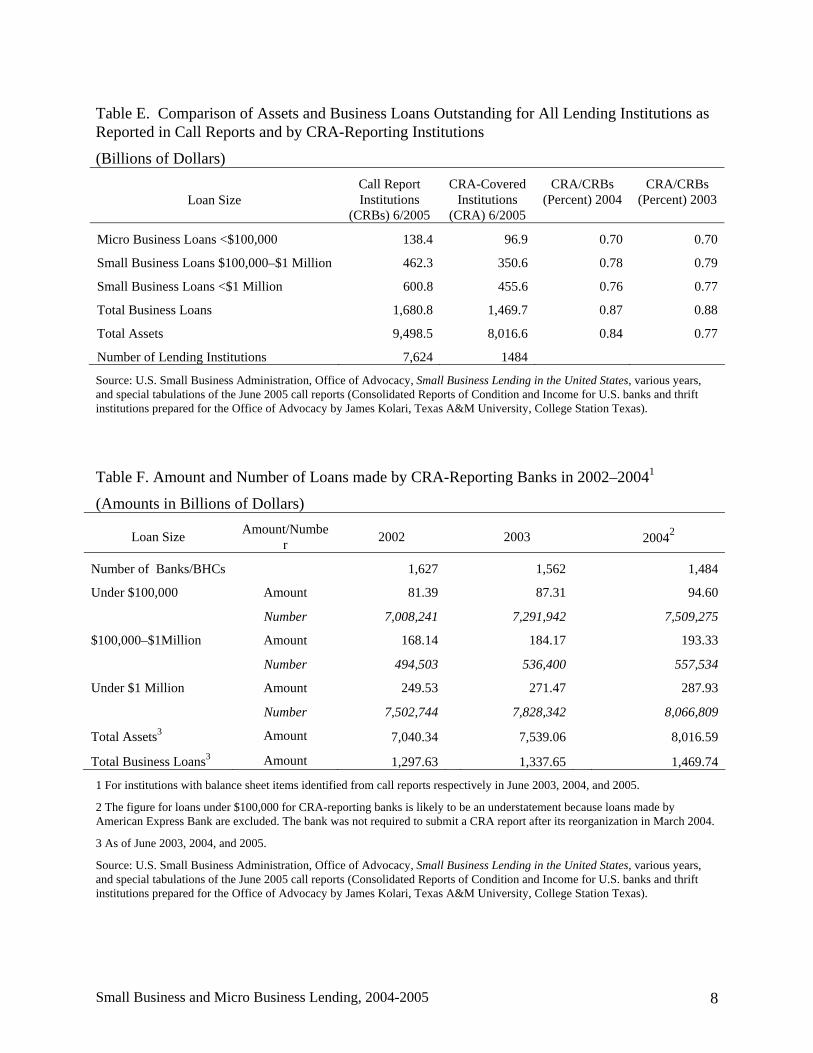
Community Reinvestment Act (CRA) data provide information on the location of loans made by a lender during a certain time period, for example, from January 1 through December 31 of a given year. This section provides a profile of the overall activities in small business lending by large lending institutions (most of them are BHCs) reporting under the CRA program in 2004. A comparison of the coverage of reporting institutions in the call reports (for all lending institutions) and in the CRA reporting lenders appears in Table E. These lending institutions accounted for 84 percent of total domestic assets and some 76 percent of small business lending in the United States under this study.
In 2004, a total of $288 billion in small business loans under $1 million were extended for 8.1 million loans by 1,484 CRA-reporting lenders, compared with $271 billion in 2003 extended by 1,562 entities for $7.8 million (Table F).11 The CRA data confirm the findings in the call report data of the promotion of the smallest loans by multibillion-dollar lending institutions during the past several years, in spite of the huge drop in the number of loans outstanding for this loan size as observed in June 2004 call report.12
B. Micro Business Lending by CRA Lending Institutions
Large lending institutions made 7.5 million micro business loans valued at $95 billion in 2004, compared with 7.3 million loans valued at $87 billion in 2003.13 Total domestic assets for these lenders increased from $7.5 trillion for 1,562 entities in June 2004 to $8.1 trillion for 1,484 lenders in June 2005.14 (Table F)
11 As compared with a total of $227 billion and $248 billion respectively for 2002 and 2003 for some 1,000 reporting banks/BHCs in the previous study. See Small Business and Micro Business Lending in the United States for Data Years 2003-2004. 12 See discussion on smallest size loans in preceding sections. 13 As compared with 5.6 million micro business loans valued at $78 billion in 2003 and 5.3 million loans valued at $73 billion in 2002 for some 1,000 banks and/or BHCs in previous study. See Small Business and Micro Business Lending in the United States for Data Years 2003-2004. 14 Since small business loan information are reported and available only in the report for June editions, those CRA lending institutions that were linked to the call reports were used in the analysis.
Small Business and Micro Business Lending, 2004-2005 8
Table E. Comparison of Assets and Business Loans Outstanding for All Lending Institutions as Reported in Call Reports and by CRA-Reporting Institutions
(Billions of Dollars)
Loan Size Call Report Institutions
(CRBs) 6/2005
CRA-Covered Institutions
(CRA) 6/2005
CRA/CRBs (Percent) 2004
CRA/CRBs (Percent) 2003
Micro Business Loans <$100,000 138.4 96.9 0.70 0.70
Small Business Loans $100,000–$1 Million 462.3 350.6 0.78 0.79
Small Business Loans <$1 Million 600.8 455.6 0.76 0.77
Total Business Loans 1,680.8 1,469.7 0.87 0.88
Total Assets 9,498.5 8,016.6 0.84 0.77
Number of Lending Institutions 7,624 1484
Source: U.S. Small Business Administration, Office of Advocacy, Small Business Lending in the United States, various years, and special tabulations of the June 2005 call reports (Consolidated Reports of Condition and Income for U.S. banks and thrift institutions prepared for the Office of Advocacy by James Kolari, Texas A&M University, College Station Texas).
Table F. Amount and Number of Loans made by CRA-Reporting Banks in 2002–20041
(Amounts in Billions of Dollars)
Loan Size Amount/Number 2002 2003 20042
Number of Banks/BHCs 1,627 1,562 1,484
Amount 81.39 87.31 94.60Under $100,000
Number 7,008,241 7,291,942 7,509,275
Amount 168.14 184.17 193.33$100,000–$1Million
Number 494,503 536,400 557,534
Amount 249.53 271.47 287.93Under $1 Million
Number 7,502,744 7,828,342 8,066,809
Total Assets3 Amount 7,040.34 7,539.06 8,016.59
Total Business Loans3 Amount 1,297.63 1,337.65 1,469.74
1 For institutions with balance sheet items identified from call reports respectively in June 2003, 2004, and 2005.
2 The figure for loans under $100,000 for CRA-reporting banks is likely to be an understatement because loans made by American Express Bank are excluded. The bank was not required to submit a CRA report after its reorganization in March 2004.
3 As of June 2003, 2004, and 2005.
Source: U.S. Small Business Administration, Office of Advocacy, Small Business Lending in the United States, various years, and special tabulations of the June 2005 call reports (Consolidated Reports of Condition and Income for U.S. banks and thrift institutions prepared for the Office of Advocacy by James Kolari, Texas A&M University, College Station Texas).

Small Business and Micro Business Lending, 2004-2005 9
Part Two: Directory of Top U.S. Small and Micro Business Lenders Small business lending and borrowing are mostly local in nature: both the borrowers and the lending offices are located in the same community or in communities nearby. In an effort to provide information that will help small businesses shop more efficiently for credit and let lenders know about their competitors in small business lending, the Office of Advocacy prepares a directory of small and micro business lenders.15 The performance of individual lending institutions is ranked for the national market (for multibillion-dollar lenders) and in each state. Tables 1A through 2B rank multibillion-dollar lenders in the national market (using call report data) and in each state (using CRA data). Table 3As through Table 4B list top small business lending institutions in individual states. Information for all reporting lenders (Tables 3A and 3B expanded) is available on Advocacy’s website, www.sba.gov/advo/research/lending.html.
Table 1A. Small Business Lending of Large Lending Institutions Based on Call Report Data, June 2005
Table 1A ranks the small business lending of the 99 largest lending institutions with total domestic assets of more than $10 billion.16 Each lending institution is ranked from 1 to 88 on each of four variables, which then are totaled and re-ranked from 1 to 88. (The remaining institutions are not ranked.)17
The top five small business lenders in June 2005 based on call report data, are American Express Bank FSB (first in 2004),18 Capital One FSB (not ranked in 2004), Regions Financial Corporation (second in 2004), BB&T Corporation (third in 2004), and Synovus Financial Corporation (fourth in 2004).
Table 1B. Micro Business Lending of Large Lending Institutions Based on Call Report Data, June 2005
Table 1B ranks the micro business lending of the 99 banks and bank holding companies with total domestic assets of more than $10 billion.19 Each lending institution is ranked from 1 to 74 on each of four variables, which then are totaled and re-ranked from 1 to 67; the remaining
15 This study examines small business lending in the economy by all lenders in the United States. No attempt has been made to distinguish SBA-guaranteed lenders in the analysis. Lenders are ranked based on their overall lending, not lending under SBA programs. 16 Two major credit card banks—American Express Centurion Bank (since March 2004) and Capital One Bank have organized federal savings banks (FSBs) to conduct their small business credit card operations. As a result, their call report submissions are not included in the call report filing for commercial banks, which is the focus of this statistical effort. Statistics for Capital One Bank are, therefore, not available in this ranking. 17 Not ranked because of missing information or a zero value for small business lending activities. 18 American Express reorganized its small business lending activities under a savings bank charter, American Express Bank FSB, in March 2004. 19 The four criteria used are the same as those for Table 1A.
Small Business and Micro Business Lending, 2004-2005 10
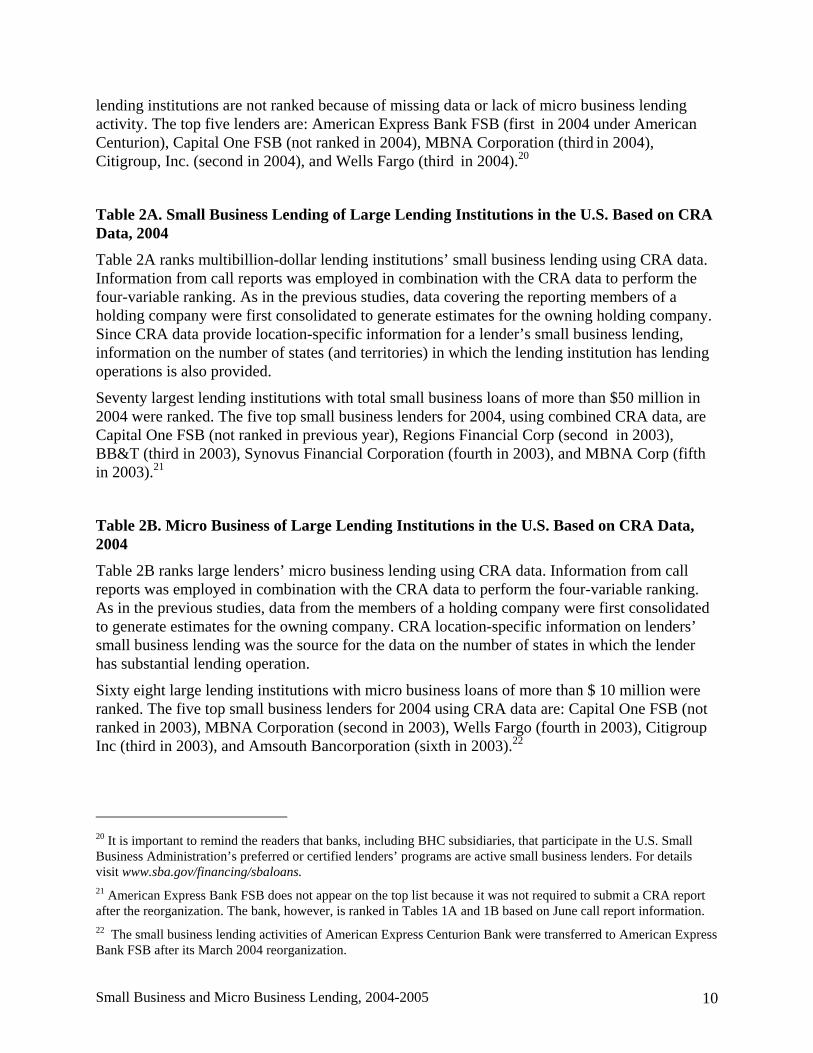
lending institutions are not ranked because of missing data or lack of micro business lending activity. The top five lenders are: American Express Bank FSB (first in 2004 under American Centurion), Capital One FSB (not ranked in 2004), MBNA Corporation (third in 2004), Citigroup, Inc. (second in 2004), and Wells Fargo (third in 2004).20
Table 2A. Small Business Lending of Large Lending Institutions in the U.S. Based on CRA Data, 2004
Table 2A ranks multibillion-dollar lending institutions’ small business lending using CRA data. Information from call reports was employed in combination with the CRA data to perform the four-variable ranking. As in the previous studies, data covering the reporting members of a holding company were first consolidated to generate estimates for the owning holding company. Since CRA data provide location-specific information for a lender’s small business lending, information on the number of states (and territories) in which the lending institution has lending operations is also provided.
Seventy largest lending institutions with total small business loans of more than $50 million in 2004 were ranked. The five top small business lenders for 2004, using combined CRA data, are Capital One FSB (not ranked in previous year), Regions Financial Corp (second in 2003), BB&T (third in 2003), Synovus Financial Corporation (fourth in 2003), and MBNA Corp (fifth in 2003).21
Table 2B. Micro Business of Large Lending Institutions in the U.S. Based on CRA Data, 2004
Table 2B ranks large lenders’ micro business lending using CRA data. Information from call reports was employed in combination with the CRA data to perform the four-variable ranking. As in the previous studies, data from the members of a holding company were first consolidated to generate estimates for the owning company. CRA location-specific information on lenders’ small business lending was the source for the data on the number of states in which the lender has substantial lending operation.
Sixty eight large lending institutions with micro business loans of more than $ 10 million were ranked. The five top small business lenders for 2004 using CRA data are: Capital One FSB (not ranked in 2003), MBNA Corporation (second in 2003), Wells Fargo (fourth in 2003), Citigroup Inc (third in 2003), and Amsouth Bancorporation (sixth in 2003).22
20 It is important to remind the readers that banks, including BHC subsidiaries, that participate in the U.S. Small Business Administration’s preferred or certified lenders’ programs are active small business lenders. For details visit www.sba.gov/financing/sbaloans. 21 American Express Bank FSB does not appear on the top list because it was not required to submit a CRA report after the reorganization. The bank, however, is ranked in Tables 1A and 1B based on June call report information. 22 The small business lending activities of American Express Centurion Bank were transferred to American Express Bank FSB after its March 2004 reorganization.

Small Business and Micro Business Lending, 2004-2005 11
Table 3A. Top Small Business Lending Institutions by State and Territory Based on Call Report Data, June 2005
Table 3A provides a list of the top institutions lending to small businesses in individual states. The list includes the top 10 or the top 10 percent, whichever number is smaller. (Ties may increase the number.) The small business lending performance of a lender in a given state is measured on four criteria. The four rankings were summed to create a score for the small business lending activities of individual lenders. A lender’s total score is the sum of the four individual decile rankings multiplied by 2.5. A complete ranking of all lending institutions in each state is provided on the Advocacy website, www.sba.gov/advo/research/lending.html.
Note again that call report data are keyed to the institution headquarters location rather than the location of the lending activity. A significant amount of lending activity by large lending institutions takes place in states other than those in which their headquarters are located.
Table 3B. Top Micro Business Lending Institutions by State and Territory Based on Call Report Data, June 2005
Table 3B provides a list of lending institutions making micro business loans (loans under $100,000) in individual states. The list includes the top 10 lenders or the top 10 percent, whichever number is smaller (ties may increase the number). The micro business lending performance of a lender in a given state is measured on four criteria. The four rankings were summed to create a score for the micro business lending activities of individual lenders. A lender’s total score is the sum of the four individual decile rankings multiplied by 2.5.
Table 4A. Top Small Business Lenders by State and Territory Using CRA Data, 2004
State lending information for large lending institutions is best captured in the CRA database. Table 4A provides a list of top small business lenders in a given state using CRA data. The list includes lending institutions with small business lending of more than $50 million in a given state in 2004. Data for the members of a holding company were consolidated first to generate estimates for the parent holding company. Consolidated estimates were then derived for each holding company in each state. Rankings are based solely on the dollar amount of small business lending (loans under $1 million) in this table because of the difficulty of generating two ratio variables for these institutions by state. Clearly, large lending institutions have an important role in the small business loan markets in many states.
Table 4B. Top Micro Business Lenders by State and Territory Using CRA Data, 2004
Table 4B provides a list of top micro business lenders in a given state using CRA data. The list includes lending institutions with micro business lending in a given state of more than $10 million in 2004. Again, rankings are based solely on the dollar amount of micro business lending (loans under $100,000) in this table for the reasons discussed above.

Small Business and Micro Business Lending, 2004-2005 12
Appendix: Data Notes Ranking Methodology and Table Descriptions
When possible, four variables were used to create a total score for the small business lending activities of individual lenders: (1) the ratio of small business loans to total assets, (2) the ratio of small business loans to total business loans, (3) the dollar value of small business loans, and (4) the number of small business loans. The total ranking summarizes the four individual scores. Small lending institutions tend to score higher in some categories than larger lending institutions, and vice versa. For example, smaller lenders have a higher percentage of total assets in small business loans, but larger lenders lead in the sheer number and value of small loans. Using two ratio variables and two value variables allows a more balanced measure of lending performance by lenders of different sizes.23
For large lending institutions in the call reports (Tables 1A and 1B), simple rankings from 1 and up were performed for each of the four variables first, with “1” for the top ranking. The four individual rankings were summed and re-ranked from 1 and up again for the total rank. For lending institutions using CRA data (Tables 2A and 2B), ratio information was retrieved from call report data and used in combination with information from the CRA to perform Advocacy’s four-variable scheme for ranking. Again, simple rankings were performed and summed to obtain total rankings.
For ranking of all reporting lending institutions in a state based on call report data (Tables 3A and 3B), a decile ranking is used instead of a simple ranking. This is justified because of a much larger number of lending institutions in a given state. The decile ranking is a measure of where the individual lender falls in the distribution of all lenders within a state for any given variable. Decile rankings range from 1 to 10. Lending institutions in the top 10 percent of all lenders in the state receive the maximum score of 10; lenders in the lowest 10 percent receive a score of 1. Lending institutions that do not lend to small businesses (loans under $1 million) receive a 0. Four top scores will sum to 40. To make the top score total 100 rather than 40, each score is multiplied by 2.5.
For state lending using the CRA data (Tables 4A and 4B), lenders were listed in order of the dollar amount of small business loans made in each state in the year. Large institutions therefore appear at the top.
23 The exception is those financial holding companies that organize special credit lending institutions such as a federal savings bank or commercial bank to conduct business lending. For example, by organizing a special business lending savings bank, American Express Savings Bank will have even higher values for the two ratio criterion used in the ranking process.
Small Business and Micro Business Lending, 2004-2005 13
Table Descriptions
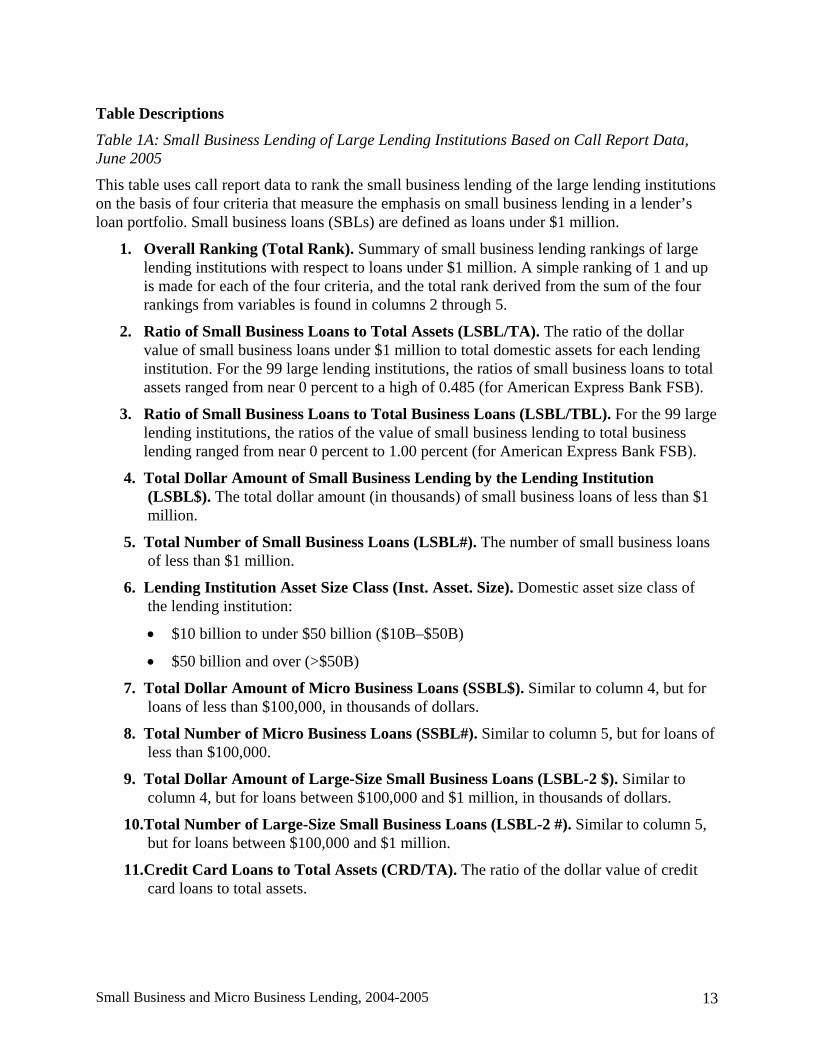
Table 1A: Small Business Lending of Large Lending Institutions Based on Call Report Data, June 2005
This table uses call report data to rank the small business lending of the large lending institutions on the basis of four criteria that measure the emphasis on small business lending in a lender’s loan portfolio. Small business loans (SBLs) are defined as loans under $1 million.
1. Overall Ranking (Total Rank). Summary of small business lending rankings of large lending institutions with respect to loans under $1 million. A simple ranking of 1 and up is made for each of the four criteria, and the total rank derived from the sum of the four rankings from variables is found in columns 2 through 5.
2. Ratio of Small Business Loans to Total Assets (LSBL/TA). The ratio of the dollar value of small business loans under $1 million to total domestic assets for each lending institution. For the 99 large lending institutions, the ratios of small business loans to total assets ranged from near 0 percent to a high of 0.485 (for American Express Bank FSB).
3. Ratio of Small Business Loans to Total Business Loans (LSBL/TBL). For the 99 large lending institutions, the ratios of the value of small business lending to total business lending ranged from near 0 percent to 1.00 percent (for American Express Bank FSB).
4. Total Dollar Amount of Small Business Lending by the Lending Institution (LSBL$). The total dollar amount (in thousands) of small business loans of less than $1 million.
5. Total Number of Small Business Loans (LSBL#). The number of small business loans of less than $1 million.
6. Lending Institution Asset Size Class (Inst. Asset. Size). Domestic asset size class of the lending institution:
• $10 billion to under $50 billion ($10B–$50B)
• $50 billion and over (>$50B)
7. Total Dollar Amount of Micro Business Loans (SSBL$). Similar to column 4, but for loans of less than $100,000, in thousands of dollars.
8. Total Number of Micro Business Loans (SSBL#). Similar to column 5, but for loans of less than $100,000.
9. Total Dollar Amount of Large-Size Small Business Loans (LSBL-2 $). Similar to column 4, but for loans between $100,000 and $1 million, in thousands of dollars.
10.Total Number of Large-Size Small Business Loans (LSBL-2 #). Similar to column 5, but for loans between $100,000 and $1 million.
11.Credit Card Loans to Total Assets (CRD/TA). The ratio of the dollar value of credit card loans to total assets.

Small Business and Micro Business Lending, 2004-2005 14
Table 1B: Micro Business Lending of Large Lending Institutions Based on Call Report Data, June 2005
This table uses call report data to rank the micro business lending of the large lending institutions on the basis of four criteria that measure the emphasis on micro business lending in a lender’s loan portfolio. Micro business loans (SSBLs) are defined as loans under $100,000.
1. Overall Ranking (Total Rank). Summary rankings of large lending institutions with respect to loans under $100,000. A simple ranking of 1 and up is made first, and the total rank is derived from the sum of four rankings from the variables found in columns 2 through 5.
2. Ratio of Micro Business Loans to Total Assets (SSBL/TA). The ratio of the total dollar value of micro business loans under $100,000 to the total assets for each lending institution. For the 99 largest lending institutions, the ratios of micro business loans to total assets ranged from near 0 to 0.485 percent (for American Express Bank FSB).
3. Ratio of Micro Business Loans to Total Business Loans (SSBL/TBL). For the 99 large lending institutions, the ratios of the value of micro business lending to total business lending ranged from near 0 percent to 1.000 percent. (American Express Bank FSB scored 1.000 percent because of the dominance of business credit cards and small credit lines in the lender’s business loans).
4. Total Dollar Amount of Micro Business Lending by the Lending Institution (SSBL$). The total dollar amount (in thousands) of loans less than $100,000.
5. Total Number of Micro Business Loans (SSBL#). The number of loans less than $100,000.
6. Lending Institution Asset Size Class (Inst. Asset Size). Asset size class of the lending institution:
• $10 billion to under $50 billion ($10B–$50B)
• $50 billion and over (>$50B)
7. Total Dollar Amount of Small Business Loans (LSBL$). Similar to column 4, but for loans of less than $1 million, in thousands of dollars.
8. Total Number of Small Business Loans (LSBL#). Similar to column 5, but for loans of less than $1 million.
9. Total Dollar Amount of Large-Size Small Business Loans (LSBL-2 $). Similar to column 4, but for loans between $100,000 and $1 million, in thousands of dollars.
10. Total Number of Large-Size Small Business Loans (LSBL-2 #). Similar to column 5, but for loans between $100,000 and $1 million.
11. Credit Card Loans to Total Assets (CRD/TA). The ratio of the dollar value of credit card loans to total assets.

Small Business and Micro Business Lending, 2004-2005 15
Table 2A: Small Business Lending of Large Lending Institutions in the U.S. Based on CRA Data, 2004
Table 2A uses both CRA and call report data to rank-order the 70 largest lending institutions on the basis of four criteria that measure the small business lending performance for a lender. Two ratio variables were derived from the call reports while the two value variables are from the CRA data.
1. Total Rank. Summary “small business performance” rankings of the lending institution with respect to loans under $1 million. A simple ranking of 1 through 70 for each of the four variables is performed first, and the sum of the four scores is used to derive the total rank. The four variables used are described in this table in columns 2 through 5.
2. The Ratio of Small Business Loans to Total Assets (LSBL/TA): This column shows the ratio of small business loans (<$1 million) to total assets for each lending institution. A high ratio indicates a lender’s willingness to place a large portion of its assets in small business lending.
3. The Ratio of the Dollar Amount of Small Business Loans to Total Business Loans (LSBL/TBL): The ratio of small business loans (<$1 million) to total business loans for each lender. Lending institutions that make business loans predominantly to small firms will rank high in this category.
4. Total Dollar Amount of Small Business Lending by the Lending Institutions (LSBL$). The total dollar amount (in thousands) of small business loans of less than $1 million.
5. Total Number of Small Business Loans (LSBL#). The number of small business loans of less than $1 million.
6. States w/Loans (No. of States w/ Loans). The number of states (and territories) where the lender extended small business loans.
7. Lending Institution Asset Size Class (Inst. Asset Size). Asset size class of the lending institution:
• $10 billion to under $50 billion ($10B–$50B)
• $50 billion and over (>$50B)
8. Total Dollar Amount of Micro Business Loans under $100,000 by the Lending Institution (SSBL$). Similar to column 4, but for loans of less than $100,000, in thousands of dollars.
9. Total Number of Micro Business Loans under $100,000 by the Lending Institution (SSBL#). Similar to column 5, but for loans of less than $100,000.
Table 2B: Micro Business Lending of Large Lending Institutions in the U.S. Based on CRA Data, 2004
Table 2B uses both CRA and call report data to rank order 68 large lending institutions on the basis of four criteria that measure the micro business lending performance for a lending

Small Business and Micro Business Lending, 2004-2005 16
institution. Two ratio variables were derived from the call reports. The four individual scores will be provided in the tables on the website.
1. Total Rank. Summary “micro business performance” rankings of lending institutions with respect to loans under $1 million. A simple ranking of 1 through 68 for each of the four variables is performed first, and the sum of the four scores is used to derive the total rank. The four criteria used are described in this table as items 2 through 5.
2. The Ratio of Micro Business Loans to Total Assets (SSBL/TA). This column shows the ratio of micro business loans (<$100,000) to total assets for each lending institution. A high ratio indicates a lender’s willingness to place a large portion of its assets in small business lending.
3. The Ratio of the Dollar Amount of Micro Business Loans to Total Business Loans (SSBL/TB). The ratio of micro business loans (<$100,000) to total business loans for each lender. Lenders that make business loans predominantly to small firms will rank high in this category.
4. Total Dollar Amount of Micro Business Lending by the Lending Institution (SSBL$). The total dollar amount (in thousands) of micro business loans of less than $100,000.
5. Total Number of Micro Business Loans (SSBL#). The number of micro business loans of less than $100,000.
6. States with Loans (No. States w/Loans). The number of states (territories) where the lender extended micro business loans.
7. Institution Asset Size Class (Inst. Asset Size). Asset size class of the lending institutions:
• $10 billion to under $50 billion ($10B–$50B)
• $50 billion and over (>$50B)
8. Total Dollar Amount of Small Business Loans by the Lending Institution (LSBL$). Similar to column 4, but for loans of less than $1 million, in thousands of dollars.
9. Total Number of Small Business Loans by the Lending Institution (LSBL#). Similar to column 5, but for loans of less than $1 million.
Table 3A: Top Small Business Lending of Lending Institutions by State and Territory Based on Call Report Data, June 2005
1. Total Score (Total Rank). The total rank found in the first column is the score of the lender in the state in which it is listed. The number is the aggregate measure of small business lending activity based on the sum of the four individual decile scores provided on the website.
2. The Ratio of Small Business Loans to Total Assets (LSBL/TA). This column shows the ratio of small business loans (<$1 million) to total assets for each lending institution.
Small Business and Micro Business Lending, 2004-2005 17
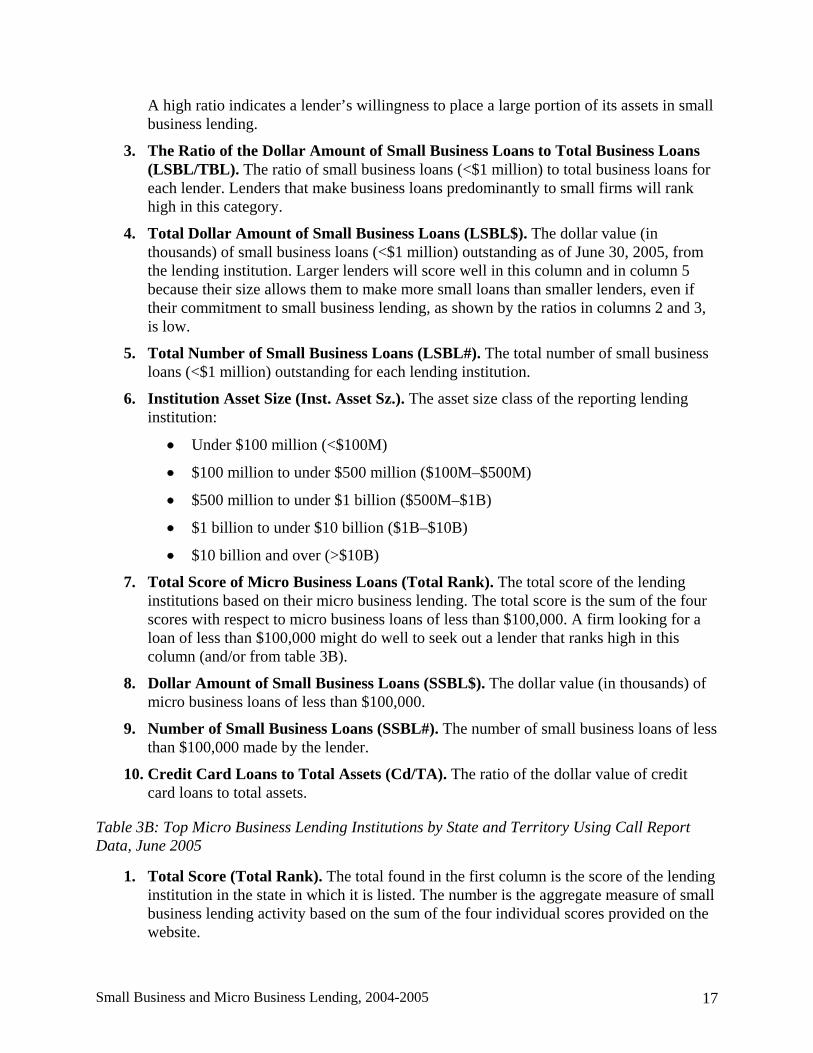
A high ratio indicates a lender’s willingness to place a large portion of its assets in small business lending.
3. The Ratio of the Dollar Amount of Small Business Loans to Total Business Loans (LSBL/TBL). The ratio of small business loans (<$1 million) to total business loans for each lender. Lenders that make business loans predominantly to small firms will rank high in this category.
4. Total Dollar Amount of Small Business Loans (LSBL$). The dollar value (in thousands) of small business loans (<$1 million) outstanding as of June 30, 2005, from the lending institution. Larger lenders will score well in this column and in column 5 because their size allows them to make more small loans than smaller lenders, even if their commitment to small business lending, as shown by the ratios in columns 2 and 3, is low.
5. Total Number of Small Business Loans (LSBL#). The total number of small business loans (<$1 million) outstanding for each lending institution.
6. Institution Asset Size (Inst. Asset Sz.). The asset size class of the reporting lending institution:
• Under $100 million (<$100M)
• $100 million to under $500 million ($100M–$500M)
• $500 million to under $1 billion ($500M–$1B)
• $1 billion to under $10 billion ($1B–$10B)
• $10 billion and over (>$10B)
7. Total Score of Micro Business Loans (Total Rank). The total score of the lending institutions based on their micro business lending. The total score is the sum of the four scores with respect to micro business loans of less than $100,000. A firm looking for a loan of less than $100,000 might do well to seek out a lender that ranks high in this column (and/or from table 3B).
8. Dollar Amount of Small Business Loans (SSBL$). The dollar value (in thousands) of micro business loans of less than $100,000.
9. Number of Small Business Loans (SSBL#). The number of small business loans of less than $100,000 made by the lender.
10. Credit Card Loans to Total Assets (Cd/TA). The ratio of the dollar value of credit card loans to total assets.
Table 3B: Top Micro Business Lending Institutions by State and Territory Using Call Report Data, June 2005
1. Total Score (Total Rank). The total found in the first column is the score of the lending institution in the state in which it is listed. The number is the aggregate measure of small business lending activity based on the sum of the four individual scores provided on the website.

Small Business and Micro Business Lending, 2004-2005 18
2. The Ratio of Micro Business Loans to Total Assets (SSBL/TA). This column shows the ratio of micro business loans (<$100,000) to total assets for each lender. A high ratio indicates a lender’s willingness to place a large portion of its assets in small business lending.
3. The Ratio of the Dollar Amount of Micro Business Loans to Total Business Loans (SSBL/TBL). The ratio of micro business loans (<$100,000) to total business loans for each lending institution. Lenders that make business loans predominantly to small firms will rank high in this category.
4. Total Dollar Amount of Micro Business Loans (SSBL$). The dollar value (in thousands) of micro business loans (<$100,000) outstanding from the lending institution. Larger lenders will score well in this column and in column 5 because their size allows them to make many small loans, even if their commitment to micro business lending, as shown by the ratios in columns 2 and 3, is low.
5. Total Number of Micro Business Loans (SSBL#): The total number of micro business loans (<$100,000) outstanding for each lending institution.
6. Institution Asset Size (Inst. Asset Sz.): The asset size class of the reporting lending institution:
• Under $100 million (<$100M)
• $100 million to under $500 million ($100M–$500M)
• $500 million to under $1 billion ($500M–$1B)
• $1 billion to under $10 billion ($1B–$10B)
• $10 billion and over (>$10B)
7. Total Score of Small Business Loans (Total Rank). The total score of the lenders based on their small business lending. The total score is the sum of the four scores with respect to small business loans of less than $1 million. A firm looking for a loan of less than $1 million might do well to seek out a lender that ranks high in this column (and/or from Table 3A).
8. Dollar Amount of Small Business Loans (LSBL$). The dollar value (in thousands) of micro business loans of less than $1 million.
9. Number of Small Business Loans (LSBL#). The number of small business loans of less than $1 million made by the lender.
Table 4A: Top Small Business Lenders by State and Territory Using CRA Data, 2004
Table 4A is formatted differently from Table 3A because only CRA data are used. The table lists the lending institution name—the name of the owning lending institution—as well as the home state of the lending institution. Lenders are ranked on the basis of the dollar amount of small business loans (under $1 million) made in 2004. The table also provides the dollar amount and number of small business loans for micro loans under $100,000 and for large-sized loans between $100,000 and $1 million. Only lenders with small business loan totals of more than $50 million in a given state in 2004 are listed.
Small Business and Micro Business Lending, 2004-2005 19
1. Amount of Small Business Loans (LSBL$). The dollar amount, in thousands, of loans under $1 million made in 2004.
2. Number of Small Business Loans (LSBL#). The number of loans of less than $1 million made.
3. Institution Asset Size (Inst. Asset Size): The total assets of the owning institution by size category:
• Under $1 billion (<$1B)
• $1 billion to under $10 billion ($1B-$10B)
• $10 billion to $50 billion ($10B-$50B)
• $50 billion and over (>$50B)
4. Dollar Amount of Micro Business Loans (SSBL$). The dollar amount, in thousands, of loans of less than $100,000.
5. Number of Micro Business Loans (SSBL#). The number of loans of less than $100,000.
6. Dollar Amount of Large-Size Small Business Loans (LSBL-2 $). The dollar amount, in thousands, for loans between $100,000 and $1 million.
7. Number of Large-Size Small Business Loans (LSBL-2 #). The number of larger-small business loans for loans between $100,000 and $1 million.
Table 4B: Top Micro Business Lenders by State and Territory Using CRA Data, 2004
Table 4B, similar to Table 4A, lists the lending institutions name—the name of the owning institution or the holding company—as well as the home state of the lending institution. Lenders are ranked on the basis of the dollar amount of loans made in 2004. The table provides the dollar amount and number of micro business loans under $100,000, supplemented by mid-sized small business loans under $250,000, and small business loans under $1 million. Only lenders with micro business loan totals of more than $10 million in a given state in 2004 are listed.
1. Amount of Micro Business Loans (SSBL$). The dollar amount, in thousands, of loans under $100,000 made in 2003.
2. Number of Micro Business Loans (SSBL#). The number of loans of less than $100,000 million made.
3. Institution Asset Size (Inst. Asset Size). The total assets of the owning institution by size category:
• Under $1 billion (<$1B)
• $1 billion to under $10 billion ($1B-$10B)
• $10 billion to $50 billion ($10B-$50B)
• $50 billion and over (>$50B)

Small Business and Micro Business Lending, 2004-2005 20
4. Dollar Amount of Small Business Loans (LSBL$). The dollar amount, in thousands, of loans of less than $1 million.
5. Number of Small Business Loans (LSBL#). The number of loans of less than $1 million.
6. Dollar Amount of Large-Size Small Business Loans (LSBL-2 $). The dollar amount, in thousands, for loans between $100,000 and $1 million.
7. Number of Large-Size Small Business Loans (LSBL-2 #). The number of larger small business loans for loans between $100,000 and $1 million.
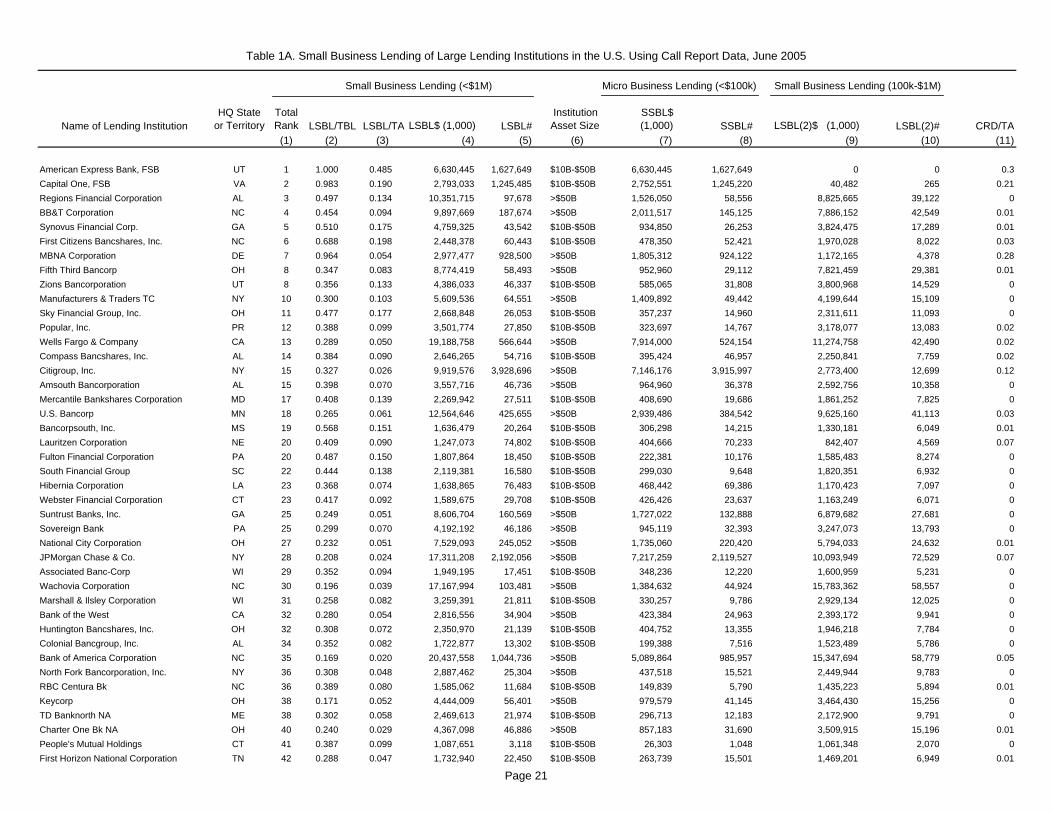
Table 1A. Small Business Lending of Large Lending Institutions in the U.S. Using Call Report Data, June 2005
Name of Lending InstitutionHQ State
or TerritoryTotal Rank LSBL/TBL LSBL/TA LSBL$ (1,000) LSBL#
Institution Asset Size
SSBL$ (1,000) SSBL# LSBL(2)$ (1,000) LSBL(2)# CRD/TA
(1) (2) (3) (4) (5) (6) (7) (8) (9) (10) (11)
American Express Bank, FSB UT 1 1.000 0.485 6,630,445 1,627,649 $10B-$50B 6,630,445 1,627,649 0 0 0.3Capital One, FSB VA 2 0.983 0.190 2,793,033 1,245,485 $10B-$50B 2,752,551 1,245,220 40,482 265 0.21Regions Financial Corporation AL 3 0.497 0.134 10,351,715 97,678 >$50B 1,526,050 58,556 8,825,665 39,122 0BB&T Corporation NC 4 0.454 0.094 9,897,669 187,674 >$50B 2,011,517 145,125 7,886,152 42,549 0.01Synovus Financial Corp. GA 5 0.510 0.175 4,759,325 43,542 $10B-$50B 934,850 26,253 3,824,475 17,289 0.01First Citizens Bancshares, Inc. NC 6 0.688 0.198 2,448,378 60,443 $10B-$50B 478,350 52,421 1,970,028 8,022 0.03MBNA Corporation DE 7 0.964 0.054 2,977,477 928,500 >$50B 1,805,312 924,122 1,172,165 4,378 0.28Fifth Third Bancorp OH 8 0.347 0.083 8,774,419 58,493 >$50B 952,960 29,112 7,821,459 29,381 0.01Zions Bancorporation UT 8 0.356 0.133 4,386,033 46,337 $10B-$50B 585,065 31,808 3,800,968 14,529 0Manufacturers & Traders TC NY 10 0.300 0.103 5,609,536 64,551 >$50B 1,409,892 49,442 4,199,644 15,109 0Sky Financial Group, Inc. OH 11 0.477 0.177 2,668,848 26,053 $10B-$50B 357,237 14,960 2,311,611 11,093 0Popular, Inc. PR 12 0.388 0.099 3,501,774 27,850 $10B-$50B 323,697 14,767 3,178,077 13,083 0.02Wells Fargo & Company CA 13 0.289 0.050 19,188,758 566,644 >$50B 7,914,000 524,154 11,274,758 42,490 0.02Compass Bancshares, Inc. AL 14 0.384 0.090 2,646,265 54,716 $10B-$50B 395,424 46,957 2,250,841 7,759 0.02Citigroup, Inc. NY 15 0.327 0.026 9,919,576 3,928,696 >$50B 7,146,176 3,915,997 2,773,400 12,699 0.12Amsouth Bancorporation AL 15 0.398 0.070 3,557,716 46,736 >$50B 964,960 36,378 2,592,756 10,358 0Mercantile Bankshares Corporation MD 17 0.408 0.139 2,269,942 27,511 $10B-$50B 408,690 19,686 1,861,252 7,825 0U.S. Bancorp MN 18 0.265 0.061 12,564,646 425,655 >$50B 2,939,486 384,542 9,625,160 41,113 0.03Bancorpsouth, Inc. MS 19 0.568 0.151 1,636,479 20,264 $10B-$50B 306,298 14,215 1,330,181 6,049 0.01Lauritzen Corporation NE 20 0.409 0.090 1,247,073 74,802 $10B-$50B 404,666 70,233 842,407 4,569 0.07Fulton Financial Corporation PA 20 0.487 0.150 1,807,864 18,450 $10B-$50B 222,381 10,176 1,585,483 8,274 0South Financial Group SC 22 0.444 0.138 2,119,381 16,580 $10B-$50B 299,030 9,648 1,820,351 6,932 0Hibernia Corporation LA 23 0.368 0.074 1,638,865 76,483 $10B-$50B 468,442 69,386 1,170,423 7,097 0Webster Financial Corporation CT 23 0.417 0.092 1,589,675 29,708 $10B-$50B 426,426 23,637 1,163,249 6,071 0Suntrust Banks, Inc. GA 25 0.249 0.051 8,606,704 160,569 >$50B 1,727,022 132,888 6,879,682 27,681 0Sovereign Bank PA 25 0.299 0.070 4,192,192 46,186 >$50B 945,119 32,393 3,247,073 13,793 0National City Corporation OH 27 0.232 0.051 7,529,093 245,052 >$50B 1,735,060 220,420 5,794,033 24,632 0.01JPMorgan Chase & Co. NY 28 0.208 0.024 17,311,208 2,192,056 >$50B 7,217,259 2,119,527 10,093,949 72,529 0.07Associated Banc-Corp WI 29 0.352 0.094 1,949,195 17,451 $10B-$50B 348,236 12,220 1,600,959 5,231 0Wachovia Corporation NC 30 0.196 0.039 17,167,994 103,481 >$50B 1,384,632 44,924 15,783,362 58,557 0Marshall & Ilsley Corporation WI 31 0.258 0.082 3,259,391 21,811 $10B-$50B 330,257 9,786 2,929,134 12,025 0Bank of the West CA 32 0.280 0.054 2,816,556 34,904 >$50B 423,384 24,963 2,393,172 9,941 0Huntington Bancshares, Inc. OH 32 0.308 0.072 2,350,970 21,139 $10B-$50B 404,752 13,355 1,946,218 7,784 0Colonial Bancgroup, Inc. AL 34 0.352 0.082 1,722,877 13,302 $10B-$50B 199,388 7,516 1,523,489 5,786 0Bank of America Corporation NC 35 0.169 0.020 20,437,558 1,044,736 >$50B 5,089,864 985,957 15,347,694 58,779 0.05North Fork Bancorporation, Inc. NY 36 0.308 0.048 2,887,462 25,304 >$50B 437,518 15,521 2,449,944 9,783 0RBC Centura Bk NC 36 0.389 0.080 1,585,062 11,684 $10B-$50B 149,839 5,790 1,435,223 5,894 0.01Keycorp OH 38 0.171 0.052 4,444,009 56,401 >$50B 979,579 41,145 3,464,430 15,256 0TD Banknorth NA ME 38 0.302 0.058 2,469,613 21,974 $10B-$50B 296,713 12,183 2,172,900 9,791 0Charter One Bk NA OH 40 0.240 0.029 4,367,098 46,886 >$50B 857,183 31,690 3,509,915 15,196 0.01People's Mutual Holdings CT 41 0.387 0.099 1,087,651 3,118 $10B-$50B 26,303 1,048 1,061,348 2,070 0First Horizon National Corporation TN 42 0.288 0.047 1,732,940 22,450 $10B-$50B 263,739 15,501 1,469,201 6,949 0.01
Micro Business Lending (<$100k) Small Business Lending (<$1M) Small Business Lending (100k-$1M)
Page 21
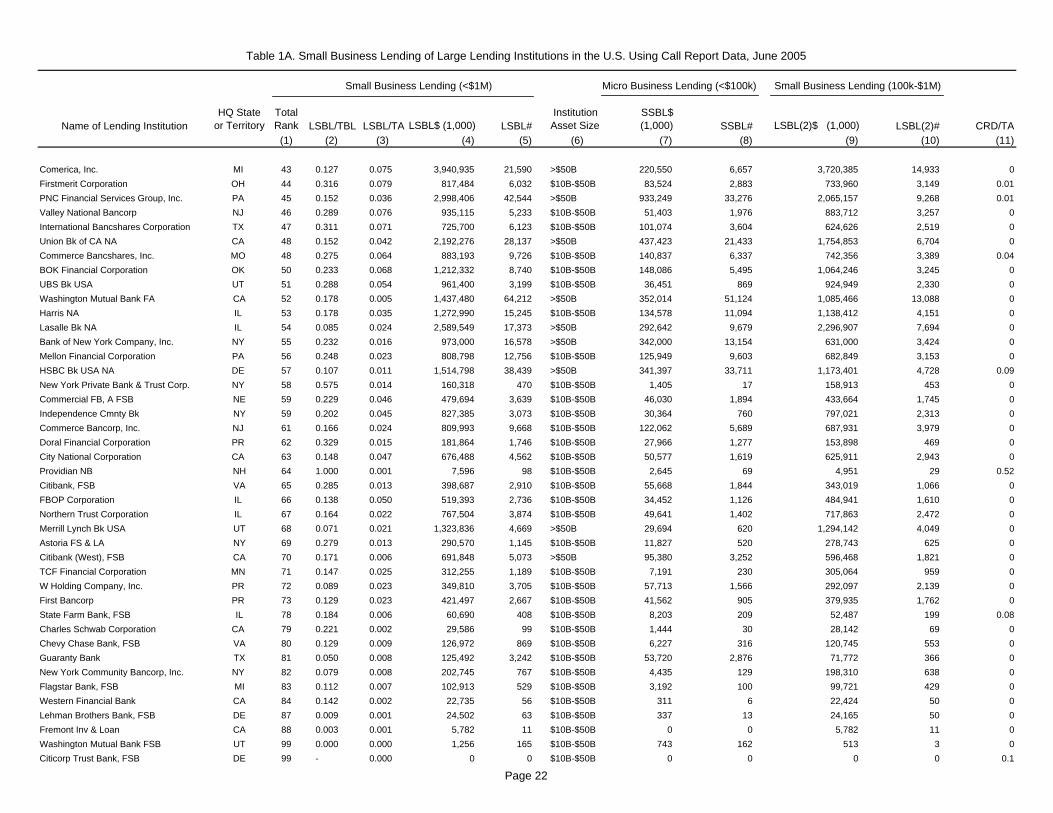
Table 1A. Small Business Lending of Large Lending Institutions in the U.S. Using Call Report Data, June 2005
Name of Lending InstitutionHQ State
or TerritoryTotal Rank LSBL/TBL LSBL/TA LSBL$ (1,000) LSBL#
Institution Asset Size
SSBL$ (1,000) SSBL# LSBL(2)$ (1,000) LSBL(2)# CRD/TA
(1) (2) (3) (4) (5) (6) (7) (8) (9) (10) (11)
Micro Business Lending (<$100k) Small Business Lending (<$1M) Small Business Lending (100k-$1M)
Comerica, Inc. MI 43 0.127 0.075 3,940,935 21,590 >$50B 220,550 6,657 3,720,385 14,933 0Firstmerit Corporation OH 44 0.316 0.079 817,484 6,032 $10B-$50B 83,524 2,883 733,960 3,149 0.01PNC Financial Services Group, Inc. PA 45 0.152 0.036 2,998,406 42,544 >$50B 933,249 33,276 2,065,157 9,268 0.01Valley National Bancorp NJ 46 0.289 0.076 935,115 5,233 $10B-$50B 51,403 1,976 883,712 3,257 0International Bancshares Corporation TX 47 0.311 0.071 725,700 6,123 $10B-$50B 101,074 3,604 624,626 2,519 0Union Bk of CA NA CA 48 0.152 0.042 2,192,276 28,137 >$50B 437,423 21,433 1,754,853 6,704 0Commerce Bancshares, Inc. MO 48 0.275 0.064 883,193 9,726 $10B-$50B 140,837 6,337 742,356 3,389 0.04BOK Financial Corporation OK 50 0.233 0.068 1,212,332 8,740 $10B-$50B 148,086 5,495 1,064,246 3,245 0UBS Bk USA UT 51 0.288 0.054 961,400 3,199 $10B-$50B 36,451 869 924,949 2,330 0Washington Mutual Bank FA CA 52 0.178 0.005 1,437,480 64,212 >$50B 352,014 51,124 1,085,466 13,088 0Harris NA IL 53 0.178 0.035 1,272,990 15,245 $10B-$50B 134,578 11,094 1,138,412 4,151 0Lasalle Bk NA IL 54 0.085 0.024 2,589,549 17,373 >$50B 292,642 9,679 2,296,907 7,694 0Bank of New York Company, Inc. NY 55 0.232 0.016 973,000 16,578 >$50B 342,000 13,154 631,000 3,424 0Mellon Financial Corporation PA 56 0.248 0.023 808,798 12,756 $10B-$50B 125,949 9,603 682,849 3,153 0HSBC Bk USA NA DE 57 0.107 0.011 1,514,798 38,439 >$50B 341,397 33,711 1,173,401 4,728 0.09New York Private Bank & Trust Corp. NY 58 0.575 0.014 160,318 470 $10B-$50B 1,405 17 158,913 453 0Commercial FB, A FSB NE 59 0.229 0.046 479,694 3,639 $10B-$50B 46,030 1,894 433,664 1,745 0Independence Cmnty Bk NY 59 0.202 0.045 827,385 3,073 $10B-$50B 30,364 760 797,021 2,313 0Commerce Bancorp, Inc. NJ 61 0.166 0.024 809,993 9,668 $10B-$50B 122,062 5,689 687,931 3,979 0Doral Financial Corporation PR 62 0.329 0.015 181,864 1,746 $10B-$50B 27,966 1,277 153,898 469 0City National Corporation CA 63 0.148 0.047 676,488 4,562 $10B-$50B 50,577 1,619 625,911 2,943 0Providian NB NH 64 1.000 0.001 7,596 98 $10B-$50B 2,645 69 4,951 29 0.52Citibank, FSB VA 65 0.285 0.013 398,687 2,910 $10B-$50B 55,668 1,844 343,019 1,066 0FBOP Corporation IL 66 0.138 0.050 519,393 2,736 $10B-$50B 34,452 1,126 484,941 1,610 0Northern Trust Corporation IL 67 0.164 0.022 767,504 3,874 $10B-$50B 49,641 1,402 717,863 2,472 0Merrill Lynch Bk USA UT 68 0.071 0.021 1,323,836 4,669 >$50B 29,694 620 1,294,142 4,049 0Astoria FS & LA NY 69 0.279 0.013 290,570 1,145 $10B-$50B 11,827 520 278,743 625 0Citibank (West), FSB CA 70 0.171 0.006 691,848 5,073 >$50B 95,380 3,252 596,468 1,821 0TCF Financial Corporation MN 71 0.147 0.025 312,255 1,189 $10B-$50B 7,191 230 305,064 959 0W Holding Company, Inc. PR 72 0.089 0.023 349,810 3,705 $10B-$50B 57,713 1,566 292,097 2,139 0First Bancorp PR 73 0.129 0.023 421,497 2,667 $10B-$50B 41,562 905 379,935 1,762 0State Farm Bank, FSB IL 78 0.184 0.006 60,690 408 $10B-$50B 8,203 209 52,487 199 0.08Charles Schwab Corporation CA 79 0.221 0.002 29,586 99 $10B-$50B 1,444 30 28,142 69 0Chevy Chase Bank, FSB VA 80 0.129 0.009 126,972 869 $10B-$50B 6,227 316 120,745 553 0Guaranty Bank TX 81 0.050 0.008 125,492 3,242 $10B-$50B 53,720 2,876 71,772 366 0New York Community Bancorp, Inc. NY 82 0.079 0.008 202,745 767 $10B-$50B 4,435 129 198,310 638 0Flagstar Bank, FSB MI 83 0.112 0.007 102,913 529 $10B-$50B 3,192 100 99,721 429 0Western Financial Bank CA 84 0.142 0.002 22,735 56 $10B-$50B 311 6 22,424 50 0Lehman Brothers Bank, FSB DE 87 0.009 0.001 24,502 63 $10B-$50B 337 13 24,165 50 0Fremont Inv & Loan CA 88 0.003 0.001 5,782 11 $10B-$50B 0 0 5,782 11 0Washington Mutual Bank FSB UT 99 0.000 0.000 1,256 165 $10B-$50B 743 162 513 3 0Citicorp Trust Bank, FSB DE 99 - 0.000 0 0 $10B-$50B 0 0 0 0 0.1
Page 22

Table 1A. Small Business Lending of Large Lending Institutions in the U.S. Using Call Report Data, June 2005
Name of Lending InstitutionHQ State
or TerritoryTotal Rank LSBL/TBL LSBL/TA LSBL$ (1,000) LSBL#
Institution Asset Size
SSBL$ (1,000) SSBL# LSBL(2)$ (1,000) LSBL(2)# CRD/TA
(1) (2) (3) (4) (5) (6) (7) (8) (9) (10) (11)
Micro Business Lending (<$100k) Small Business Lending (<$1M) Small Business Lending (100k-$1M)
Discover Bk DE 99 - 0.000 0 0 $10B-$50B 0 0 0 0 0.91E*Trade Bank VA 99 0.000 0.000 0 0 $10B-$50B 0 0 0 0 0.01Indymac Bank, FSB CA 99 0.000 0.000 0 0 $10B-$50B 0 0 0 0 0ING Bank, FSB DE 99 - 0.000 0 0 $10B-$50B 0 0 0 0 0Merrill Lynch B&TC NJ 99 - 0.000 0 0 $10B-$50B 0 0 0 0 0State Street Corporation MA 99 0.000 0.000 0 0 >$50B 0 0 0 0 0World Savings Bank, FSB (Texas) TX 99 - 0.000 0 0 $10B-$50B 0 0 0 0 0Deutsche Bk TC Americas NY 99 0.001 0.000 4,000 8 $10B-$50B 0 1 4,000 7 0Downey S & LA, F.A. CA 99 0.210 0.000 6,248 21 $10B-$50B 0 0 6,248 21 0USAA Federal Savings Bank TX 99 1.000 0.000 1,291 5 $10B-$50B 0 0 1,291 5 0.38Countrywide Financial Corporation CA 99 1.000 0.000 385 1 >$50B 0 0 385 1 0Ohio Savings Bank OH 99 0.068 0.000 3,632 48 $10B-$50B 475 35 3,157 13 0Investors Financial Services Corp. MA 99 0.268 0.000 3,285 17 $10B-$50B 249 5 3,036 12 0World Savings Bank, FSB CA 99 0.596 0.000 6,572 48 >$50B 533 18 6,039 30 0Hudson City Savings Bank NJ 99 1.000 0.000 325 4 $10B-$50B 177 2 148 2 0Source: U.S. Small Business Administration, Office of Advocacy, from Call Report data.
Page 23

Table 1B. Micro Business Lending of Large Lending Institution in the U.S. Using Call Report Data, June 2005
Name of Lending InstitutionHQ State or
TerritoryTotal Rank SSBL/TA SSBL/TBL SSBL$ (1,000) SSBL#
Institution Asset Size
LSBL$ (1,000) LSBL# LSBL(2)$ (1,000) LSBL(2)# CRD/TA
(1) (2) (3) (4) (5) (6) (7) (8) (9) (10) (11)
American Express Bank, FSB UT 1 0.485 1.000 6,630,445 1,627,649 $10B-$50B 6,630,445 1,627,649 0 0 0.3Capital One, FSB VA 2 0.187 0.969 2,752,551 1,245,220 $10B-$50B 2,793,033 1,245,485 40,482 265 0.21MBNA Corporation DE 3 0.033 0.584 1,805,312 924,122 >$50B 2,977,477 928,500 1,172,165 4,378 0.28Citigroup, Inc. NY 4 0.018 0.236 7,146,176 3,915,997 >$50B 9,919,576 3,928,696 2,773,400 12,699 0.12Wells Fargo & Company CA 5 0.020 0.119 7,914,000 524,154 >$50B 19,188,758 566,644 11,274,758 42,490 0.02First Citizens Bancshares, Inc. NC 6 0.039 0.135 478,350 52,421 $10B-$50B 2,448,378 60,443 1,970,028 8,022 0.03BB&T Corporation NC 7 0.019 0.092 2,011,517 145,125 >$50B 9,897,669 187,674 7,886,152 42,549 0.01JPMorgan Chase & Co. NY 7 0.010 0.087 7,217,259 2,119,527 >$50B 17,311,208 2,192,056 10,093,949 72,529 0.07Manufacturers & Traders TC NY 9 0.026 0.075 1,409,892 49,442 >$50B 5,609,536 64,551 4,199,644 15,109 0Lauritzen Corporation NE 10 0.029 0.133 404,666 70,233 $10B-$50B 1,247,073 74,802 842,407 4,569 0.07Regions Financial Corporation AL 11 0.020 0.073 1,526,050 58,556 >$50B 10,351,715 97,678 8,825,665 39,122 0U.S. Bancorp MN 12 0.014 0.062 2,939,486 384,542 >$50B 12,564,646 425,655 9,625,160 41,113 0.03Hibernia Corporation LA 12 0.021 0.105 468,442 69,386 $10B-$50B 1,638,865 76,483 1,170,423 7,097 0Amsouth Bancorporation AL 14 0.019 0.108 964,960 36,378 >$50B 3,557,716 46,736 2,592,756 10,358 0Synovus Financial Corp. GA 15 0.034 0.100 934,850 26,253 $10B-$50B 4,759,325 43,542 3,824,475 17,289 0.01National City Corporation OH 16 0.012 0.053 1,735,060 220,420 >$50B 7,529,093 245,052 5,794,033 24,632 0.01Webster Financial Corporation CT 17 0.025 0.112 426,426 23,637 $10B-$50B 1,589,675 29,708 1,163,249 6,071 0Suntrust Banks, Inc. GA 18 0.010 0.050 1,727,022 132,888 >$50B 8,606,704 160,569 6,879,682 27,681 0Sovereign Bank PA 19 0.016 0.067 945,119 32,393 >$50B 4,192,192 46,186 3,247,073 13,793 0Mercantile Bankshares Corporation MD 20 0.025 0.073 408,690 19,686 $10B-$50B 2,269,942 27,511 1,861,252 7,825 0Bancorpsouth, Inc. MS 21 0.028 0.106 306,298 14,215 $10B-$50B 1,636,479 20,264 1,330,181 6,049 0.01Zions Bancorporation UT 22 0.018 0.048 585,065 31,808 $10B-$50B 4,386,033 46,337 3,800,968 14,529 0Bank of America Corporation NC 22 0.005 0.042 5,089,864 985,957 >$50B 20,437,558 1,044,736 15,347,694 58,779 0.05Sky Financial Group, Inc. OH 24 0.024 0.064 357,237 14,960 $10B-$50B 2,668,848 26,053 2,311,611 11,093 0Compass Bancshares, Inc. AL 24 0.013 0.057 395,424 46,957 $10B-$50B 2,646,265 54,716 2,250,841 7,759 0.02PNC Financial Services Group, Inc. PA 26 0.011 0.047 933,249 33,276 >$50B 2,998,406 42,544 2,065,157 9,268 0.01Keycorp OH 27 0.012 0.038 979,579 41,145 >$50B 4,444,009 56,401 3,464,430 15,256 0Associated Banc-Corp WI 28 0.017 0.063 348,236 12,220 $10B-$50B 1,949,195 17,451 1,600,959 5,231 0Huntington Bancshares, Inc. OH 29 0.012 0.053 404,752 13,355 $10B-$50B 2,350,970 21,139 1,946,218 7,784 0South Financial Group SC 30 0.020 0.063 299,030 9,648 $10B-$50B 2,119,381 16,580 1,820,351 6,932 0Fifth Third Bancorp OH 31 0.009 0.038 952,960 29,112 >$50B 8,774,419 58,493 7,821,459 29,381 0.01Charter One Bk NA OH 32 0.006 0.047 857,183 31,690 >$50B 4,367,098 46,886 3,509,915 15,196 0.01Fulton Financial Corporation PA 33 0.018 0.060 222,381 10,176 $10B-$50B 1,807,864 18,450 1,585,483 8,274 0Bank of The West CA 33 0.008 0.042 423,384 24,963 >$50B 2,816,556 34,904 2,393,172 9,941 0North Fork Bancorporation, Inc. NY 35 0.007 0.047 437,518 15,521 >$50B 2,887,462 25,304 2,449,944 9,783 0Bank of New York Company, Inc. NY 36 0.006 0.082 342,000 13,154 >$50B 973,000 16,578 631,000 3,424 0Union Bk of CA NA CA 37 0.008 0.030 437,423 21,433 >$50B 2,192,276 28,137 1,754,853 6,704 0Wachovia Corporation NC 38 0.003 0.016 1,384,632 44,924 >$50B 17,167,994 103,481 15,783,362 58,557 0Washington Mutual Bank FA CA 39 0.001 0.044 352,014 51,124 >$50B 1,437,480 64,212 1,085,466 13,088 0First Horizon National Corporation TN 40 0.007 0.044 263,739 15,501 $10B-$50B 1,732,940 22,450 1,469,201 6,949 0.01
Micro Business Lending (<$100k) Small Business Lending (<$1M) Small Business Lending (100k-$1M)
Page 24

Table 1B. Micro Business Lending of Large Lending Institution in the U.S. Using Call Report Data, June 2005
Name of Lending InstitutionHQ State or
TerritoryTotal Rank SSBL/TA SSBL/TBL SSBL$ (1,000) SSBL#
Institution Asset Size
LSBL$ (1,000) LSBL# LSBL(2)$ (1,000) LSBL(2)# CRD/TA
(1) (2) (3) (4) (5) (6) (7) (8) (9) (10) (11)
Micro Business Lending (<$100k) Small Business Lending (<$1M) Small Business Lending (100k-$1M)
Popular, Inc. PR 41 0.009 0.036 323,697 14,767 $10B-$50B 3,501,774 27,850 3,178,077 13,083 0.02Commerce Bancshares, Inc. MO 42 0.010 0.044 140,837 6,337 $10B-$50B 883,193 9,726 742,356 3,389 0.04Colonial Bancgroup, Inc. AL 43 0.010 0.041 199,388 7,516 $10B-$50B 1,722,877 13,302 1,523,489 5,786 0Marshall & Ilsley Corporation WI 44 0.008 0.026 330,257 9,786 $10B-$50B 3,259,391 21,811 2,929,134 12,025 0TD Banknorth NA ME 45 0.007 0.036 296,713 12,183 $10B-$50B 2,469,613 21,974 2,172,900 9,791 0HSBC Bk USA NA DE 46 0.003 0.024 341,397 33,711 >$50B 1,514,798 38,439 1,173,401 4,728 0.09International Bancshares Corporation TX 47 0.010 0.043 101,074 3,604 $10B-$50B 725,700 6,123 624,626 2,519 0RBC Centura Bk NC 48 0.008 0.037 149,839 5,790 $10B-$50B 1,585,062 11,684 1,435,223 5,894 0.01BOK Financial Corporation OK 49 0.008 0.029 148,086 5,495 $10B-$50B 1,212,332 8,740 1,064,246 3,245 0Mellon Financial Corporation PA 50 0.004 0.039 125,949 9,603 $10B-$50B 808,798 12,756 682,849 3,153 0Firstmerit Corporation OH 51 0.008 0.032 83,524 2,883 $10B-$50B 817,484 6,032 733,960 3,149 0.01Harris NA IL 52 0.004 0.019 134,578 11,094 $10B-$50B 1,272,990 15,245 1,138,412 4,151 0Commerce Bancorp, Inc. NJ 53 0.004 0.025 122,062 5,689 $10B-$50B 809,993 9,668 687,931 3,979 0Lasalle Bk NA IL 54 0.003 0.010 292,642 9,679 >$50B 2,589,549 17,373 2,296,907 7,694 0Comerica, Inc. MI 55 0.004 0.007 220,550 6,657 >$50B 3,940,935 21,590 3,720,385 14,933 0Citibank, FSB VA 56 0.002 0.040 55,668 1,844 $10B-$50B 398,687 2,910 343,019 1,066 0Doral Financial Corporation PR 57 0.002 0.051 27,966 1,277 $10B-$50B 181,864 1,746 153,898 469 0Valley National Bancorp NJ 58 0.004 0.016 51,403 1,976 $10B-$50B 935,115 5,233 883,712 3,257 0Commercial FB, A FSB NE 58 0.004 0.022 46,030 1,894 $10B-$50B 479,694 3,639 433,664 1,745 0W Holding Company, Inc. PR 60 0.004 0.015 57,713 1,566 $10B-$50B 349,810 3,705 292,097 2,139 0Guaranty Bank TX 60 0.003 0.021 53,720 2,876 $10B-$50B 125,492 3,242 71,772 366 0Citibank (West), FSB CA 62 0.001 0.024 95,380 3,252 >$50B 691,848 5,073 596,468 1,821 0City National Corporation CA 63 0.004 0.011 50,577 1,619 $10B-$50B 676,488 4,562 625,911 2,943 0First Bancorp PR 64 0.002 0.013 41,562 905 $10B-$50B 421,497 2,667 379,935 1,762 0Northern Trust Corporation IL 65 0.001 0.011 49,641 1,402 $10B-$50B 767,504 3,874 717,863 2,472 0FBOP Corporation IL 66 0.003 0.009 34,452 1,126 $10B-$50B 519,393 2,736 484,941 1,610 0UBS Bk USA UT 67 0.002 0.011 36,451 869 $10B-$50B 961,400 3,199 924,949 2,330 0State Farm Bank, FSB IL 69 0.001 0.025 8,203 209 $10B-$50B 60,690 408 52,487 199 0.08People's Mutual Holdings CT 70 0.002 0.009 26,303 1,048 $10B-$50B 1,087,651 3,118 1,061,348 2,070 0Independence Cmnty Bk NY 71 0.002 0.007 30,364 760 $10B-$50B 827,385 3,073 797,021 2,313 0Astoria FS & LA NY 72 0.001 0.011 11,827 520 $10B-$50B 290,570 1,145 278,743 625 0TCF Financial Corporation MN 74 0.001 0.003 7,191 230 $10B-$50B 312,255 1,189 305,064 959 0New York Private Bank & Trust Corp. NY 99 0.000 0.005 1,405 17 $10B-$50B 160,318 470 158,913 453 0Providian NB NH 99 0.000 0.348 2,645 69 $10B-$50B 7,596 98 4,951 29 0.52Merrill Lynch Bk USA UT 99 0.000 0.002 29,694 620 >$50B 1,323,836 4,669 1,294,142 4,049 0Charles Schwab Corporation CA 99 0.000 0.011 1,444 30 $10B-$50B 29,586 99 28,142 69 0Chevy Chase Bank, FSB VA 99 0.000 0.006 6,227 316 $10B-$50B 126,972 869 120,745 553 0New York Community Bancorp, Inc. NY 99 0.000 0.002 4,435 129 $10B-$50B 202,745 767 198,310 638 0Flagstar Bank, FSB MI 99 0.000 0.003 3,192 100 $10B-$50B 102,913 529 99,721 429 0Western Financial Bank CA 99 0.000 0.002 311 6 $10B-$50B 22,735 56 22,424 50 0
Page 25
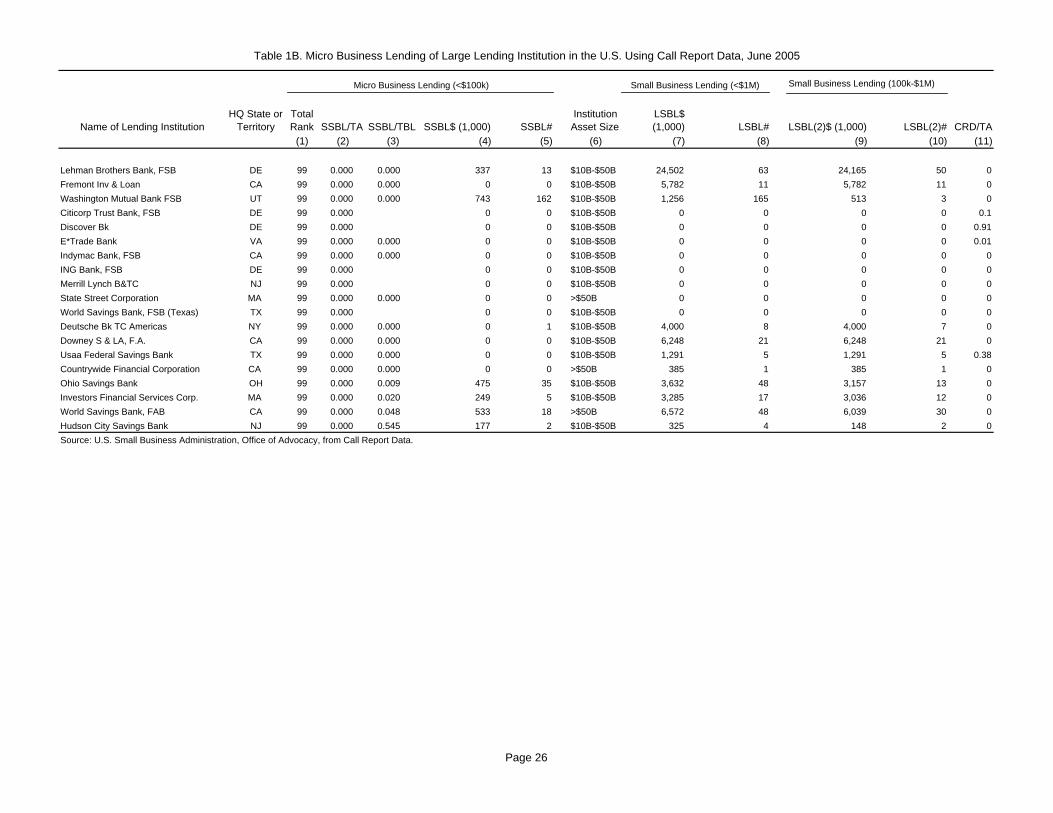
Table 1B. Micro Business Lending of Large Lending Institution in the U.S. Using Call Report Data, June 2005
Name of Lending InstitutionHQ State or
TerritoryTotal Rank SSBL/TA SSBL/TBL SSBL$ (1,000) SSBL#
Institution Asset Size
LSBL$ (1,000) LSBL# LSBL(2)$ (1,000) LSBL(2)# CRD/TA
(1) (2) (3) (4) (5) (6) (7) (8) (9) (10) (11)
Micro Business Lending (<$100k) Small Business Lending (<$1M) Small Business Lending (100k-$1M)
Lehman Brothers Bank, FSB DE 99 0.000 0.000 337 13 $10B-$50B 24,502 63 24,165 50 0Fremont Inv & Loan CA 99 0.000 0.000 0 0 $10B-$50B 5,782 11 5,782 11 0Washington Mutual Bank FSB UT 99 0.000 0.000 743 162 $10B-$50B 1,256 165 513 3 0Citicorp Trust Bank, FSB DE 99 0.000 0 0 $10B-$50B 0 0 0 0 0.1Discover Bk DE 99 0.000 0 0 $10B-$50B 0 0 0 0 0.91E*Trade Bank VA 99 0.000 0.000 0 0 $10B-$50B 0 0 0 0 0.01Indymac Bank, FSB CA 99 0.000 0.000 0 0 $10B-$50B 0 0 0 0 0ING Bank, FSB DE 99 0.000 0 0 $10B-$50B 0 0 0 0 0Merrill Lynch B&TC NJ 99 0.000 0 0 $10B-$50B 0 0 0 0 0State Street Corporation MA 99 0.000 0.000 0 0 >$50B 0 0 0 0 0World Savings Bank, FSB (Texas) TX 99 0.000 0 0 $10B-$50B 0 0 0 0 0Deutsche Bk TC Americas NY 99 0.000 0.000 0 1 $10B-$50B 4,000 8 4,000 7 0Downey S & LA, F.A. CA 99 0.000 0.000 0 0 $10B-$50B 6,248 21 6,248 21 0Usaa Federal Savings Bank TX 99 0.000 0.000 0 0 $10B-$50B 1,291 5 1,291 5 0.38Countrywide Financial Corporation CA 99 0.000 0.000 0 0 >$50B 385 1 385 1 0Ohio Savings Bank OH 99 0.000 0.009 475 35 $10B-$50B 3,632 48 3,157 13 0Investors Financial Services Corp. MA 99 0.000 0.020 249 5 $10B-$50B 3,285 17 3,036 12 0World Savings Bank, FAB CA 99 0.000 0.048 533 18 >$50B 6,572 48 6,039 30 0Hudson City Savings Bank NJ 99 0.000 0.545 177 2 $10B-$50B 325 4 148 2 0Source: U.S. Small Business Administration, Office of Advocacy, from Call Report Data.
Page 26
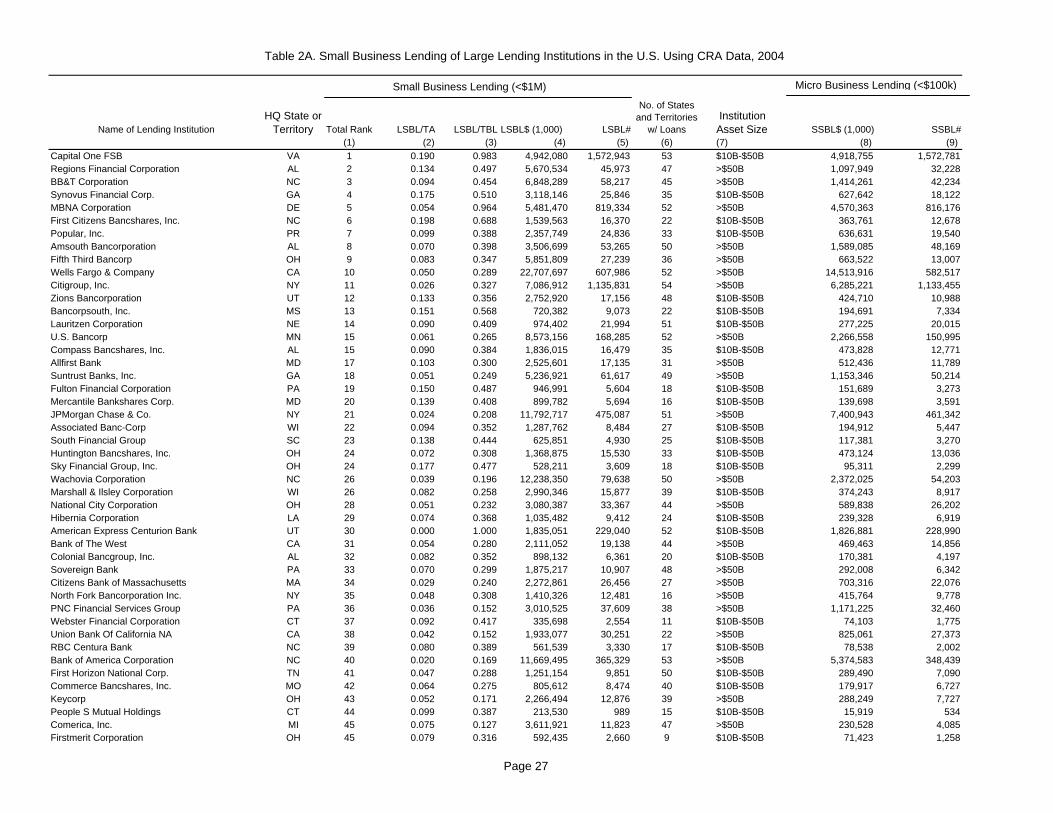
Table 2A. Small Business Lending of Large Lending Institutions in the U.S. Using CRA Data, 2004
Name of Lending Institution HQ State or
Territory Total Rank LSBL/TA LSBL/TBL LSBL$ (1,000) LSBL#
No. of States and Territories
w/ Loans Institution Asset Size SSBL$ (1,000) SSBL#
(1) (2) (3) (4) (5) (6) (7) (8) (9)Capital One FSB VA 1 0.190 0.983 4,942,080 1,572,943 53 $10B-$50B 4,918,755 1,572,781Regions Financial Corporation AL 2 0.134 0.497 5,670,534 45,973 47 >$50B 1,097,949 32,228BB&T Corporation NC 3 0.094 0.454 6,848,289 58,217 45 >$50B 1,414,261 42,234Synovus Financial Corp. GA 4 0.175 0.510 3,118,146 25,846 35 $10B-$50B 627,642 18,122MBNA Corporation DE 5 0.054 0.964 5,481,470 819,334 52 >$50B 4,570,363 816,176First Citizens Bancshares, Inc. NC 6 0.198 0.688 1,539,563 16,370 22 $10B-$50B 363,761 12,678Popular, Inc. PR 7 0.099 0.388 2,357,749 24,836 33 $10B-$50B 636,631 19,540Amsouth Bancorporation AL 8 0.070 0.398 3,506,699 53,265 50 >$50B 1,589,085 48,169Fifth Third Bancorp OH 9 0.083 0.347 5,851,809 27,239 36 >$50B 663,522 13,007Wells Fargo & Company CA 10 0.050 0.289 22,707,697 607,986 52 >$50B 14,513,916 582,517Citigroup, Inc. NY 11 0.026 0.327 7,086,912 1,135,831 54 >$50B 6,285,221 1,133,455Zions Bancorporation UT 12 0.133 0.356 2,752,920 17,156 48 $10B-$50B 424,710 10,988Bancorpsouth, Inc. MS 13 0.151 0.568 720,382 9,073 22 $10B-$50B 194,691 7,334Lauritzen Corporation NE 14 0.090 0.409 974,402 21,994 51 $10B-$50B 277,225 20,015U.S. Bancorp MN 15 0.061 0.265 8,573,156 168,285 52 >$50B 2,266,558 150,995Compass Bancshares, Inc. AL 15 0.090 0.384 1,836,015 16,479 35 $10B-$50B 473,828 12,771Allfirst Bank MD 17 0.103 0.300 2,525,601 17,135 31 >$50B 512,436 11,789Suntrust Banks, Inc. GA 18 0.051 0.249 5,236,921 61,617 49 >$50B 1,153,346 50,214Fulton Financial Corporation PA 19 0.150 0.487 946,991 5,604 18 $10B-$50B 151,689 3,273Mercantile Bankshares Corp. MD 20 0.139 0.408 899,782 5,694 16 $10B-$50B 139,698 3,591JPMorgan Chase & Co. NY 21 0.024 0.208 11,792,717 475,087 51 >$50B 7,400,943 461,342Associated Banc-Corp WI 22 0.094 0.352 1,287,762 8,484 27 $10B-$50B 194,912 5,447South Financial Group SC 23 0.138 0.444 625,851 4,930 25 $10B-$50B 117,381 3,270Huntington Bancshares, Inc. OH 24 0.072 0.308 1,368,875 15,530 33 $10B-$50B 473,124 13,036Sky Financial Group, Inc. OH 24 0.177 0.477 528,211 3,609 18 $10B-$50B 95,311 2,299Wachovia Corporation NC 26 0.039 0.196 12,238,350 79,638 50 >$50B 2,372,025 54,203Marshall & Ilsley Corporation WI 26 0.082 0.258 2,990,346 15,877 39 $10B-$50B 374,243 8,917National City Corporation OH 28 0.051 0.232 3,080,387 33,367 44 >$50B 589,838 26,202Hibernia Corporation LA 29 0.074 0.368 1,035,482 9,412 24 $10B-$50B 239,328 6,919American Express Centurion Bank UT 30 0.000 1.000 1,835,051 229,040 52 $10B-$50B 1,826,881 228,990Bank of The West CA 31 0.054 0.280 2,111,052 19,138 44 >$50B 469,463 14,856Colonial Bancgroup, Inc. AL 32 0.082 0.352 898,132 6,361 20 $10B-$50B 170,381 4,197Sovereign Bank PA 33 0.070 0.299 1,875,217 10,907 48 >$50B 292,008 6,342Citizens Bank of Massachusetts MA 34 0.029 0.240 2,272,861 26,456 27 >$50B 703,316 22,076North Fork Bancorporation Inc. NY 35 0.048 0.308 1,410,326 12,481 16 >$50B 415,764 9,778PNC Financial Services Group PA 36 0.036 0.152 3,010,525 37,609 38 >$50B 1,171,225 32,460Webster Financial Corporation CT 37 0.092 0.417 335,698 2,554 11 $10B-$50B 74,103 1,775Union Bank Of California NA CA 38 0.042 0.152 1,933,077 30,251 22 >$50B 825,061 27,373RBC Centura Bank NC 39 0.080 0.389 561,539 3,330 17 $10B-$50B 78,538 2,002Bank of America Corporation NC 40 0.020 0.169 11,669,495 365,329 53 >$50B 5,374,583 348,439First Horizon National Corp. TN 41 0.047 0.288 1,251,154 9,851 50 $10B-$50B 289,490 7,090Commerce Bancshares, Inc. MO 42 0.064 0.275 805,612 8,474 40 $10B-$50B 179,917 6,727Keycorp OH 43 0.052 0.171 2,266,494 12,876 39 >$50B 288,249 7,727People S Mutual Holdings CT 44 0.099 0.387 213,530 989 15 $10B-$50B 15,919 534Comerica, Inc. MI 45 0.075 0.127 3,611,921 11,823 47 >$50B 230,528 4,085Firstmerit Corporation OH 45 0.079 0.316 592,435 2,660 9 $10B-$50B 71,423 1,258
Small Business Lending (<$1M) Micro Business Lending (<$100k)
Page 27

Table 2A. Small Business Lending of Large Lending Institutions in the U.S. Using CRA Data, 2004
Name of Lending Institution HQ State or
Territory Total Rank LSBL/TA LSBL/TBL LSBL$ (1,000) LSBL#
No. of States and Territories
w/ Loans Institution Asset Size SSBL$ (1,000) SSBL#
(1) (2) (3) (4) (5) (6) (7) (8) (9)
Small Business Lending (<$1M) Micro Business Lending (<$100k)
International Bancshares Corp. TX 45 0.071 0.311 391,657 3,501 11 $10B-$50B 79,527 2,521Valley National Bancorp NJ 48 0.076 0.289 583,860 2,816 8 $10B-$50B 68,772 1,618BOK Financial Corporation OK 49 0.068 0.233 787,291 3,781 24 $10B-$50B 97,506 1,950HSBC Bank USA NY 50 0.011 0.107 1,853,074 19,552 38 >$50B 761,351 16,620Harris Trust And Savings Bank IL 51 0.035 0.178 768,078 7,591 26 $10B-$50B 122,973 5,777Mellon Financial Corporation PA 52 0.023 0.248 825,076 6,237 26 $10B-$50B 122,499 4,375Lasalle Bank IL 53 0.024 0.085 1,906,706 12,164 36 >$50B 352,061 8,660Commerce Bancorp, Inc. NJ 54 0.024 0.166 781,541 5,356 14 $10B-$50B 129,668 3,600Bank of New York Company, Inc. NY 55 0.016 0.232 230,040 5,625 14 >$50B 108,983 5,299City National Corporation CA 56 0.047 0.148 868,073 3,323 23 $10B-$50B 76,605 1,457Commercial Federal Bank NE 57 0.046 0.229 273,985 2,091 20 $10B-$50B 50,388 1,464Citibank FSB NY 58 0.013 0.285 294,978 2,848 18 $10B-$50B 83,395 2,274Citibank (West) FSB NY 59 0.006 0.171 418,117 6,467 7 >$50B 178,051 5,761Washington Mutual Bank FA WA 60 0.005 0.178 513,545 5,055 29 >$50B 136,820 4,152FBOP Corporation IL 61 0.050 0.138 254,896 1,288 20 $10B-$50B 29,075 712Doral Financial Corporation PR 62 0.015 0.329 55,978 241 1 $10B-$50B 3,208 49Independence Community Bank NY 63 0.045 0.202 67,301 297 3 $10B-$50B 6,636 107Northern Trust Corporation IL 64 0.022 0.164 297,025 1,317 25 $10B-$50B 35,127 630First Bancorp PR 65 0.023 0.129 197,328 1,048 2 $10B-$50B 20,983 371TCF Financial Corporation MN 66 0.025 0.147 199,245 839 15 $10B-$50B 16,101 426W Holding Company, Inc. PR 67 0.023 0.089 221,284 969 1 $10B-$50B 20,457 439Merrill Lynch Bank USA UT 68 0.021 0.071 308,240 964 48 >$50B 14,614 214Guaranty Bank TX 69 0.008 0.050 80,934 819 9 $10B-$50B 24,837 650Chevy Chase Bank FSB MD 70 0.009 0.129 65,804 287 6 $10B-$50B 8,096 154Source: U.S. Small Business Administration, Office of Advocacy, from Community Reinvestment Act reports.
Page 28
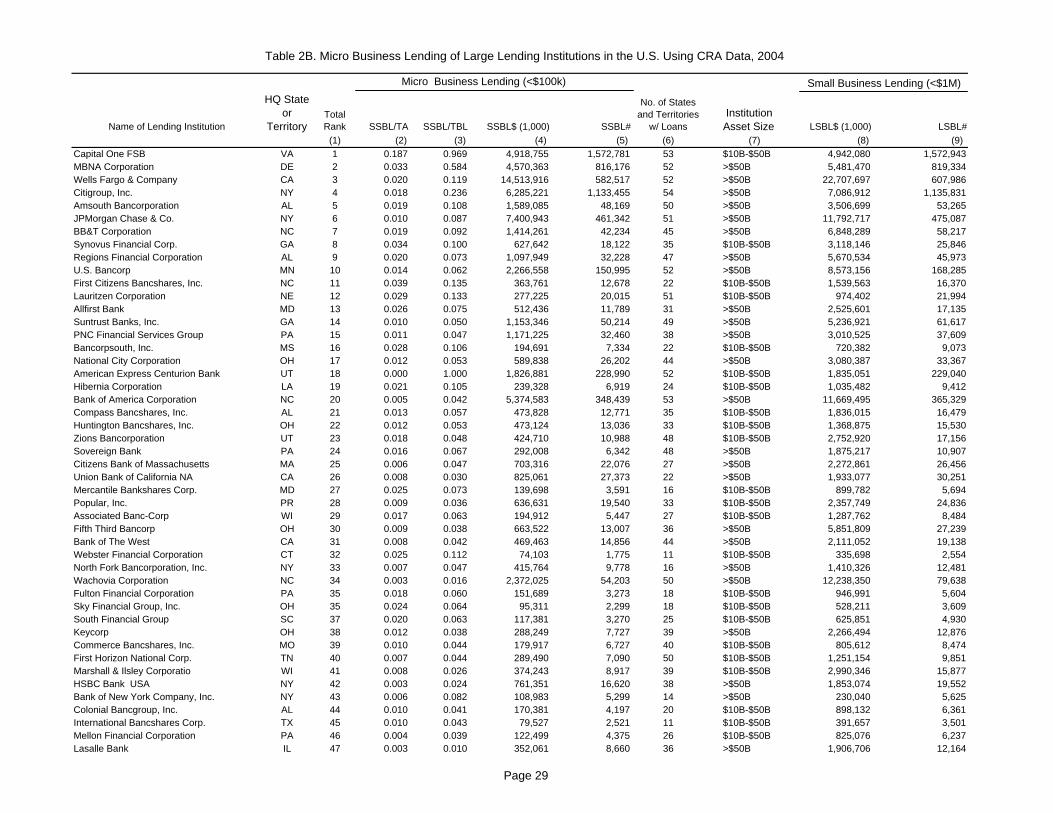
Table 2B. Micro Business Lending of Large Lending Institutions in the U.S. Using CRA Data, 2004
Name of Lending Institution
HQ State or
TerritoryTotal Rank SSBL/TA SSBL/TBL SSBL$ (1,000) SSBL#
No. of States and Territories
w/ Loans Institution Asset Size LSBL$ (1,000) LSBL#
(1) (2) (3) (4) (5) (6) (7) (8) (9)Capital One FSB VA 1 0.187 0.969 4,918,755 1,572,781 53 $10B-$50B 4,942,080 1,572,943MBNA Corporation DE 2 0.033 0.584 4,570,363 816,176 52 >$50B 5,481,470 819,334Wells Fargo & Company CA 3 0.020 0.119 14,513,916 582,517 52 >$50B 22,707,697 607,986Citigroup, Inc. NY 4 0.018 0.236 6,285,221 1,133,455 54 >$50B 7,086,912 1,135,831Amsouth Bancorporation AL 5 0.019 0.108 1,589,085 48,169 50 >$50B 3,506,699 53,265JPMorgan Chase & Co. NY 6 0.010 0.087 7,400,943 461,342 51 >$50B 11,792,717 475,087BB&T Corporation NC 7 0.019 0.092 1,414,261 42,234 45 >$50B 6,848,289 58,217Synovus Financial Corp. GA 8 0.034 0.100 627,642 18,122 35 $10B-$50B 3,118,146 25,846Regions Financial Corporation AL 9 0.020 0.073 1,097,949 32,228 47 >$50B 5,670,534 45,973U.S. Bancorp MN 10 0.014 0.062 2,266,558 150,995 52 >$50B 8,573,156 168,285First Citizens Bancshares, Inc. NC 11 0.039 0.135 363,761 12,678 22 $10B-$50B 1,539,563 16,370Lauritzen Corporation NE 12 0.029 0.133 277,225 20,015 51 $10B-$50B 974,402 21,994Allfirst Bank MD 13 0.026 0.075 512,436 11,789 31 >$50B 2,525,601 17,135Suntrust Banks, Inc. GA 14 0.010 0.050 1,153,346 50,214 49 >$50B 5,236,921 61,617PNC Financial Services Group PA 15 0.011 0.047 1,171,225 32,460 38 >$50B 3,010,525 37,609Bancorpsouth, Inc. MS 16 0.028 0.106 194,691 7,334 22 $10B-$50B 720,382 9,073National City Corporation OH 17 0.012 0.053 589,838 26,202 44 >$50B 3,080,387 33,367American Express Centurion Bank UT 18 0.000 1.000 1,826,881 228,990 52 $10B-$50B 1,835,051 229,040Hibernia Corporation LA 19 0.021 0.105 239,328 6,919 24 $10B-$50B 1,035,482 9,412Bank of America Corporation NC 20 0.005 0.042 5,374,583 348,439 53 >$50B 11,669,495 365,329Compass Bancshares, Inc. AL 21 0.013 0.057 473,828 12,771 35 $10B-$50B 1,836,015 16,479Huntington Bancshares, Inc. OH 22 0.012 0.053 473,124 13,036 33 $10B-$50B 1,368,875 15,530Zions Bancorporation UT 23 0.018 0.048 424,710 10,988 48 $10B-$50B 2,752,920 17,156Sovereign Bank PA 24 0.016 0.067 292,008 6,342 48 >$50B 1,875,217 10,907Citizens Bank of Massachusetts MA 25 0.006 0.047 703,316 22,076 27 >$50B 2,272,861 26,456Union Bank of California NA CA 26 0.008 0.030 825,061 27,373 22 >$50B 1,933,077 30,251Mercantile Bankshares Corp. MD 27 0.025 0.073 139,698 3,591 16 $10B-$50B 899,782 5,694Popular, Inc. PR 28 0.009 0.036 636,631 19,540 33 $10B-$50B 2,357,749 24,836Associated Banc-Corp WI 29 0.017 0.063 194,912 5,447 27 $10B-$50B 1,287,762 8,484Fifth Third Bancorp OH 30 0.009 0.038 663,522 13,007 36 >$50B 5,851,809 27,239Bank of The West CA 31 0.008 0.042 469,463 14,856 44 >$50B 2,111,052 19,138Webster Financial Corporation CT 32 0.025 0.112 74,103 1,775 11 $10B-$50B 335,698 2,554North Fork Bancorporation, Inc. NY 33 0.007 0.047 415,764 9,778 16 >$50B 1,410,326 12,481Wachovia Corporation NC 34 0.003 0.016 2,372,025 54,203 50 >$50B 12,238,350 79,638Fulton Financial Corporation PA 35 0.018 0.060 151,689 3,273 18 $10B-$50B 946,991 5,604Sky Financial Group, Inc. OH 35 0.024 0.064 95,311 2,299 18 $10B-$50B 528,211 3,609South Financial Group SC 37 0.020 0.063 117,381 3,270 25 $10B-$50B 625,851 4,930Keycorp OH 38 0.012 0.038 288,249 7,727 39 >$50B 2,266,494 12,876Commerce Bancshares, Inc. MO 39 0.010 0.044 179,917 6,727 40 $10B-$50B 805,612 8,474First Horizon National Corp. TN 40 0.007 0.044 289,490 7,090 50 $10B-$50B 1,251,154 9,851Marshall & Ilsley Corporatio WI 41 0.008 0.026 374,243 8,917 39 $10B-$50B 2,990,346 15,877HSBC Bank USA NY 42 0.003 0.024 761,351 16,620 38 >$50B 1,853,074 19,552Bank of New York Company, Inc. NY 43 0.006 0.082 108,983 5,299 14 >$50B 230,040 5,625Colonial Bancgroup, Inc. AL 44 0.010 0.041 170,381 4,197 20 $10B-$50B 898,132 6,361International Bancshares Corp. TX 45 0.010 0.043 79,527 2,521 11 $10B-$50B 391,657 3,501Mellon Financial Corporation PA 46 0.004 0.039 122,499 4,375 26 $10B-$50B 825,076 6,237Lasalle Bank IL 47 0.003 0.010 352,061 8,660 36 >$50B 1,906,706 12,164
Micro Business Lending (<$100k) Small Business Lending (<$1M)
Page 29

Table 2B. Micro Business Lending of Large Lending Institutions in the U.S. Using CRA Data, 2004
Name of Lending Institution
HQ State or
TerritoryTotal Rank SSBL/TA SSBL/TBL SSBL$ (1,000) SSBL#
No. of States and Territories
w/ Loans Institution Asset Size LSBL$ (1,000) LSBL#
(1) (2) (3) (4) (5) (6) (7) (8) (9)
Micro Business Lending (<$100k) Small Business Lending (<$1M)
Washington Mutual Bank FA WA 48 0.001 0.044 136,820 4,152 29 >$50B 513,545 5,055BOK Financial Corporation OK 49 0.008 0.029 97,506 1,950 24 $10B-$50B 787,291 3,781Harris Trust And Savings Bank IL 50 0.004 0.019 122,973 5,777 26 $10B-$50B 768,078 7,591RBC Centura Bank NC 51 0.008 0.037 78,538 2,002 17 $10B-$50B 561,539 3,330Commerce Bancorp, Inc. NJ 52 0.004 0.025 129,668 3,600 14 $10B-$50B 781,541 5,356Comerica, Inc. MI 53 0.004 0.007 230,528 4,085 47 >$50B 3,611,921 11,823Citibank (West) FSB NY 53 0.001 0.024 178,051 5,761 7 >$50B 418,117 6,467Firstmerit Corporation OH 55 0.008 0.032 71,423 1,258 9 $10B-$50B 592,435 2,660Citibank FSB NY 56 0.002 0.040 83,395 2,274 18 $10B-$50B 294,978 2,848Commercial Federal Bank NE 57 0.004 0.022 50,388 1,464 20 $10B-$50B 273,985 2,091Valley National Bancorp NJ 58 0.004 0.016 68,772 1,618 8 $10B-$50B 583,860 2,816City National Corporation CA 59 0.004 0.011 76,605 1,457 23 $10B-$50B 868,073 3,323Guaranty Bank TX 60 0.003 0.021 24,837 650 9 $10B-$50B 80,934 819W Holding Company, Inc. PR 61 0.004 0.015 20,457 439 1 $10B-$50B 221,284 969FBOP Corporation IL 62 0.003 0.009 29,075 712 20 $10B-$50B 254,896 1,288Northern Trust Corporation IL 63 0.001 0.011 35,127 630 25 $10B-$50B 297,025 1,317First Bancorp PR 64 0.002 0.013 20,983 371 2 $10B-$50B 197,328 1,048People S Mutual Holdings CT 65 0.002 0.009 15,919 534 15 $10B-$50B 213,530 989Astoria Federal Savings NY 66 0.001 0.011 14,947 568 1 $10B-$50B 27,953 620TCF Financial Corporation MN 67 0.001 0.003 16,101 426 15 $10B-$50B 199,245 839Merrill Lynch Bank USA UT 68 0.000 0.002 14,614 214 48 >$50B 308,240 964Source: U.S. Small Business Administration, Office of Advocacy, from Community Reinvestment Act reports.
Page 30
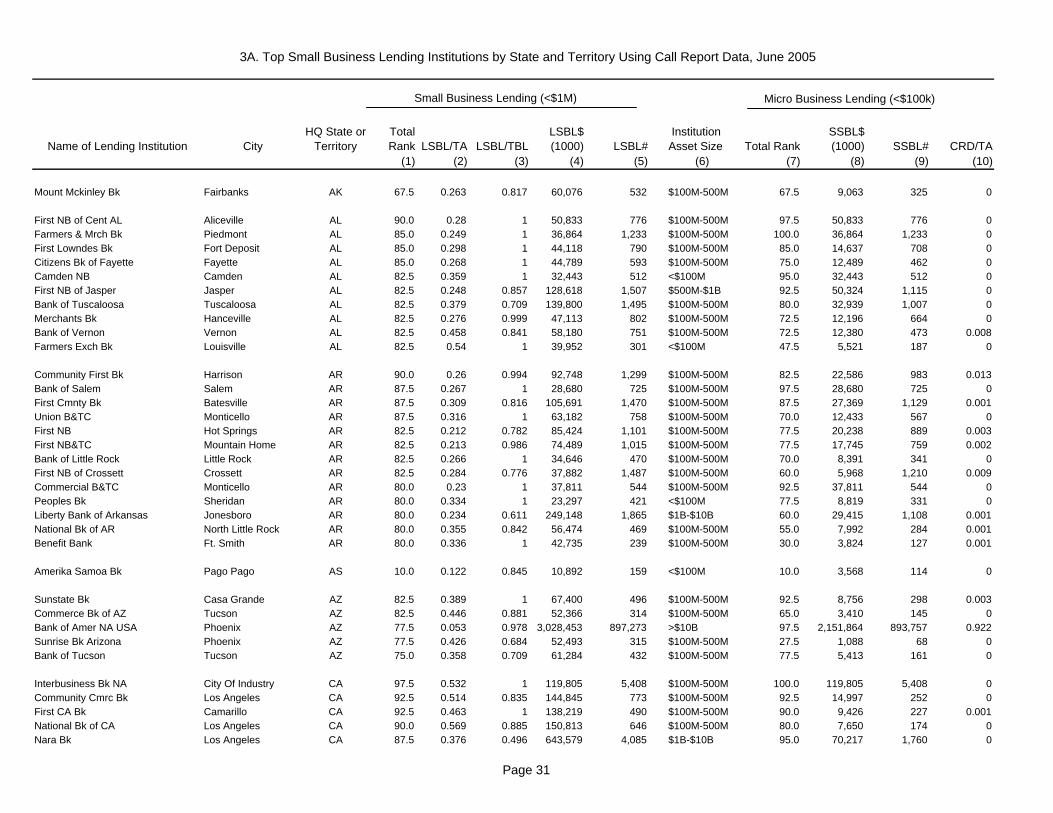
3A. Top Small Business Lending Institutions by State and Territory Using Call Report Data, June 2005
Name of Lending Institution CityHQ State or
TerritoryTotal Rank
LSBL/TA LSBL/TBL
LSBL$ (1000) LSBL#
Institution Asset Size Total Rank
SSBL$ (1000) SSBL# CRD/TA
(1) (2) (3) (4) (5) (6) (7) (8) (9) (10)
Mount Mckinley Bk Fairbanks AK 67.5 0.263 0.817 60,076 532 $100M-500M 67.5 9,063 325 0
First NB of Cent AL Aliceville AL 90.0 0.28 1 50,833 776 $100M-500M 97.5 50,833 776 0Farmers & Mrch Bk Piedmont AL 85.0 0.249 1 36,864 1,233 $100M-500M 100.0 36,864 1,233 0First Lowndes Bk Fort Deposit AL 85.0 0.298 1 44,118 790 $100M-500M 85.0 14,637 708 0Citizens Bk of Fayette Fayette AL 85.0 0.268 1 44,789 593 $100M-500M 75.0 12,489 462 0Camden NB Camden AL 82.5 0.359 1 32,443 512 <$100M 95.0 32,443 512 0First NB of Jasper Jasper AL 82.5 0.248 0.857 128,618 1,507 $500M-$1B 92.5 50,324 1,115 0Bank of Tuscaloosa Tuscaloosa AL 82.5 0.379 0.709 139,800 1,495 $100M-500M 80.0 32,939 1,007 0Merchants Bk Hanceville AL 82.5 0.276 0.999 47,113 802 $100M-500M 72.5 12,196 664 0Bank of Vernon Vernon AL 82.5 0.458 0.841 58,180 751 $100M-500M 72.5 12,380 473 0.008Farmers Exch Bk Louisville AL 82.5 0.54 1 39,952 301 <$100M 47.5 5,521 187 0
Community First Bk Harrison AR 90.0 0.26 0.994 92,748 1,299 $100M-500M 82.5 22,586 983 0.013Bank of Salem Salem AR 87.5 0.267 1 28,680 725 $100M-500M 97.5 28,680 725 0First Cmnty Bk Batesville AR 87.5 0.309 0.816 105,691 1,470 $100M-500M 87.5 27,369 1,129 0.001Union B&TC Monticello AR 87.5 0.316 1 63,182 758 $100M-500M 70.0 12,433 567 0First NB Hot Springs AR 82.5 0.212 0.782 85,424 1,101 $100M-500M 77.5 20,238 889 0.003First NB&TC Mountain Home AR 82.5 0.213 0.986 74,489 1,015 $100M-500M 77.5 17,745 759 0.002Bank of Little Rock Little Rock AR 82.5 0.266 1 34,646 470 $100M-500M 70.0 8,391 341 0First NB of Crossett Crossett AR 82.5 0.284 0.776 37,882 1,487 $100M-500M 60.0 5,968 1,210 0.009Commercial B&TC Monticello AR 80.0 0.23 1 37,811 544 $100M-500M 92.5 37,811 544 0Peoples Bk Sheridan AR 80.0 0.334 1 23,297 421 <$100M 77.5 8,819 331 0Liberty Bank of Arkansas Jonesboro AR 80.0 0.234 0.611 249,148 1,865 $1B-$10B 60.0 29,415 1,108 0.001National Bk of AR North Little Rock AR 80.0 0.355 0.842 56,474 469 $100M-500M 55.0 7,992 284 0.001Benefit Bank Ft. Smith AR 80.0 0.336 1 42,735 239 $100M-500M 30.0 3,824 127 0.001
Amerika Samoa Bk Pago Pago AS 10.0 0.122 0.845 10,892 159 <$100M 10.0 3,568 114 0
Sunstate Bk Casa Grande AZ 82.5 0.389 1 67,400 496 $100M-500M 92.5 8,756 298 0.003Commerce Bk of AZ Tucson AZ 82.5 0.446 0.881 52,366 314 $100M-500M 65.0 3,410 145 0Bank of Amer NA USA Phoenix AZ 77.5 0.053 0.978 3,028,453 897,273 >$10B 97.5 2,151,864 893,757 0.922Sunrise Bk Arizona Phoenix AZ 77.5 0.426 0.684 52,493 315 $100M-500M 27.5 1,088 68 0Bank of Tucson Tucson AZ 75.0 0.358 0.709 61,284 432 $100M-500M 77.5 5,413 161 0
Interbusiness Bk NA City Of Industry CA 97.5 0.532 1 119,805 5,408 $100M-500M 100.0 119,805 5,408 0Community Cmrc Bk Los Angeles CA 92.5 0.514 0.835 144,845 773 $100M-500M 92.5 14,997 252 0First CA Bk Camarillo CA 92.5 0.463 1 138,219 490 $100M-500M 90.0 9,426 227 0.001National Bk of CA Los Angeles CA 90.0 0.569 0.885 150,813 646 $100M-500M 80.0 7,650 174 0Nara Bk Los Angeles CA 87.5 0.376 0.496 643,579 4,085 $1B-$10B 95.0 70,217 1,760 0
Micro Business Lending (<$100k)Small Business Lending (<$1M)
Page 31

3A. Top Small Business Lending Institutions by State and Territory Using Call Report Data, June 2005
Name of Lending Institution CityHQ State or
TerritoryTotal Rank
LSBL/TA LSBL/TBL
LSBL$ (1000) LSBL#
Institution Asset Size Total Rank
SSBL$ (1000) SSBL# CRD/TA
(1) (2) (3) (4) (5) (6) (7) (8) (9) (10)
Micro Business Lending (<$100k)Small Business Lending (<$1M)
Canyon NB Palm Springs CA 87.5 0.447 1 96,058 343 $100M-500M 85.0 7,084 108 0Tri Cty Bk Chico CA 85.0 0.197 0.725 339,657 3,917 $1B-$10B 100.0 50,350 2,719 0Innovative Bk Oakland CA 85.0 0.32 1 42,702 3,024 $100M-500M 100.0 42,702 3,024 0Bay Cities NB Redondo Beach CA 85.0 0.364 1 102,781 409 $100M-500M 65.0 3,369 122 0.001Saehan Bk Los Angeles CA 82.5 0.38 0.478 173,447 1,189 $100M-500M 87.5 15,584 437 0Coast NB San Luis Obispo CA 82.5 0.42 0.771 72,095 501 $100M-500M 87.5 6,235 207 0.002Sonoma NB Santa Rosa CA 82.5 0.332 0.49 394,274 1,238 $1B-$10B 52.5 6,232 164 0
First NB of Arvada Arvada CO 97.5 0.516 1 103,217 564 $100M-500M 75.0 9,726 295 0Citywide Bks Aurora CO 95.0 0.465 0.983 337,932 1,631 $500M-$1B 72.5 22,606 893 0Montrosebank Montrose CO 90.0 0.343 0.924 44,254 881 $100M-500M 92.5 9,170 545 0Bank of The San Juans Durango CO 90.0 0.367 1 38,574 332 $100M-500M 80.0 5,751 197 0Front Range Bk Lakewood CO 90.0 0.452 1 40,137 336 <$100M 72.5 4,631 195 0Collegiate Peaks Bk Buena Vista CO 87.5 0.36 1 34,112 348 <$100M 80.0 5,283 209 0Bank of Denver Denver CO 85.0 0.411 1 63,960 186 $100M-500M 32.5 1,814 63 0Canon NB Canon City CO 82.5 0.305 0.845 57,144 554 $100M-500M 85.0 10,151 344 0High Country Bank Salida CO 82.5 0.269 0.944 53,091 358 $100M-500M 67.5 5,401 186 0.001Colorado Mountain Bk Westcliffe CO 82.5 0.409 1 30,328 208 <$100M 62.5 2,932 120 0
Fairfield Cty Bk Corp. Ridgefield CT 85.0 0.213 0.846 260,657 796 $1B-$10B 67.5 15,995 301 0Valley Bk Bristol CT 82.5 0.358 1 49,050 349 $100M-500M 85.0 8,472 192 0Naugatuck Svg Bk Naugatuck CT 80.0 0.171 0.737 110,924 940 $500M-$1B 85.0 14,497 537 0Salisbury B&TC Lakeville CT 75.0 0.128 1 51,356 514 $100M-500M 82.5 7,596 327 0.005First County Bk Stamford CT 75.0 0.108 0.83 105,039 533 $500M-$1B 55.0 7,447 190 0.002
National Capital Bk of WA Washington DC 82.5 0.263 0.998 58,045 194 $100M-500M 77.5 1,885 74 0.003
MBNA America DE NA Wilmington DE 97.5 0.541 0.963 2,968,328 928,489 $1B-$10B 97.5 1,805,312 924,122 0Chase Bk USA NA Newark DE 85.0 0.03 1 2,625,208 1,549,802 >$10B 95.0 1,727,259 1,517,802 0.46Mercantile Peninsula Bk Selbyville DE 82.5 0.217 0.539 353,386 4,046 $1B-$10B 85.0 58,402 2,736 0
First Coast Cmnty Bk Fernandina Beach FL 95.0 0.515 1 95,589 589 $100M-500M 95.0 12,886 359 0Peoples Cmnty Bk of The West Sarasota FL 92.5 0.514 0.99 130,745 395 $100M-500M 55.0 4,493 152 0Centerstate Bk W Fl NA Zephyrhills FL 90.0 0.375 0.874 90,864 773 $100M-500M 95.0 14,423 431 0Premier Bk Tallahassee FL 90.0 0.334 0.931 98,729 756 $100M-500M 87.5 11,830 389 0Merchants & Southern Bk Gainesville FL 90.0 0.318 1 84,850 460 $100M-500M 77.5 7,429 238 0Fidelity Bk of FL NA Merritt Island FL 90.0 0.501 0.795 131,039 622 $100M-500M 77.5 11,903 184 0Intercredit Bk NA Miami FL 90.0 0.309 1 137,072 463 $100M-500M 67.5 7,451 211 0Florida Choice Bk Mount Dora FL 90.0 0.542 0.918 159,323 383 $100M-500M 42.5 4,150 79 0Highlands Indep Bk Sebring FL 87.5 0.254 0.992 62,801 839 $100M-500M 100.0 12,736 619 0
Page 32
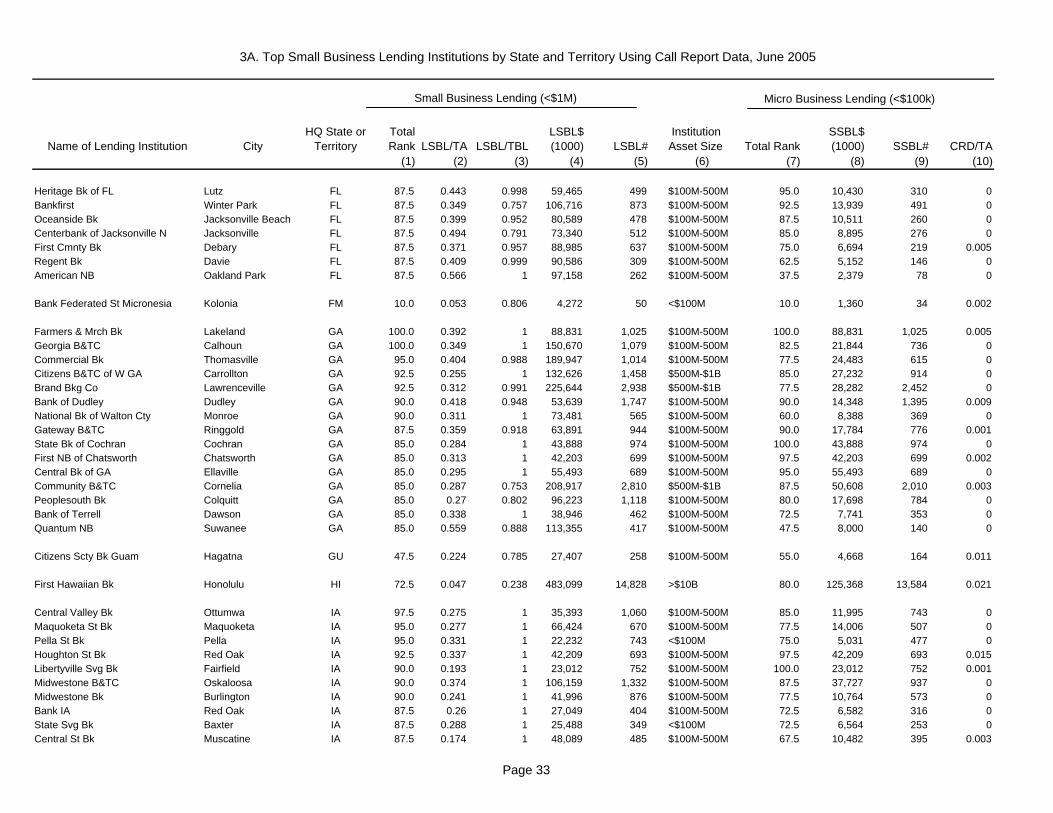
3A. Top Small Business Lending Institutions by State and Territory Using Call Report Data, June 2005
Name of Lending Institution CityHQ State or
TerritoryTotal Rank
LSBL/TA LSBL/TBL
LSBL$ (1000) LSBL#
Institution Asset Size Total Rank
SSBL$ (1000) SSBL# CRD/TA
(1) (2) (3) (4) (5) (6) (7) (8) (9) (10)
Micro Business Lending (<$100k)Small Business Lending (<$1M)
Heritage Bk of FL Lutz FL 87.5 0.443 0.998 59,465 499 $100M-500M 95.0 10,430 310 0Bankfirst Winter Park FL 87.5 0.349 0.757 106,716 873 $100M-500M 92.5 13,939 491 0Oceanside Bk Jacksonville Beach FL 87.5 0.399 0.952 80,589 478 $100M-500M 87.5 10,511 260 0Centerbank of Jacksonville N Jacksonville FL 87.5 0.494 0.791 73,340 512 $100M-500M 85.0 8,895 276 0First Cmnty Bk Debary FL 87.5 0.371 0.957 88,985 637 $100M-500M 75.0 6,694 219 0.005Regent Bk Davie FL 87.5 0.409 0.999 90,586 309 $100M-500M 62.5 5,152 146 0American NB Oakland Park FL 87.5 0.566 1 97,158 262 $100M-500M 37.5 2,379 78 0
Bank Federated St Micronesia Kolonia FM 10.0 0.053 0.806 4,272 50 <$100M 10.0 1,360 34 0.002
Farmers & Mrch Bk Lakeland GA 100.0 0.392 1 88,831 1,025 $100M-500M 100.0 88,831 1,025 0.005Georgia B&TC Calhoun GA 100.0 0.349 1 150,670 1,079 $100M-500M 82.5 21,844 736 0Commercial Bk Thomasville GA 95.0 0.404 0.988 189,947 1,014 $100M-500M 77.5 24,483 615 0Citizens B&TC of W GA Carrollton GA 92.5 0.255 1 132,626 1,458 $500M-$1B 85.0 27,232 914 0Brand Bkg Co Lawrenceville GA 92.5 0.312 0.991 225,644 2,938 $500M-$1B 77.5 28,282 2,452 0Bank of Dudley Dudley GA 90.0 0.418 0.948 53,639 1,747 $100M-500M 90.0 14,348 1,395 0.009National Bk of Walton Cty Monroe GA 90.0 0.311 1 73,481 565 $100M-500M 60.0 8,388 369 0Gateway B&TC Ringgold GA 87.5 0.359 0.918 63,891 944 $100M-500M 90.0 17,784 776 0.001State Bk of Cochran Cochran GA 85.0 0.284 1 43,888 974 $100M-500M 100.0 43,888 974 0First NB of Chatsworth Chatsworth GA 85.0 0.313 1 42,203 699 $100M-500M 97.5 42,203 699 0.002Central Bk of GA Ellaville GA 85.0 0.295 1 55,493 689 $100M-500M 95.0 55,493 689 0Community B&TC Cornelia GA 85.0 0.287 0.753 208,917 2,810 $500M-$1B 87.5 50,608 2,010 0.003Peoplesouth Bk Colquitt GA 85.0 0.27 0.802 96,223 1,118 $100M-500M 80.0 17,698 784 0Bank of Terrell Dawson GA 85.0 0.338 1 38,946 462 $100M-500M 72.5 7,741 353 0Quantum NB Suwanee GA 85.0 0.559 0.888 113,355 417 $100M-500M 47.5 8,000 140 0
Citizens Scty Bk Guam Hagatna GU 47.5 0.224 0.785 27,407 258 $100M-500M 55.0 4,668 164 0.011
First Hawaiian Bk Honolulu HI 72.5 0.047 0.238 483,099 14,828 >$10B 80.0 125,368 13,584 0.021
Central Valley Bk Ottumwa IA 97.5 0.275 1 35,393 1,060 $100M-500M 85.0 11,995 743 0Maquoketa St Bk Maquoketa IA 95.0 0.277 1 66,424 670 $100M-500M 77.5 14,006 507 0Pella St Bk Pella IA 95.0 0.331 1 22,232 743 <$100M 75.0 5,031 477 0Houghton St Bk Red Oak IA 92.5 0.337 1 42,209 693 $100M-500M 97.5 42,209 693 0.015Libertyville Svg Bk Fairfield IA 90.0 0.193 1 23,012 752 $100M-500M 100.0 23,012 752 0.001Midwestone B&TC Oskaloosa IA 90.0 0.374 1 106,159 1,332 $100M-500M 87.5 37,727 937 0Midwestone Bk Burlington IA 90.0 0.241 1 41,996 876 $100M-500M 77.5 10,764 573 0Bank IA Red Oak IA 87.5 0.26 1 27,049 404 $100M-500M 72.5 6,582 316 0State Svg Bk Baxter IA 87.5 0.288 1 25,488 349 <$100M 72.5 6,564 253 0Central St Bk Muscatine IA 87.5 0.174 1 48,089 485 $100M-500M 67.5 10,482 395 0.003
Page 33

3A. Top Small Business Lending Institutions by State and Territory Using Call Report Data, June 2005
Name of Lending Institution CityHQ State or
TerritoryTotal Rank
LSBL/TA LSBL/TBL
LSBL$ (1000) LSBL#
Institution Asset Size Total Rank
SSBL$ (1000) SSBL# CRD/TA
(1) (2) (3) (4) (5) (6) (7) (8) (9) (10)
Micro Business Lending (<$100k)Small Business Lending (<$1M)
Farmers & Mrch St Bk Boise ID 90.0 0.343 0.786 193,358 2,287 $500M-$1B 82.5 36,257 1,585 0.004D L Evans Bk Burley ID 77.5 0.237 0.757 118,874 1,865 $500M-$1B 80.0 28,896 1,290 0.006
Liberty Bk Alton IL 95.0 0.319 1 52,313 419 $100M-500M 80.0 8,382 265 0Peoples NB of Kewanee Kewanee IL 92.5 0.245 1 48,666 722 $100M-500M 100.0 48,666 722 0.003First Mid-Il B&T NA Mattoon IL 92.5 0.348 0.995 282,380 2,108 $500M-$1B 82.5 36,496 1,445 0EFS Bk Elgin IL 92.5 0.159 1 164,183 738 $1B-$10B 52.5 7,350 274 0Community St Bk Rock Falls Rock Falls IL 90.0 0.263 1 36,474 645 $100M-500M 100.0 36,474 645 0Peotone B&TC Peotone IL 90.0 0.329 1 38,673 552 $100M-500M 100.0 38,673 552 0Alpine Bk Il Rockford IL 90.0 0.299 0.965 140,176 1,019 $100M-500M 72.5 13,322 382 0Benchmark Bk Aurora IL 90.0 0.326 1 55,623 466 $100M-500M 72.5 7,120 254 0Edgar Cty B&TC Paris IL 90.0 0.402 1 62,649 326 $100M-500M 67.5 5,352 212 0Archer Bk Chicago IL 90.0 0.28 1 140,931 545 $500M-$1B 50.0 6,028 148 0North Cmnty Bk Chicago IL 90.0 0.305 0.987 130,383 428 $100M-500M 45.0 3,469 180 0Plaza Bk Norridge IL 90.0 0.362 0.999 134,685 482 $100M-500M 45.0 4,190 133 0
Community Bk Southern IN New Albany IN 95.0 0.431 1 273,985 1,436 $500M-$1B 77.5 27,711 777 0Jackson County Bk Seymour IN 90.0 0.256 1 82,853 900 $100M-500M 90.0 24,031 633 0First St Bk Middlebury Middlebury IN 82.5 0.271 0.795 86,904 1,000 $100M-500M 77.5 17,593 689 0.003Salin B&TC Indianapolis IN 82.5 0.279 0.633 256,851 1,685 $500M-$1B 75.0 39,260 908 0Friendship St Bk Friendship IN 80.0 0.194 1 36,616 564 $100M-500M 95.0 36,616 564 0.008State Bk Oxford Oxford IN 80.0 0.368 1 26,124 310 <$100M 92.5 26,124 310 0Farmers St Bk Mentone IN 80.0 0.3 0.989 31,384 379 $100M-500M 67.5 5,596 246 0.002First NB of Valparaiso Valparaiso IN 80.0 0.133 1 87,150 842 $500M-$1B 65.0 13,178 563 0Grabill Bk Grabill IN 80.0 0.268 0.623 148,961 1,160 $500M-$1B 65.0 18,666 659 0Demotte St Bk De Motte IN 77.5 0.192 0.93 53,861 794 $100M-500M 95.0 24,401 666 0.001Marklebank Markle IN 77.5 0.22 0.822 58,202 882 $100M-500M 90.0 21,536 753 0.003Farmers St Bk Lagrange IN 77.5 0.192 0.92 64,582 787 $100M-500M 85.0 17,586 605 0Community First Bk Corydon IN 77.5 0.185 1 49,063 566 $100M-500M 85.0 14,730 448 0.001New Washington St Bk New Washington IN 77.5 0.247 0.922 50,912 676 $100M-500M 82.5 12,293 505 0Lincoln Bank Plainfield IN 77.5 0.19 0.778 153,565 1,134 $500M-$1B 72.5 26,972 681 0.001Tower B&TC Fort Wayne IN 77.5 0.293 0.598 149,098 1,080 $500M-$1B 67.5 19,711 536 0Bank of Evansville Evansville IN 77.5 0.415 0.76 80,223 506 $100M-500M 57.5 7,461 228 0
University NB Pittsburg KS 95.0 0.329 1 29,041 354 <$100M 75.0 6,861 262 0Bank of The Prairie Olathe KS 95.0 0.289 1 26,392 321 <$100M 67.5 5,859 233 0Union St Bk Everest KS 90.0 0.211 1 18,734 504 <$100M 97.5 18,734 504 0First NB Hays KS 90.0 0.352 1 28,333 354 <$100M 95.0 28,333 354 0Peoples B&TC Mcpherson KS 90.0 0.335 1 67,336 757 $100M-500M 92.5 67,336 757 0
Page 34

3A. Top Small Business Lending Institutions by State and Territory Using Call Report Data, June 2005
Name of Lending Institution CityHQ State or
TerritoryTotal Rank
LSBL/TA LSBL/TBL
LSBL$ (1000) LSBL#
Institution Asset Size Total Rank
SSBL$ (1000) SSBL# CRD/TA
(1) (2) (3) (4) (5) (6) (7) (8) (9) (10)
Micro Business Lending (<$100k)Small Business Lending (<$1M)
First NB of Southern KS Mount Hope KS 85.0 0.376 1 21,745 409 <$100M 95.0 21,745 409 0Community First NB Manhattan KS 85.0 0.254 1 15,909 211 <$100M 65.0 4,145 162 0Douglas Cty Bk Lawrence KS 85.0 0.304 0.998 61,366 430 $100M-500M 57.5 6,529 266 0Community NB Chanute KS 82.5 0.259 0.844 109,303 1,466 $100M-500M 87.5 43,308 1,187 0.001Girard NB Girard KS 82.5 0.211 0.89 60,982 1,513 $100M-500M 85.0 25,127 1,342 0Prairie St Bk Augusta KS 82.5 0.265 0.702 74,998 1,428 $100M-500M 82.5 25,544 1,191 0First Bk of Newton Newton KS 82.5 0.212 1 24,205 384 $100M-500M 77.5 8,636 320 0Community NB Topeka KS 82.5 0.427 0.983 31,940 386 <$100M 75.0 7,667 290 0Kansas St Bk of Manhattan Manhattan KS 82.5 0.247 0.869 112,158 955 $100M-500M 60.0 10,777 605 0.002Midamerican B&TC NA Leavenworth KS 82.5 0.271 1 29,893 262 $100M-500M 55.0 4,798 160 0
Peoples B&TC Hazard KY 97.5 0.37 1 91,459 1,180 $100M-500M 100.0 91,459 1,180 0Bank of Columbia Columbia KY 92.5 0.296 1 37,057 938 $100M-500M 100.0 37,057 938 0Peoples Bk of Fleming Cty Flemingsburg KY 90.0 0.227 1 37,901 1,023 $100M-500M 100.0 37,901 1,023 0.003Peoples Exch Bk Stanton KY 90.0 0.291 0.922 66,980 1,166 $100M-500M 87.5 19,662 923 0American Bk&Tr Co Bowling Green KY 90.0 0.404 1 59,798 341 $100M-500M 30.0 2,788 160 0.001First Commonwealth Bk Prestonsburg KY 85.0 0.211 1 33,368 894 $100M-500M 97.5 33,368 894 0Town Square Bk Ashland KY 85.0 0.349 0.968 44,418 615 $100M-500M 85.0 12,808 481 0.001Citizens Bk of Northern KY Newport KY 85.0 0.381 0.855 70,858 709 $100M-500M 72.5 13,959 451 0.004Independence Bk of KY Owensboro KY 82.5 0.247 0.765 117,628 1,745 $100M-500M 87.5 40,225 1,418 0.001South Central Bk Glasgow KY 82.5 0.29 0.732 77,604 1,191 $100M-500M 87.5 22,939 989 0
Jeff Davis B&TC Jennings LA 92.5 0.235 1 85,681 1,333 $100M-500M 100.0 85,681 1,333 0Citizens NB NA Bossier City LA 87.5 0.282 1 64,804 730 $100M-500M 77.5 15,133 534 0Community Bk Raceland LA 87.5 0.437 1 85,193 847 $100M-500M 77.5 15,197 611 0First Guaranty Bk Hammond LA 87.5 0.352 0.855 212,932 1,750 $500M-$1B 75.0 36,246 1,320 0.002First NB of LA Crowley LA 87.5 0.414 1 59,881 623 $100M-500M 72.5 12,451 458 0Gulf Coast B&TC New Orleans LA 87.5 0.393 0.867 217,006 1,454 $500M-$1B 62.5 21,501 610 0.002Central Progressive Bk Lacombe LA 87.5 0.343 1 173,683 765 $500M-$1B 50.0 11,674 472 0.003Feliciana B&TC Clinton LA 85.0 0.342 1 26,661 535 <$100M 97.5 26,661 535 0City Svg B&TC Deridder LA 82.5 0.282 1 35,356 618 $100M-500M 95.0 35,356 618 0.007Resource Bk Mandeville LA 82.5 0.446 0.757 96,459 2,335 $100M-500M 75.0 15,016 1,263 0
Rockland TC Rockland MA 87.5 0.165 0.701 492,518 2,072 $1B-$10B 80.0 39,373 701 0Enterprise B&TC Lowell MA 85.0 0.299 0.601 267,094 2,251 $500M-$1B 92.5 37,640 1,267 0North Middlesex Svg Bk Ayer MA 82.5 0.172 0.859 56,955 655 $100M-500M 92.5 9,448 442 0Bank of Western MA Springfield MA 82.5 0.313 0.497 207,610 1,449 $500M-$1B 80.0 16,472 634 0Bank of Canton Canton MA 82.5 0.176 0.75 120,116 587 $500M-$1B 67.5 7,426 227 0.001First Trade Union Bank Boston MA 82.5 0.259 0.816 89,130 322 $100M-500M 47.5 3,159 63 0Chicopee Svg Bk Chicopee MA 80.0 0.22 0.646 84,868 755 $100M-500M 87.5 11,066 441 0
Page 35
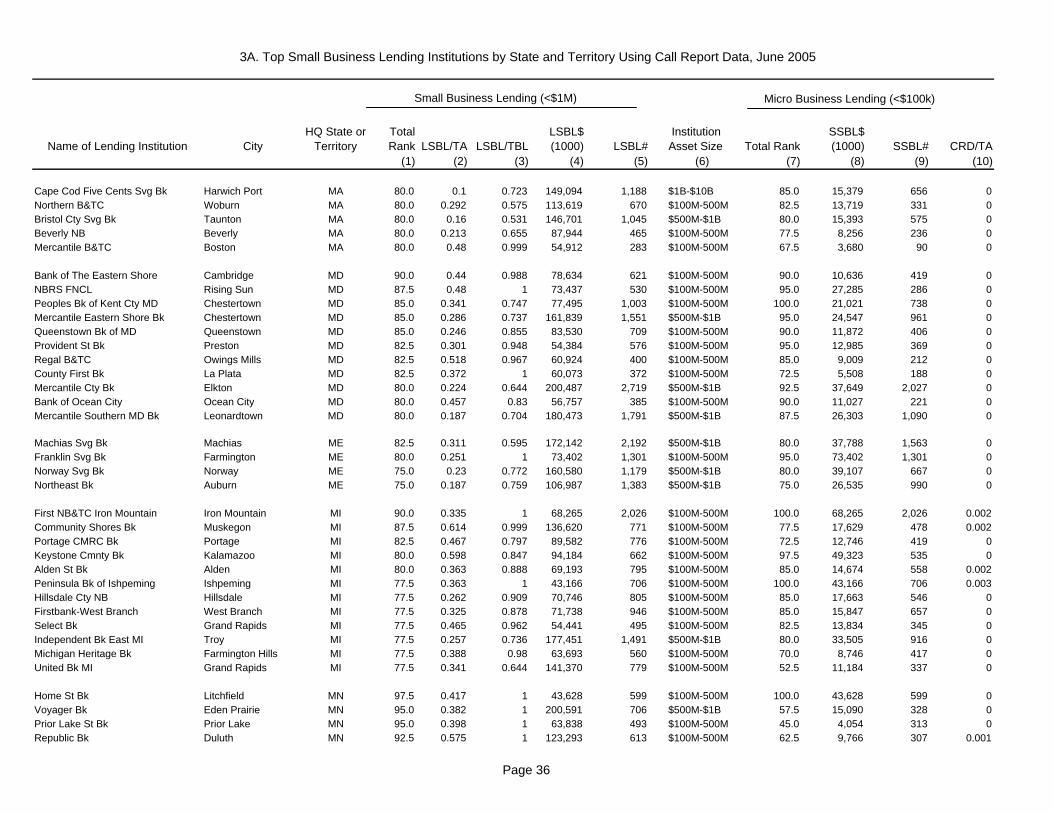
3A. Top Small Business Lending Institutions by State and Territory Using Call Report Data, June 2005
Name of Lending Institution CityHQ State or
TerritoryTotal Rank
LSBL/TA LSBL/TBL
LSBL$ (1000) LSBL#
Institution Asset Size Total Rank
SSBL$ (1000) SSBL# CRD/TA
(1) (2) (3) (4) (5) (6) (7) (8) (9) (10)
Micro Business Lending (<$100k)Small Business Lending (<$1M)
Cape Cod Five Cents Svg Bk Harwich Port MA 80.0 0.1 0.723 149,094 1,188 $1B-$10B 85.0 15,379 656 0Northern B&TC Woburn MA 80.0 0.292 0.575 113,619 670 $100M-500M 82.5 13,719 331 0Bristol Cty Svg Bk Taunton MA 80.0 0.16 0.531 146,701 1,045 $500M-$1B 80.0 15,393 575 0Beverly NB Beverly MA 80.0 0.213 0.655 87,944 465 $100M-500M 77.5 8,256 236 0Mercantile B&TC Boston MA 80.0 0.48 0.999 54,912 283 $100M-500M 67.5 3,680 90 0
Bank of The Eastern Shore Cambridge MD 90.0 0.44 0.988 78,634 621 $100M-500M 90.0 10,636 419 0NBRS FNCL Rising Sun MD 87.5 0.48 1 73,437 530 $100M-500M 95.0 27,285 286 0Peoples Bk of Kent Cty MD Chestertown MD 85.0 0.341 0.747 77,495 1,003 $100M-500M 100.0 21,021 738 0Mercantile Eastern Shore Bk Chestertown MD 85.0 0.286 0.737 161,839 1,551 $500M-$1B 95.0 24,547 961 0Queenstown Bk of MD Queenstown MD 85.0 0.246 0.855 83,530 709 $100M-500M 90.0 11,872 406 0Provident St Bk Preston MD 82.5 0.301 0.948 54,384 576 $100M-500M 95.0 12,985 369 0Regal B&TC Owings Mills MD 82.5 0.518 0.967 60,924 400 $100M-500M 85.0 9,009 212 0County First Bk La Plata MD 82.5 0.372 1 60,073 372 $100M-500M 72.5 5,508 188 0Mercantile Cty Bk Elkton MD 80.0 0.224 0.644 200,487 2,719 $500M-$1B 92.5 37,649 2,027 0Bank of Ocean City Ocean City MD 80.0 0.457 0.83 56,757 385 $100M-500M 90.0 11,027 221 0Mercantile Southern MD Bk Leonardtown MD 80.0 0.187 0.704 180,473 1,791 $500M-$1B 87.5 26,303 1,090 0
Machias Svg Bk Machias ME 82.5 0.311 0.595 172,142 2,192 $500M-$1B 80.0 37,788 1,563 0Franklin Svg Bk Farmington ME 80.0 0.251 1 73,402 1,301 $100M-500M 95.0 73,402 1,301 0Norway Svg Bk Norway ME 75.0 0.23 0.772 160,580 1,179 $500M-$1B 80.0 39,107 667 0Northeast Bk Auburn ME 75.0 0.187 0.759 106,987 1,383 $500M-$1B 75.0 26,535 990 0
First NB&TC Iron Mountain Iron Mountain MI 90.0 0.335 1 68,265 2,026 $100M-500M 100.0 68,265 2,026 0.002Community Shores Bk Muskegon MI 87.5 0.614 0.999 136,620 771 $100M-500M 77.5 17,629 478 0.002Portage CMRC Bk Portage MI 82.5 0.467 0.797 89,582 776 $100M-500M 72.5 12,746 419 0Keystone Cmnty Bk Kalamazoo MI 80.0 0.598 0.847 94,184 662 $100M-500M 97.5 49,323 535 0Alden St Bk Alden MI 80.0 0.363 0.888 69,193 795 $100M-500M 85.0 14,674 558 0.002Peninsula Bk of Ishpeming Ishpeming MI 77.5 0.363 1 43,166 706 $100M-500M 100.0 43,166 706 0.003Hillsdale Cty NB Hillsdale MI 77.5 0.262 0.909 70,746 805 $100M-500M 85.0 17,663 546 0Firstbank-West Branch West Branch MI 77.5 0.325 0.878 71,738 946 $100M-500M 85.0 15,847 657 0Select Bk Grand Rapids MI 77.5 0.465 0.962 54,441 495 $100M-500M 82.5 13,834 345 0Independent Bk East MI Troy MI 77.5 0.257 0.736 177,451 1,491 $500M-$1B 80.0 33,505 916 0Michigan Heritage Bk Farmington Hills MI 77.5 0.388 0.98 63,693 560 $100M-500M 70.0 8,746 417 0United Bk MI Grand Rapids MI 77.5 0.341 0.644 141,370 779 $100M-500M 52.5 11,184 337 0
Home St Bk Litchfield MN 97.5 0.417 1 43,628 599 $100M-500M 100.0 43,628 599 0Voyager Bk Eden Prairie MN 95.0 0.382 1 200,591 706 $500M-$1B 57.5 15,090 328 0Prior Lake St Bk Prior Lake MN 95.0 0.398 1 63,838 493 $100M-500M 45.0 4,054 313 0Republic Bk Duluth MN 92.5 0.575 1 123,293 613 $100M-500M 62.5 9,766 307 0.001
Page 36
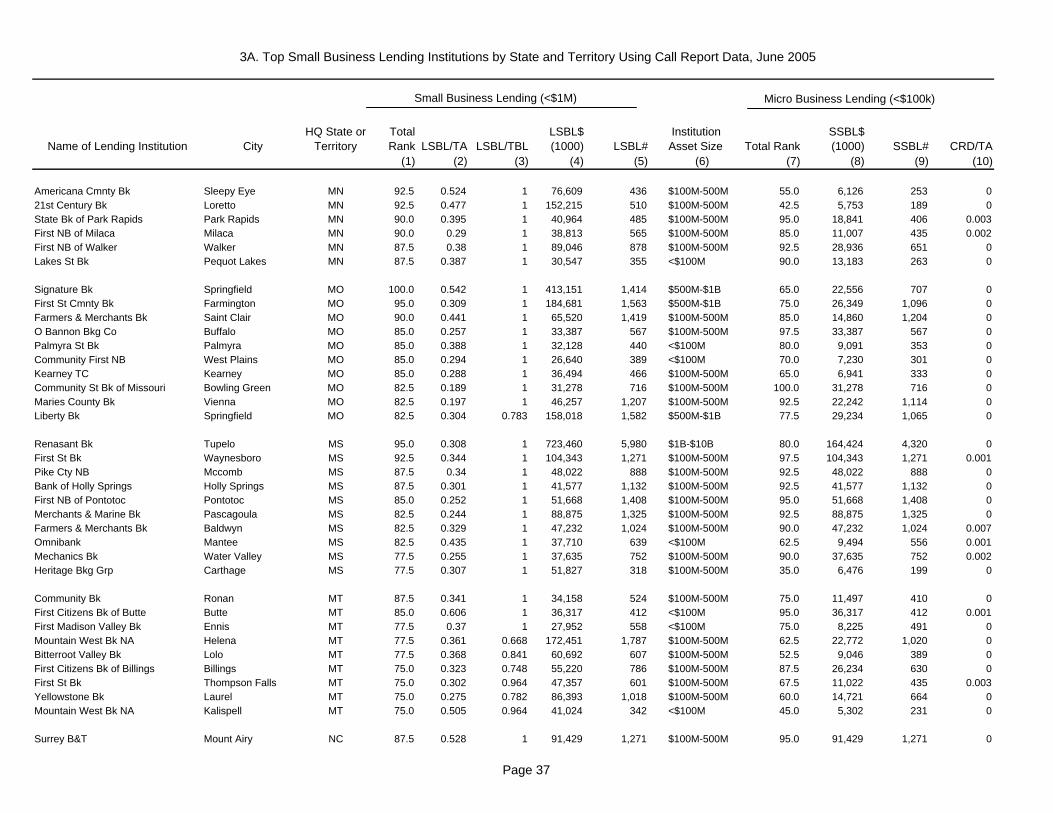
3A. Top Small Business Lending Institutions by State and Territory Using Call Report Data, June 2005
Name of Lending Institution CityHQ State or
TerritoryTotal Rank
LSBL/TA LSBL/TBL
LSBL$ (1000) LSBL#
Institution Asset Size Total Rank
SSBL$ (1000) SSBL# CRD/TA
(1) (2) (3) (4) (5) (6) (7) (8) (9) (10)
Micro Business Lending (<$100k)Small Business Lending (<$1M)
Americana Cmnty Bk Sleepy Eye MN 92.5 0.524 1 76,609 436 $100M-500M 55.0 6,126 253 021st Century Bk Loretto MN 92.5 0.477 1 152,215 510 $100M-500M 42.5 5,753 189 0State Bk of Park Rapids Park Rapids MN 90.0 0.395 1 40,964 485 $100M-500M 95.0 18,841 406 0.003First NB of Milaca Milaca MN 90.0 0.29 1 38,813 565 $100M-500M 85.0 11,007 435 0.002First NB of Walker Walker MN 87.5 0.38 1 89,046 878 $100M-500M 92.5 28,936 651 0Lakes St Bk Pequot Lakes MN 87.5 0.387 1 30,547 355 <$100M 90.0 13,183 263 0
Signature Bk Springfield MO 100.0 0.542 1 413,151 1,414 $500M-$1B 65.0 22,556 707 0First St Cmnty Bk Farmington MO 95.0 0.309 1 184,681 1,563 $500M-$1B 75.0 26,349 1,096 0Farmers & Merchants Bk Saint Clair MO 90.0 0.441 1 65,520 1,419 $100M-500M 85.0 14,860 1,204 0O Bannon Bkg Co Buffalo MO 85.0 0.257 1 33,387 567 $100M-500M 97.5 33,387 567 0Palmyra St Bk Palmyra MO 85.0 0.388 1 32,128 440 <$100M 80.0 9,091 353 0Community First NB West Plains MO 85.0 0.294 1 26,640 389 <$100M 70.0 7,230 301 0Kearney TC Kearney MO 85.0 0.288 1 36,494 466 $100M-500M 65.0 6,941 333 0Community St Bk of Missouri Bowling Green MO 82.5 0.189 1 31,278 716 $100M-500M 100.0 31,278 716 0Maries County Bk Vienna MO 82.5 0.197 1 46,257 1,207 $100M-500M 92.5 22,242 1,114 0Liberty Bk Springfield MO 82.5 0.304 0.783 158,018 1,582 $500M-$1B 77.5 29,234 1,065 0
Renasant Bk Tupelo MS 95.0 0.308 1 723,460 5,980 $1B-$10B 80.0 164,424 4,320 0First St Bk Waynesboro MS 92.5 0.344 1 104,343 1,271 $100M-500M 97.5 104,343 1,271 0.001Pike Cty NB Mccomb MS 87.5 0.34 1 48,022 888 $100M-500M 92.5 48,022 888 0Bank of Holly Springs Holly Springs MS 87.5 0.301 1 41,577 1,132 $100M-500M 92.5 41,577 1,132 0First NB of Pontotoc Pontotoc MS 85.0 0.252 1 51,668 1,408 $100M-500M 95.0 51,668 1,408 0Merchants & Marine Bk Pascagoula MS 82.5 0.244 1 88,875 1,325 $100M-500M 92.5 88,875 1,325 0Farmers & Merchants Bk Baldwyn MS 82.5 0.329 1 47,232 1,024 $100M-500M 90.0 47,232 1,024 0.007Omnibank Mantee MS 82.5 0.435 1 37,710 639 <$100M 62.5 9,494 556 0.001Mechanics Bk Water Valley MS 77.5 0.255 1 37,635 752 $100M-500M 90.0 37,635 752 0.002Heritage Bkg Grp Carthage MS 77.5 0.307 1 51,827 318 $100M-500M 35.0 6,476 199 0
Community Bk Ronan MT 87.5 0.341 1 34,158 524 $100M-500M 75.0 11,497 410 0First Citizens Bk of Butte Butte MT 85.0 0.606 1 36,317 412 <$100M 95.0 36,317 412 0.001First Madison Valley Bk Ennis MT 77.5 0.37 1 27,952 558 <$100M 75.0 8,225 491 0Mountain West Bk NA Helena MT 77.5 0.361 0.668 172,451 1,787 $100M-500M 62.5 22,772 1,020 0Bitterroot Valley Bk Lolo MT 77.5 0.368 0.841 60,692 607 $100M-500M 52.5 9,046 389 0First Citizens Bk of Billings Billings MT 75.0 0.323 0.748 55,220 786 $100M-500M 87.5 26,234 630 0First St Bk Thompson Falls MT 75.0 0.302 0.964 47,357 601 $100M-500M 67.5 11,022 435 0.003Yellowstone Bk Laurel MT 75.0 0.275 0.782 86,393 1,018 $100M-500M 60.0 14,721 664 0Mountain West Bk NA Kalispell MT 75.0 0.505 0.964 41,024 342 <$100M 45.0 5,302 231 0
Surrey B&T Mount Airy NC 87.5 0.528 1 91,429 1,271 $100M-500M 95.0 91,429 1,271 0
Page 37

3A. Top Small Business Lending Institutions by State and Territory Using Call Report Data, June 2005
Name of Lending Institution CityHQ State or
TerritoryTotal Rank
LSBL/TA LSBL/TBL
LSBL$ (1000) LSBL#
Institution Asset Size Total Rank
SSBL$ (1000) SSBL# CRD/TA
(1) (2) (3) (4) (5) (6) (7) (8) (9) (10)
Micro Business Lending (<$100k)Small Business Lending (<$1M)
Bank of NC Thomasville NC 87.5 0.377 0.997 212,384 1,018 $500M-$1B 62.5 16,730 547 0Yadkin Valley B&TC Elkin NC 82.5 0.258 0.71 255,936 3,168 $500M-$1B 87.5 52,932 2,221 0.002American Cmnty Bk Monroe NC 82.5 0.311 0.816 130,271 1,360 $100M-500M 82.5 21,789 912 0Bank of Granite Granite Falls NC 80.0 0.312 0.642 321,999 3,342 $1B-$10B 85.0 57,020 2,174 0New Century Bk Dunn NC 80.0 0.301 0.888 89,777 1,477 $100M-500M 80.0 13,437 817 0Four Oaks B&TC Four Oaks NC 77.5 0.235 1 105,047 746 $100M-500M 92.5 105,047 746 0.005Southern Cmnty B&TC Winston-Salem NC 77.5 0.221 0.674 286,062 3,512 $1B-$10B 87.5 61,300 2,766 0Fidelity Bk Fuquay-Varina NC 77.5 0.225 0.733 269,685 2,588 $1B-$10B 77.5 44,489 1,548 0.003Mountain 1st Bk & Tr Hendersonville NC 75.0 0.327 0.854 82,454 512 $100M-500M 55.0 9,580 251 0Alamance Bk Graham NC 75.0 0.343 1 51,566 371 $100M-500M 42.5 4,392 209 0
United Valley Bk Cavalier ND 92.5 0.373 1 34,767 440 <$100M 87.5 20,550 378 0Kirkwood B&TC Bismarck ND 92.5 0.546 1 61,907 379 $100M-500M 77.5 15,242 248 0First St Bk Buxton ND 87.5 0.293 1 20,386 289 <$100M 52.5 3,334 206 0.001First United Bk Park River ND 82.5 0.169 1 15,901 455 <$100M 97.5 15,901 455 0Dakota Cmnty Bk Hebron ND 82.5 0.211 1 44,570 729 $100M-500M 75.0 13,635 553 0First International B&TC Watford City ND 77.5 0.248 0.675 165,916 1,703 $500M-$1B 70.0 34,292 1,157 0.01Stutsman County St Bk Jamestown ND 75.0 0.25 0.852 34,014 481 $100M-500M 70.0 8,216 361 0.002Goose River Bk Mayville ND 75.0 0.251 1 17,454 214 <$100M 55.0 3,700 150 0American St B&TC of Dickinson Dickinson ND 75.0 0.224 0.87 40,652 422 $100M-500M 52.5 6,160 261 0.005U S Bk NA ND Fargo ND 72.5 0.186 0.469 750,313 176,902 $1B-$10B 90.0 589,870 175,092 0.079Lakeside St Bk New Town ND 72.5 0.129 1 6,508 2,355 <$100M 90.0 6,508 2,355 0Starion FNCL Bismarck ND 72.5 0.173 0.685 76,167 1,115 $100M-500M 75.0 23,865 875 0Dakota Western Bk Bowman ND 72.5 0.182 1 20,306 320 $100M-500M 70.0 5,523 258 0.003Alerus FNCL NA Grand Forks ND 72.5 0.209 0.507 129,141 1,269 $500M-$1B 60.0 21,080 841 0Great Plains NB Belfield ND 72.5 0.177 1 10,952 194 <$100M 60.0 3,756 144 0Ramsey NB&TC of Devils Lake Devils Lake ND 72.5 0.257 0.819 38,120 349 $100M-500M 50.0 5,097 198 0Bank Center First Bismarck ND 72.5 0.231 0.493 53,892 404 $100M-500M 42.5 4,667 200 0.009
York St B&TC York NE 97.5 0.256 1 47,462 710 $100M-500M 92.5 29,941 647 0.019Dakota Cty St Bk South Sioux City NE 92.5 0.28 1 24,329 313 <$100M 95.0 24,329 313 0Commercial St Bk Wausa NE 90.0 0.308 1 15,868 805 <$100M 97.5 15,868 805 0.003Gothenburg St B&TC Gothenburg NE 87.5 0.243 1 20,096 329 <$100M 95.0 20,096 329 0Otoe Cty B&TC Nebraska City NE 87.5 0.222 1 15,167 213 <$100M 95.0 15,167 213 0City St Bk Sutton NE 87.5 0.268 1 16,916 220 <$100M 92.5 16,916 220 0Elkhorn Valley B&TC Norfolk NE 87.5 0.243 0.994 63,634 808 $100M-500M 82.5 20,646 640 0.003First B&TC Cozad NE 85.0 0.24 1 31,896 429 $100M-500M 95.0 31,896 429 0Saline St Bk Wilber NE 85.0 0.235 1 22,031 372 <$100M 95.0 22,031 372 0Centennial Bk Omaha NE 85.0 0.314 1 11,184 169 <$100M 62.5 2,731 123 0
Page 38
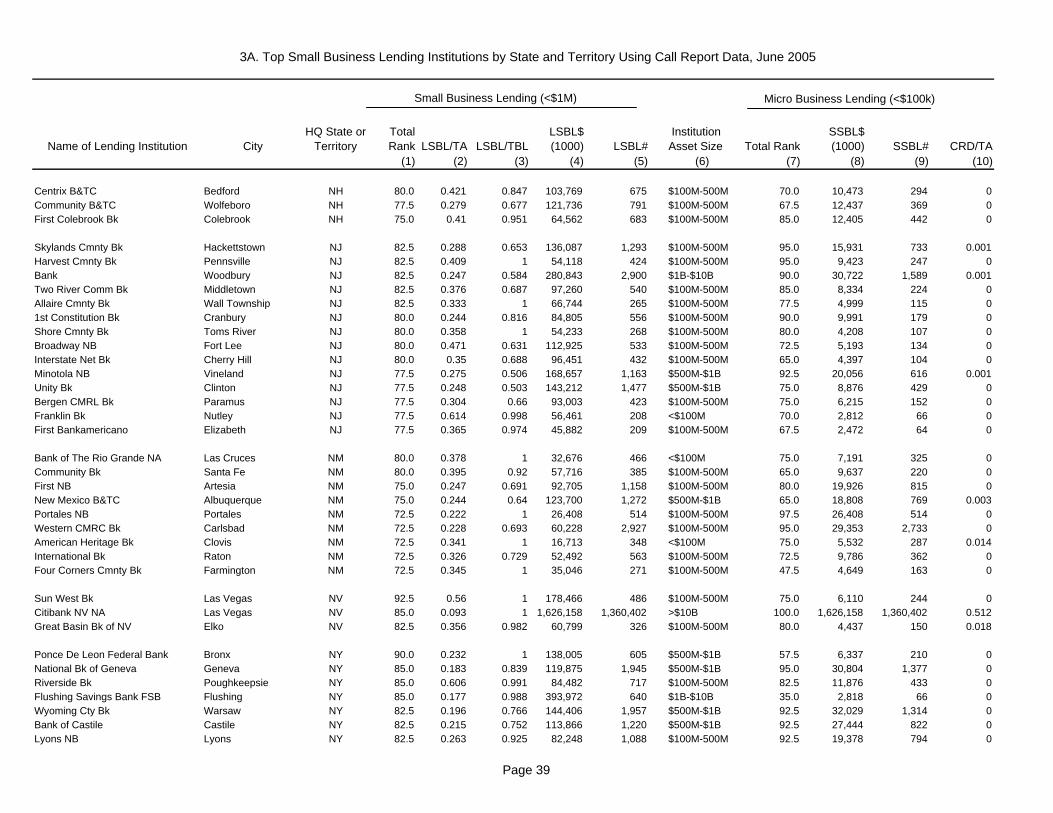
3A. Top Small Business Lending Institutions by State and Territory Using Call Report Data, June 2005
Name of Lending Institution CityHQ State or
TerritoryTotal Rank
LSBL/TA LSBL/TBL
LSBL$ (1000) LSBL#
Institution Asset Size Total Rank
SSBL$ (1000) SSBL# CRD/TA
(1) (2) (3) (4) (5) (6) (7) (8) (9) (10)
Micro Business Lending (<$100k)Small Business Lending (<$1M)
Centrix B&TC Bedford NH 80.0 0.421 0.847 103,769 675 $100M-500M 70.0 10,473 294 0Community B&TC Wolfeboro NH 77.5 0.279 0.677 121,736 791 $100M-500M 67.5 12,437 369 0First Colebrook Bk Colebrook NH 75.0 0.41 0.951 64,562 683 $100M-500M 85.0 12,405 442 0
Skylands Cmnty Bk Hackettstown NJ 82.5 0.288 0.653 136,087 1,293 $100M-500M 95.0 15,931 733 0.001Harvest Cmnty Bk Pennsville NJ 82.5 0.409 1 54,118 424 $100M-500M 95.0 9,423 247 0Bank Woodbury NJ 82.5 0.247 0.584 280,843 2,900 $1B-$10B 90.0 30,722 1,589 0.001Two River Comm Bk Middletown NJ 82.5 0.376 0.687 97,260 540 $100M-500M 85.0 8,334 224 0Allaire Cmnty Bk Wall Township NJ 82.5 0.333 1 66,744 265 $100M-500M 77.5 4,999 115 01st Constitution Bk Cranbury NJ 80.0 0.244 0.816 84,805 556 $100M-500M 90.0 9,991 179 0Shore Cmnty Bk Toms River NJ 80.0 0.358 1 54,233 268 $100M-500M 80.0 4,208 107 0Broadway NB Fort Lee NJ 80.0 0.471 0.631 112,925 533 $100M-500M 72.5 5,193 134 0Interstate Net Bk Cherry Hill NJ 80.0 0.35 0.688 96,451 432 $100M-500M 65.0 4,397 104 0Minotola NB Vineland NJ 77.5 0.275 0.506 168,657 1,163 $500M-$1B 92.5 20,056 616 0.001Unity Bk Clinton NJ 77.5 0.248 0.503 143,212 1,477 $500M-$1B 75.0 8,876 429 0Bergen CMRL Bk Paramus NJ 77.5 0.304 0.66 93,003 423 $100M-500M 75.0 6,215 152 0Franklin Bk Nutley NJ 77.5 0.614 0.998 56,461 208 <$100M 70.0 2,812 66 0First Bankamericano Elizabeth NJ 77.5 0.365 0.974 45,882 209 $100M-500M 67.5 2,472 64 0
Bank of The Rio Grande NA Las Cruces NM 80.0 0.378 1 32,676 466 <$100M 75.0 7,191 325 0Community Bk Santa Fe NM 80.0 0.395 0.92 57,716 385 $100M-500M 65.0 9,637 220 0First NB Artesia NM 75.0 0.247 0.691 92,705 1,158 $100M-500M 80.0 19,926 815 0New Mexico B&TC Albuquerque NM 75.0 0.244 0.64 123,700 1,272 $500M-$1B 65.0 18,808 769 0.003Portales NB Portales NM 72.5 0.222 1 26,408 514 $100M-500M 97.5 26,408 514 0Western CMRC Bk Carlsbad NM 72.5 0.228 0.693 60,228 2,927 $100M-500M 95.0 29,353 2,733 0American Heritage Bk Clovis NM 72.5 0.341 1 16,713 348 <$100M 75.0 5,532 287 0.014International Bk Raton NM 72.5 0.326 0.729 52,492 563 $100M-500M 72.5 9,786 362 0Four Corners Cmnty Bk Farmington NM 72.5 0.345 1 35,046 271 $100M-500M 47.5 4,649 163 0
Sun West Bk Las Vegas NV 92.5 0.56 1 178,466 486 $100M-500M 75.0 6,110 244 0Citibank NV NA Las Vegas NV 85.0 0.093 1 1,626,158 1,360,402 >$10B 100.0 1,626,158 1,360,402 0.512Great Basin Bk of NV Elko NV 82.5 0.356 0.982 60,799 326 $100M-500M 80.0 4,437 150 0.018
Ponce De Leon Federal Bank Bronx NY 90.0 0.232 1 138,005 605 $500M-$1B 57.5 6,337 210 0National Bk of Geneva Geneva NY 85.0 0.183 0.839 119,875 1,945 $500M-$1B 95.0 30,804 1,377 0Riverside Bk Poughkeepsie NY 85.0 0.606 0.991 84,482 717 $100M-500M 82.5 11,876 433 0Flushing Savings Bank FSB Flushing NY 85.0 0.177 0.988 393,972 640 $1B-$10B 35.0 2,818 66 0Wyoming Cty Bk Warsaw NY 82.5 0.196 0.766 144,406 1,957 $500M-$1B 92.5 32,029 1,314 0Bank of Castile Castile NY 82.5 0.215 0.752 113,866 1,220 $500M-$1B 92.5 27,444 822 0Lyons NB Lyons NY 82.5 0.263 0.925 82,248 1,088 $100M-500M 92.5 19,378 794 0
Page 39

3A. Top Small Business Lending Institutions by State and Territory Using Call Report Data, June 2005
Name of Lending Institution CityHQ State or
TerritoryTotal Rank
LSBL/TA LSBL/TBL
LSBL$ (1000) LSBL#
Institution Asset Size Total Rank
SSBL$ (1000) SSBL# CRD/TA
(1) (2) (3) (4) (5) (6) (7) (8) (9) (10)
Micro Business Lending (<$100k)Small Business Lending (<$1M)
Canandaigua NB&TC Canandaigua NY 82.5 0.226 0.609 227,442 2,574 $1B-$10B 90.0 45,273 1,873 0Great Eastern Bk New York NY 82.5 0.41 0.66 127,062 926 $100M-500M 85.0 19,138 523 0State Bk of Long Island New Hyde Park NY 82.5 0.232 0.575 336,155 1,638 $1B-$10B 80.0 41,063 932 0Community Capital Bk Brooklyn NY 82.5 0.411 1 66,352 270 $100M-500M 70.0 6,390 143 0
Citizens Svg Bk Martins Ferry OH 92.5 0.258 1 72,286 1,391 $100M-500M 80.0 13,434 386 0Buckeye Cmnty Bk Lorain OH 92.5 0.549 1 58,104 617 $100M-500M 67.5 5,477 310 0Eaton NB&TC Eaton OH 90.0 0.386 1 67,286 357 $100M-500M 62.5 6,720 197 0.008Commercial Svg Bk Upper Sandusky OH 87.5 0.309 1 91,101 635 $100M-500M 72.5 10,748 409 0.003Park View FSB Solon OH 87.5 0.248 0.999 206,089 588 $500M-$1B 37.5 5,283 90 0Fort Jennings St Bk Fort Jennings OH 85.0 0.302 1 29,117 383 <$100M 85.0 9,470 289 0.002Community First B&TC Celina OH 85.0 0.21 0.924 195,290 1,895 $500M-$1B 77.5 26,809 1,354 0.005Commerce NB Columbus OH 85.0 0.401 0.738 180,940 1,106 $100M-500M 70.0 16,333 504 0Sutton Bk Attica OH 82.5 0.334 0.901 94,264 986 $100M-500M 97.5 55,353 750 0.002Merchants NB Hillsboro OH 82.5 0.193 0.917 69,389 1,224 $100M-500M 92.5 19,870 1,000 0Vinton Cty NB Mcarthur OH 82.5 0.155 1 39,935 613 $100M-500M 90.0 13,477 521 0First-Knox NB Mount Vernon OH 82.5 0.171 0.809 132,352 1,630 $500M-$1B 85.0 30,876 1,154 0.006Hicksville Bldg Loan & Svg Bank Hicksville OH 82.5 0.302 1 20,901 276 <$100M 85.0 10,041 219 0Kingston NB Kingston OH 82.5 0.244 1 32,888 429 $100M-500M 82.5 8,958 306 0.003Heartland Bk Gahanna OH 82.5 0.353 0.769 141,422 991 $100M-500M 72.5 17,671 546 0.005Independence Bk Independence OH 82.5 0.457 0.892 68,692 533 $100M-500M 72.5 8,881 268 0First NB Bellevue OH 82.5 0.519 1 51,711 265 <$100M 67.5 5,895 169 0.006Centerbank Milford OH 82.5 0.615 1 30,512 247 <$100M 67.5 3,803 113 0
Bank of The Lakes NA Owasso OK 97.5 0.552 1 79,781 538 $100M-500M 60.0 7,465 403 0First NB&TC Chickasha OK 90.0 0.259 1 65,364 866 $100M-500M 95.0 65,364 866 0First B&TC Wagoner OK 90.0 0.328 1 46,989 669 $100M-500M 77.5 12,322 559 0First NB&TC Miami OK 85.0 0.217 1 24,574 376 $100M-500M 97.5 24,574 376 0Pauls Valley NB Pauls Valley OK 85.0 0.247 1 27,093 687 $100M-500M 97.5 27,093 687 0Community B&TC Tulsa OK 85.0 0.416 0.818 78,191 770 $100M-500M 85.0 24,579 569 0First NB of OK Ponca City OK 85.0 0.359 1 32,581 514 <$100M 75.0 8,014 388 0Community St Bk Poteau OK 85.0 0.207 1 26,349 444 $100M-500M 72.5 9,613 347 0Security Bk Pawnee OK 85.0 0.396 0.815 102,407 1,046 $100M-500M 67.5 15,055 604 0Pioneer B&TC Ponca City OK 85.0 0.424 0.994 80,075 703 $100M-500M 67.5 10,885 468 0
Mbank Gresham OR 82.5 0.425 1 103,042 555 $100M-500M 70.0 8,571 259 0Columbia Cmnty Bk Hillsboro OR 75.0 0.404 0.774 63,898 423 $100M-500M 72.5 6,819 189 0Pacific Continental Bk Eugene OR 70.0 0.308 0.545 170,764 1,444 $500M-$1B 70.0 18,974 755 0Siuslaw Bk Florence OR 70.0 0.281 0.626 75,185 1,360 $100M-500M 65.0 8,454 1,106 0.005
Page 40
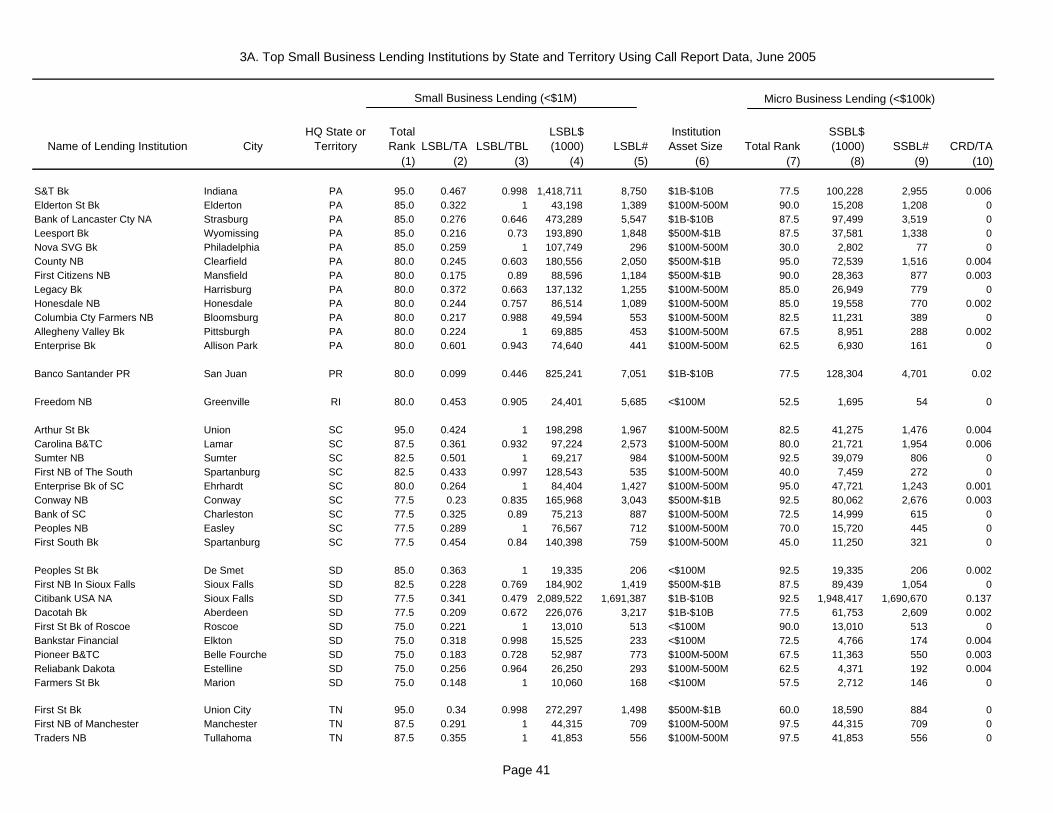
3A. Top Small Business Lending Institutions by State and Territory Using Call Report Data, June 2005
Name of Lending Institution CityHQ State or
TerritoryTotal Rank
LSBL/TA LSBL/TBL
LSBL$ (1000) LSBL#
Institution Asset Size Total Rank
SSBL$ (1000) SSBL# CRD/TA
(1) (2) (3) (4) (5) (6) (7) (8) (9) (10)
Micro Business Lending (<$100k)Small Business Lending (<$1M)
S&T Bk Indiana PA 95.0 0.467 0.998 1,418,711 8,750 $1B-$10B 77.5 100,228 2,955 0.006Elderton St Bk Elderton PA 85.0 0.322 1 43,198 1,389 $100M-500M 90.0 15,208 1,208 0Bank of Lancaster Cty NA Strasburg PA 85.0 0.276 0.646 473,289 5,547 $1B-$10B 87.5 97,499 3,519 0Leesport Bk Wyomissing PA 85.0 0.216 0.73 193,890 1,848 $500M-$1B 87.5 37,581 1,338 0Nova SVG Bk Philadelphia PA 85.0 0.259 1 107,749 296 $100M-500M 30.0 2,802 77 0County NB Clearfield PA 80.0 0.245 0.603 180,556 2,050 $500M-$1B 95.0 72,539 1,516 0.004First Citizens NB Mansfield PA 80.0 0.175 0.89 88,596 1,184 $500M-$1B 90.0 28,363 877 0.003Legacy Bk Harrisburg PA 80.0 0.372 0.663 137,132 1,255 $100M-500M 85.0 26,949 779 0Honesdale NB Honesdale PA 80.0 0.244 0.757 86,514 1,089 $100M-500M 85.0 19,558 770 0.002Columbia Cty Farmers NB Bloomsburg PA 80.0 0.217 0.988 49,594 553 $100M-500M 82.5 11,231 389 0Allegheny Valley Bk Pittsburgh PA 80.0 0.224 1 69,885 453 $100M-500M 67.5 8,951 288 0.002Enterprise Bk Allison Park PA 80.0 0.601 0.943 74,640 441 $100M-500M 62.5 6,930 161 0
Banco Santander PR San Juan PR 80.0 0.099 0.446 825,241 7,051 $1B-$10B 77.5 128,304 4,701 0.02
Freedom NB Greenville RI 80.0 0.453 0.905 24,401 5,685 <$100M 52.5 1,695 54 0
Arthur St Bk Union SC 95.0 0.424 1 198,298 1,967 $100M-500M 82.5 41,275 1,476 0.004Carolina B&TC Lamar SC 87.5 0.361 0.932 97,224 2,573 $100M-500M 80.0 21,721 1,954 0.006Sumter NB Sumter SC 82.5 0.501 1 69,217 984 $100M-500M 92.5 39,079 806 0First NB of The South Spartanburg SC 82.5 0.433 0.997 128,543 535 $100M-500M 40.0 7,459 272 0Enterprise Bk of SC Ehrhardt SC 80.0 0.264 1 84,404 1,427 $100M-500M 95.0 47,721 1,243 0.001Conway NB Conway SC 77.5 0.23 0.835 165,968 3,043 $500M-$1B 92.5 80,062 2,676 0.003Bank of SC Charleston SC 77.5 0.325 0.89 75,213 887 $100M-500M 72.5 14,999 615 0Peoples NB Easley SC 77.5 0.289 1 76,567 712 $100M-500M 70.0 15,720 445 0First South Bk Spartanburg SC 77.5 0.454 0.84 140,398 759 $100M-500M 45.0 11,250 321 0
Peoples St Bk De Smet SD 85.0 0.363 1 19,335 206 <$100M 92.5 19,335 206 0.002First NB In Sioux Falls Sioux Falls SD 82.5 0.228 0.769 184,902 1,419 $500M-$1B 87.5 89,439 1,054 0Citibank USA NA Sioux Falls SD 77.5 0.341 0.479 2,089,522 1,691,387 $1B-$10B 92.5 1,948,417 1,690,670 0.137Dacotah Bk Aberdeen SD 77.5 0.209 0.672 226,076 3,217 $1B-$10B 77.5 61,753 2,609 0.002First St Bk of Roscoe Roscoe SD 75.0 0.221 1 13,010 513 <$100M 90.0 13,010 513 0Bankstar Financial Elkton SD 75.0 0.318 0.998 15,525 233 <$100M 72.5 4,766 174 0.004Pioneer B&TC Belle Fourche SD 75.0 0.183 0.728 52,987 773 $100M-500M 67.5 11,363 550 0.003Reliabank Dakota Estelline SD 75.0 0.256 0.964 26,250 293 $100M-500M 62.5 4,371 192 0.004Farmers St Bk Marion SD 75.0 0.148 1 10,060 168 <$100M 57.5 2,712 146 0
First St Bk Union City TN 95.0 0.34 0.998 272,297 1,498 $500M-$1B 60.0 18,590 884 0First NB of Manchester Manchester TN 87.5 0.291 1 44,315 709 $100M-500M 97.5 44,315 709 0Traders NB Tullahoma TN 87.5 0.355 1 41,853 556 $100M-500M 97.5 41,853 556 0
Page 41

3A. Top Small Business Lending Institutions by State and Territory Using Call Report Data, June 2005
Name of Lending Institution CityHQ State or
TerritoryTotal Rank
LSBL/TA LSBL/TBL
LSBL$ (1000) LSBL#
Institution Asset Size Total Rank
SSBL$ (1000) SSBL# CRD/TA
(1) (2) (3) (4) (5) (6) (7) (8) (9) (10)
Micro Business Lending (<$100k)Small Business Lending (<$1M)
Tennessee CMRC Bk Franklin TN 87.5 0.583 0.802 182,474 2,838 $100M-500M 95.0 84,844 2,233 0.001First NB Oneida TN 87.5 0.377 0.965 75,690 888 $100M-500M 85.0 16,991 655 0Citizens Bk Carthage TN 82.5 0.175 1 77,552 2,094 $100M-500M 97.5 77,552 2,094 0American City Bk Tullahoma TN 82.5 0.344 0.929 51,261 560 $100M-500M 92.5 25,488 442 0Bank of Lincoln Cty Fayetteville TN 82.5 0.341 1 34,146 351 $100M-500M 80.0 12,296 261 0Bank of Greeneville Greeneville TN 82.5 0.436 0.852 37,552 795 <$100M 80.0 9,815 628 0First Volunteer Bk of Tennes Chattanooga TN 82.5 0.249 0.718 120,519 1,218 $100M-500M 75.0 21,819 811 0.003
First NB Monahans TX 92.5 0.39 1 83,458 2,717 $100M-500M 95.0 83,458 2,717 0Park Cities Bk Dallas TX 92.5 0.468 1 154,769 314 $100M-500M 32.5 5,865 113 0First NB Hughes Springs TX 90.0 0.279 1 40,123 968 $100M-500M 100.0 40,123 968 0First NB George West TX 90.0 0.412 1 45,397 859 $100M-500M 97.5 45,397 859 0First St Bk Chico TX 90.0 0.366 1 32,974 550 <$100M 97.5 32,974 550 0First Cmnty Bk NA Houston TX 90.0 0.484 0.994 273,042 1,658 $500M-$1B 80.0 43,267 1,130 0First St Bk Louise TX 85.0 0.204 1 27,590 963 $100M-500M 100.0 27,590 963 0Peoples Bk Paris TX 85.0 0.291 1 27,739 454 <$100M 97.5 27,739 454 0.001First NB of Albany Breckenridge Albany TX 85.0 0.228 1 54,143 1,166 $100M-500M 95.0 54,143 1,166 0Security St Bk Odessa TX 85.0 0.45 0.894 79,714 1,254 $100M-500M 85.0 21,779 1,000 0.002Alamo Bk of TX Alamo TX 85.0 0.392 0.858 121,268 1,656 $100M-500M 82.5 29,320 1,235 0GNB FNCL NA Gainesville TX 85.0 0.313 0.9 82,103 1,149 $100M-500M 82.5 19,449 774 0First Cmnty Bk Corpus Christi TX 85.0 0.322 1 39,887 676 $100M-500M 82.5 12,168 537 0.002Texas Star Bk Van Alstyne TX 85.0 0.388 1 59,271 826 $100M-500M 77.5 13,699 658 0Falcon Intl Bk Laredo TX 85.0 0.289 0.989 119,047 954 $100M-500M 65.0 15,872 660 0.002American Bk NA Waco TX 85.0 0.304 1 81,716 514 $100M-500M 50.0 8,051 325 0
American Express Bank FSB Salt Lake City UT 97.5 0.485 1 6,630,445 1,627,649 >$10B 97.5 6,630,445 1,627,649 0.302Pitney Bowes Bk Salt Lake City UT 95.0 0.606 1 352,285 1,239,012 $500M-$1B 92.5 344,901 1,238,976 0Associates Cap Bk Salt Lake City UT 92.5 0.763 1 295,911 329,858 $100M-500M 95.0 295,911 329,858 0Advanta Bk Corp. Draper UT 90.0 0.58 1 865,051 204,738 $1B-$10B 95.0 865,051 204,738 0Universal FC Salt Lake City UT 90.0 0.971 1 596,533 366,391 $500M-$1B 95.0 595,980 366,386 0Wright Express FS Corp. Salt Lake City UT 85.0 0.932 0.995 550,600 114,596 $500M-$1B 92.5 421,446 114,151 0Volvo Cmrl Cr Corp UT Salt Lake City UT 85.0 0.819 1 18,015 5,399 <$100M 90.0 18,015 5,399 0
New Peoples Bk Honaker VA 97.5 0.333 0.964 159,887 1,599 $100M-500M 92.5 30,646 1,144 0Rockingham Heritage Bk Harrisonburg VA 92.5 0.498 1 118,410 683 $100M-500M 65.0 9,723 373 0Capital One FSB Mclean VA 87.5 0.19 0.983 2,793,033 1,245,485 >$10B 100.0 2,752,551 1,245,220 0.211Highlands Union Bk Abingdon VA 82.5 0.196 0.796 113,693 1,335 $500M-$1B 97.5 45,963 1,062 0.002Bank of The James Lynchburg VA 82.5 0.335 0.853 62,106 877 $100M-500M 92.5 17,160 636 0First NB of Altavista Altavista VA 80.0 0.284 0.904 62,286 798 $100M-500M 97.5 32,335 664 0Bank of Botetourt Buchanan VA 80.0 0.305 0.8 67,718 818 $100M-500M 82.5 12,934 545 0.006
Page 42

3A. Top Small Business Lending Institutions by State and Territory Using Call Report Data, June 2005
Name of Lending Institution CityHQ State or
TerritoryTotal Rank
LSBL/TA LSBL/TBL
LSBL$ (1000) LSBL#
Institution Asset Size Total Rank
SSBL$ (1000) SSBL# CRD/TA
(1) (2) (3) (4) (5) (6) (7) (8) (9) (10)
Micro Business Lending (<$100k)Small Business Lending (<$1M)
American NB&TC Danville VA 77.5 0.2 0.61 123,205 1,502 $500M-$1B 87.5 26,319 1,118 0Bank of Fincastle Fincastle VA 77.5 0.333 0.878 47,421 552 $100M-500M 77.5 8,717 376 0.004Townebank Portsmouth VA 77.5 0.18 0.605 298,307 3,172 $1B-$10B 72.5 37,579 1,894 0.001Planters B&TC of VA Staunton VA 77.5 0.202 0.574 159,402 1,390 $500M-$1B 70.0 21,560 860 0Community NB South Boston VA 77.5 0.309 1 76,303 287 $100M-500M 42.5 4,709 188 0
Bank of Saint Croix Christiansted VI 40.0 0.158 0.757 12,590 87 <$100M 40.0 1,071 38 0
Factory Point NB of Manchest Manchester Center VT 80.0 0.348 0.904 107,513 1,111 $100M-500M 77.5 21,663 689 0Connecticut River Bk NA Springfield VT 70.0 0.296 0.958 70,312 788 $100M-500M 60.0 12,550 477 0.003
Coastal Cmnty Bk Everett WA 90.0 0.574 1 72,265 475 $100M-500M 75.0 6,682 250 0.003Kitsap Bk Port Orchard WA 85.0 0.314 0.668 188,620 1,459 $500M-$1B 90.0 27,476 804 0.001Bank of The Pacific Aberdeen WA 85.0 0.311 0.705 142,833 1,333 $100M-500M 87.5 20,397 803 0.003Whidbey Island Bk Oak Harbor WA 82.5 0.243 0.71 170,911 1,804 $500M-$1B 90.0 26,566 1,134 0.003First Heritage Bk Snohomish WA 77.5 0.381 1 47,732 456 $100M-500M 75.0 5,441 250 0.001Westside Cmnty Bk University Place WA 77.5 0.51 1 43,582 229 <$100M 70.0 4,581 120 0.004Americanwest Bk Spokane WA 75.0 0.237 0.562 262,527 2,537 $1B-$10B 87.5 46,878 1,612 0.004South Sound Bk Olympia WA 75.0 0.399 0.997 41,362 362 $100M-500M 82.5 6,960 231 0Viking Cmnty Bk Seattle WA 75.0 0.266 0.701 89,034 929 $100M-500M 75.0 10,126 644 0.001Cowlitz Bk Longview WA 75.0 0.316 0.639 95,046 595 $100M-500M 70.0 8,733 302 0.004
River Valley St Bk Rothschild WI 92.5 0.427 1 284,528 1,960 $500M-$1B 75.0 32,810 1,190 0.001Community St Bk Union Grove WI 87.5 0.368 0.832 87,413 931 $100M-500M 87.5 20,157 684 0.005Business Bk Fox River Valley Appleton WI 87.5 0.566 0.855 100,934 594 $100M-500M 60.0 9,482 241 0.001Northern St Bk Ashland WI 85.0 0.261 1 39,631 624 $100M-500M 100.0 39,631 624 0.001Royal Bk Elroy WI 85.0 0.286 1 41,976 577 $100M-500M 82.5 11,225 465 0.002First Citizens St Bk Whitewater WI 85.0 0.285 1 50,292 412 $100M-500M 77.5 12,038 262 0.002Riverbank Osceola WI 85.0 0.394 0.749 105,326 871 $100M-500M 72.5 15,314 502 0.001Mound City Bk Platteville WI 82.5 0.289 1 56,905 420 $100M-500M 90.0 23,536 298 0.004First NB Waupaca WI 82.5 0.293 0.697 122,525 1,883 $100M-500M 85.0 28,770 1,515 0.001LSB Cmnty Bk Ixonia WI 82.5 0.359 0.777 106,182 549 $100M-500M 82.5 24,006 330 0.002Bank of Luxemburg Luxemburg WI 82.5 0.359 0.823 64,644 658 $100M-500M 80.0 13,714 437 0.002Port Washington St Bk Port Washington WI 82.5 0.336 0.791 86,380 924 $100M-500M 77.5 14,761 578 0.002Chippewa Valley Bk Winter WI 82.5 0.389 0.816 53,774 546 $100M-500M 77.5 10,696 370 0First Bk Fncl Centre Oconomowoc WI 82.5 0.358 0.656 150,926 1,166 $100M-500M 67.5 18,071 608 0.001First NB Fox Valley Neenah WI 82.5 0.355 0.794 78,984 600 $100M-500M 62.5 10,252 335 0.001Oregon Cmnty B&TC Oregon WI 82.5 0.37 1 59,362 250 $100M-500M 35.0 3,947 143 0.003
Wesbanco Bk Wheeling WV 87.5 0.25 1 1,119,653 21,832 $1B-$10B 97.5 1,119,653 21,832 0
Page 43
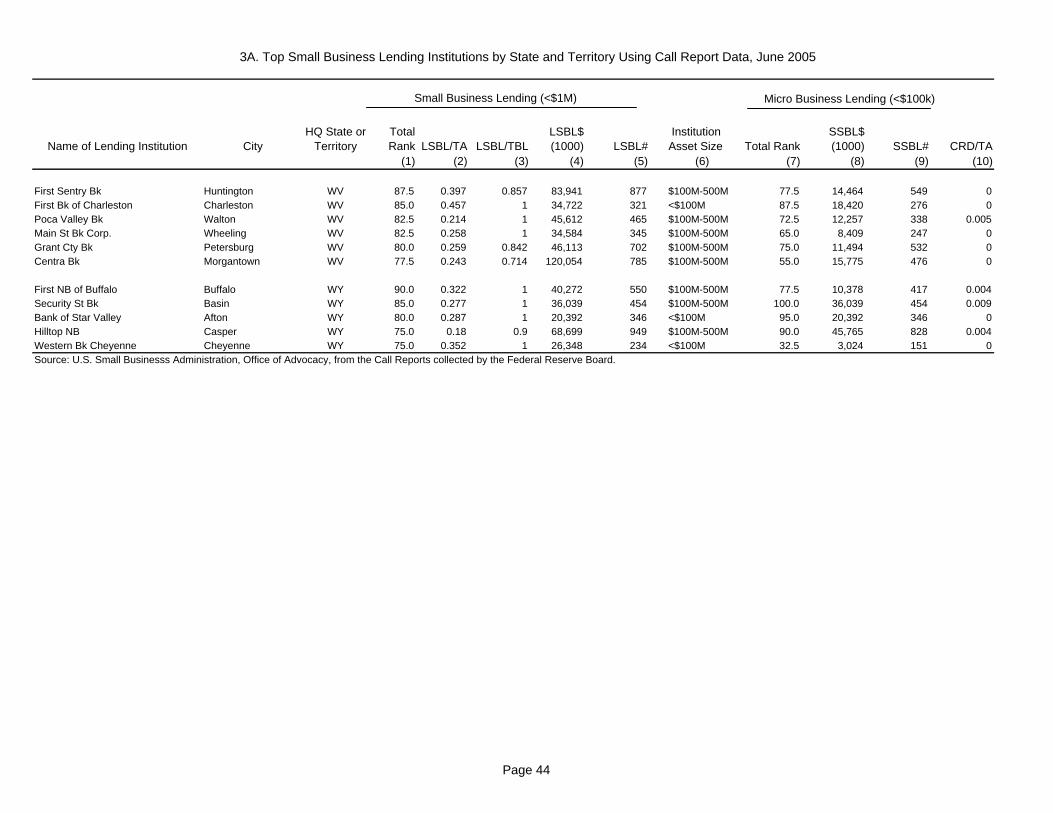
3A. Top Small Business Lending Institutions by State and Territory Using Call Report Data, June 2005
Name of Lending Institution CityHQ State or
TerritoryTotal Rank
LSBL/TA LSBL/TBL
LSBL$ (1000) LSBL#
Institution Asset Size Total Rank
SSBL$ (1000) SSBL# CRD/TA
(1) (2) (3) (4) (5) (6) (7) (8) (9) (10)
Micro Business Lending (<$100k)Small Business Lending (<$1M)
First Sentry Bk Huntington WV 87.5 0.397 0.857 83,941 877 $100M-500M 77.5 14,464 549 0First Bk of Charleston Charleston WV 85.0 0.457 1 34,722 321 <$100M 87.5 18,420 276 0Poca Valley Bk Walton WV 82.5 0.214 1 45,612 465 $100M-500M 72.5 12,257 338 0.005Main St Bk Corp. Wheeling WV 82.5 0.258 1 34,584 345 $100M-500M 65.0 8,409 247 0Grant Cty Bk Petersburg WV 80.0 0.259 0.842 46,113 702 $100M-500M 75.0 11,494 532 0Centra Bk Morgantown WV 77.5 0.243 0.714 120,054 785 $100M-500M 55.0 15,775 476 0
First NB of Buffalo Buffalo WY 90.0 0.322 1 40,272 550 $100M-500M 77.5 10,378 417 0.004Security St Bk Basin WY 85.0 0.277 1 36,039 454 $100M-500M 100.0 36,039 454 0.009Bank of Star Valley Afton WY 80.0 0.287 1 20,392 346 <$100M 95.0 20,392 346 0Hilltop NB Casper WY 75.0 0.18 0.9 68,699 949 $100M-500M 90.0 45,765 828 0.004Western Bk Cheyenne Cheyenne WY 75.0 0.352 1 26,348 234 <$100M 32.5 3,024 151 0Source: U.S. Small Businesss Administration, Office of Advocacy, from the Call Reports collected by the Federal Reserve Board.
Page 44
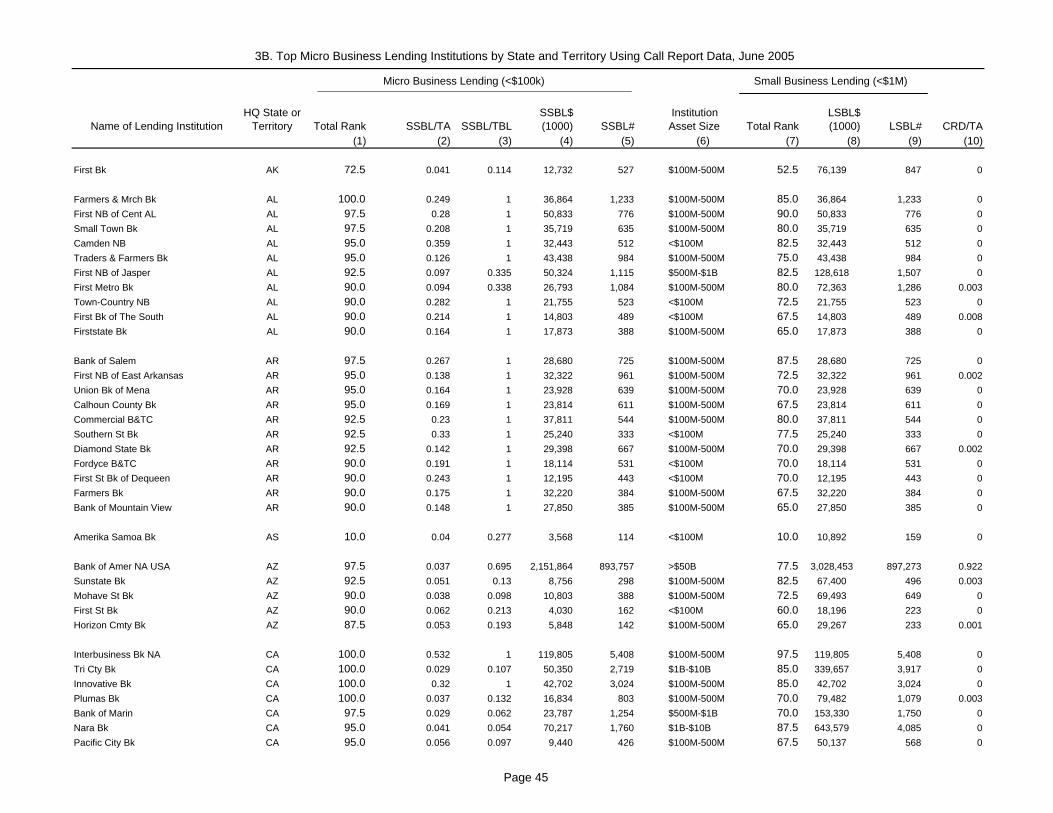
3B. Top Micro Business Lending Institutions by State and Territory Using Call Report Data, June 2005
Name of Lending InstitutionHQ State or
Territory Total Rank SSBL/TA SSBL/TBLSSBL$ (1000) SSBL#
Institution Asset Size Total Rank
LSBL$ (1000) LSBL# CRD/TA
(1) (2) (3) (4) (5) (6) (7) (8) (9) (10)
First Bk AK 72.5 0.041 0.114 12,732 527 $100M-500M 52.5 76,139 847 0
Farmers & Mrch Bk AL 100.0 0.249 1 36,864 1,233 $100M-500M 85.0 36,864 1,233 0First NB of Cent AL AL 97.5 0.28 1 50,833 776 $100M-500M 90.0 50,833 776 0Small Town Bk AL 97.5 0.208 1 35,719 635 $100M-500M 80.0 35,719 635 0Camden NB AL 95.0 0.359 1 32,443 512 <$100M 82.5 32,443 512 0Traders & Farmers Bk AL 95.0 0.126 1 43,438 984 $100M-500M 75.0 43,438 984 0First NB of Jasper AL 92.5 0.097 0.335 50,324 1,115 $500M-$1B 82.5 128,618 1,507 0First Metro Bk AL 90.0 0.094 0.338 26,793 1,084 $100M-500M 80.0 72,363 1,286 0.003Town-Country NB AL 90.0 0.282 1 21,755 523 <$100M 72.5 21,755 523 0First Bk of The South AL 90.0 0.214 1 14,803 489 <$100M 67.5 14,803 489 0.008Firststate Bk AL 90.0 0.164 1 17,873 388 $100M-500M 65.0 17,873 388 0
Bank of Salem AR 97.5 0.267 1 28,680 725 $100M-500M 87.5 28,680 725 0First NB of East Arkansas AR 95.0 0.138 1 32,322 961 $100M-500M 72.5 32,322 961 0.002Union Bk of Mena AR 95.0 0.164 1 23,928 639 $100M-500M 70.0 23,928 639 0Calhoun County Bk AR 95.0 0.169 1 23,814 611 $100M-500M 67.5 23,814 611 0Commercial B&TC AR 92.5 0.23 1 37,811 544 $100M-500M 80.0 37,811 544 0Southern St Bk AR 92.5 0.33 1 25,240 333 <$100M 77.5 25,240 333 0Diamond State Bk AR 92.5 0.142 1 29,398 667 $100M-500M 70.0 29,398 667 0.002Fordyce B&TC AR 90.0 0.191 1 18,114 531 <$100M 70.0 18,114 531 0First St Bk of Dequeen AR 90.0 0.243 1 12,195 443 <$100M 70.0 12,195 443 0Farmers Bk AR 90.0 0.175 1 32,220 384 $100M-500M 67.5 32,220 384 0Bank of Mountain View AR 90.0 0.148 1 27,850 385 $100M-500M 65.0 27,850 385 0
Amerika Samoa Bk AS 10.0 0.04 0.277 3,568 114 <$100M 10.0 10,892 159 0
Bank of Amer NA USA AZ 97.5 0.037 0.695 2,151,864 893,757 >$50B 77.5 3,028,453 897,273 0.922Sunstate Bk AZ 92.5 0.051 0.13 8,756 298 $100M-500M 82.5 67,400 496 0.003Mohave St Bk AZ 90.0 0.038 0.098 10,803 388 $100M-500M 72.5 69,493 649 0First St Bk AZ 90.0 0.062 0.213 4,030 162 <$100M 60.0 18,196 223 0Horizon Cmty Bk AZ 87.5 0.053 0.193 5,848 142 $100M-500M 65.0 29,267 233 0.001
Interbusiness Bk NA CA 100.0 0.532 1 119,805 5,408 $100M-500M 97.5 119,805 5,408 0Tri Cty Bk CA 100.0 0.029 0.107 50,350 2,719 $1B-$10B 85.0 339,657 3,917 0Innovative Bk CA 100.0 0.32 1 42,702 3,024 $100M-500M 85.0 42,702 3,024 0Plumas Bk CA 100.0 0.037 0.132 16,834 803 $100M-500M 70.0 79,482 1,079 0.003Bank of Marin CA 97.5 0.029 0.062 23,787 1,254 $500M-$1B 70.0 153,330 1,750 0Nara Bk CA 95.0 0.041 0.054 70,217 1,760 $1B-$10B 87.5 643,579 4,085 0Pacific City Bk CA 95.0 0.056 0.097 9,440 426 $100M-500M 67.5 50,137 568 0
Micro Business Lending (<$100k) Small Business Lending (<$1M)
Page 45

3B. Top Micro Business Lending Institutions by State and Territory Using Call Report Data, June 2005
Name of Lending InstitutionHQ State or
Territory Total Rank SSBL/TA SSBL/TBLSSBL$ (1000) SSBL#
Institution Asset Size Total Rank
LSBL$ (1000) LSBL# CRD/TA
(1) (2) (3) (4) (5) (6) (7) (8) (9) (10)
Micro Business Lending (<$100k) Small Business Lending (<$1M)
Murphy Bk CA 95.0 0.087 1 8,579 405 <$100M 55.0 8,579 405 0Community Cmrc Bk CA 92.5 0.053 0.086 14,997 252 $100M-500M 92.5 144,845 773 0County Bk CA 92.5 0.023 0.06 34,701 920 $1B-$10B 75.0 272,940 1,655 0.001American River Bk CA 92.5 0.027 0.075 16,551 581 $500M-$1B 75.0 130,515 991 0Butte Cmnty Bk CA 92.5 0.026 0.101 12,273 419 $100M-500M 75.0 87,112 701 0.001Center Bk CA 92.5 0.031 0.046 46,232 1,537 $1B-$10B 72.5 321,534 3,217 0.001Bank of The Sierra CA 92.5 0.022 0.064 21,851 770 $1B-$10B 70.0 165,850 1,431 0.01Mid-State B&TC CA 92.5 0.019 0.062 43,969 2,265 $1B-$10B 65.0 245,916 3,083 0Exchange Bk CA 92.5 0.02 0.065 26,810 1,115 $1B-$10B 62.5 160,882 1,557 0
0.0Pine River Valley Bk CO 97.5 0.204 1 22,034 307 $100M-500M 77.5 22,034 307 0Colonial Bk CO 97.5 0.126 1 23,699 260 $100M-500M 72.5 23,699 260 0.002Fowler St Bk CO 95.0 0.219 1 10,786 202 <$100M 67.5 10,786 202 0Montrosebank CO 92.5 0.071 0.191 9,170 545 $100M-500M 90.0 44,254 881 0Dolores St Bk CO 92.5 0.117 1 10,097 222 <$100M 57.5 10,097 222 0Farmers St Bk of Calhan CO 90.0 0.061 0.3 7,675 345 $100M-500M 77.5 24,744 427 0.006First NB of Lake City & Cree CO 90.0 0.288 1 10,522 160 <$100M 70.0 10,522 160 0Valley St Bk CO 90.0 0.064 0.32 6,428 309 $100M-500M 65.0 16,950 361 0.003Colorado East B&TC CO 87.5 0.039 0.17 11,152 535 $100M-500M 70.0 43,383 699 0First NB of Las Animas CO 87.5 0.063 0.199 9,372 331 $100M-500M 70.0 31,134 430 0Kit Carson St Bk CO 87.5 0.075 0.356 3,744 177 <$100M 62.5 10,428 210 0Union Colony Bk CO 87.5 0.035 0.18 15,721 470 $100M-500M 57.5 42,702 622 0.075First NB of Stratton CO 87.5 0.124 1 5,205 166 <$100M 52.5 5,205 166 0
Webster Bk NA CT 90.0 0.025 0.112 426,426 23,637 $50B-$10B 62.5 1,589,675 29,708 0Valley Bk CT 85.0 0.062 0.173 8,472 192 $100M-500M 82.5 49,050 349 0Naugatuck Svg Bk CT 85.0 0.022 0.096 14,497 537 $500M-$1B 80.0 110,924 940 0Salisbury B&TC CT 82.5 0.019 0.148 7,596 327 $100M-500M 75.0 51,356 514 0.005Milford Bk CT 82.5 0.024 0.164 7,683 252 $100M-500M 72.5 41,887 427 0Cornerstone Bk CT 80.0 0.032 0.107 7,473 378 $100M-500M 72.5 51,437 818 0
National Capital Bk of WA DC 77.5 0.009 0.032 1,885 74 $100M-500M 82.5 58,045 194 0.003
Mbna America DE NA DE 97.5 0.329 0.586 1,805,312 924,122 $1B-$10B 97.5 2,968,328 928,489 0Chase Bk USA NA DE 95.0 0.02 0.658 1,727,259 1,517,802 >$50B 85.0 2,625,208 1,549,802 0.46Bank of Delmarva DE 87.5 0.045 0.127 13,032 447 $100M-500M 70.0 48,976 628 0.001
Highlands Indep Bk FL 100.0 0.051 0.201 12,736 619 $100M-500M 87.5 62,801 839 0R-G Crown Bank FL 100.0 0.1 1 300,904 3,620 $1B-$10B 82.5 300,904 3,620 0Bank of Tampa FL 97.5 0.052 0.125 39,303 1,100 $500M-$1B 82.5 204,076 1,793 0.004
Page 46
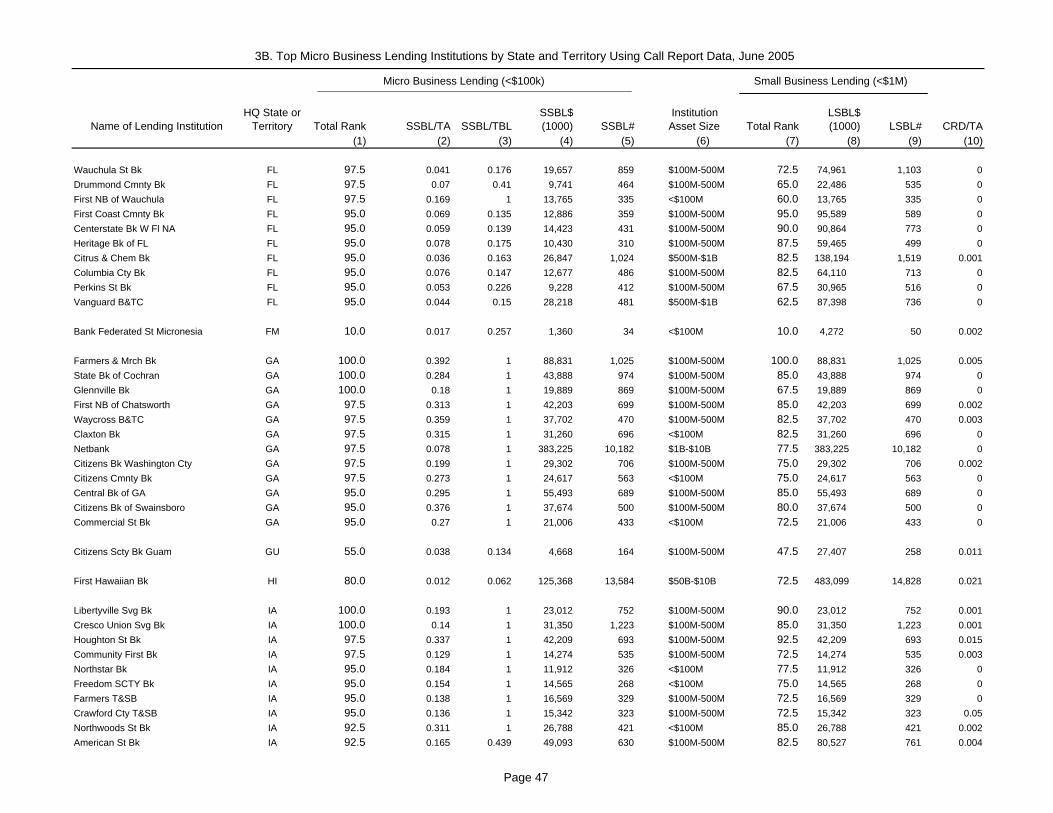
3B. Top Micro Business Lending Institutions by State and Territory Using Call Report Data, June 2005
Name of Lending InstitutionHQ State or
Territory Total Rank SSBL/TA SSBL/TBLSSBL$ (1000) SSBL#
Institution Asset Size Total Rank
LSBL$ (1000) LSBL# CRD/TA
(1) (2) (3) (4) (5) (6) (7) (8) (9) (10)
Micro Business Lending (<$100k) Small Business Lending (<$1M)
Wauchula St Bk FL 97.5 0.041 0.176 19,657 859 $100M-500M 72.5 74,961 1,103 0Drummond Cmnty Bk FL 97.5 0.07 0.41 9,741 464 $100M-500M 65.0 22,486 535 0First NB of Wauchula FL 97.5 0.169 1 13,765 335 <$100M 60.0 13,765 335 0First Coast Cmnty Bk FL 95.0 0.069 0.135 12,886 359 $100M-500M 95.0 95,589 589 0Centerstate Bk W Fl NA FL 95.0 0.059 0.139 14,423 431 $100M-500M 90.0 90,864 773 0Heritage Bk of FL FL 95.0 0.078 0.175 10,430 310 $100M-500M 87.5 59,465 499 0Citrus & Chem Bk FL 95.0 0.036 0.163 26,847 1,024 $500M-$1B 82.5 138,194 1,519 0.001Columbia Cty Bk FL 95.0 0.076 0.147 12,677 486 $100M-500M 82.5 64,110 713 0Perkins St Bk FL 95.0 0.053 0.226 9,228 412 $100M-500M 67.5 30,965 516 0Vanguard B&TC FL 95.0 0.044 0.15 28,218 481 $500M-$1B 62.5 87,398 736 0
Bank Federated St Micronesia FM 10.0 0.017 0.257 1,360 34 <$100M 10.0 4,272 50 0.002
Farmers & Mrch Bk GA 100.0 0.392 1 88,831 1,025 $100M-500M 100.0 88,831 1,025 0.005State Bk of Cochran GA 100.0 0.284 1 43,888 974 $100M-500M 85.0 43,888 974 0Glennville Bk GA 100.0 0.18 1 19,889 869 $100M-500M 67.5 19,889 869 0First NB of Chatsworth GA 97.5 0.313 1 42,203 699 $100M-500M 85.0 42,203 699 0.002Waycross B&TC GA 97.5 0.359 1 37,702 470 $100M-500M 82.5 37,702 470 0.003Claxton Bk GA 97.5 0.315 1 31,260 696 <$100M 82.5 31,260 696 0Netbank GA 97.5 0.078 1 383,225 10,182 $1B-$10B 77.5 383,225 10,182 0Citizens Bk Washington Cty GA 97.5 0.199 1 29,302 706 $100M-500M 75.0 29,302 706 0.002Citizens Cmnty Bk GA 97.5 0.273 1 24,617 563 <$100M 75.0 24,617 563 0Central Bk of GA GA 95.0 0.295 1 55,493 689 $100M-500M 85.0 55,493 689 0Citizens Bk of Swainsboro GA 95.0 0.376 1 37,674 500 $100M-500M 80.0 37,674 500 0Commercial St Bk GA 95.0 0.27 1 21,006 433 <$100M 72.5 21,006 433 0
Citizens Scty Bk Guam GU 55.0 0.038 0.134 4,668 164 $100M-500M 47.5 27,407 258 0.011
First Hawaiian Bk HI 80.0 0.012 0.062 125,368 13,584 $50B-$10B 72.5 483,099 14,828 0.021
Libertyville Svg Bk IA 100.0 0.193 1 23,012 752 $100M-500M 90.0 23,012 752 0.001Cresco Union Svg Bk IA 100.0 0.14 1 31,350 1,223 $100M-500M 85.0 31,350 1,223 0.001Houghton St Bk IA 97.5 0.337 1 42,209 693 $100M-500M 92.5 42,209 693 0.015Community First Bk IA 97.5 0.129 1 14,274 535 $100M-500M 72.5 14,274 535 0.003Northstar Bk IA 95.0 0.184 1 11,912 326 <$100M 77.5 11,912 326 0Freedom SCTY Bk IA 95.0 0.154 1 14,565 268 <$100M 75.0 14,565 268 0Farmers T&SB IA 95.0 0.138 1 16,569 329 $100M-500M 72.5 16,569 329 0Crawford Cty T&SB IA 95.0 0.136 1 15,342 323 $100M-500M 72.5 15,342 323 0.05Northwoods St Bk IA 92.5 0.311 1 26,788 421 <$100M 85.0 26,788 421 0.002American St Bk IA 92.5 0.165 0.439 49,093 630 $100M-500M 82.5 80,527 761 0.004
Page 47
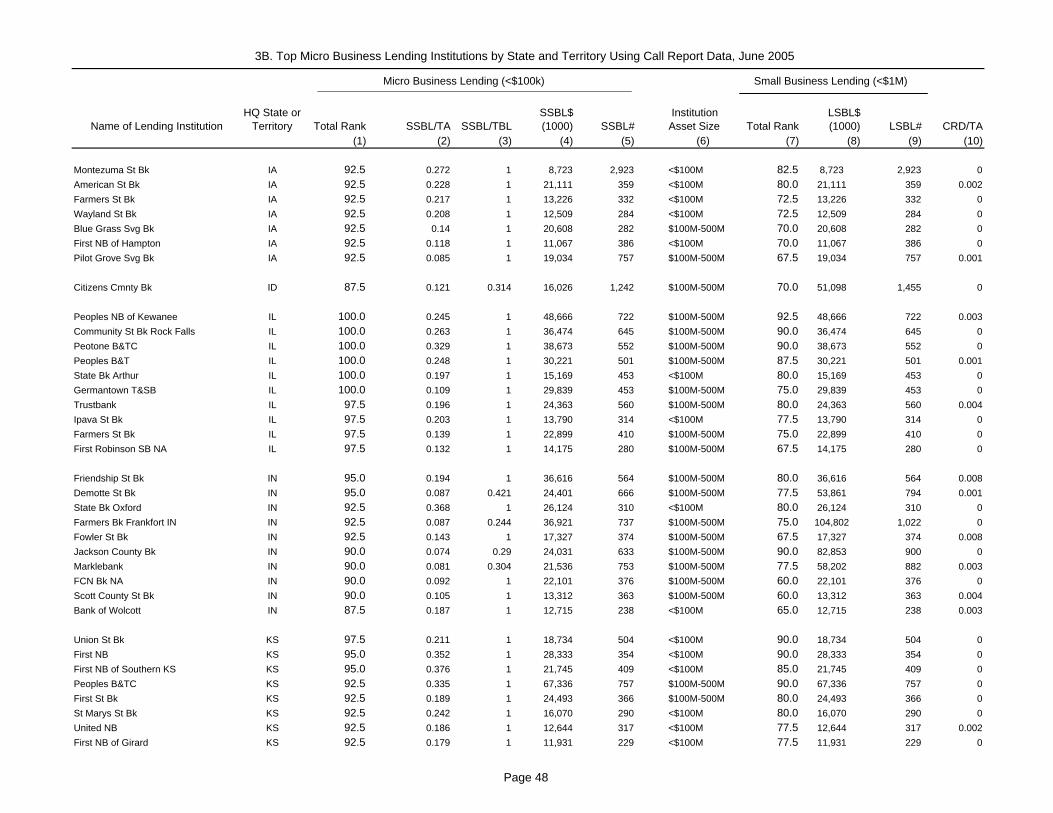
3B. Top Micro Business Lending Institutions by State and Territory Using Call Report Data, June 2005
Name of Lending InstitutionHQ State or
Territory Total Rank SSBL/TA SSBL/TBLSSBL$ (1000) SSBL#
Institution Asset Size Total Rank
LSBL$ (1000) LSBL# CRD/TA
(1) (2) (3) (4) (5) (6) (7) (8) (9) (10)
Micro Business Lending (<$100k) Small Business Lending (<$1M)
Montezuma St Bk IA 92.5 0.272 1 8,723 2,923 <$100M 82.5 8,723 2,923 0American St Bk IA 92.5 0.228 1 21,111 359 <$100M 80.0 21,111 359 0.002Farmers St Bk IA 92.5 0.217 1 13,226 332 <$100M 72.5 13,226 332 0Wayland St Bk IA 92.5 0.208 1 12,509 284 <$100M 72.5 12,509 284 0Blue Grass Svg Bk IA 92.5 0.14 1 20,608 282 $100M-500M 70.0 20,608 282 0First NB of Hampton IA 92.5 0.118 1 11,067 386 <$100M 70.0 11,067 386 0Pilot Grove Svg Bk IA 92.5 0.085 1 19,034 757 $100M-500M 67.5 19,034 757 0.001
Citizens Cmnty Bk ID 87.5 0.121 0.314 16,026 1,242 $100M-500M 70.0 51,098 1,455 0
Peoples NB of Kewanee IL 100.0 0.245 1 48,666 722 $100M-500M 92.5 48,666 722 0.003Community St Bk Rock Falls IL 100.0 0.263 1 36,474 645 $100M-500M 90.0 36,474 645 0Peotone B&TC IL 100.0 0.329 1 38,673 552 $100M-500M 90.0 38,673 552 0Peoples B&T IL 100.0 0.248 1 30,221 501 $100M-500M 87.5 30,221 501 0.001State Bk Arthur IL 100.0 0.197 1 15,169 453 <$100M 80.0 15,169 453 0Germantown T&SB IL 100.0 0.109 1 29,839 453 $100M-500M 75.0 29,839 453 0Trustbank IL 97.5 0.196 1 24,363 560 $100M-500M 80.0 24,363 560 0.004Ipava St Bk IL 97.5 0.203 1 13,790 314 <$100M 77.5 13,790 314 0Farmers St Bk IL 97.5 0.139 1 22,899 410 $100M-500M 75.0 22,899 410 0First Robinson SB NA IL 97.5 0.132 1 14,175 280 $100M-500M 67.5 14,175 280 0
Friendship St Bk IN 95.0 0.194 1 36,616 564 $100M-500M 80.0 36,616 564 0.008Demotte St Bk IN 95.0 0.087 0.421 24,401 666 $100M-500M 77.5 53,861 794 0.001State Bk Oxford IN 92.5 0.368 1 26,124 310 <$100M 80.0 26,124 310 0Farmers Bk Frankfort IN IN 92.5 0.087 0.244 36,921 737 $100M-500M 75.0 104,802 1,022 0Fowler St Bk IN 92.5 0.143 1 17,327 374 $100M-500M 67.5 17,327 374 0.008Jackson County Bk IN 90.0 0.074 0.29 24,031 633 $100M-500M 90.0 82,853 900 0Marklebank IN 90.0 0.081 0.304 21,536 753 $100M-500M 77.5 58,202 882 0.003FCN Bk NA IN 90.0 0.092 1 22,101 376 $100M-500M 60.0 22,101 376 0Scott County St Bk IN 90.0 0.105 1 13,312 363 $100M-500M 60.0 13,312 363 0.004Bank of Wolcott IN 87.5 0.187 1 12,715 238 <$100M 65.0 12,715 238 0.003
Union St Bk KS 97.5 0.211 1 18,734 504 <$100M 90.0 18,734 504 0First NB KS 95.0 0.352 1 28,333 354 <$100M 90.0 28,333 354 0First NB of Southern KS KS 95.0 0.376 1 21,745 409 <$100M 85.0 21,745 409 0Peoples B&TC KS 92.5 0.335 1 67,336 757 $100M-500M 90.0 67,336 757 0First St Bk KS 92.5 0.189 1 24,493 366 $100M-500M 80.0 24,493 366 0St Marys St Bk KS 92.5 0.242 1 16,070 290 <$100M 80.0 16,070 290 0United NB KS 92.5 0.186 1 12,644 317 <$100M 77.5 12,644 317 0.002First NB of Girard KS 92.5 0.179 1 11,931 229 <$100M 77.5 11,931 229 0
Page 48
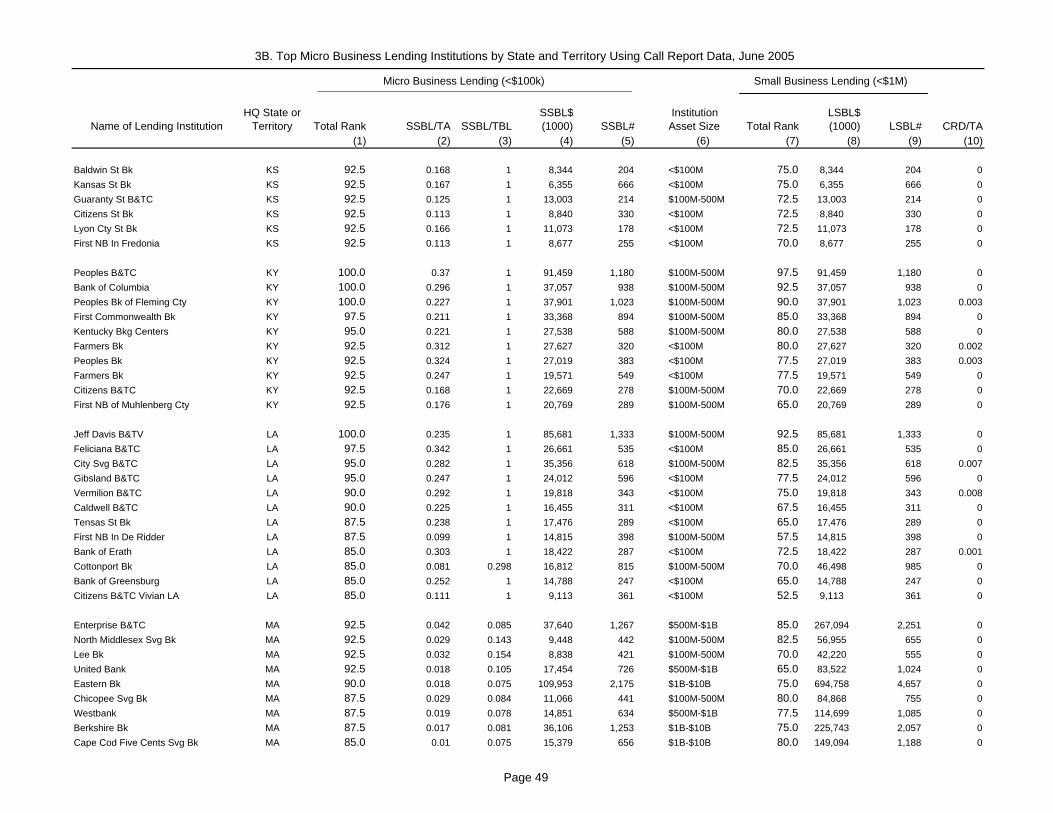
3B. Top Micro Business Lending Institutions by State and Territory Using Call Report Data, June 2005
Name of Lending InstitutionHQ State or
Territory Total Rank SSBL/TA SSBL/TBLSSBL$ (1000) SSBL#
Institution Asset Size Total Rank
LSBL$ (1000) LSBL# CRD/TA
(1) (2) (3) (4) (5) (6) (7) (8) (9) (10)
Micro Business Lending (<$100k) Small Business Lending (<$1M)
Baldwin St Bk KS 92.5 0.168 1 8,344 204 <$100M 75.0 8,344 204 0Kansas St Bk KS 92.5 0.167 1 6,355 666 <$100M 75.0 6,355 666 0Guaranty St B&TC KS 92.5 0.125 1 13,003 214 $100M-500M 72.5 13,003 214 0Citizens St Bk KS 92.5 0.113 1 8,840 330 <$100M 72.5 8,840 330 0Lyon Cty St Bk KS 92.5 0.166 1 11,073 178 <$100M 72.5 11,073 178 0First NB In Fredonia KS 92.5 0.113 1 8,677 255 <$100M 70.0 8,677 255 0
Peoples B&TC KY 100.0 0.37 1 91,459 1,180 $100M-500M 97.5 91,459 1,180 0Bank of Columbia KY 100.0 0.296 1 37,057 938 $100M-500M 92.5 37,057 938 0Peoples Bk of Fleming Cty KY 100.0 0.227 1 37,901 1,023 $100M-500M 90.0 37,901 1,023 0.003First Commonwealth Bk KY 97.5 0.211 1 33,368 894 $100M-500M 85.0 33,368 894 0Kentucky Bkg Centers KY 95.0 0.221 1 27,538 588 $100M-500M 80.0 27,538 588 0Farmers Bk KY 92.5 0.312 1 27,627 320 <$100M 80.0 27,627 320 0.002Peoples Bk KY 92.5 0.324 1 27,019 383 <$100M 77.5 27,019 383 0.003Farmers Bk KY 92.5 0.247 1 19,571 549 <$100M 77.5 19,571 549 0Citizens B&TC KY 92.5 0.168 1 22,669 278 $100M-500M 70.0 22,669 278 0First NB of Muhlenberg Cty KY 92.5 0.176 1 20,769 289 $100M-500M 65.0 20,769 289 0
Jeff Davis B&TV LA 100.0 0.235 1 85,681 1,333 $100M-500M 92.5 85,681 1,333 0Feliciana B&TC LA 97.5 0.342 1 26,661 535 <$100M 85.0 26,661 535 0City Svg B&TC LA 95.0 0.282 1 35,356 618 $100M-500M 82.5 35,356 618 0.007Gibsland B&TC LA 95.0 0.247 1 24,012 596 <$100M 77.5 24,012 596 0Vermilion B&TC LA 90.0 0.292 1 19,818 343 <$100M 75.0 19,818 343 0.008Caldwell B&TC LA 90.0 0.225 1 16,455 311 <$100M 67.5 16,455 311 0Tensas St Bk LA 87.5 0.238 1 17,476 289 <$100M 65.0 17,476 289 0First NB In De Ridder LA 87.5 0.099 1 14,815 398 $100M-500M 57.5 14,815 398 0Bank of Erath LA 85.0 0.303 1 18,422 287 <$100M 72.5 18,422 287 0.001Cottonport Bk LA 85.0 0.081 0.298 16,812 815 $100M-500M 70.0 46,498 985 0Bank of Greensburg LA 85.0 0.252 1 14,788 247 <$100M 65.0 14,788 247 0Citizens B&TC Vivian LA LA 85.0 0.111 1 9,113 361 <$100M 52.5 9,113 361 0
Enterprise B&TC MA 92.5 0.042 0.085 37,640 1,267 $500M-$1B 85.0 267,094 2,251 0North Middlesex Svg Bk MA 92.5 0.029 0.143 9,448 442 $100M-500M 82.5 56,955 655 0Lee Bk MA 92.5 0.032 0.154 8,838 421 $100M-500M 70.0 42,220 555 0United Bank MA 92.5 0.018 0.105 17,454 726 $500M-$1B 65.0 83,522 1,024 0Eastern Bk MA 90.0 0.018 0.075 109,953 2,175 $1B-$10B 75.0 694,758 4,657 0Chicopee Svg Bk MA 87.5 0.029 0.084 11,066 441 $100M-500M 80.0 84,868 755 0Westbank MA 87.5 0.019 0.078 14,851 634 $500M-$1B 77.5 114,699 1,085 0Berkshire Bk MA 87.5 0.017 0.081 36,106 1,253 $1B-$10B 75.0 225,743 2,057 0Cape Cod Five Cents Svg Bk MA 85.0 0.01 0.075 15,379 656 $1B-$10B 80.0 149,094 1,188 0
Page 49
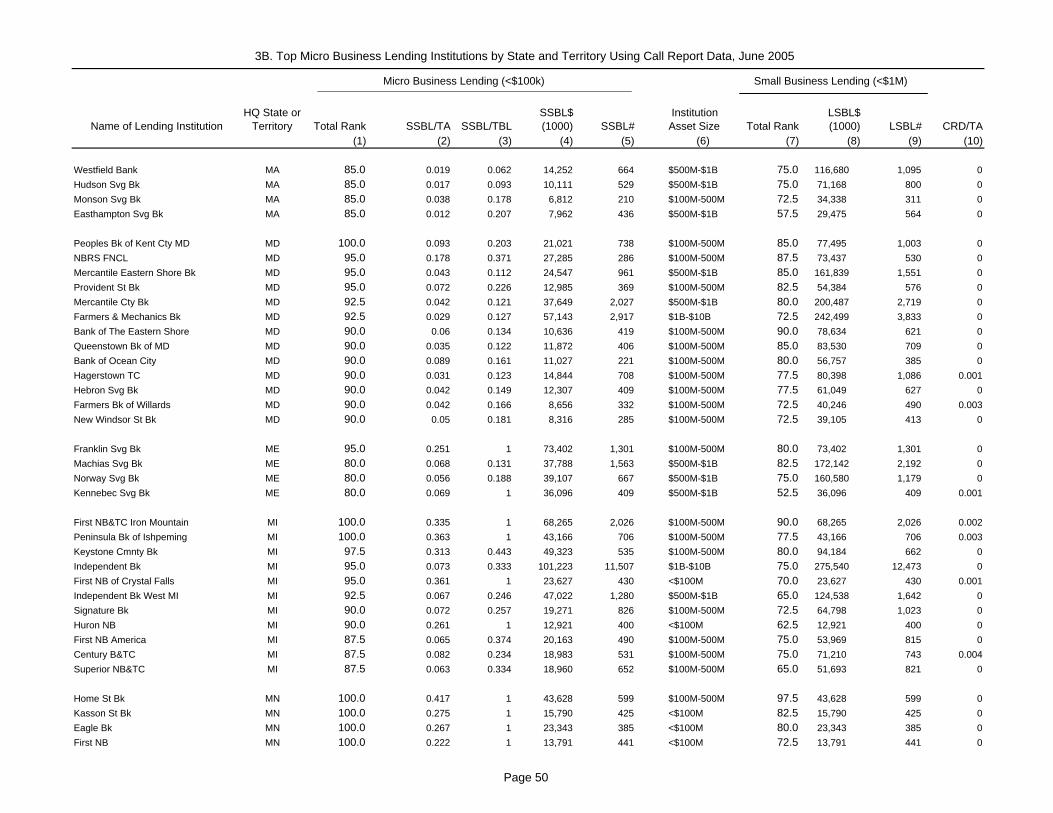
3B. Top Micro Business Lending Institutions by State and Territory Using Call Report Data, June 2005
Name of Lending InstitutionHQ State or
Territory Total Rank SSBL/TA SSBL/TBLSSBL$ (1000) SSBL#
Institution Asset Size Total Rank
LSBL$ (1000) LSBL# CRD/TA
(1) (2) (3) (4) (5) (6) (7) (8) (9) (10)
Micro Business Lending (<$100k) Small Business Lending (<$1M)
Westfield Bank MA 85.0 0.019 0.062 14,252 664 $500M-$1B 75.0 116,680 1,095 0Hudson Svg Bk MA 85.0 0.017 0.093 10,111 529 $500M-$1B 75.0 71,168 800 0Monson Svg Bk MA 85.0 0.038 0.178 6,812 210 $100M-500M 72.5 34,338 311 0Easthampton Svg Bk MA 85.0 0.012 0.207 7,962 436 $500M-$1B 57.5 29,475 564 0
Peoples Bk of Kent Cty MD MD 100.0 0.093 0.203 21,021 738 $100M-500M 85.0 77,495 1,003 0NBRS FNCL MD 95.0 0.178 0.371 27,285 286 $100M-500M 87.5 73,437 530 0Mercantile Eastern Shore Bk MD 95.0 0.043 0.112 24,547 961 $500M-$1B 85.0 161,839 1,551 0Provident St Bk MD 95.0 0.072 0.226 12,985 369 $100M-500M 82.5 54,384 576 0Mercantile Cty Bk MD 92.5 0.042 0.121 37,649 2,027 $500M-$1B 80.0 200,487 2,719 0Farmers & Mechanics Bk MD 92.5 0.029 0.127 57,143 2,917 $1B-$10B 72.5 242,499 3,833 0Bank of The Eastern Shore MD 90.0 0.06 0.134 10,636 419 $100M-500M 90.0 78,634 621 0Queenstown Bk of MD MD 90.0 0.035 0.122 11,872 406 $100M-500M 85.0 83,530 709 0Bank of Ocean City MD 90.0 0.089 0.161 11,027 221 $100M-500M 80.0 56,757 385 0Hagerstown TC MD 90.0 0.031 0.123 14,844 708 $100M-500M 77.5 80,398 1,086 0.001Hebron Svg Bk MD 90.0 0.042 0.149 12,307 409 $100M-500M 77.5 61,049 627 0Farmers Bk of Willards MD 90.0 0.042 0.166 8,656 332 $100M-500M 72.5 40,246 490 0.003New Windsor St Bk MD 90.0 0.05 0.181 8,316 285 $100M-500M 72.5 39,105 413 0
Franklin Svg Bk ME 95.0 0.251 1 73,402 1,301 $100M-500M 80.0 73,402 1,301 0Machias Svg Bk ME 80.0 0.068 0.131 37,788 1,563 $500M-$1B 82.5 172,142 2,192 0Norway Svg Bk ME 80.0 0.056 0.188 39,107 667 $500M-$1B 75.0 160,580 1,179 0Kennebec Svg Bk ME 80.0 0.069 1 36,096 409 $500M-$1B 52.5 36,096 409 0.001
First NB&TC Iron Mountain MI 100.0 0.335 1 68,265 2,026 $100M-500M 90.0 68,265 2,026 0.002Peninsula Bk of Ishpeming MI 100.0 0.363 1 43,166 706 $100M-500M 77.5 43,166 706 0.003Keystone Cmnty Bk MI 97.5 0.313 0.443 49,323 535 $100M-500M 80.0 94,184 662 0Independent Bk MI 95.0 0.073 0.333 101,223 11,507 $1B-$10B 75.0 275,540 12,473 0First NB of Crystal Falls MI 95.0 0.361 1 23,627 430 <$100M 70.0 23,627 430 0.001Independent Bk West MI MI 92.5 0.067 0.246 47,022 1,280 $500M-$1B 65.0 124,538 1,642 0Signature Bk MI 90.0 0.072 0.257 19,271 826 $100M-500M 72.5 64,798 1,023 0Huron NB MI 90.0 0.261 1 12,921 400 <$100M 62.5 12,921 400 0First NB America MI 87.5 0.065 0.374 20,163 490 $100M-500M 75.0 53,969 815 0Century B&TC MI 87.5 0.082 0.234 18,983 531 $100M-500M 75.0 71,210 743 0.004Superior NB&TC MI 87.5 0.063 0.334 18,960 652 $100M-500M 65.0 51,693 821 0
Home St Bk MN 100.0 0.417 1 43,628 599 $100M-500M 97.5 43,628 599 0Kasson St Bk MN 100.0 0.275 1 15,790 425 <$100M 82.5 15,790 425 0Eagle Bk MN 100.0 0.267 1 23,343 385 <$100M 80.0 23,343 385 0First NB MN 100.0 0.222 1 13,791 441 <$100M 72.5 13,791 441 0
Page 50

3B. Top Micro Business Lending Institutions by State and Territory Using Call Report Data, June 2005
Name of Lending InstitutionHQ State or
Territory Total Rank SSBL/TA SSBL/TBLSSBL$ (1000) SSBL#
Institution Asset Size Total Rank
LSBL$ (1000) LSBL# CRD/TA
(1) (2) (3) (4) (5) (6) (7) (8) (9) (10)
Micro Business Lending (<$100k) Small Business Lending (<$1M)
1st American St Bk of MN MN 97.5 0.555 1 12,553 305 <$100M 82.5 12,553 305 0Prinsburg St Bk MN 97.5 0.388 1 15,061 274 <$100M 77.5 15,061 274 0Pine River St Bk MN 97.5 0.258 1 19,549 354 <$100M 75.0 19,549 354 0State Bk of Mcgregor MN 97.5 0.311 1 14,367 275 <$100M 75.0 14,367 275 0.004Farmers & Merchants St Bk MN 97.5 0.25 1 13,488 377 <$100M 70.0 13,488 377 0First St Bk of Le Center MN 97.5 0.204 1 12,920 280 <$100M 67.5 12,920 280 0
Community St Bk of Missouri MO 100.0 0.189 1 31,278 716 $100M-500M 82.5 31,278 716 0Century Bk of The Ozarks MO 100.0 0.178 1 26,522 637 $100M-500M 77.5 26,522 637 0O Bannon Bkg Co MO 97.5 0.257 1 33,387 567 $100M-500M 85.0 33,387 567 0Perry St Bk MO 97.5 0.223 1 31,098 747 $100M-500M 80.0 31,098 747 0First NB MO 97.5 0.203 1 23,873 523 $100M-500M 80.0 23,873 523 0Peoples Community Bk MO 97.5 0.27 1 18,563 438 <$100M 80.0 18,563 438 0.001Security Bk of SW MO MO 95.0 0.294 1 17,949 438 <$100M 80.0 17,949 438 0Mid America Bk MO 95.0 0.241 1 23,654 341 <$100M 77.5 23,654 341 0Southern Missouri Bk MO 95.0 0.248 1 21,277 357 <$100M 77.5 21,277 357 0Freedom Bk MO 95.0 0.231 1 14,344 431 <$100M 77.5 14,344 431 0Union Svg Bk MO 95.0 0.238 1 24,360 424 $100M-500M 75.0 24,360 424 0Farmers & Cmrl Bk MO 95.0 0.21 1 19,359 1,030 <$100M 75.0 19,359 1,030 0Town & Country Bk MO 95.0 0.107 1 41,911 960 $100M-500M 72.5 41,911 960 0Saint Clair Cty St Bk MO 95.0 0.202 1 19,101 407 <$100M 72.5 19,101 407 0
First St Bk MS 97.5 0.344 1 104,343 1,271 $100M-500M 92.5 104,343 1,271 0.001First NB of Pontotoc MS 95.0 0.252 1 51,668 1,408 $100M-500M 85.0 51,668 1,408 0Pike Cty NB MS 92.5 0.34 1 48,022 888 $100M-500M 87.5 48,022 888 0Bank of Holly Springs MS 92.5 0.301 1 41,577 1,132 $100M-500M 87.5 41,577 1,132 0Merchants & Marine Bk MS 92.5 0.244 1 88,875 1,325 $100M-500M 82.5 88,875 1,325 0Farmers & Merchants Bk MS 90.0 0.329 1 47,232 1,024 $100M-500M 82.5 47,232 1,024 0.007Mechanics Bk MS 90.0 0.255 1 37,635 752 $100M-500M 77.5 37,635 752 0.002Century Bk MS 82.5 0.235 1 43,313 904 $100M-500M 72.5 43,313 904 0.003Bank of Wiggins MS 82.5 0.189 1 27,309 649 $100M-500M 65.0 27,309 649 0Renasant Bk MS 80.0 0.07 0.227 164,424 4,320 $1B-$10B 95.0 723,460 5,980 0Bank of Kilmichael MS 80.0 0.3 1 18,459 236 <$100M 67.5 18,459 236 0Merchants & Farmers Bk MS 80.0 0.161 1 9,937 811 <$100M 62.5 9,937 811 0
First Citizens Bk of Butte MT 95.0 0.606 1 36,317 412 <$100M 85.0 36,317 412 0.001First Citizens Bk of Billings MT 87.5 0.153 0.355 26,234 630 $100M-500M 75.0 55,220 786 0Lake County Bk MT 87.5 0.183 1 5,260 1,055 <$100M 67.5 5,260 1,055 0United Bk NA MT 87.5 0.239 1 12,777 253 <$100M 57.5 12,777 253 0Bank of Baker MT 85.0 0.222 1 12,418 334 <$100M 57.5 12,418 334 0
Page 51
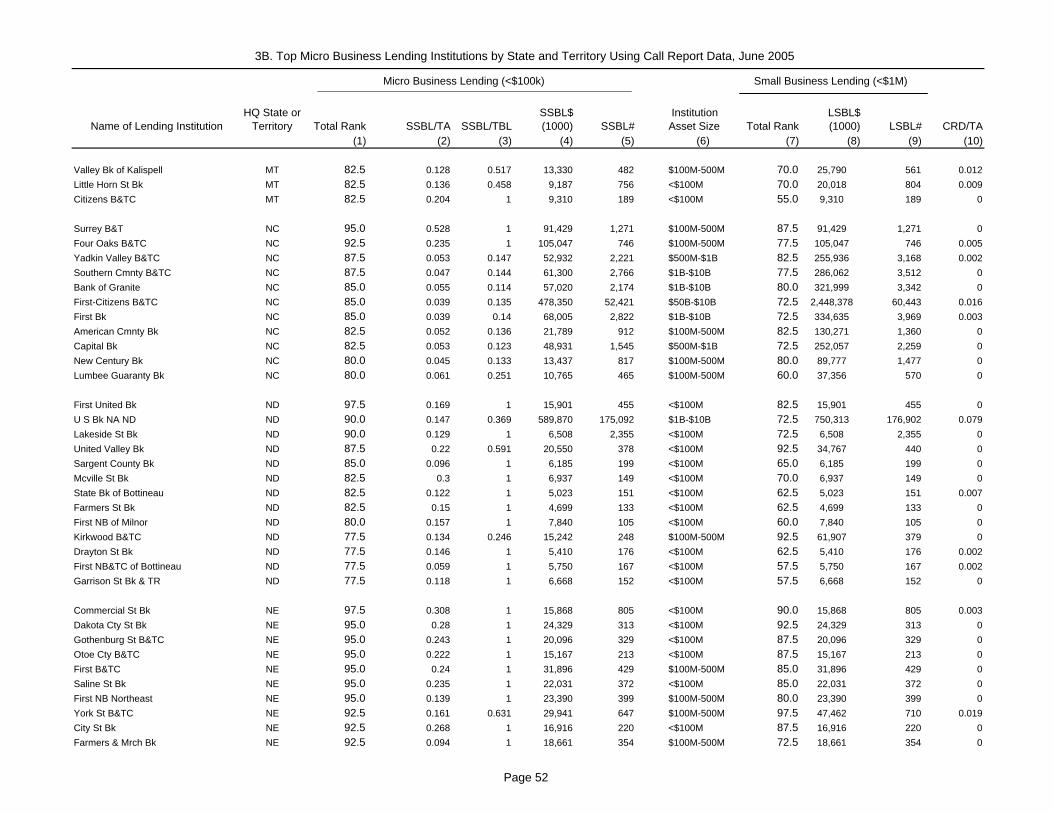
3B. Top Micro Business Lending Institutions by State and Territory Using Call Report Data, June 2005
Name of Lending InstitutionHQ State or
Territory Total Rank SSBL/TA SSBL/TBLSSBL$ (1000) SSBL#
Institution Asset Size Total Rank
LSBL$ (1000) LSBL# CRD/TA
(1) (2) (3) (4) (5) (6) (7) (8) (9) (10)
Micro Business Lending (<$100k) Small Business Lending (<$1M)
Valley Bk of Kalispell MT 82.5 0.128 0.517 13,330 482 $100M-500M 70.0 25,790 561 0.012Little Horn St Bk MT 82.5 0.136 0.458 9,187 756 <$100M 70.0 20,018 804 0.009Citizens B&TC MT 82.5 0.204 1 9,310 189 <$100M 55.0 9,310 189 0
Surrey B&T NC 95.0 0.528 1 91,429 1,271 $100M-500M 87.5 91,429 1,271 0Four Oaks B&TC NC 92.5 0.235 1 105,047 746 $100M-500M 77.5 105,047 746 0.005Yadkin Valley B&TC NC 87.5 0.053 0.147 52,932 2,221 $500M-$1B 82.5 255,936 3,168 0.002Southern Cmnty B&TC NC 87.5 0.047 0.144 61,300 2,766 $1B-$10B 77.5 286,062 3,512 0Bank of Granite NC 85.0 0.055 0.114 57,020 2,174 $1B-$10B 80.0 321,999 3,342 0First-Citizens B&TC NC 85.0 0.039 0.135 478,350 52,421 $50B-$10B 72.5 2,448,378 60,443 0.016First Bk NC 85.0 0.039 0.14 68,005 2,822 $1B-$10B 72.5 334,635 3,969 0.003American Cmnty Bk NC 82.5 0.052 0.136 21,789 912 $100M-500M 82.5 130,271 1,360 0Capital Bk NC 82.5 0.053 0.123 48,931 1,545 $500M-$1B 72.5 252,057 2,259 0New Century Bk NC 80.0 0.045 0.133 13,437 817 $100M-500M 80.0 89,777 1,477 0Lumbee Guaranty Bk NC 80.0 0.061 0.251 10,765 465 $100M-500M 60.0 37,356 570 0
First United Bk ND 97.5 0.169 1 15,901 455 <$100M 82.5 15,901 455 0U S Bk NA ND ND 90.0 0.147 0.369 589,870 175,092 $1B-$10B 72.5 750,313 176,902 0.079Lakeside St Bk ND 90.0 0.129 1 6,508 2,355 <$100M 72.5 6,508 2,355 0United Valley Bk ND 87.5 0.22 0.591 20,550 378 <$100M 92.5 34,767 440 0Sargent County Bk ND 85.0 0.096 1 6,185 199 <$100M 65.0 6,185 199 0Mcville St Bk ND 82.5 0.3 1 6,937 149 <$100M 70.0 6,937 149 0State Bk of Bottineau ND 82.5 0.122 1 5,023 151 <$100M 62.5 5,023 151 0.007Farmers St Bk ND 82.5 0.15 1 4,699 133 <$100M 62.5 4,699 133 0First NB of Milnor ND 80.0 0.157 1 7,840 105 <$100M 60.0 7,840 105 0Kirkwood B&TC ND 77.5 0.134 0.246 15,242 248 $100M-500M 92.5 61,907 379 0Drayton St Bk ND 77.5 0.146 1 5,410 176 <$100M 62.5 5,410 176 0.002First NB&TC of Bottineau ND 77.5 0.059 1 5,750 167 <$100M 57.5 5,750 167 0.002Garrison St Bk & TR ND 77.5 0.118 1 6,668 152 <$100M 57.5 6,668 152 0
Commercial St Bk NE 97.5 0.308 1 15,868 805 <$100M 90.0 15,868 805 0.003Dakota Cty St Bk NE 95.0 0.28 1 24,329 313 <$100M 92.5 24,329 313 0Gothenburg St B&TC NE 95.0 0.243 1 20,096 329 <$100M 87.5 20,096 329 0Otoe Cty B&TC NE 95.0 0.222 1 15,167 213 <$100M 87.5 15,167 213 0First B&TC NE 95.0 0.24 1 31,896 429 $100M-500M 85.0 31,896 429 0Saline St Bk NE 95.0 0.235 1 22,031 372 <$100M 85.0 22,031 372 0First NB Northeast NE 95.0 0.139 1 23,390 399 $100M-500M 80.0 23,390 399 0York St B&TC NE 92.5 0.161 0.631 29,941 647 $100M-500M 97.5 47,462 710 0.019City St Bk NE 92.5 0.268 1 16,916 220 <$100M 87.5 16,916 220 0Farmers & Mrch Bk NE 92.5 0.094 1 18,661 354 $100M-500M 72.5 18,661 354 0
Page 52

3B. Top Micro Business Lending Institutions by State and Territory Using Call Report Data, June 2005
Name of Lending InstitutionHQ State or
Territory Total Rank SSBL/TA SSBL/TBLSSBL$ (1000) SSBL#
Institution Asset Size Total Rank
LSBL$ (1000) LSBL# CRD/TA
(1) (2) (3) (4) (5) (6) (7) (8) (9) (10)
Micro Business Lending (<$100k) Small Business Lending (<$1M)
First Colebrook Bk NH 85.0 0.079 0.183 12,405 442 $100M-500M 75.0 64,562 683 0Laconia Svg Bk NH 82.5 0.032 0.139 25,054 1,200 $500M-$1B 62.5 104,026 1,552 0Woodsville Guaranty Svg Bk NH 80.0 0.038 0.194 10,187 362 $100M-500M 60.0 43,639 514 0.001Lancaster NB NH 80.0 0.151 1 8,867 142 <$100M 45.0 8,867 142 0
Skylands Cmnty Bk NJ 95.0 0.034 0.077 15,931 733 $100M-500M 82.5 136,087 1,293 0.001Harvest Cmnty Bk NJ 95.0 0.071 0.174 9,423 247 $100M-500M 82.5 54,118 424 0Minotola NB NJ 92.5 0.033 0.06 20,056 616 $500M-$1B 77.5 168,657 1,163 0.001Cornerstone Bk NJ 92.5 0.045 0.135 6,529 275 $100M-500M 75.0 43,865 430 0Bank NJ 90.0 0.027 0.064 30,722 1,589 $1B-$10B 82.5 280,843 2,900 0.0011st Constitution Bk NJ 90.0 0.029 0.096 9,991 179 $100M-500M 80.0 84,805 556 0Lakeland Bk NJ 90.0 0.014 0.069 23,726 645 $1B-$10B 75.0 208,505 1,312 0Newfield NB NJ 90.0 0.027 0.095 11,880 377 $100M-500M 72.5 81,601 637 0.001Sussex Bk NJ 90.0 0.029 0.079 8,350 230 $100M-500M 72.5 67,248 437 01st Colonial NB NJ 90.0 0.039 0.157 6,159 203 $100M-500M 72.5 35,085 348 0
Portales NB NM 97.5 0.222 1 26,408 514 $100M-500M 72.5 26,408 514 0Western CMRC Bk NM 95.0 0.111 0.338 29,353 2,733 $100M-500M 72.5 60,228 2,927 0Pioneer Bank NM 92.5 0.069 1 34,284 425 $100M-500M 65.0 34,284 425 0Bank of Clovis NM 85.0 0.194 1 14,227 224 <$100M 57.5 14,227 224 0Ambank NM 85.0 0.174 1 14,971 234 <$100M 55.0 14,971 234 0First NB In Las Vegas NM 85.0 0.149 1 15,229 192 $100M-500M 47.5 15,229 192 0.005
0.0 0.0Citibank NV NA NV 100.0 0.093 1 1,626,158 1,360,402 $50B-$10B 85.0 1,626,158 1,360,402 0.512Farm Bureau Bank FSB NV 97.5 0.075 0.689 31,763 3,498 $100M-500M 70.0 36,482 3,548 0.218First NB of Ely NV 95.0 0.209 1 11,120 411 <$100M 70.0 11,120 411 0
National Bk of Geneva NY 95.0 0.047 0.216 30,804 1,377 $500M-$1B 85.0 119,875 1,945 0Solvay Bk NY 95.0 0.051 0.229 22,791 996 $100M-500M 80.0 90,952 1,389 0.004First NB of Scotia NY 95.0 0.065 0.315 17,608 848 $100M-500M 80.0 55,507 1,030 0.001Wyoming Cty Bk NY 92.5 0.043 0.17 32,029 1,314 $500M-$1B 82.5 144,406 1,957 0Bank of Castile NY 92.5 0.052 0.181 27,444 822 $500M-$1B 82.5 113,866 1,220 0Lyons NB NY 92.5 0.062 0.218 19,378 794 $100M-500M 82.5 82,248 1,088 0Canandaigua NB&TC NY 90.0 0.045 0.121 45,273 1,873 $1B-$10B 82.5 227,442 2,574 0Steuben TC NY 90.0 0.047 0.207 14,204 561 $100M-500M 72.5 54,696 714 0.005First NB of Groton NY 90.0 0.105 1 10,281 361 <$100M 62.5 10,281 361 0.003Adirondack TC NY 87.5 0.046 0.14 26,570 662 $500M-$1B 77.5 117,104 1,020 0.003NBT Bk NA NY 87.5 0.03 0.127 131,448 6,843 $1B-$10B 75.0 571,604 9,308 0Atlantic Bk of NY NY 87.5 0.034 0.124 101,513 19,653 $1B-$10B 72.5 308,204 20,199 0
Page 53

3B. Top Micro Business Lending Institutions by State and Territory Using Call Report Data, June 2005
Name of Lending InstitutionHQ State or
Territory Total Rank SSBL/TA SSBL/TBLSSBL$ (1000) SSBL#
Institution Asset Size Total Rank
LSBL$ (1000) LSBL# CRD/TA
(1) (2) (3) (4) (5) (6) (7) (8) (9) (10)
Micro Business Lending (<$100k) Small Business Lending (<$1M)
Sutton Bk OH 97.5 0.196 0.529 55,353 750 $100M-500M 82.5 94,264 986 0.002The Grange Bank OH 97.5 0.107 1 29,517 490 $100M-500M 75.0 29,517 490 0Savings Bk OH 95.0 0.112 1 23,406 241 $100M-500M 67.5 23,406 241 0.001Merchants NB OH 92.5 0.055 0.263 19,870 1,000 $100M-500M 82.5 69,389 1,224 0Hicksville Bk OH 92.5 0.101 0.353 15,202 450 $100M-500M 80.0 40,047 570 0First St Bk of Adams Cty OH 92.5 0.149 1 18,669 253 $100M-500M 67.5 18,669 253 0.002Vinton Cty NB OH 90.0 0.052 0.337 13,477 521 $100M-500M 82.5 39,935 613 0Miami Savings Bank OH 90.0 0.18 1 19,365 119 $100M-500M 72.5 19,365 119 0Farmers & Mrch St Bk OH 90.0 0.059 0.249 40,693 1,195 $500M-$1B 65.0 81,981 1,446 0.005First NB OH 90.0 0.072 0.426 11,440 430 $100M-500M 62.5 22,943 510 0.004
0.0 0.0First NB&TC OK 97.5 0.217 1 24,574 376 $100M-500M 85.0 24,574 376 0Pauls Valley NB OK 97.5 0.247 1 27,093 687 $100M-500M 85.0 27,093 687 0Firstbank OK 97.5 0.202 1 23,503 709 $100M-500M 77.5 23,503 709 0First NB&TC OK 95.0 0.259 1 65,364 866 $100M-500M 90.0 65,364 866 0First NB&TC OK 95.0 0.249 1 22,629 369 <$100M 82.5 22,629 369 0.008Eastman NB of Newkirk OK 95.0 0.261 1 18,653 278 <$100M 82.5 18,653 278 0.001Bank of Western OK OK 95.0 0.224 1 31,288 663 $100M-500M 80.0 31,288 663 0Welch St Bk OK 95.0 0.191 1 26,428 420 $100M-500M 80.0 26,428 420 0.001First St Bk OK 95.0 0.31 1 12,596 394 <$100M 80.0 12,596 394 0Chickasha B&TC OK 95.0 0.202 1 26,439 448 $100M-500M 77.5 26,439 448 0Stockmans Bank OK 95.0 0.189 1 18,766 412 <$100M 75.0 18,766 412 0
Columbia River Bk OR 87.5 0.043 0.117 33,400 1,047 $500M-$1B 67.5 180,016 1,570 0.007Community Bk OR 85.0 0.046 0.142 13,532 494 $100M-500M 67.5 72,574 759 0Premierwest Bk OR 82.5 0.039 0.082 34,169 901 $500M-$1B 65.0 223,792 1,658 0
County NB PA 95.0 0.098 0.242 72,539 1,516 $500M-$1B 80.0 180,556 2,050 0.004CSB Bk PA 95.0 0.141 0.317 28,839 623 $100M-500M 77.5 66,268 777 0Guard Security Bank PA 95.0 0.146 1 12,322 1,514 <$100M 75.0 12,322 1,514 0Community B&TC PA 92.5 0.068 0.185 35,920 1,710 $500M-$1B 77.5 120,226 2,263 0.002Mercer Cty St Bk PA 92.5 0.08 0.385 19,837 843 $100M-500M 77.5 50,737 1,000 0Peoples St Bk of Wyalusing PA 92.5 0.096 0.347 16,448 737 $100M-500M 75.0 43,056 873 0.002Elderton St Bk PA 90.0 0.114 0.352 15,208 1,208 $100M-500M 85.0 43,198 1,389 0First Citizens NB PA 90.0 0.056 0.285 28,363 877 $500M-$1B 80.0 88,596 1,184 0.003Eureka Bank PA 90.0 0.306 1 27,824 246 <$100M 77.5 27,824 246 0Bank of Canton PA 90.0 0.248 1 17,344 297 <$100M 70.0 17,344 297 0Hamlin B&TC PA 90.0 0.061 1 23,352 601 $100M-500M 62.5 23,352 601 0Community St Bk of Orbisonia PA 90.0 0.094 1 17,027 361 $100M-500M 57.5 17,027 361 0
Page 54

3B. Top Micro Business Lending Institutions by State and Territory Using Call Report Data, June 2005
Name of Lending InstitutionHQ State or
Territory Total Rank SSBL/TA SSBL/TBLSSBL$ (1000) SSBL#
Institution Asset Size Total Rank
LSBL$ (1000) LSBL# CRD/TA
(1) (2) (3) (4) (5) (6) (7) (8) (9) (10)
Micro Business Lending (<$100k) Small Business Lending (<$1M)
Banco Santander PR PR 77.5 0.015 0.069 128,304 4,701 $1B-$10B 80.0 825,241 7,051 0.020.0 0.0
Washington TC RI 72.5 0.013 0.062 29,977 1,000 $1B-$10B 67.5 250,586 1,905 0Bank Newport RI 72.5 0.012 0.104 11,884 362 $500M-$1B 65.0 91,908 632 0Citizens Bk RI RI 72.5 0.006 0.07 76,046 2,826 $50B-$10B 60.0 382,371 4,105 0.016
0.0 0.0Enterprise Bk of SC SC 95.0 0.149 0.565 47,721 1,243 $100M-500M 80.0 84,404 1,427 0.001Anderson Bros Bk SC 95.0 0.227 1 64,002 1,209 $100M-500M 75.0 64,002 1,209 0.003Sumter NB SC 92.5 0.283 0.564 39,079 806 $100M-500M 82.5 69,217 984 0Conway NB SC 92.5 0.111 0.403 80,062 2,676 $500M-$1B 77.5 165,968 3,043 0.003Community First Bk SC 90.0 0.119 0.546 35,875 754 $100M-500M 75.0 65,728 861 0.002Citizens Bk SC 90.0 0.116 0.423 27,215 1,453 $100M-500M 75.0 61,879 1,644 0Orangeburg NB SC 87.5 0.125 0.335 25,924 646 $100M-500M 72.5 65,193 831 0Exchange Bk of SC SC 87.5 0.163 1 18,543 432 $100M-500M 60.0 18,543 432 0Bank of Walterboro SC 85.0 0.16 0.383 21,657 613 $100M-500M 75.0 50,266 749 0Bank of Greelyville SC 85.0 0.289 1 13,366 360 <$100M 62.5 13,366 360 0
Peoples St Bk SD 92.5 0.363 1 19,335 206 <$100M 85.0 19,335 206 0.002Citibank USA NA SD 92.5 0.318 0.447 1,948,417 1,690,670 $1B-$10B 77.5 2,089,522 1,691,387 0.137First St Bk of Roscoe SD 90.0 0.221 1 13,010 513 <$100M 75.0 13,010 513 0First Fidelity Bk SD 90.0 0.105 1 21,470 544 $100M-500M 67.5 21,470 544 0First NB In Sioux Falls SD 87.5 0.11 0.372 89,439 1,054 $500M-$1B 82.5 184,902 1,419 0First NB SD SD 85.0 0.06 0.393 23,634 4,246 $100M-500M 72.5 52,019 4,466 0.086Farmers St Bk of Canton SD 85.0 0.174 1 6,736 224 <$100M 67.5 6,736 224 0Security St Bk SD 85.0 0.185 1 5,453 125 <$100M 67.5 5,453 125 0Peoples St Bk SD 82.5 0.194 1 6,711 130 <$100M 67.5 6,711 130 0
Hardin County Bk TN 100.0 0.166 1 36,200 4,011 $100M-500M 77.5 36,200 4,011 0First NB of Manchester TN 97.5 0.291 1 44,315 709 $100M-500M 87.5 44,315 709 0Traders NB TN 97.5 0.355 1 41,853 556 $100M-500M 87.5 41,853 556 0Citizens Bk TN 97.5 0.175 1 77,552 2,094 $100M-500M 82.5 77,552 2,094 0First NB of Lafollette TN 97.5 0.182 1 31,155 5,480 $100M-500M 77.5 31,155 5,480 0Tennessee CMRC Bk TN 95.0 0.271 0.373 84,844 2,233 $100M-500M 87.5 182,474 2,838 0.001Peoples Bk TN 95.0 0.304 1 32,726 507 $100M-500M 80.0 32,726 507 0Peoples NB of Lafollette TN 95.0 0.298 1 33,788 399 $100M-500M 77.5 33,788 399 0First T&SB TN 95.0 0.251 1 26,700 355 $100M-500M 77.5 26,700 355 0Peoples B&TC Pickett Cty TN 95.0 0.244 1 21,874 623 <$100M 77.5 21,874 623 0Macon B&TC TN 95.0 0.116 1 26,962 539 $100M-500M 67.5 26,962 539 0
Page 55

3B. Top Micro Business Lending Institutions by State and Territory Using Call Report Data, June 2005
Name of Lending InstitutionHQ State or
Territory Total Rank SSBL/TA SSBL/TBLSSBL$ (1000) SSBL#
Institution Asset Size Total Rank
LSBL$ (1000) LSBL# CRD/TA
(1) (2) (3) (4) (5) (6) (7) (8) (9) (10)
Micro Business Lending (<$100k) Small Business Lending (<$1M)
First NB TX 100.0 0.279 1 40,123 968 $100M-500M 90.0 40,123 968 0First St Bk TX 100.0 0.204 1 27,590 963 $100M-500M 85.0 27,590 963 0First NB TX 97.5 0.412 1 45,397 859 $100M-500M 90.0 45,397 859 0First St Bk TX 97.5 0.366 1 32,974 550 <$100M 90.0 32,974 550 0Peoples Bk TX 97.5 0.291 1 27,739 454 <$100M 85.0 27,739 454 0.001City NB TX 97.5 0.183 1 45,232 1,074 $100M-500M 82.5 45,232 1,074 0Countybk NA TX 97.5 0.237 1 25,881 430 $100M-500M 80.0 25,881 430 0First NB TX 95.0 0.39 1 83,458 2,717 $100M-500M 92.5 83,458 2,717 0First NB of Albany Breckenridge TX 95.0 0.228 1 54,143 1,166 $100M-500M 85.0 54,143 1,166 0First St Bk TX 95.0 0.202 1 50,913 1,792 $100M-500M 82.5 50,913 1,792 0Round Top St Bk TX 95.0 0.208 1 30,350 557 $100M-500M 82.5 30,350 557 0.002Texas NB TX 95.0 0.393 1 26,588 335 <$100M 82.5 26,588 335 0Star Bk of TX TX 95.0 0.337 1 20,908 296 <$100M 80.0 20,908 296 0
0.0 0.0American Express Bank FSB UT 97.5 0.485 1 6,630,445 1,627,649 $50B-$10B 97.5 6,630,445 1,627,649 0.302Associates Cap Bk UT 95.0 0.763 1 295,911 329,858 $100M-500M 92.5 295,911 329,858 0Advanta Bk Corp. UT 95.0 0.58 1 865,051 204,738 $1B-$10B 90.0 865,051 204,738 0Universal FC UT 95.0 0.971 0.999 595,980 366,386 $500M-$1B 90.0 596,533 366,391 0Pitney Bowes Bk UT 92.5 0.594 0.979 344,901 1,238,976 $500M-$1B 95.0 352,285 1,239,012 0Wright Express FS Corp. UT 92.5 0.714 0.761 421,446 114,151 $500M-$1B 85.0 550,600 114,596 0GE Cap FNCL UT 92.5 0.543 0.72 1,003,769 1,434,736 $1B-$10B 82.5 1,039,559 1,436,998 0.057
Capital One FSB VA 100.0 0.187 0.969 2,752,551 1,245,220 $50B-$10B 87.5 2,793,033 1,245,485 0.211Highlands Union Bk VA 97.5 0.079 0.322 45,963 1,062 $500M-$1B 82.5 113,693 1,335 0.002First NB of Altavista VA 97.5 0.147 0.47 32,335 664 $100M-500M 80.0 62,286 798 0First & Citizens Bk VA 97.5 0.284 1 26,860 628 <$100M 75.0 26,860 628 0.002Powell Valley NB VA 97.5 0.155 0.417 34,533 708 $100M-500M 72.5 55,884 832 0Bank of Northumberland VA 95.0 0.085 0.392 18,085 659 $100M-500M 75.0 44,823 772 0New Peoples Bk VA 92.5 0.064 0.185 30,646 1,144 $100M-500M 97.5 159,887 1,599 0Bank of The James VA 92.5 0.093 0.236 17,160 636 $100M-500M 82.5 62,106 877 0Peoples Cmnty Bk VA 92.5 0.285 1 30,134 394 $100M-500M 75.0 30,134 394 0Benchmark Cmnty Bk VA 92.5 0.071 0.261 20,925 882 $100M-500M 65.0 50,235 1,049 0
Bank of Saint Croix VI 40.0 0.013 0.064 1,071 38 <$100M 40.0 12,590 87 00.0 0.0
Peoples TC of St Albans VT 92.5 0.219 1 45,357 738 $100M-500M 62.5 45,357 738 0Wells River Svg Bk VT 80.0 0.149 1 16,875 513 $100M-500M 45.0 16,875 513 0
Bank of Whitman WA 95.0 0.072 0.208 28,367 324 $100M-500M 67.5 82,971 557 0.005Security St Bk WA 92.5 0.081 0.228 26,119 379 $100M-500M 52.5 52,452 506 0.008
Page 56
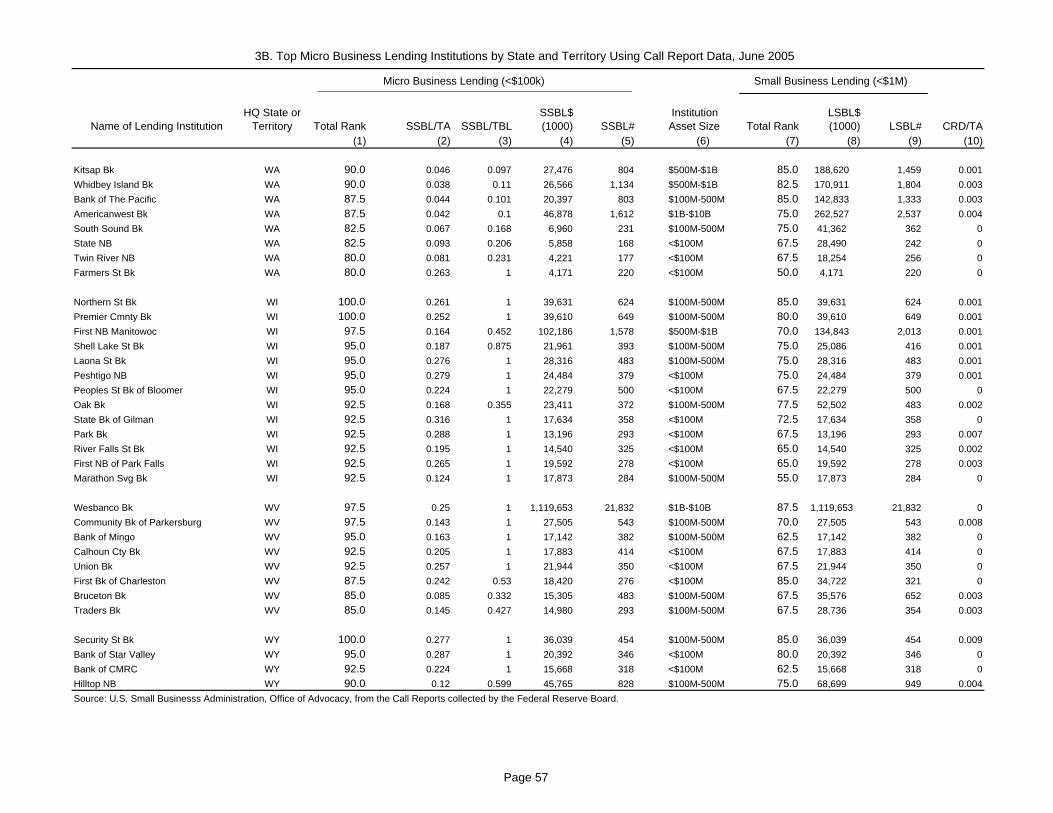
3B. Top Micro Business Lending Institutions by State and Territory Using Call Report Data, June 2005
Name of Lending InstitutionHQ State or
Territory Total Rank SSBL/TA SSBL/TBLSSBL$ (1000) SSBL#
Institution Asset Size Total Rank
LSBL$ (1000) LSBL# CRD/TA
(1) (2) (3) (4) (5) (6) (7) (8) (9) (10)
Micro Business Lending (<$100k) Small Business Lending (<$1M)
Kitsap Bk WA 90.0 0.046 0.097 27,476 804 $500M-$1B 85.0 188,620 1,459 0.001Whidbey Island Bk WA 90.0 0.038 0.11 26,566 1,134 $500M-$1B 82.5 170,911 1,804 0.003Bank of The Pacific WA 87.5 0.044 0.101 20,397 803 $100M-500M 85.0 142,833 1,333 0.003Americanwest Bk WA 87.5 0.042 0.1 46,878 1,612 $1B-$10B 75.0 262,527 2,537 0.004South Sound Bk WA 82.5 0.067 0.168 6,960 231 $100M-500M 75.0 41,362 362 0State NB WA 82.5 0.093 0.206 5,858 168 <$100M 67.5 28,490 242 0Twin River NB WA 80.0 0.081 0.231 4,221 177 <$100M 67.5 18,254 256 0Farmers St Bk WA 80.0 0.263 1 4,171 220 <$100M 50.0 4,171 220 0
Northern St Bk WI 100.0 0.261 1 39,631 624 $100M-500M 85.0 39,631 624 0.001Premier Cmnty Bk WI 100.0 0.252 1 39,610 649 $100M-500M 80.0 39,610 649 0.001First NB Manitowoc WI 97.5 0.164 0.452 102,186 1,578 $500M-$1B 70.0 134,843 2,013 0.001Shell Lake St Bk WI 95.0 0.187 0.875 21,961 393 $100M-500M 75.0 25,086 416 0.001Laona St Bk WI 95.0 0.276 1 28,316 483 $100M-500M 75.0 28,316 483 0.001Peshtigo NB WI 95.0 0.279 1 24,484 379 <$100M 75.0 24,484 379 0.001Peoples St Bk of Bloomer WI 95.0 0.224 1 22,279 500 <$100M 67.5 22,279 500 0Oak Bk WI 92.5 0.168 0.355 23,411 372 $100M-500M 77.5 52,502 483 0.002State Bk of Gilman WI 92.5 0.316 1 17,634 358 <$100M 72.5 17,634 358 0Park Bk WI 92.5 0.288 1 13,196 293 <$100M 67.5 13,196 293 0.007River Falls St Bk WI 92.5 0.195 1 14,540 325 <$100M 65.0 14,540 325 0.002First NB of Park Falls WI 92.5 0.265 1 19,592 278 <$100M 65.0 19,592 278 0.003Marathon Svg Bk WI 92.5 0.124 1 17,873 284 $100M-500M 55.0 17,873 284 0
Wesbanco Bk WV 97.5 0.25 1 1,119,653 21,832 $1B-$10B 87.5 1,119,653 21,832 0Community Bk of Parkersburg WV 97.5 0.143 1 27,505 543 $100M-500M 70.0 27,505 543 0.008Bank of Mingo WV 95.0 0.163 1 17,142 382 $100M-500M 62.5 17,142 382 0Calhoun Cty Bk WV 92.5 0.205 1 17,883 414 <$100M 67.5 17,883 414 0Union Bk WV 92.5 0.257 1 21,944 350 <$100M 67.5 21,944 350 0First Bk of Charleston WV 87.5 0.242 0.53 18,420 276 <$100M 85.0 34,722 321 0Bruceton Bk WV 85.0 0.085 0.332 15,305 483 $100M-500M 67.5 35,576 652 0.003Traders Bk WV 85.0 0.145 0.427 14,980 293 $100M-500M 67.5 28,736 354 0.003
Security St Bk WY 100.0 0.277 1 36,039 454 $100M-500M 85.0 36,039 454 0.009Bank of Star Valley WY 95.0 0.287 1 20,392 346 <$100M 80.0 20,392 346 0Bank of CMRC WY 92.5 0.224 1 15,668 318 <$100M 62.5 15,668 318 0Hilltop NB WY 90.0 0.12 0.599 45,765 828 $100M-500M 75.0 68,699 949 0.004Source: U.S. Small Businesss Administration, Office of Advocacy, from the Call Reports collected by the Federal Reserve Board.
Page 57

Table 4A. Top Small Business Lenders by State and Territory Using CRA Data, 2004
State or Territory Lending Institution
HQ Location LSBL$ (1,000) LSBL#
Institution Asset Size SSBL$ (1,000) SSBL# LSBL(2)$ (1,000) LSBL(2)#
(1) (2) (3) (4) (5) (6) (7)
Regions Financial Corporation AL 1,260,037 11,055 >$50B 263,469 8,047 996,568 3,008 Amsouth Bancorporation AL 854,889 13,317 >$50B 399,991 12,045 454,898 1,272 Wachovia Corporation NC 722,719 4,264 >$50B 107,409 2,493 615,310 1,771 Synovus Financial Corp. GA 649,024 5,156 $10B-$50B 127,199 3,486 521,825 1,670 Compass Bancshares, Inc. AL 495,530 3,914 $10B-$50B 104,617 2,800 390,913 1,114 Colonial Bancgroup, Inc. AL 326,250 3,100 $10B-$50B 79,586 2,282 246,664 818 Aliant Financial Corporation AL 210,973 1,435 <$1B 37,753 718 173,220 717 Alabama National Bancorp. AL 183,236 1,727 $1B-$10B 40,924 1,292 142,312 435 Whitney Holding Corporation LA 131,473 762 $1B-$10B 17,316 431 114,157 331 Banc Corporation AL 127,920 1,157 $1B-$10B 30,311 810 97,609 347 Metro Bank AL 103,818 1,395 <$1B 30,609 1,107 73,209 288 Community Bancshares, Inc. AL 71,258 973 <$1B 23,893 794 47,365 179 Bancorpsouth, Inc. MS 70,678 673 $10B-$50B 13,674 484 57,004 189 MBNA Corporation DE 69,463 13,413 >$50B 64,723 13,394 4,740 19 Citigroup, Inc. NY 59,421 11,844 >$50B 58,580 11,840 841 4 Auburn National Bancorporation AL 52,944 455 <$1B 11,480 333 41,464 122 Suntrust Banks, Inc. GA 52,106 477 >$50B 9,741 360 42,365 117 Wells Fargo & Company CA 51,352 1,825 >$50B 50,037 1,813 1,315 12
First National Bank Alaska AK 331,258 2,728 $1B-$10B 68,325 1,854 262,933 874 Wells Fargo & Company CA 222,544 4,115 >$50B 101,678 3,756 120,866 359 Northrim Bancorp, Inc. AK 133,027 842 <$1B 22,719 499 110,308 343 Keycorp OH 105,852 395 >$50B 7,996 159 97,856 236
Wells Fargo & Company CA 1,120,359 30,257 >$50B 650,113 28,887 470,246 1,370 Zions Bancorporation UT 414,116 2,187 $10B-$50B 46,302 1,221 367,814 966 Marshall & Ilsley Corporation WI 341,211 1,688 $10B-$50B 39,716 934 301,495 754 JPMorgan Chase & Co. NY 322,477 12,028 >$50B 169,694 11,600 152,783 428 Bank of America Corporation NC 306,490 10,613 >$50B 150,516 10,172 155,974 441 Capitol Bancorp Ltd. MI 259,533 1,210 $1B-$10B 29,708 582 229,825 628 Compass Bancshares, Inc. AL 238,085 1,850 $10B-$50B 53,398 1,383 184,687 467 Citigroup, Inc. NY 110,867 20,659 >$50B 108,987 20,650 1,880 9 MBNA Corporation DE 110,512 10,048 >$50B 59,047 9,890 51,465 158 Cobiz Inc. CO 94,096 371 $1B-$10B 8,841 142 85,255 229 Capital One FSB VA 84,299 28,886 $10B-$50B 84,174 28,885 125 1 First National Bank Holding AZ 83,208 286 $1B-$10B 5,602 93 77,606 193 Northern Trust Corporation IL 77,224 334 $10B-$50B 8,426 139 68,798 195 U.S. Bancorp MN 59,842 1,128 >$50B 12,420 1,007 47,422 121 Johnson Financial Group, Inc. WI 51,163 216 $1B-$10B 6,025 103 45,138 113
Regions Financial Corporation AL 604,810 6,806 >$50B 154,995 5,374 449,815 1,432 Arvest Bank Group, Inc. AR 540,144 5,499 $1B-$10B 120,427 4,151 419,717 1,348 Simmons First National Corp. AR 214,985 2,848 $1B-$10B 66,144 2,334 148,841 514 Bank of the Ozarks Inc. AR 147,667 2,224 $1B-$10B 50,238 1,879 97,429 345 First Security Bancorp AR 131,248 1,990 $1B-$10B 43,513 1,635 87,735 355 Liberty Bancshares, Inc. AR 131,167 1,423 $1B-$10B 38,380 1,124 92,787 299 First Bank Corp. AR 129,285 1,252 $1B-$10B 25,527 856 103,758 396 Bancorpsouth, Inc. MS 105,068 1,461 $10B-$50B 29,490 1,220 75,578 241
Alabama
Alaska
Arizona
Arkansas
Small Business Lending (<$1M) Micro Business Lending (<$100k) Small Business Lending ($100k-1M)
Page 58

Table 4A. Top Small Business Lenders by State and Territory Using CRA Data, 2004
State or Territory Lending Institution
HQ Location LSBL$ (1,000) LSBL#
Institution Asset Size SSBL$ (1,000) SSBL# LSBL(2)$ (1,000) LSBL(2)#
(1) (2) (3) (4) (5) (6) (7)
Small Business Lending (<$1M) Micro Business Lending (<$100k) Small Business Lending ($100k-1M)
U.S. Bancorp MN 94,269 1,390 >$50B 30,332 1,186 63,937 204 Bank of America Corporation NC 75,322 2,040 >$50B 25,675 1,926 49,647 114 ANB Bancshares, Inc. AR 65,443 546 <$1B 12,438 384 53,005 162 First Community Bancshares AR 59,299 780 <$1B 18,741 637 40,558 143 Summit Bancorp, Inc. AR 55,642 659 <$1B 15,740 538 39,902 121 Home Bancshares, Inc. AR 53,822 484 $1B-$10B 11,231 339 42,591 145 Pulaski Investment Corporation AR 53,389 419 <$1B 12,143 289 41,246 130
Wells Fargo & Company CA 7,842,481 238,892 >$50B 5,557,694 231,456 2,284,787 7,436 Bank of America Corporation NC 2,215,389 72,948 >$50B 1,043,830 70,223 1,171,559 2,725 Union Bank of California NA CA 1,848,834 29,953 >$50B 818,807 27,240 1,030,027 2,713 Citigroup, Inc. NY 1,060,039 186,654 >$50B 1,050,933 186,619 9,106 35 Bank of The West CA 957,899 6,692 >$50B 203,813 4,935 754,086 1,757 U.S. Bancorp MN 948,268 14,470 >$50B 171,476 12,621 776,792 1,849 Comerica, Inc. MI 842,106 2,313 >$50B 37,102 608 805,004 1,705 City National Corporation CA 833,101 3,184 $10B-$50B 73,622 1,393 759,479 1,791 MBNA Corporation DE 752,330 88,894 >$50B 547,423 88,205 204,907 689 Zions Bancorporation UT 748,046 3,900 $10B-$50B 110,521 2,303 637,525 1,597 Capital One FSB VA 725,974 231,864 $10B-$50B 722,249 231,838 3,725 26 Greater Bay Bancorp CA 637,319 1,918 $1B-$10B 34,760 545 602,559 1,373 JPMorgan Chase & Co. NY 492,962 42,576 >$50B 465,880 42,468 27,082 108 East West Bancorp, Inc. CA 411,526 868 $1B-$10B 4,983 73 406,543 795 Westamerica Bancorporation CA 407,806 2,098 $1B-$10B 66,245 1,094 341,561 1,004 Citibank (West) FSB NY 402,546 6,213 >$50B 171,873 5,528 230,673 685 Hanmi Financial Corporation CA 381,606 1,945 $1B-$10B 58,292 999 323,314 946 Mellon Financial Corporation PA 376,648 2,706 $10B-$50B 43,552 1,873 333,096 833 Eggemeyer Advisory Corp. CA 352,246 1,435 $1B-$10B 41,514 652 310,732 783 UCBH Holdings, Inc. CA 340,937 752 $1B-$10B 7,856 109 333,081 643 Advanta Bank Corporation UT 326,760 39,487 $1B-$10B 326,760 39,487 - - CVB Financial Corp. CA 302,096 1,359 $1B-$10B 35,865 666 266,231 693 American Express Centurion Bank UT 299,041 45,294 $10B-$50B 297,355 45,283 1,686 11 First Banks, Inc. MO 275,879 927 $1B-$10B 18,909 335 256,970 592 Pacific Capital Bancorp CA 260,393 1,821 $1B-$10B 50,041 1,262 210,352 559 Nara Bancorp, Inc. CA 236,405 899 $1B-$10B 19,903 298 216,502 601 Center Financial Corporation CA 228,476 1,065 $1B-$10B 32,435 512 196,041 553 Community Bank CA 226,132 797 $1B-$10B 15,745 288 210,387 509 Cathay General Bancorp CA 218,724 629 $1B-$10B 12,597 216 206,127 413 Sierra Bancorp CA 215,590 1,425 $1B-$10B 27,104 706 188,486 719 Umpqua Holdings Corporation OR 206,335 1,007 $1B-$10B 22,795 438 183,540 569 Farmers & Merchants Bank CA 198,306 904 $1B-$10B 21,641 460 176,665 444 Mid-State Bancshares CA 187,458 930 $1B-$10B 26,022 500 161,436 430 California Community Financial CA 184,235 731 $1B-$10B 17,425 295 166,810 436 Wilshire Bancorp, Inc. CA 183,488 757 $1B-$10B 20,910 334 162,578 423 The Pitney Bowes Bank UT 176,057 35,051 <$1B 175,651 35,049 406 2 Heritage Commerce Corp. CA 174,106 641 $1B-$10B 14,135 222 159,971 419 Trico Bancshares CA 171,096 1,335 $1B-$10B 37,026 936 134,070 399 Signature Bank NY 168,247 340 $1B-$10B 539 9 167,708 331 Central Coast Bancorp CA 162,360 711 $1B-$10B 18,348 353 144,012 358 1867 Western Financial Corp. CA 157,177 692 $1B-$10B 17,075 296 140,102 396
California
Page 59
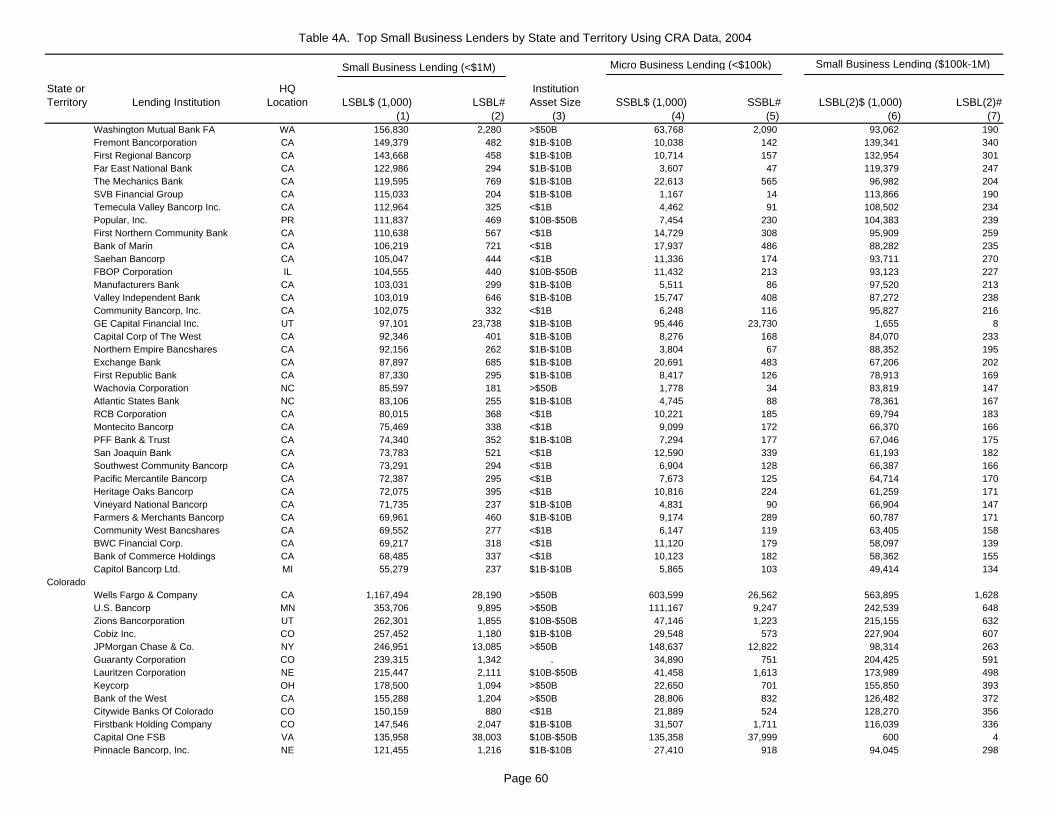
Table 4A. Top Small Business Lenders by State and Territory Using CRA Data, 2004
State or Territory Lending Institution
HQ Location LSBL$ (1,000) LSBL#
Institution Asset Size SSBL$ (1,000) SSBL# LSBL(2)$ (1,000) LSBL(2)#
(1) (2) (3) (4) (5) (6) (7)
Small Business Lending (<$1M) Micro Business Lending (<$100k) Small Business Lending ($100k-1M)
Washington Mutual Bank FA WA 156,830 2,280 >$50B 63,768 2,090 93,062 190 Fremont Bancorporation CA 149,379 482 $1B-$10B 10,038 142 139,341 340 First Regional Bancorp CA 143,668 458 $1B-$10B 10,714 157 132,954 301 Far East National Bank CA 122,986 294 $1B-$10B 3,607 47 119,379 247 The Mechanics Bank CA 119,595 769 $1B-$10B 22,613 565 96,982 204 SVB Financial Group CA 115,033 204 $1B-$10B 1,167 14 113,866 190 Temecula Valley Bancorp Inc. CA 112,964 325 <$1B 4,462 91 108,502 234 Popular, Inc. PR 111,837 469 $10B-$50B 7,454 230 104,383 239 First Northern Community Bank CA 110,638 567 <$1B 14,729 308 95,909 259 Bank of Marin CA 106,219 721 <$1B 17,937 486 88,282 235 Saehan Bancorp CA 105,047 444 <$1B 11,336 174 93,711 270 FBOP Corporation IL 104,555 440 $10B-$50B 11,432 213 93,123 227 Manufacturers Bank CA 103,031 299 $1B-$10B 5,511 86 97,520 213 Valley Independent Bank CA 103,019 646 $1B-$10B 15,747 408 87,272 238 Community Bancorp, Inc. CA 102,075 332 <$1B 6,248 116 95,827 216 GE Capital Financial Inc. UT 97,101 23,738 $1B-$10B 95,446 23,730 1,655 8 Capital Corp of The West CA 92,346 401 $1B-$10B 8,276 168 84,070 233 Northern Empire Bancshares CA 92,156 262 $1B-$10B 3,804 67 88,352 195 Exchange Bank CA 87,897 685 $1B-$10B 20,691 483 67,206 202 First Republic Bank CA 87,330 295 $1B-$10B 8,417 126 78,913 169 Wachovia Corporation NC 85,597 181 >$50B 1,778 34 83,819 147 Atlantic States Bank NC 83,106 255 $1B-$10B 4,745 88 78,361 167 RCB Corporation CA 80,015 368 <$1B 10,221 185 69,794 183 Montecito Bancorp CA 75,469 338 <$1B 9,099 172 66,370 166 PFF Bank & Trust CA 74,340 352 $1B-$10B 7,294 177 67,046 175 San Joaquin Bank CA 73,783 521 <$1B 12,590 339 61,193 182 Southwest Community Bancorp CA 73,291 294 <$1B 6,904 128 66,387 166 Pacific Mercantile Bancorp CA 72,387 295 <$1B 7,673 125 64,714 170 Heritage Oaks Bancorp CA 72,075 395 <$1B 10,816 224 61,259 171 Vineyard National Bancorp CA 71,735 237 $1B-$10B 4,831 90 66,904 147 Farmers & Merchants Bancorp CA 69,961 460 $1B-$10B 9,174 289 60,787 171 Community West Bancshares CA 69,552 277 <$1B 6,147 119 63,405 158 BWC Financial Corp. CA 69,217 318 <$1B 11,120 179 58,097 139 Bank of Commerce Holdings CA 68,485 337 <$1B 10,123 182 58,362 155 Capitol Bancorp Ltd. MI 55,279 237 $1B-$10B 5,865 103 49,414 134
ColoradoWells Fargo & Company CA 1,167,494 28,190 >$50B 603,599 26,562 563,895 1,628 U.S. Bancorp MN 353,706 9,895 >$50B 111,167 9,247 242,539 648 Zions Bancorporation UT 262,301 1,855 $10B-$50B 47,146 1,223 215,155 632 Cobiz Inc. CO 257,452 1,180 $1B-$10B 29,548 573 227,904 607 JPMorgan Chase & Co. NY 246,951 13,085 >$50B 148,637 12,822 98,314 263 Guaranty Corporation CO 239,315 1,342 . 34,890 751 204,425 591 Lauritzen Corporation NE 215,447 2,111 $10B-$50B 41,458 1,613 173,989 498 Keycorp OH 178,500 1,094 >$50B 22,650 701 155,850 393 Bank of the West CA 155,288 1,204 >$50B 28,806 832 126,482 372 Citywide Banks Of Colorado CO 150,159 880 <$1B 21,889 524 128,270 356 Firstbank Holding Company CO 147,546 2,047 $1B-$10B 31,507 1,711 116,039 336 Capital One FSB VA 135,958 38,003 $10B-$50B 135,358 37,999 600 4 Pinnacle Bancorp, Inc. NE 121,455 1,216 $1B-$10B 27,410 918 94,045 298
Page 60
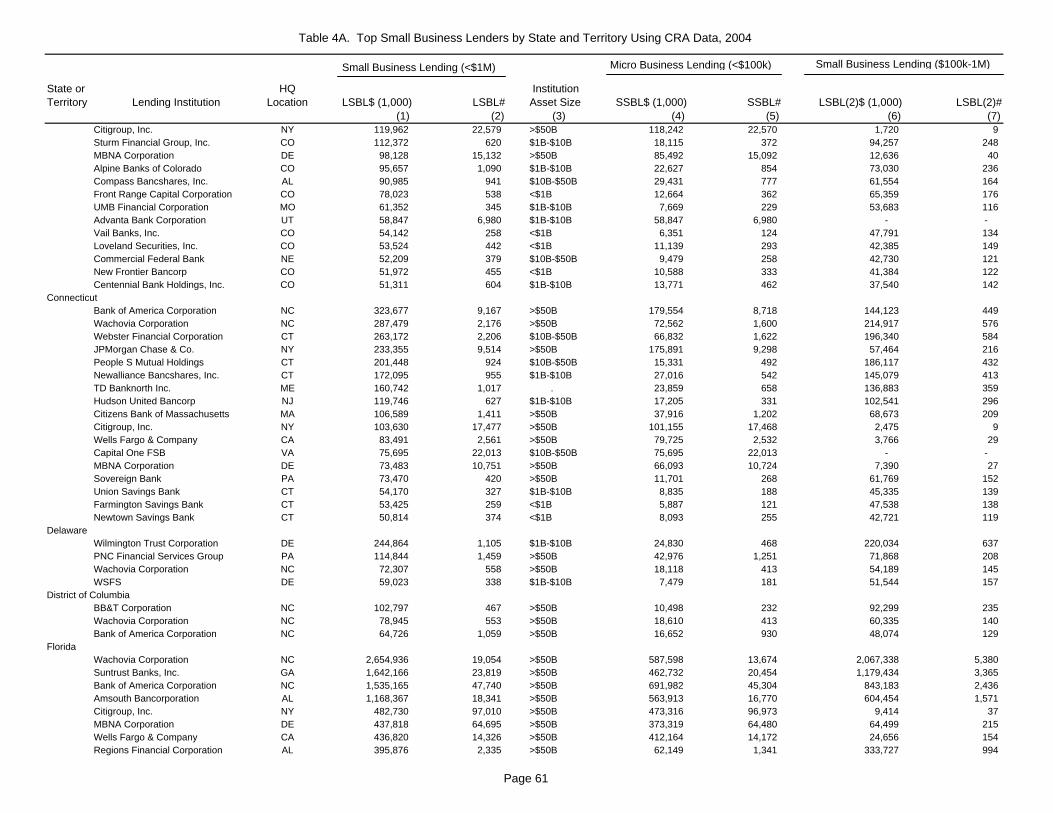
Table 4A. Top Small Business Lenders by State and Territory Using CRA Data, 2004
State or Territory Lending Institution
HQ Location LSBL$ (1,000) LSBL#
Institution Asset Size SSBL$ (1,000) SSBL# LSBL(2)$ (1,000) LSBL(2)#
(1) (2) (3) (4) (5) (6) (7)
Small Business Lending (<$1M) Micro Business Lending (<$100k) Small Business Lending ($100k-1M)
Citigroup, Inc. NY 119,962 22,579 >$50B 118,242 22,570 1,720 9 Sturm Financial Group, Inc. CO 112,372 620 $1B-$10B 18,115 372 94,257 248 MBNA Corporation DE 98,128 15,132 >$50B 85,492 15,092 12,636 40 Alpine Banks of Colorado CO 95,657 1,090 $1B-$10B 22,627 854 73,030 236 Compass Bancshares, Inc. AL 90,985 941 $10B-$50B 29,431 777 61,554 164 Front Range Capital Corporation CO 78,023 538 <$1B 12,664 362 65,359 176 UMB Financial Corporation MO 61,352 345 $1B-$10B 7,669 229 53,683 116 Advanta Bank Corporation UT 58,847 6,980 $1B-$10B 58,847 6,980 - - Vail Banks, Inc. CO 54,142 258 <$1B 6,351 124 47,791 134 Loveland Securities, Inc. CO 53,524 442 <$1B 11,139 293 42,385 149 Commercial Federal Bank NE 52,209 379 $10B-$50B 9,479 258 42,730 121 New Frontier Bancorp CO 51,972 455 <$1B 10,588 333 41,384 122 Centennial Bank Holdings, Inc. CO 51,311 604 $1B-$10B 13,771 462 37,540 142
ConnecticutBank of America Corporation NC 323,677 9,167 >$50B 179,554 8,718 144,123 449 Wachovia Corporation NC 287,479 2,176 >$50B 72,562 1,600 214,917 576 Webster Financial Corporation CT 263,172 2,206 $10B-$50B 66,832 1,622 196,340 584 JPMorgan Chase & Co. NY 233,355 9,514 >$50B 175,891 9,298 57,464 216 People S Mutual Holdings CT 201,448 924 $10B-$50B 15,331 492 186,117 432 Newalliance Bancshares, Inc. CT 172,095 955 $1B-$10B 27,016 542 145,079 413 TD Banknorth Inc. ME 160,742 1,017 . 23,859 658 136,883 359 Hudson United Bancorp NJ 119,746 627 $1B-$10B 17,205 331 102,541 296 Citizens Bank of Massachusetts MA 106,589 1,411 >$50B 37,916 1,202 68,673 209 Citigroup, Inc. NY 103,630 17,477 >$50B 101,155 17,468 2,475 9 Wells Fargo & Company CA 83,491 2,561 >$50B 79,725 2,532 3,766 29 Capital One FSB VA 75,695 22,013 $10B-$50B 75,695 22,013 - - MBNA Corporation DE 73,483 10,751 >$50B 66,093 10,724 7,390 27 Sovereign Bank PA 73,470 420 >$50B 11,701 268 61,769 152 Union Savings Bank CT 54,170 327 $1B-$10B 8,835 188 45,335 139 Farmington Savings Bank CT 53,425 259 <$1B 5,887 121 47,538 138 Newtown Savings Bank CT 50,814 374 <$1B 8,093 255 42,721 119
Wilmington Trust Corporation DE 244,864 1,105 $1B-$10B 24,830 468 220,034 637 PNC Financial Services Group PA 114,844 1,459 >$50B 42,976 1,251 71,868 208 Wachovia Corporation NC 72,307 558 >$50B 18,118 413 54,189 145 WSFS DE 59,023 338 $1B-$10B 7,479 181 51,544 157
BB&T Corporation NC 102,797 467 >$50B 10,498 232 92,299 235 Wachovia Corporation NC 78,945 553 >$50B 18,610 413 60,335 140 Bank of America Corporation NC 64,726 1,059 >$50B 16,652 930 48,074 129
Wachovia Corporation NC 2,654,936 19,054 >$50B 587,598 13,674 2,067,338 5,380 Suntrust Banks, Inc. GA 1,642,166 23,819 >$50B 462,732 20,454 1,179,434 3,365 Bank of America Corporation NC 1,535,165 47,740 >$50B 691,982 45,304 843,183 2,436 Amsouth Bancorporation AL 1,168,367 18,341 >$50B 563,913 16,770 604,454 1,571 Citigroup, Inc. NY 482,730 97,010 >$50B 473,316 96,973 9,414 37 MBNA Corporation DE 437,818 64,695 >$50B 373,319 64,480 64,499 215 Wells Fargo & Company CA 436,820 14,326 >$50B 412,164 14,172 24,656 154 Regions Financial Corporation AL 395,876 2,335 >$50B 62,149 1,341 333,727 994
Florida
Delaware
District of Columbia
Page 61

Table 4A. Top Small Business Lenders by State and Territory Using CRA Data, 2004
State or Territory Lending Institution
HQ Location LSBL$ (1,000) LSBL#
Institution Asset Size SSBL$ (1,000) SSBL# LSBL(2)$ (1,000) LSBL(2)#
(1) (2) (3) (4) (5) (6) (7)
Small Business Lending (<$1M) Micro Business Lending (<$100k) Small Business Lending ($100k-1M)
Capital One FSB VA 370,774 129,630 $10B-$50B 368,174 129,612 2,600 18 Synovus Financial Corp. GA 351,226 2,575 $10B-$50B 69,759 1,697 281,467 878 Colonial Bancgroup, Inc. AL 343,951 1,912 $10B-$50B 55,197 1,108 288,754 804 JPMorgan Chase & Co. NY 268,887 21,964 >$50B 238,932 21,848 29,955 116 Mellon Financial Corporation PA 246,827 1,972 $10B-$50B 48,184 1,414 198,643 558 First National Bankshares of FL FL 226,671 1,651 . 29,923 1,136 196,748 515 Tampa Banking Company FL 185,763 1,373 <$1B 39,663 935 146,100 438 Compass Bancshares, Inc. AL 180,496 1,770 $10B-$50B 50,403 1,386 130,093 384 Advanta Bank Corporation UT 169,440 20,781 $1B-$10B 169,440 20,781 - - American Express Centurion Bank UT 166,348 19,145 $10B-$50B 165,609 19,140 739 5 Harbor Federal Savings Bank FL 142,719 855 $1B-$10B 21,237 502 121,482 353 BB&T Corporation NC 142,576 818 >$50B 18,580 497 123,996 321 Capital City Bank Group, Inc. FL 126,736 1,768 $1B-$10B 43,598 1,503 83,138 265 Ocean Bankshares, Inc. FL 111,773 683 $1B-$10B 17,378 410 94,395 273 Gold Banc Corporation, Inc. KS 110,488 598 $1B-$10B 15,617 308 94,871 290 GE Capital Financial Inc. UT 109,641 29,035 $1B-$10B 107,841 29,029 1,800 6 Alabama National Bancorp. AL 108,728 757 $1B-$10B 18,505 484 90,223 273 Commercebank N.A. FL 107,857 486 $1B-$10B 11,920 224 95,937 262 South Financial Group SC 99,989 935 $10B-$50B 21,878 673 78,111 262 City National Bancshares, Inc. FL 98,479 322 $1B-$10B 6,809 128 91,670 194 Fifth Third Bancorp OH 93,917 338 >$50B 6,943 118 86,974 220 Citibank FSB NY 93,504 909 $10B-$50B 28,408 731 65,096 178 The Pitney Bowes Bank UT 89,678 18,511 <$1B 89,355 18,509 323 2 Transatlantic Bank FL 89,068 574 <$1B 19,505 383 69,563 191 Comerica, Inc. MI 86,320 246 >$50B 3,384 57 82,936 189 Riverside Banking Company FL 85,813 1,105 $1B-$10B 27,675 918 58,138 187 Atlantic States Bank NC 83,308 327 $1B-$10B 7,107 144 76,201 183 Citrus & Chemical Bancorp. FL 78,353 775 <$1B 21,087 586 57,266 189 U.S. Bancorp MN 74,515 3,692 >$50B 44,945 3,603 29,570 89 Total Bancshares Corp. FL 74,023 3,158 <$1B 32,013 3,018 42,010 140 Peoples First Community Bank FL 74,015 650 $1B-$10B 19,090 462 54,925 188 Bankunited FSB FL 73,612 309 $1B-$10B 7,125 134 66,487 175 Fidelity Federal Bank & Trust FL 70,851 273 $1B-$10B 5,425 99 65,426 174 HSBC Bank USA NY 67,864 660 >$50B 33,603 557 34,261 103 Bankatlantic FL 64,171 430 $1B-$10B 13,305 283 50,866 147 TIB Financial Corp. FL 62,203 358 $1B-$10B 10,545 212 51,658 146 RBC Centura Bank NC 61,315 248 $10B-$50B 5,019 105 56,296 143 Whitney Holding Corporation LA 60,526 327 $1B-$10B 6,766 168 53,760 159 Northern Trust Corporation IL 59,969 282 $10B-$50B 8,487 143 51,482 139 Commercial Bankshares, Inc. FL 57,082 283 <$1B 7,597 146 49,485 137 Florida Community Banks, Inc. FL 54,877 477 <$1B 11,615 331 43,262 146 Seacoast Banking Corporation FL 50,383 442 $1B-$10B 11,001 334 39,382 108
Synovus Financial Corp. GA 1,463,546 12,626 $10B-$50B 292,286 9,089 1,171,260 3,537 Suntrust Banks, Inc. GA 1,196,049 12,159 >$50B 213,005 9,444 983,044 2,715 Wachovia Corporation NC 1,123,358 6,874 >$50B 194,282 4,484 929,076 2,390 Regions Financial Corporation AL 862,014 7,182 >$50B 165,283 5,008 696,731 2,174 BB&T Corporation NC 827,800 6,219 >$50B 147,894 4,291 679,906 1,928 Bank of America Corporation NC 462,997 13,193 >$50B 181,585 12,407 281,412 786
Georgia
Page 62
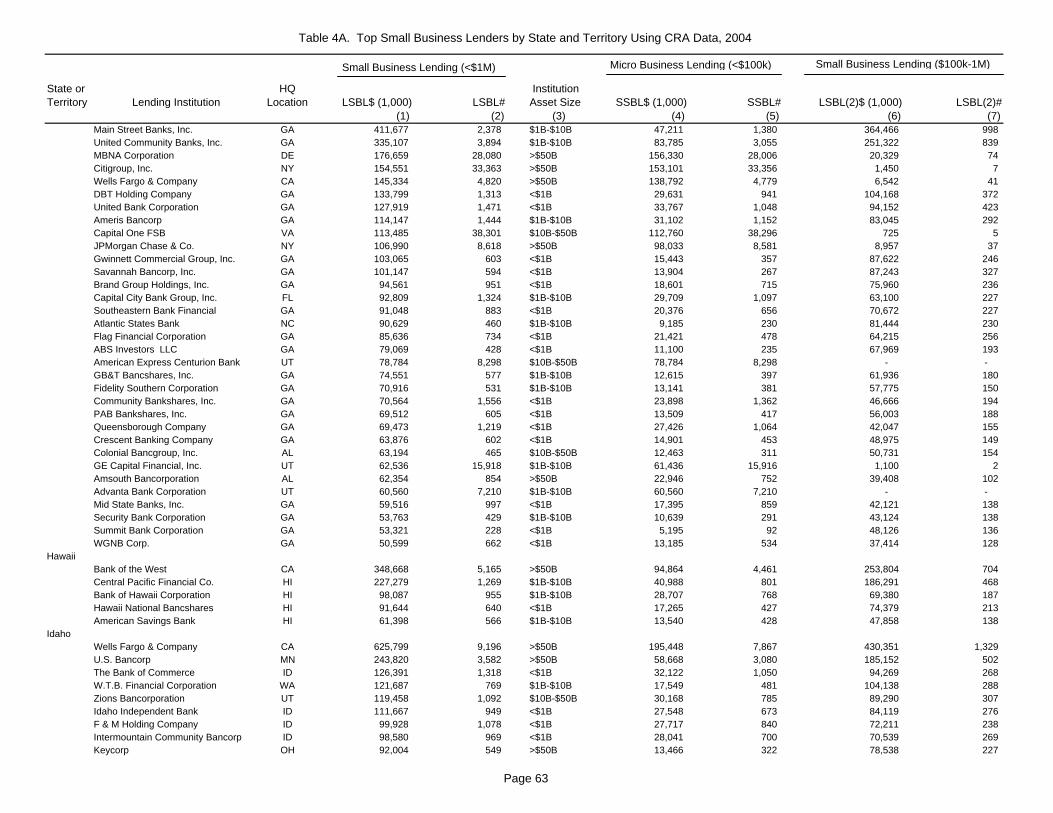
Table 4A. Top Small Business Lenders by State and Territory Using CRA Data, 2004
State or Territory Lending Institution
HQ Location LSBL$ (1,000) LSBL#
Institution Asset Size SSBL$ (1,000) SSBL# LSBL(2)$ (1,000) LSBL(2)#
(1) (2) (3) (4) (5) (6) (7)
Small Business Lending (<$1M) Micro Business Lending (<$100k) Small Business Lending ($100k-1M)
Main Street Banks, Inc. GA 411,677 2,378 $1B-$10B 47,211 1,380 364,466 998 United Community Banks, Inc. GA 335,107 3,894 $1B-$10B 83,785 3,055 251,322 839 MBNA Corporation DE 176,659 28,080 >$50B 156,330 28,006 20,329 74 Citigroup, Inc. NY 154,551 33,363 >$50B 153,101 33,356 1,450 7 Wells Fargo & Company CA 145,334 4,820 >$50B 138,792 4,779 6,542 41 DBT Holding Company GA 133,799 1,313 <$1B 29,631 941 104,168 372 United Bank Corporation GA 127,919 1,471 <$1B 33,767 1,048 94,152 423 Ameris Bancorp GA 114,147 1,444 $1B-$10B 31,102 1,152 83,045 292 Capital One FSB VA 113,485 38,301 $10B-$50B 112,760 38,296 725 5 JPMorgan Chase & Co. NY 106,990 8,618 >$50B 98,033 8,581 8,957 37 Gwinnett Commercial Group, Inc. GA 103,065 603 <$1B 15,443 357 87,622 246 Savannah Bancorp, Inc. GA 101,147 594 <$1B 13,904 267 87,243 327 Brand Group Holdings, Inc. GA 94,561 951 <$1B 18,601 715 75,960 236 Capital City Bank Group, Inc. FL 92,809 1,324 $1B-$10B 29,709 1,097 63,100 227 Southeastern Bank Financial GA 91,048 883 <$1B 20,376 656 70,672 227 Atlantic States Bank NC 90,629 460 $1B-$10B 9,185 230 81,444 230 Flag Financial Corporation GA 85,636 734 <$1B 21,421 478 64,215 256 ABS Investors LLC GA 79,069 428 <$1B 11,100 235 67,969 193 American Express Centurion Bank UT 78,784 8,298 $10B-$50B 78,784 8,298 - - GB&T Bancshares, Inc. GA 74,551 577 $1B-$10B 12,615 397 61,936 180 Fidelity Southern Corporation GA 70,916 531 $1B-$10B 13,141 381 57,775 150 Community Bankshares, Inc. GA 70,564 1,556 <$1B 23,898 1,362 46,666 194 PAB Bankshares, Inc. GA 69,512 605 <$1B 13,509 417 56,003 188 Queensborough Company GA 69,473 1,219 <$1B 27,426 1,064 42,047 155 Crescent Banking Company GA 63,876 602 <$1B 14,901 453 48,975 149 Colonial Bancgroup, Inc. AL 63,194 465 $10B-$50B 12,463 311 50,731 154 GE Capital Financial, Inc. UT 62,536 15,918 $1B-$10B 61,436 15,916 1,100 2 Amsouth Bancorporation AL 62,354 854 >$50B 22,946 752 39,408 102 Advanta Bank Corporation UT 60,560 7,210 $1B-$10B 60,560 7,210 - - Mid State Banks, Inc. GA 59,516 997 <$1B 17,395 859 42,121 138 Security Bank Corporation GA 53,763 429 $1B-$10B 10,639 291 43,124 138 Summit Bank Corporation GA 53,321 228 <$1B 5,195 92 48,126 136 WGNB Corp. GA 50,599 662 <$1B 13,185 534 37,414 128
Bank of the West CA 348,668 5,165 >$50B 94,864 4,461 253,804 704 Central Pacific Financial Co. HI 227,279 1,269 $1B-$10B 40,988 801 186,291 468 Bank of Hawaii Corporation HI 98,087 955 $1B-$10B 28,707 768 69,380 187 Hawaii National Bancshares HI 91,644 640 <$1B 17,265 427 74,379 213 American Savings Bank HI 61,398 566 $1B-$10B 13,540 428 47,858 138
Wells Fargo & Company CA 625,799 9,196 >$50B 195,448 7,867 430,351 1,329 U.S. Bancorp MN 243,820 3,582 >$50B 58,668 3,080 185,152 502 The Bank of Commerce ID 126,391 1,318 <$1B 32,122 1,050 94,269 268 W.T.B. Financial Corporation WA 121,687 769 $1B-$10B 17,549 481 104,138 288 Zions Bancorporation UT 119,458 1,092 $10B-$50B 30,168 785 89,290 307 Idaho Independent Bank ID 111,667 949 <$1B 27,548 673 84,119 276 F & M Holding Company ID 99,928 1,078 <$1B 27,717 840 72,211 238 Intermountain Community Bancorp ID 98,580 969 <$1B 28,041 700 70,539 269 Keycorp OH 92,004 549 >$50B 13,466 322 78,538 227
Hawaii
Idaho
Page 63

Table 4A. Top Small Business Lenders by State and Territory Using CRA Data, 2004
State or Territory Lending Institution
HQ Location LSBL$ (1,000) LSBL#
Institution Asset Size SSBL$ (1,000) SSBL# LSBL(2)$ (1,000) LSBL(2)#
(1) (2) (3) (4) (5) (6) (7)
Small Business Lending (<$1M) Micro Business Lending (<$100k) Small Business Lending ($100k-1M)
D. L. Evans Bancorp ID 74,593 836 <$1B 20,873 625 53,720 211 Farmers Bancorporation, Inc. ID 60,539 890 <$1B 22,611 752 37,928 138 Firstbank Northwest ID 55,260 297 <$1B 7,489 162 47,771 135
Lasalle Bank IL 839,042 5,806 >$50B 173,293 4,329 665,749 1,477 JPMorgan Chase & Co. NY 752,287 24,583 >$50B 311,854 23,465 440,433 1,118 Harris Trust And Savings Bank IL 648,647 6,985 $10B-$50B 107,816 5,436 540,831 1,549 Fifth Third Bancorp OH 571,324 2,338 >$50B 53,129 954 518,195 1,384 First Midwest Bancorp, Inc. IL 560,785 3,311 $1B-$10B 82,793 1,957 477,992 1,354 MB Financial, Inc. IL 452,142 1,873 $1B-$10B 42,566 804 409,576 1,069 U.S. Bancorp MN 409,689 7,685 >$50B 116,344 6,776 293,345 909 Citigroup, Inc. NY 294,907 48,317 >$50B 293,534 48,311 1,373 6 West Suburban Bancorp, Inc. IL 282,602 1,207 $1B-$10B 26,037 513 256,565 694 Wells Fargo & Company CA 267,692 8,178 >$50B 218,200 8,000 49,492 178 American Chartered Bancorp IL 257,552 1,049 $1B-$10B 28,721 505 228,831 544 Wintrust Financial Corporation IL 248,146 1,291 $1B-$10B 31,312 683 216,834 608 Associated Banc-Corp WI 230,123 1,089 $10B-$50B 24,135 581 205,988 508 First American Bank Corporation IL 213,205 801 $1B-$10B 16,611 356 196,594 445 Capital One FSB VA 203,865 60,374 $10B-$50B 203,115 60,369 750 5 Metropolitan Bank Group, Inc. IL 194,232 852 $1B-$10B 17,265 345 176,967 507 MBNA Corporation DE 181,736 29,234 >$50B 156,614 29,148 25,122 86 National City Corporation OH 173,814 2,152 >$50B 37,401 1,732 136,413 420 Old Second Bancorp, Inc. IL 162,443 1,222 $1B-$10B 27,766 826 134,677 396 Royal American Corporation IL 146,228 459 <$1B 8,241 129 137,987 330 Standard Bancshares, Inc. IL 144,031 735 $1B-$10B 18,006 362 126,025 373 First Banks, Inc. MO 141,498 1,360 $1B-$10B 34,501 1,044 106,997 316 Taylor Capital Group, Inc. IL 132,369 571 $1B-$10B 14,393 250 117,976 321 Privatebancorp, Inc. IL 129,177 476 $1B-$10B 11,516 186 117,661 290 First Mid-Illinois Bancshare IL 128,825 1,518 <$1B 37,544 1,217 91,281 301 Regions Financial Corporation AL 127,709 940 >$50B 25,447 638 102,262 302 Midwest Banc Holdings, Inc. IL 122,130 717 $1B-$10B 17,018 421 105,112 296 FBOP Corporation IL 115,875 529 $10B-$50B 12,452 242 103,423 287 Banc Ed Corp. IL 115,515 914 $1B-$10B 25,175 641 90,340 273 Bridgeview Bancorp, Inc. IL 112,693 415 $1B-$10B 8,204 157 104,489 258 Bank of America Corporation NC 109,046 4,206 >$50B 55,161 4,083 53,885 123 Princeton National Bancorp IL 101,846 817 <$1B 19,042 560 82,804 257 Peotone Bancorp, Inc. IL 101,137 545 $1B-$10B 13,764 286 87,373 259 Citibank FSB NY 99,979 1,026 $10B-$50B 29,804 816 70,175 210 Advanta Bank Corporation UT 94,306 11,567 $1B-$10B 94,306 11,567 - - Home State Bancorp, Inc. IL 91,803 704 <$1B 15,753 490 76,050 214 Commerce Bancshares, Inc. MO 89,433 632 $10B-$50B 14,151 425 75,282 207 Northern Trust Corporation IL 88,397 458 $10B-$50B 12,232 255 76,165 203 Heartland Bancorp, Inc. IL 87,385 816 <$1B 21,210 624 66,175 192 Banterra Corp. IL 85,943 933 <$1B 22,618 736 63,325 197 Illinois National Bancorp, Inc. IL 85,638 747 <$1B 14,086 464 71,552 283 BB&T Bancshares Corp. IL 84,643 353 <$1B 8,392 146 76,251 207 West Pointe Bancorp, Inc. IL 84,183 621 <$1B 16,822 407 67,361 214 Bankfinancial IL 83,383 366 $1B-$10B 9,150 177 74,233 189 Great Lakes Financial Resources IL 80,049 566 <$1B 16,513 372 63,536 194
Illinois
Page 64

Table 4A. Top Small Business Lenders by State and Territory Using CRA Data, 2004
State or Territory Lending Institution
HQ Location LSBL$ (1,000) LSBL#
Institution Asset Size SSBL$ (1,000) SSBL# LSBL(2)$ (1,000) LSBL(2)#
(1) (2) (3) (4) (5) (6) (7)
Small Business Lending (<$1M) Micro Business Lending (<$100k) Small Business Lending ($100k-1M)
Spring Bancorp, Inc. IL 78,628 447 <$1B 10,839 254 67,789 193 Lauritzen Corporation NE 77,478 1,133 $10B-$50B 20,724 950 56,754 183 Main Street Trust, Inc. IL 74,691 553 $1B-$10B 12,070 376 62,621 177 Popular, Inc. PR 73,794 492 $10B-$50B 8,507 307 65,287 185 Marine Bancorp, Inc. IL 71,025 401 <$1B 9,251 232 61,774 169 Old National Bancorp IN 70,535 717 $1B-$10B 17,231 548 53,304 169 GE Capital Financial, Inc. UT 69,997 17,800 $1B-$10B 69,022 17,797 975 3 First Busey Corporation IL 69,708 586 $1B-$10B 14,810 418 54,898 168 Foster Bankshares, Inc. IL 67,184 295 <$1B 7,559 125 59,625 170 Itasca Bancorp, Inc. IL 65,336 348 <$1B 9,193 193 56,143 155 The Pitney Bowes Bank UT 63,665 11,648 <$1B 63,665 11,648 - - American Express Centurion Bank UT 61,758 6,986 $10B-$50B 61,203 6,983 555 3 Hometown Community Bancorp IL 61,327 615 $1B-$10B 14,339 469 46,988 146 Heartland Financial USA, Inc. IA 60,773 470 $1B-$10B 12,184 311 48,589 159 Palos Bancshares, Inc. IL 60,199 300 <$1B 6,812 148 53,387 152 Midamerica National Bancshares IL 60,082 411 <$1B 9,957 260 50,125 151 Marshall & Ilsley Corporation WI 59,118 213 $10B-$50B 4,108 84 55,010 129 Blackhawk Bancorp, Inc. WI 58,197 416 <$1B 10,853 265 47,344 151 Midland States Bancorp, Inc. IL 57,892 515 <$1B 14,384 385 43,508 130 Alikat Investments, Inc. IL 55,499 224 <$1B 5,637 97 49,862 127 Marquette National Corporation IL 55,045 292 $1B-$10B 8,165 163 46,880 129 Market Street Bancshares, Inc. IL 52,824 600 <$1B 14,202 472 38,622 128 Alpine Bancorporation, Inc. IL 51,906 963 <$1B 26,352 886 25,554 77 Devon Bancorp, Inc. IL 51,219 199 <$1B 3,757 82 47,462 117 Unionbancorp, Inc. IL 50,350 545 <$1B 11,522 417 38,828 128
Fifth Third Bancorp OH 697,476 3,515 >$50B 87,333 1,809 610,143 1,706 Old National Bancorp IN 401,287 3,335 $1B-$10B 89,736 2,378 311,551 957 National City Corporation OH 384,135 3,894 >$50B 65,166 3,039 318,969 855 JPMorgan Chase & Co. NY 354,101 9,665 >$50B 112,480 9,005 241,621 660 First Merchants Corporation IN 271,552 2,455 $1B-$10B 65,660 1,772 205,892 683 Wells Fargo & Company CA 237,668 5,390 >$50B 134,390 5,090 103,278 300 Lakeland Financial Corporation IN 237,490 1,325 $1B-$10B 34,028 760 203,462 565 1st Source Corporation IN 206,622 1,372 $1B-$10B 35,788 832 170,834 540 Regions Financial Corporation AL 185,548 1,065 >$50B 26,577 619 158,971 446 Irwin Financial Corporation IN 178,808 848 $1B-$10B 22,507 386 156,301 462 Star Financial Group, Inc. IN 156,074 1,089 $1B-$10B 28,224 685 127,850 404 Salin Bancshares, Inc. IN 136,603 804 <$1B 22,987 466 113,616 338 Community Bank Shares of Indiana IN 121,873 694 <$1B 20,278 379 101,595 315 Keycorp OH 118,470 675 >$50B 14,433 418 104,037 257 MBNA Corporation DE 105,783 19,314 >$50B 96,488 19,280 9,295 34 First Financial Corporation IN 101,008 984 $1B-$10B 25,913 732 75,095 252 Tower Financial Corporation IN 92,559 490 <$1B 12,431 231 80,128 259 Monroe Bancorp IN 89,895 736 <$1B 19,115 507 70,780 229 First Financial Bancorp OH 85,074 991 $1B-$10B 25,061 777 60,013 214 Citigroup, Inc. NY 81,449 15,271 >$50B 80,969 15,268 480 3 First Bancshares, Inc. IN 81,087 561 $1B-$10B 15,820 337 65,267 224 Capital One FSB VA 79,701 24,852 $10B-$50B 79,126 24,848 575 4 Huntington Bancshares, Inc. OH 77,136 890 $10B-$50B 26,138 766 50,998 124
Indiana
Page 65
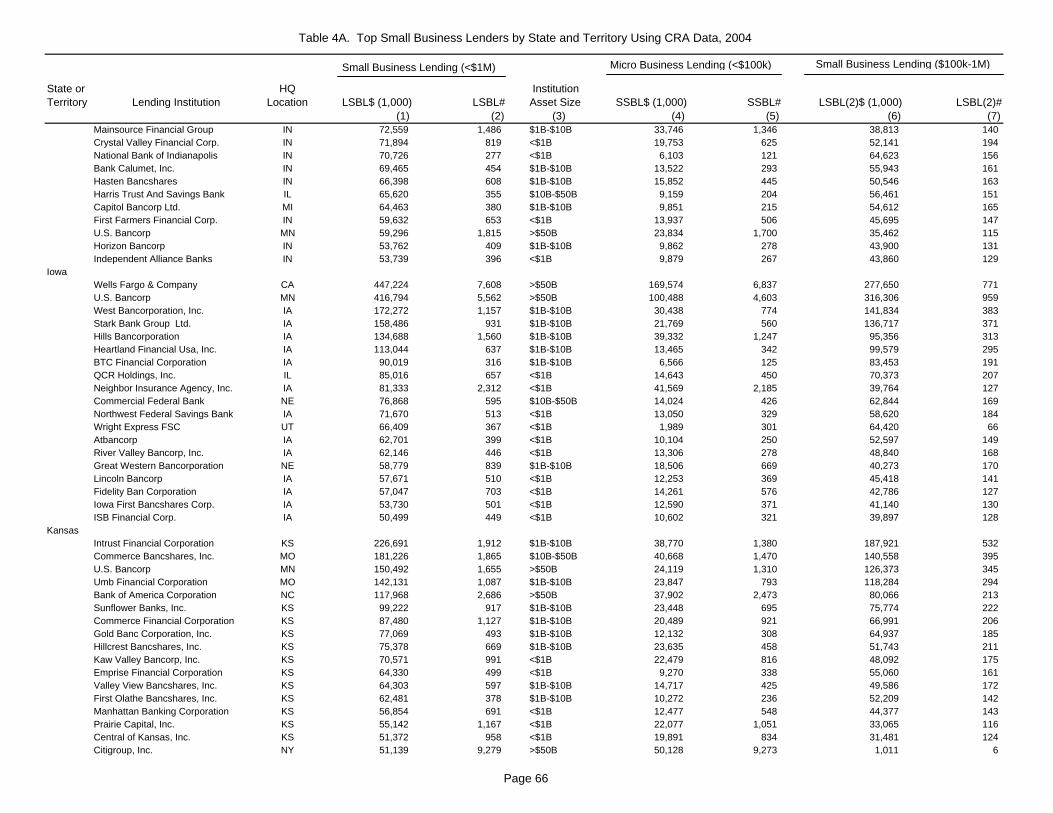
Table 4A. Top Small Business Lenders by State and Territory Using CRA Data, 2004
State or Territory Lending Institution
HQ Location LSBL$ (1,000) LSBL#
Institution Asset Size SSBL$ (1,000) SSBL# LSBL(2)$ (1,000) LSBL(2)#
(1) (2) (3) (4) (5) (6) (7)
Small Business Lending (<$1M) Micro Business Lending (<$100k) Small Business Lending ($100k-1M)
Mainsource Financial Group IN 72,559 1,486 $1B-$10B 33,746 1,346 38,813 140 Crystal Valley Financial Corp. IN 71,894 819 <$1B 19,753 625 52,141 194 National Bank of Indianapolis IN 70,726 277 <$1B 6,103 121 64,623 156 Bank Calumet, Inc. IN 69,465 454 $1B-$10B 13,522 293 55,943 161 Hasten Bancshares IN 66,398 608 $1B-$10B 15,852 445 50,546 163 Harris Trust And Savings Bank IL 65,620 355 $10B-$50B 9,159 204 56,461 151 Capitol Bancorp Ltd. MI 64,463 380 $1B-$10B 9,851 215 54,612 165 First Farmers Financial Corp. IN 59,632 653 <$1B 13,937 506 45,695 147 U.S. Bancorp MN 59,296 1,815 >$50B 23,834 1,700 35,462 115 Horizon Bancorp IN 53,762 409 $1B-$10B 9,862 278 43,900 131 Independent Alliance Banks IN 53,739 396 <$1B 9,879 267 43,860 129
Wells Fargo & Company CA 447,224 7,608 >$50B 169,574 6,837 277,650 771 U.S. Bancorp MN 416,794 5,562 >$50B 100,488 4,603 316,306 959 West Bancorporation, Inc. IA 172,272 1,157 $1B-$10B 30,438 774 141,834 383 Stark Bank Group Ltd. IA 158,486 931 $1B-$10B 21,769 560 136,717 371 Hills Bancorporation IA 134,688 1,560 $1B-$10B 39,332 1,247 95,356 313 Heartland Financial Usa, Inc. IA 113,044 637 $1B-$10B 13,465 342 99,579 295 BTC Financial Corporation IA 90,019 316 $1B-$10B 6,566 125 83,453 191 QCR Holdings, Inc. IL 85,016 657 <$1B 14,643 450 70,373 207 Neighbor Insurance Agency, Inc. IA 81,333 2,312 <$1B 41,569 2,185 39,764 127 Commercial Federal Bank NE 76,868 595 $10B-$50B 14,024 426 62,844 169 Northwest Federal Savings Bank IA 71,670 513 <$1B 13,050 329 58,620 184 Wright Express FSC UT 66,409 367 <$1B 1,989 301 64,420 66 Atbancorp IA 62,701 399 <$1B 10,104 250 52,597 149 River Valley Bancorp, Inc. IA 62,146 446 <$1B 13,306 278 48,840 168 Great Western Bancorporation NE 58,779 839 $1B-$10B 18,506 669 40,273 170 Lincoln Bancorp IA 57,671 510 <$1B 12,253 369 45,418 141 Fidelity Ban Corporation IA 57,047 703 <$1B 14,261 576 42,786 127 Iowa First Bancshares Corp. IA 53,730 501 <$1B 12,590 371 41,140 130 ISB Financial Corp. IA 50,499 449 <$1B 10,602 321 39,897 128
Intrust Financial Corporation KS 226,691 1,912 $1B-$10B 38,770 1,380 187,921 532 Commerce Bancshares, Inc. MO 181,226 1,865 $10B-$50B 40,668 1,470 140,558 395 U.S. Bancorp MN 150,492 1,655 >$50B 24,119 1,310 126,373 345 Umb Financial Corporation MO 142,131 1,087 $1B-$10B 23,847 793 118,284 294 Bank of America Corporation NC 117,968 2,686 >$50B 37,902 2,473 80,066 213 Sunflower Banks, Inc. KS 99,222 917 $1B-$10B 23,448 695 75,774 222 Commerce Financial Corporation KS 87,480 1,127 $1B-$10B 20,489 921 66,991 206 Gold Banc Corporation, Inc. KS 77,069 493 $1B-$10B 12,132 308 64,937 185 Hillcrest Bancshares, Inc. KS 75,378 669 $1B-$10B 23,635 458 51,743 211 Kaw Valley Bancorp, Inc. KS 70,571 991 <$1B 22,479 816 48,092 175 Emprise Financial Corporation KS 64,330 499 <$1B 9,270 338 55,060 161 Valley View Bancshares, Inc. KS 64,303 597 $1B-$10B 14,717 425 49,586 172 First Olathe Bancshares, Inc. KS 62,481 378 $1B-$10B 10,272 236 52,209 142 Manhattan Banking Corporation KS 56,854 691 <$1B 12,477 548 44,377 143 Prairie Capital, Inc. KS 55,142 1,167 <$1B 22,077 1,051 33,065 116 Central of Kansas, Inc. KS 51,372 958 <$1B 19,891 834 31,481 124 Citigroup, Inc. NY 51,139 9,279 >$50B 50,128 9,273 1,011 6
Iowa
Kansas
Page 66

Table 4A. Top Small Business Lenders by State and Territory Using CRA Data, 2004
State or Territory Lending Institution
HQ Location LSBL$ (1,000) LSBL#
Institution Asset Size SSBL$ (1,000) SSBL# LSBL(2)$ (1,000) LSBL(2)#
(1) (2) (3) (4) (5) (6) (7)
Small Business Lending (<$1M) Micro Business Lending (<$100k) Small Business Lending ($100k-1M)
Fifth Third Bancorp OH 445,065 2,092 >$50B 49,625 1,032 395,440 1,060 BB&T Corporation NC 329,456 2,634 >$50B 63,135 1,880 266,321 754 National City Corporation OH 296,510 2,782 >$50B 46,519 2,110 249,991 672 U.S. Bancorp MN 233,729 3,815 >$50B 60,208 3,297 173,521 518 PNC Financial Services Group PA 163,035 2,024 >$50B 59,033 1,713 104,002 311 JPMorgan Chase & Co. NY 160,140 5,051 >$50B 57,377 4,769 102,763 282 Republic Bancorp, Inc. KY 141,865 831 $1B-$10B 21,148 445 120,717 386 Central Bancshares, Inc. KY 137,374 1,072 $1B-$10B 29,016 716 108,358 356 Bank of Kentucky Financial Corp. KY 128,546 813 <$1B 21,657 501 106,889 312 Community Trust Bancorp, Inc. KY 126,243 1,439 $1B-$10B 33,812 1,132 92,431 307 LEA M. Mcmullan Trust KY 93,636 744 <$1B 17,817 397 75,819 347 Traditional Bancorporation KY 85,976 904 <$1B 17,458 702 68,518 202 Farmers Capital Bank Corp. KY 85,183 874 $1B-$10B 17,204 651 67,979 223 First Southern Bancorp, Inc. KY 84,664 794 <$1B 19,788 587 64,876 207 Whitaker Bank Corporation of KY KY 79,763 1,345 $1B-$10B 24,042 1,173 55,721 172 Old National Bancorp IN 74,067 809 $1B-$10B 21,303 624 52,764 185 Independence Bancshares, Inc. KY 73,422 652 <$1B 16,949 460 56,473 192 S. Y. Bancorp, Inc. KY 63,873 482 $1B-$10B 11,759 292 52,114 190 MBNA Corporation DE 60,190 9,857 >$50B 47,606 9,818 12,584 39 Community Bank Shares of Indiana IN 59,402 381 <$1B 11,947 208 47,455 173 Regions Financial Corporation AL 54,680 301 >$50B 7,331 171 47,349 130 Wells Fargo & Company CA 50,157 1,691 >$50B 46,833 1,671 3,324 20 Monticello Bankshares, Inc. KY 50,034 669 <$1B 15,387 519 34,647 150
LouisianaWhitney Holding Corporation LA 833,769 5,412 $1B-$10B 140,374 3,399 693,395 2,013 Hibernia Corporation LA 663,543 6,045 $10B-$50B 148,806 4,452 514,737 1,593 Regions Financial Corporation AL 499,582 4,197 >$50B 101,890 2,966 397,692 1,231 JPMorgan Chase & Co. NY 340,214 8,423 >$50B 104,475 7,754 235,739 669 Hancock Holding Company MS 252,260 1,916 $1B-$10B 45,374 1,171 206,886 745 Amsouth Bancorporation AL 219,332 2,513 >$50B 69,228 2,084 150,104 429 Firstrust Corporation LA 160,426 1,075 <$1B 24,885 641 135,541 434 Parish National Corporation LA 147,561 1,057 <$1B 26,530 666 121,031 391 Blossman Bancshares, Inc. LA 105,620 734 <$1B 19,666 403 85,954 331 Sabine Bancshares, Inc. LA 99,381 1,215 <$1B 29,217 968 70,164 247 Iberiabank Corporation LA 94,647 718 $1B-$10B 18,191 491 76,456 227 Bancorpsouth, Inc. MS 82,849 741 $10B-$50B 17,727 551 65,122 190 Red River Bancshares, Inc. LA 74,638 816 <$1B 21,211 633 53,427 183 Cameron Bancshares, Inc. LA 71,227 1,115 <$1B 24,321 945 46,906 170 Midsouth Bancorp, Inc. LA 67,766 873 <$1B 21,946 732 45,820 141 Citigroup, Inc. NY 66,430 12,926 >$50B 65,756 12,921 674 5 CTB Financial Corporation LA 65,122 847 <$1B 18,178 701 46,944 146 MBNA Corporation DE 64,328 11,216 >$50B 58,993 11,200 5,335 16 Wells Fargo & Company CA 56,288 1,986 >$50B 54,836 1,973 1,452 13 Capital One FSB VA 54,256 18,792 $10B-$50B 54,256 18,792 - - Jeff Davis Bancshares, Inc. LA 50,657 816 <$1B 17,565 692 33,092 124
TD Banknorth Inc. ME 420,529 3,269 . 86,251 2,277 334,278 992 Camden National Corporation ME 157,282 1,429 $1B-$10B 36,948 990 120,334 439
Kentucky
Maine
Page 67
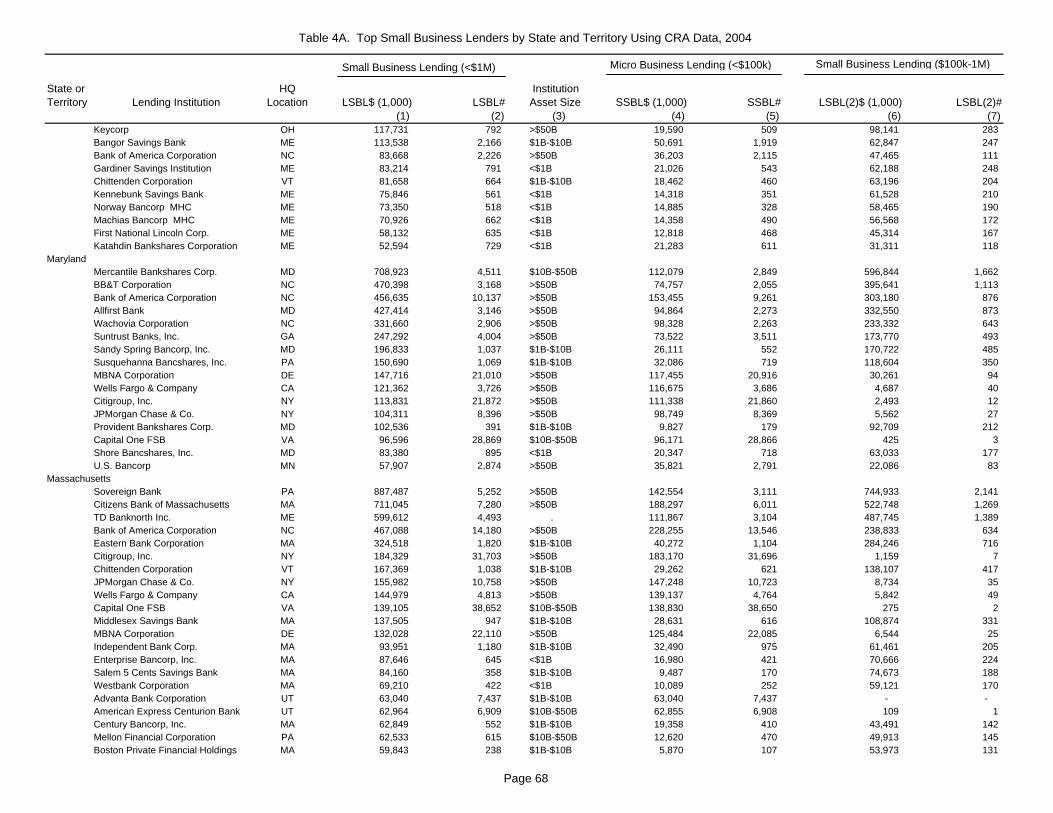
Table 4A. Top Small Business Lenders by State and Territory Using CRA Data, 2004
State or Territory Lending Institution
HQ Location LSBL$ (1,000) LSBL#
Institution Asset Size SSBL$ (1,000) SSBL# LSBL(2)$ (1,000) LSBL(2)#
(1) (2) (3) (4) (5) (6) (7)
Small Business Lending (<$1M) Micro Business Lending (<$100k) Small Business Lending ($100k-1M)
Keycorp OH 117,731 792 >$50B 19,590 509 98,141 283 Bangor Savings Bank ME 113,538 2,166 $1B-$10B 50,691 1,919 62,847 247 Bank of America Corporation NC 83,668 2,226 >$50B 36,203 2,115 47,465 111 Gardiner Savings Institution ME 83,214 791 <$1B 21,026 543 62,188 248 Chittenden Corporation VT 81,658 664 $1B-$10B 18,462 460 63,196 204 Kennebunk Savings Bank ME 75,846 561 <$1B 14,318 351 61,528 210 Norway Bancorp MHC ME 73,350 518 <$1B 14,885 328 58,465 190 Machias Bancorp MHC ME 70,926 662 <$1B 14,358 490 56,568 172 First National Lincoln Corp. ME 58,132 635 <$1B 12,818 468 45,314 167 Katahdin Bankshares Corporation ME 52,594 729 <$1B 21,283 611 31,311 118
Mercantile Bankshares Corp. MD 708,923 4,511 $10B-$50B 112,079 2,849 596,844 1,662 BB&T Corporation NC 470,398 3,168 >$50B 74,757 2,055 395,641 1,113 Bank of America Corporation NC 456,635 10,137 >$50B 153,455 9,261 303,180 876 Allfirst Bank MD 427,414 3,146 >$50B 94,864 2,273 332,550 873 Wachovia Corporation NC 331,660 2,906 >$50B 98,328 2,263 233,332 643 Suntrust Banks, Inc. GA 247,292 4,004 >$50B 73,522 3,511 173,770 493 Sandy Spring Bancorp, Inc. MD 196,833 1,037 $1B-$10B 26,111 552 170,722 485 Susquehanna Bancshares, Inc. PA 150,690 1,069 $1B-$10B 32,086 719 118,604 350 MBNA Corporation DE 147,716 21,010 >$50B 117,455 20,916 30,261 94 Wells Fargo & Company CA 121,362 3,726 >$50B 116,675 3,686 4,687 40 Citigroup, Inc. NY 113,831 21,872 >$50B 111,338 21,860 2,493 12 JPMorgan Chase & Co. NY 104,311 8,396 >$50B 98,749 8,369 5,562 27 Provident Bankshares Corp. MD 102,536 391 $1B-$10B 9,827 179 92,709 212 Capital One FSB VA 96,596 28,869 $10B-$50B 96,171 28,866 425 3 Shore Bancshares, Inc. MD 83,380 895 <$1B 20,347 718 63,033 177 U.S. Bancorp MN 57,907 2,874 >$50B 35,821 2,791 22,086 83
Sovereign Bank PA 887,487 5,252 >$50B 142,554 3,111 744,933 2,141 Citizens Bank of Massachusetts MA 711,045 7,280 >$50B 188,297 6,011 522,748 1,269 TD Banknorth Inc. ME 599,612 4,493 . 111,867 3,104 487,745 1,389 Bank of America Corporation NC 467,088 14,180 >$50B 228,255 13,546 238,833 634 Eastern Bank Corporation MA 324,518 1,820 $1B-$10B 40,272 1,104 284,246 716 Citigroup, Inc. NY 184,329 31,703 >$50B 183,170 31,696 1,159 7 Chittenden Corporation VT 167,369 1,038 $1B-$10B 29,262 621 138,107 417 JPMorgan Chase & Co. NY 155,982 10,758 >$50B 147,248 10,723 8,734 35 Wells Fargo & Company CA 144,979 4,813 >$50B 139,137 4,764 5,842 49 Capital One FSB VA 139,105 38,652 $10B-$50B 138,830 38,650 275 2 Middlesex Savings Bank MA 137,505 947 $1B-$10B 28,631 616 108,874 331 MBNA Corporation DE 132,028 22,110 >$50B 125,484 22,085 6,544 25 Independent Bank Corp. MA 93,951 1,180 $1B-$10B 32,490 975 61,461 205 Enterprise Bancorp, Inc. MA 87,646 645 <$1B 16,980 421 70,666 224 Salem 5 Cents Savings Bank MA 84,160 358 $1B-$10B 9,487 170 74,673 188 Westbank Corporation MA 69,210 422 <$1B 10,089 252 59,121 170 Advanta Bank Corporation UT 63,040 7,437 $1B-$10B 63,040 7,437 - - American Express Centurion Bank UT 62,964 6,909 $10B-$50B 62,855 6,908 109 1 Century Bancorp, Inc. MA 62,849 552 $1B-$10B 19,358 410 43,491 142 Mellon Financial Corporation PA 62,533 615 $10B-$50B 12,620 470 49,913 145 Boston Private Financial Holdings MA 59,843 238 $1B-$10B 5,870 107 53,973 131
Maryland
Massachusetts
Page 68
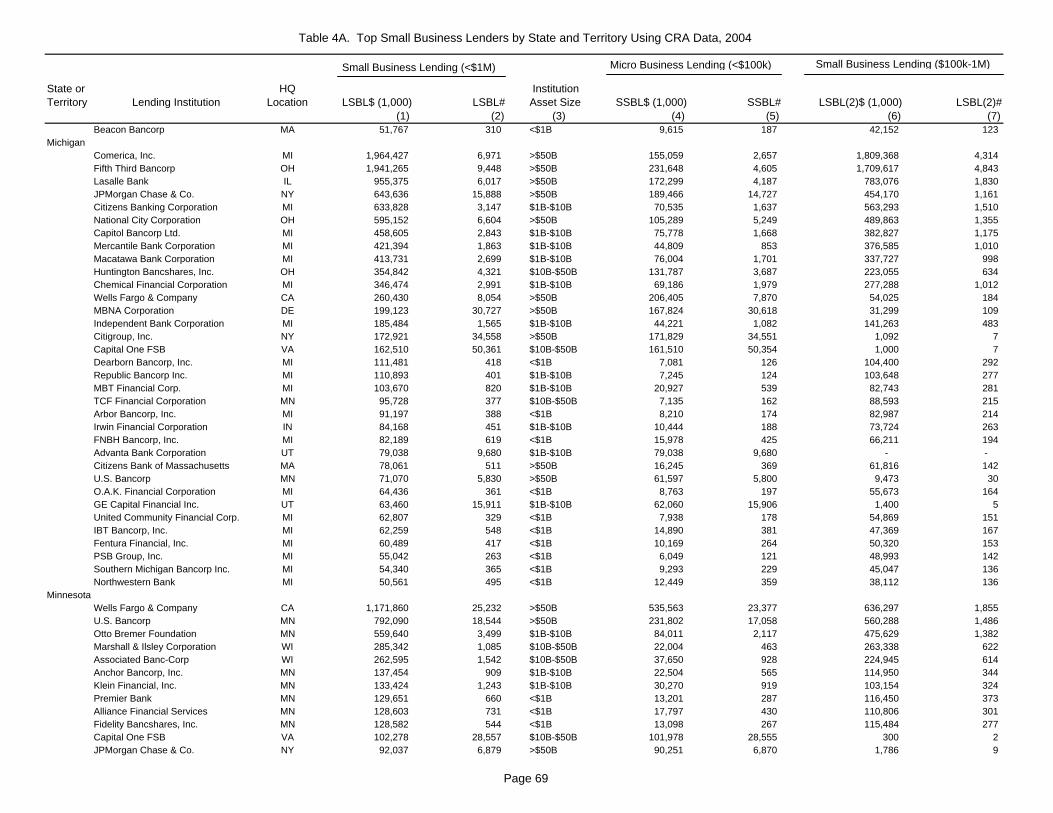
Table 4A. Top Small Business Lenders by State and Territory Using CRA Data, 2004
State or Territory Lending Institution
HQ Location LSBL$ (1,000) LSBL#
Institution Asset Size SSBL$ (1,000) SSBL# LSBL(2)$ (1,000) LSBL(2)#
(1) (2) (3) (4) (5) (6) (7)
Small Business Lending (<$1M) Micro Business Lending (<$100k) Small Business Lending ($100k-1M)
Beacon Bancorp MA 51,767 310 <$1B 9,615 187 42,152 123
Comerica, Inc. MI 1,964,427 6,971 >$50B 155,059 2,657 1,809,368 4,314 Fifth Third Bancorp OH 1,941,265 9,448 >$50B 231,648 4,605 1,709,617 4,843 Lasalle Bank IL 955,375 6,017 >$50B 172,299 4,187 783,076 1,830 JPMorgan Chase & Co. NY 643,636 15,888 >$50B 189,466 14,727 454,170 1,161 Citizens Banking Corporation MI 633,828 3,147 $1B-$10B 70,535 1,637 563,293 1,510 National City Corporation OH 595,152 6,604 >$50B 105,289 5,249 489,863 1,355 Capitol Bancorp Ltd. MI 458,605 2,843 $1B-$10B 75,778 1,668 382,827 1,175 Mercantile Bank Corporation MI 421,394 1,863 $1B-$10B 44,809 853 376,585 1,010 Macatawa Bank Corporation MI 413,731 2,699 $1B-$10B 76,004 1,701 337,727 998 Huntington Bancshares, Inc. OH 354,842 4,321 $10B-$50B 131,787 3,687 223,055 634 Chemical Financial Corporation MI 346,474 2,991 $1B-$10B 69,186 1,979 277,288 1,012 Wells Fargo & Company CA 260,430 8,054 >$50B 206,405 7,870 54,025 184 MBNA Corporation DE 199,123 30,727 >$50B 167,824 30,618 31,299 109 Independent Bank Corporation MI 185,484 1,565 $1B-$10B 44,221 1,082 141,263 483 Citigroup, Inc. NY 172,921 34,558 >$50B 171,829 34,551 1,092 7 Capital One FSB VA 162,510 50,361 $10B-$50B 161,510 50,354 1,000 7 Dearborn Bancorp, Inc. MI 111,481 418 <$1B 7,081 126 104,400 292 Republic Bancorp Inc. MI 110,893 401 $1B-$10B 7,245 124 103,648 277 MBT Financial Corp. MI 103,670 820 $1B-$10B 20,927 539 82,743 281 TCF Financial Corporation MN 95,728 377 $10B-$50B 7,135 162 88,593 215 Arbor Bancorp, Inc. MI 91,197 388 <$1B 8,210 174 82,987 214 Irwin Financial Corporation IN 84,168 451 $1B-$10B 10,444 188 73,724 263 FNBH Bancorp, Inc. MI 82,189 619 <$1B 15,978 425 66,211 194 Advanta Bank Corporation UT 79,038 9,680 $1B-$10B 79,038 9,680 - - Citizens Bank of Massachusetts MA 78,061 511 >$50B 16,245 369 61,816 142 U.S. Bancorp MN 71,070 5,830 >$50B 61,597 5,800 9,473 30 O.A.K. Financial Corporation MI 64,436 361 <$1B 8,763 197 55,673 164 GE Capital Financial Inc. UT 63,460 15,911 $1B-$10B 62,060 15,906 1,400 5 United Community Financial Corp. MI 62,807 329 <$1B 7,938 178 54,869 151 IBT Bancorp, Inc. MI 62,259 548 <$1B 14,890 381 47,369 167 Fentura Financial, Inc. MI 60,489 417 <$1B 10,169 264 50,320 153 PSB Group, Inc. MI 55,042 263 <$1B 6,049 121 48,993 142 Southern Michigan Bancorp Inc. MI 54,340 365 <$1B 9,293 229 45,047 136 Northwestern Bank MI 50,561 495 <$1B 12,449 359 38,112 136
Wells Fargo & Company CA 1,171,860 25,232 >$50B 535,563 23,377 636,297 1,855 U.S. Bancorp MN 792,090 18,544 >$50B 231,802 17,058 560,288 1,486 Otto Bremer Foundation MN 559,640 3,499 $1B-$10B 84,011 2,117 475,629 1,382 Marshall & Ilsley Corporation WI 285,342 1,085 $10B-$50B 22,004 463 263,338 622 Associated Banc-Corp WI 262,595 1,542 $10B-$50B 37,650 928 224,945 614 Anchor Bancorp, Inc. MN 137,454 909 $1B-$10B 22,504 565 114,950 344 Klein Financial, Inc. MN 133,424 1,243 $1B-$10B 30,270 919 103,154 324 Premier Bank MN 129,651 660 <$1B 13,201 287 116,450 373 Alliance Financial Services MN 128,603 731 <$1B 17,797 430 110,806 301 Fidelity Bancshares, Inc. MN 128,582 544 <$1B 13,098 267 115,484 277 Capital One FSB VA 102,278 28,557 $10B-$50B 101,978 28,555 300 2 JPMorgan Chase & Co. NY 92,037 6,879 >$50B 90,251 6,870 1,786 9
Michigan
Minnesota
Page 69

Table 4A. Top Small Business Lenders by State and Territory Using CRA Data, 2004
State or Territory Lending Institution
HQ Location LSBL$ (1,000) LSBL#
Institution Asset Size SSBL$ (1,000) SSBL# LSBL(2)$ (1,000) LSBL(2)#
(1) (2) (3) (4) (5) (6) (7)
Small Business Lending (<$1M) Micro Business Lending (<$100k) Small Business Lending ($100k-1M)
Bank of the West CA 91,602 986 >$50B 22,702 761 68,900 225 Voyager Financial Services Corp. MN 85,339 514 <$1B 13,377 278 71,962 236 Citigroup, Inc. NY 78,715 14,031 >$50B 78,242 14,027 473 4 Western Bancshares, Inc. MN 78,446 549 <$1B 15,215 344 63,231 205 Northeast Securities Corporation MN 77,604 461 <$1B 12,660 280 64,944 181 MBNA Corporation DE 75,300 13,127 >$50B 67,578 13,102 7,722 25 First National Financial Services MN 68,009 432 <$1B 11,707 270 56,302 162 Sterling Financial Group, Inc. MN 60,804 370 <$1B 6,651 165 54,153 205 First Federal Savings Bank WI 60,193 455 . 12,937 308 47,256 147 Mesaba Bancshares, Inc. MN 55,392 662 <$1B 15,795 525 39,597 137 American Bancorporation MN 54,052 326 <$1B 6,427 204 47,625 122 Home Federal Savings Bank MN 52,643 239 <$1B 5,088 106 47,555 133 Stearns Financial Services MN 51,353 425 $1B-$10B 9,429 299 41,924 126
Trustmark Corporation MS 466,010 4,843 $1B-$10B 126,522 3,844 339,488 999 Bancorpsouth, Inc. MS 323,225 4,563 $10B-$50B 98,168 3,794 225,057 769 Amsouth Bancorporation AL 248,195 3,887 >$50B 116,602 3,522 131,593 365 Renasant Corporation MS 202,220 2,130 $1B-$10B 49,987 1,603 152,233 527 Bancplus Corporation MS 188,650 2,928 $1B-$10B 57,121 2,490 131,529 438 Community Bancshares Of Miss MS 179,604 2,411 <$1B 49,172 1,988 130,432 423 Regions Financial Corporation AL 174,054 1,380 >$50B 35,829 955 138,225 425 Hancock Holding Company MS 168,492 1,802 $1B-$10B 44,841 1,327 123,651 475 First M & F Corporation MS 121,958 2,376 $1B-$10B 49,122 2,094 72,836 282 Priorityone Capital Corporation MS 109,855 1,281 <$1B 27,715 970 82,140 311 Citizens Holding Company MS 106,995 2,354 <$1B 48,363 2,114 58,632 240 Planters Holding Company MS 92,557 1,676 <$1B 36,705 1,468 55,852 208 NBC Capital Corporation MS 88,394 2,010 $1B-$10B 33,785 1,808 54,609 202 Citizens National Banc Corp. MS 77,482 823 <$1B 17,784 620 59,698 203 Peoples Financial Corporation MS 70,372 597 <$1B 13,007 421 57,365 176 State Bank & Trust Company MS 60,561 1,267 <$1B 27,275 1,122 33,286 145 Bankfirst Capital Corporation MS 59,980 1,275 <$1B 25,092 1,138 34,888 137
U.S. Bancorp MN 712,684 7,941 >$50B 162,713 6,257 549,971 1,684 Central Bancompany MO 634,690 7,020 $1B-$10B 165,294 5,465 469,396 1,555 Commerce Bancshares, Inc. MO 516,823 5,399 $10B-$50B 118,747 4,288 398,076 1,111 Bank of America Corporation NC 247,210 6,103 >$50B 84,401 5,664 162,809 439 Marshall & Ilsley Corporation WI 233,507 983 $10B-$50B 22,450 446 211,057 537 UMB Financial Corporation MO 225,965 1,509 $1B-$10B 32,004 1,017 193,961 492 Enterprise Financial Service MO 219,147 946 $1B-$10B 24,812 447 194,335 499 Regions Financial Corporation AL 194,797 1,418 >$50B 33,151 971 161,646 447 National City Corporation OH 167,307 1,114 >$50B 27,021 695 140,286 419 First Banks, Inc. MO 130,770 940 $1B-$10B 22,657 620 108,113 320 City Bancorp MO 117,470 639 <$1B 13,787 322 103,683 317 Citigroup, Inc. NY 113,624 19,944 >$50B 112,395 19,938 1,229 6 Montgomery Bancorporation, Inc. MO 105,255 646 <$1B 16,239 372 89,016 274 Great Southern Bancorp, Inc. MO 102,931 551 $1B-$10B 12,087 307 90,844 244 MBNA Corporation DE 96,525 15,840 >$50B 83,161 15,799 13,364 41 Trustcorp Financial Inc. MO 90,558 433 <$1B 11,253 212 79,305 221 Wells Fargo & Company CA 90,443 3,150 >$50B 87,007 3,129 3,436 21
Mississippi
Missouri
Page 70
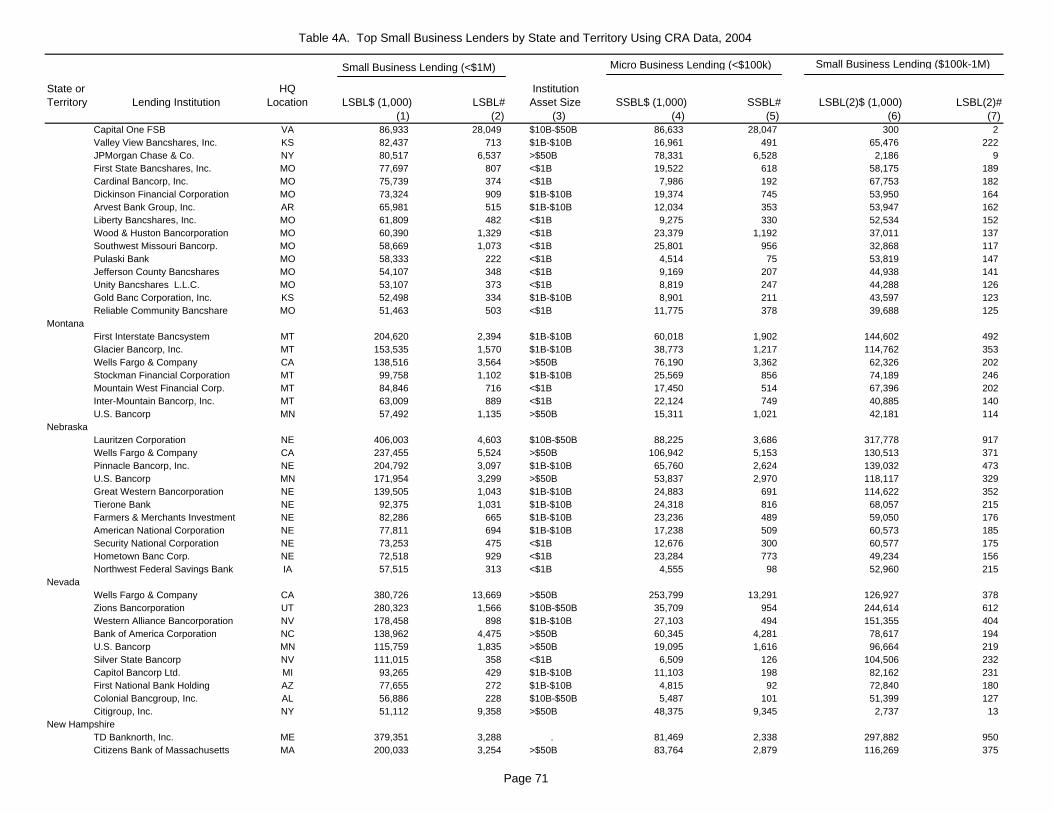
Table 4A. Top Small Business Lenders by State and Territory Using CRA Data, 2004
State or Territory Lending Institution
HQ Location LSBL$ (1,000) LSBL#
Institution Asset Size SSBL$ (1,000) SSBL# LSBL(2)$ (1,000) LSBL(2)#
(1) (2) (3) (4) (5) (6) (7)
Small Business Lending (<$1M) Micro Business Lending (<$100k) Small Business Lending ($100k-1M)
Capital One FSB VA 86,933 28,049 $10B-$50B 86,633 28,047 300 2 Valley View Bancshares, Inc. KS 82,437 713 $1B-$10B 16,961 491 65,476 222 JPMorgan Chase & Co. NY 80,517 6,537 >$50B 78,331 6,528 2,186 9 First State Bancshares, Inc. MO 77,697 807 <$1B 19,522 618 58,175 189 Cardinal Bancorp, Inc. MO 75,739 374 <$1B 7,986 192 67,753 182 Dickinson Financial Corporation MO 73,324 909 $1B-$10B 19,374 745 53,950 164 Arvest Bank Group, Inc. AR 65,981 515 $1B-$10B 12,034 353 53,947 162 Liberty Bancshares, Inc. MO 61,809 482 <$1B 9,275 330 52,534 152 Wood & Huston Bancorporation MO 60,390 1,329 <$1B 23,379 1,192 37,011 137 Southwest Missouri Bancorp. MO 58,669 1,073 <$1B 25,801 956 32,868 117 Pulaski Bank MO 58,333 222 <$1B 4,514 75 53,819 147 Jefferson County Bancshares MO 54,107 348 <$1B 9,169 207 44,938 141 Unity Bancshares L.L.C. MO 53,107 373 <$1B 8,819 247 44,288 126 Gold Banc Corporation, Inc. KS 52,498 334 $1B-$10B 8,901 211 43,597 123 Reliable Community Bancshare MO 51,463 503 <$1B 11,775 378 39,688 125
First Interstate Bancsystem MT 204,620 2,394 $1B-$10B 60,018 1,902 144,602 492 Glacier Bancorp, Inc. MT 153,535 1,570 $1B-$10B 38,773 1,217 114,762 353 Wells Fargo & Company CA 138,516 3,564 >$50B 76,190 3,362 62,326 202 Stockman Financial Corporation MT 99,758 1,102 $1B-$10B 25,569 856 74,189 246 Mountain West Financial Corp. MT 84,846 716 <$1B 17,450 514 67,396 202 Inter-Mountain Bancorp, Inc. MT 63,009 889 <$1B 22,124 749 40,885 140 U.S. Bancorp MN 57,492 1,135 >$50B 15,311 1,021 42,181 114
Lauritzen Corporation NE 406,003 4,603 $10B-$50B 88,225 3,686 317,778 917 Wells Fargo & Company CA 237,455 5,524 >$50B 106,942 5,153 130,513 371 Pinnacle Bancorp, Inc. NE 204,792 3,097 $1B-$10B 65,760 2,624 139,032 473 U.S. Bancorp MN 171,954 3,299 >$50B 53,837 2,970 118,117 329 Great Western Bancorporation NE 139,505 1,043 $1B-$10B 24,883 691 114,622 352 Tierone Bank NE 92,375 1,031 $1B-$10B 24,318 816 68,057 215 Farmers & Merchants Investment NE 82,286 665 $1B-$10B 23,236 489 59,050 176 American National Corporation NE 77,811 694 $1B-$10B 17,238 509 60,573 185 Security National Corporation NE 73,253 475 <$1B 12,676 300 60,577 175 Hometown Banc Corp. NE 72,518 929 <$1B 23,284 773 49,234 156 Northwest Federal Savings Bank IA 57,515 313 <$1B 4,555 98 52,960 215
Wells Fargo & Company CA 380,726 13,669 >$50B 253,799 13,291 126,927 378 Zions Bancorporation UT 280,323 1,566 $10B-$50B 35,709 954 244,614 612 Western Alliance Bancorporation NV 178,458 898 $1B-$10B 27,103 494 151,355 404 Bank of America Corporation NC 138,962 4,475 >$50B 60,345 4,281 78,617 194 U.S. Bancorp MN 115,759 1,835 >$50B 19,095 1,616 96,664 219 Silver State Bancorp NV 111,015 358 <$1B 6,509 126 104,506 232 Capitol Bancorp Ltd. MI 93,265 429 $1B-$10B 11,103 198 82,162 231 First National Bank Holding AZ 77,655 272 $1B-$10B 4,815 92 72,840 180 Colonial Bancgroup, Inc. AL 56,886 228 $10B-$50B 5,487 101 51,399 127 Citigroup, Inc. NY 51,112 9,358 >$50B 48,375 9,345 2,737 13
TD Banknorth, Inc. ME 379,351 3,288 . 81,469 2,338 297,882 950 Citizens Bank of Massachusetts MA 200,033 3,254 >$50B 83,764 2,879 116,269 375
Montana
Nevada
Nebraska
New Hampshire
Page 71

Table 4A. Top Small Business Lenders by State and Territory Using CRA Data, 2004
State or Territory Lending Institution
HQ Location LSBL$ (1,000) LSBL#
Institution Asset Size SSBL$ (1,000) SSBL# LSBL(2)$ (1,000) LSBL(2)#
(1) (2) (3) (4) (5) (6) (7)
Small Business Lending (<$1M) Micro Business Lending (<$100k) Small Business Lending ($100k-1M)
Sovereign Bank PA 126,329 683 >$50B 17,745 376 108,584 307 Chittenden Corporation VT 120,584 735 $1B-$10B 17,737 429 102,847 306 Bank of America Corporation NC 89,992 2,469 >$50B 41,717 2,347 48,275 122
Wachovia Corporation NC 1,382,166 10,490 >$50B 343,919 7,734 1,038,247 2,756 PNC Financial Services Group PA 918,717 12,822 >$50B 418,720 11,461 499,997 1,361 Bank of America Corporation NC 595,372 18,422 >$50B 324,669 17,673 270,703 749 JPMorgan Chase & Co. NY 494,264 21,831 >$50B 413,100 21,449 81,164 382 Commerce Bancorp, Inc. NJ 426,062 3,125 $10B-$50B 78,303 2,156 347,759 969 Valley National Bancorp NJ 417,017 2,280 $10B-$50B 56,505 1,414 360,512 866 MBNA Corporation DE 218,404 31,211 >$50B 186,396 31,109 32,008 102 Citigroup, Inc. NY 202,709 37,031 >$50B 188,718 36,990 13,991 41 Sun Bancorp, Inc. NJ 201,771 1,129 $1B-$10B 35,150 695 166,621 434 Wells Fargo & Company CA 192,863 5,987 >$50B 185,323 5,927 7,540 60 Fulton Financial Corporation PA 186,984 1,122 $10B-$50B 30,110 655 156,874 467 Capital One FSB VA 177,488 52,527 $10B-$50B 176,638 52,521 850 6 Sovereign Bank PA 164,339 1,173 >$50B 39,499 833 124,840 340 North Fork Bancorporation, Inc. NY 152,929 1,029 >$50B 30,565 680 122,364 349 Lakeland Bancorp, Inc. NJ 150,511 743 $1B-$10B 20,029 378 130,482 365 Yardville National Bancorp NJ 146,569 715 $1B-$10B 17,734 352 128,835 363 Hudson United Bancorp NJ 110,615 596 $1B-$10B 15,677 325 94,938 271 American Express Centurion Bank UT 95,039 10,910 $10B-$50B 94,535 10,907 504 3 Atlantic Bank of New York NY 94,865 7,240 $1B-$10B 62,233 7,111 32,632 129 Amboy Bancorporation NJ 90,416 399 $1B-$10B 8,089 179 82,327 220 Minotola National Bank NJ 86,895 609 <$1B 17,943 413 68,952 196 Advanta Bank Corporation UT 86,342 10,203 $1B-$10B 86,342 10,203 - - HSBC Bank USA NY 68,231 632 >$50B 34,063 559 34,168 73 Interchange Financial Services NJ 65,821 300 $1B-$10B 11,544 154 54,277 146 1st Constitution Bancorp NJ 51,834 173 <$1B 2,952 58 48,882 115 The Pitney Bowes Bank UT 51,242 9,158 <$1B 51,039 9,157 203 1
Wells Fargo & Company CA 346,962 7,650 >$50B 184,821 7,184 162,141 466 First State Bancorporation NM 177,813 1,458 $1B-$10B 31,367 999 146,446 459 Trinity Capital Corporation NM 123,827 651 $1B-$10B 12,541 329 111,286 322 First Artesia Bancshares, Inc. NM 86,094 817 <$1B 20,846 553 65,248 264 Bank of America Corporation NC 84,896 2,320 >$50B 34,797 2,168 50,099 152 Heartland Financial USA, Inc. IA 82,027 605 $1B-$10B 16,851 387 65,176 218 BOK Financial Corporation OK 78,976 347 $10B-$50B 10,324 184 68,652 163 Bank of the West CA 78,108 661 >$50B 16,566 467 61,542 194 New Mexico Banquest Corp. NM 54,802 323 <$1B 7,658 193 47,144 130
JPMorgan Chase & Co. NY 3,040,063 80,017 >$50B 2,083,697 76,140 956,366 3,877 SBC Bank USA NY 1,600,183 17,035 >$50B 662,984 14,458 937,199 2,577 Citigroup, Inc. NY 1,383,673 83,558 >$50B 663,113 81,531 720,560 2,027 Allfirst Bank MD 1,282,353 7,957 >$50B 229,909 5,208 1,052,444 2,749 North Fork Bancorporation, Inc. NY 1,168,638 11,151 >$50B 383,203 9,043 785,435 2,108 Bank of America Corporation NC 749,814 24,353 >$50B 433,141 23,530 316,673 823 Wells Fargo & Company CA 405,479 12,518 >$50B 386,207 12,374 19,272 144 MBNA Corporation DE 345,401 44,925 >$50B 275,152 44,698 70,249 227
New Mexico
New Jersey
New York
Page 72
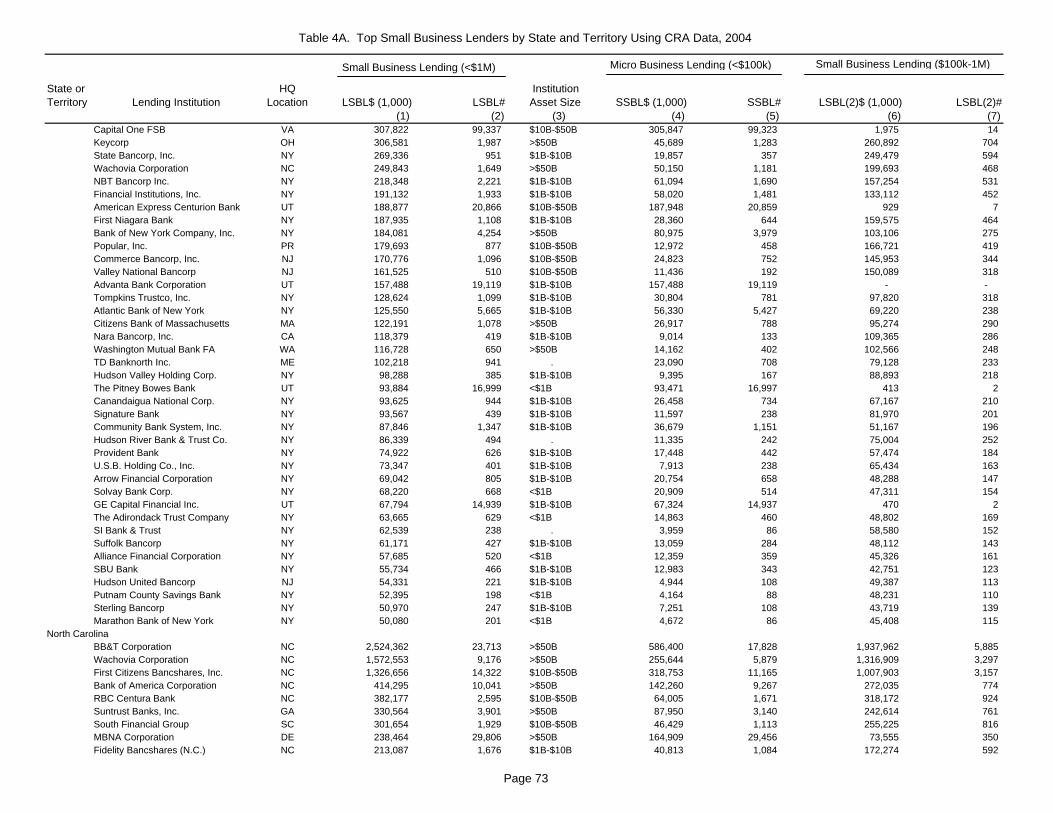
Table 4A. Top Small Business Lenders by State and Territory Using CRA Data, 2004
State or Territory Lending Institution
HQ Location LSBL$ (1,000) LSBL#
Institution Asset Size SSBL$ (1,000) SSBL# LSBL(2)$ (1,000) LSBL(2)#
(1) (2) (3) (4) (5) (6) (7)
Small Business Lending (<$1M) Micro Business Lending (<$100k) Small Business Lending ($100k-1M)
Capital One FSB VA 307,822 99,337 $10B-$50B 305,847 99,323 1,975 14 Keycorp OH 306,581 1,987 >$50B 45,689 1,283 260,892 704 State Bancorp, Inc. NY 269,336 951 $1B-$10B 19,857 357 249,479 594 Wachovia Corporation NC 249,843 1,649 >$50B 50,150 1,181 199,693 468 NBT Bancorp Inc. NY 218,348 2,221 $1B-$10B 61,094 1,690 157,254 531 Financial Institutions, Inc. NY 191,132 1,933 $1B-$10B 58,020 1,481 133,112 452 American Express Centurion Bank UT 188,877 20,866 $10B-$50B 187,948 20,859 929 7 First Niagara Bank NY 187,935 1,108 $1B-$10B 28,360 644 159,575 464 Bank of New York Company, Inc. NY 184,081 4,254 >$50B 80,975 3,979 103,106 275 Popular, Inc. PR 179,693 877 $10B-$50B 12,972 458 166,721 419 Commerce Bancorp, Inc. NJ 170,776 1,096 $10B-$50B 24,823 752 145,953 344 Valley National Bancorp NJ 161,525 510 $10B-$50B 11,436 192 150,089 318 Advanta Bank Corporation UT 157,488 19,119 $1B-$10B 157,488 19,119 - - Tompkins Trustco, Inc. NY 128,624 1,099 $1B-$10B 30,804 781 97,820 318 Atlantic Bank of New York NY 125,550 5,665 $1B-$10B 56,330 5,427 69,220 238 Citizens Bank of Massachusetts MA 122,191 1,078 >$50B 26,917 788 95,274 290 Nara Bancorp, Inc. CA 118,379 419 $1B-$10B 9,014 133 109,365 286 Washington Mutual Bank FA WA 116,728 650 >$50B 14,162 402 102,566 248 TD Banknorth Inc. ME 102,218 941 . 23,090 708 79,128 233 Hudson Valley Holding Corp. NY 98,288 385 $1B-$10B 9,395 167 88,893 218 The Pitney Bowes Bank UT 93,884 16,999 <$1B 93,471 16,997 413 2 Canandaigua National Corp. NY 93,625 944 $1B-$10B 26,458 734 67,167 210 Signature Bank NY 93,567 439 $1B-$10B 11,597 238 81,970 201 Community Bank System, Inc. NY 87,846 1,347 $1B-$10B 36,679 1,151 51,167 196 Hudson River Bank & Trust Co. NY 86,339 494 . 11,335 242 75,004 252 Provident Bank NY 74,922 626 $1B-$10B 17,448 442 57,474 184 U.S.B. Holding Co., Inc. NY 73,347 401 $1B-$10B 7,913 238 65,434 163 Arrow Financial Corporation NY 69,042 805 $1B-$10B 20,754 658 48,288 147 Solvay Bank Corp. NY 68,220 668 <$1B 20,909 514 47,311 154 GE Capital Financial Inc. UT 67,794 14,939 $1B-$10B 67,324 14,937 470 2 The Adirondack Trust Company NY 63,665 629 <$1B 14,863 460 48,802 169 SI Bank & Trust NY 62,539 238 . 3,959 86 58,580 152 Suffolk Bancorp NY 61,171 427 $1B-$10B 13,059 284 48,112 143 Alliance Financial Corporation NY 57,685 520 <$1B 12,359 359 45,326 161 SBU Bank NY 55,734 466 $1B-$10B 12,983 343 42,751 123 Hudson United Bancorp NJ 54,331 221 $1B-$10B 4,944 108 49,387 113 Putnam County Savings Bank NY 52,395 198 <$1B 4,164 88 48,231 110 Sterling Bancorp NY 50,970 247 $1B-$10B 7,251 108 43,719 139 Marathon Bank of New York NY 50,080 201 <$1B 4,672 86 45,408 115
BB&T Corporation NC 2,524,362 23,713 >$50B 586,400 17,828 1,937,962 5,885 Wachovia Corporation NC 1,572,553 9,176 >$50B 255,644 5,879 1,316,909 3,297 First Citizens Bancshares, Inc. NC 1,326,656 14,322 $10B-$50B 318,753 11,165 1,007,903 3,157 Bank of America Corporation NC 414,295 10,041 >$50B 142,260 9,267 272,035 774 RBC Centura Bank NC 382,177 2,595 $10B-$50B 64,005 1,671 318,172 924 Suntrust Banks, Inc. GA 330,564 3,901 >$50B 87,950 3,140 242,614 761 South Financial Group SC 301,654 1,929 $10B-$50B 46,429 1,113 255,225 816 MBNA Corporation DE 238,464 29,806 >$50B 164,909 29,456 73,555 350 Fidelity Bancshares (N.C.) NC 213,087 1,676 $1B-$10B 40,813 1,084 172,274 592
North Carolina
Page 73

Table 4A. Top Small Business Lenders by State and Territory Using CRA Data, 2004
State or Territory Lending Institution
HQ Location LSBL$ (1,000) LSBL#
Institution Asset Size SSBL$ (1,000) SSBL# LSBL(2)$ (1,000) LSBL(2)#
(1) (2) (3) (4) (5) (6) (7)
Small Business Lending (<$1M) Micro Business Lending (<$100k) Small Business Lending ($100k-1M)
First Charter Corporation NC 152,074 1,024 $1B-$10B 28,296 632 123,778 392 LSB Bancshares, Inc. NC 149,582 1,119 <$1B 32,602 741 116,980 378 Citigroup, Inc. NY 144,697 27,223 >$50B 141,150 27,212 3,547 11 Bank of Granite Corporation NC 133,796 1,520 $1B-$10B 35,063 1,175 98,733 345 Southern Bancshares (N.C.) NC 133,089 1,491 $1B-$10B 35,875 1,156 97,214 335 Wells Fargo & Company CA 120,130 4,078 >$50B 116,517 4,046 3,613 32 Capital One FSB VA 112,904 35,172 $10B-$50B 112,754 35,171 150 1 Yadkin Valley Bank & Trust Co. NC 112,391 946 <$1B 22,112 638 90,279 308 Regions Financial Corporation AL 108,765 613 >$50B 14,635 364 94,130 249 ECB Bancorp, Inc. NC 108,205 914 <$1B 22,564 610 85,641 304 FNB Corp. NC 107,072 728 <$1B 22,036 488 85,036 240 First Bancorp NC 103,506 1,572 $1B-$10B 34,676 1,315 68,830 257 JPMorgan Chase & Co. NY 97,464 7,492 >$50B 92,165 7,480 5,299 12 FNB Financial Services Corp. NC 97,200 611 <$1B 10,959 253 86,241 358 Peoples Bancorp of North Carolina NC 83,426 877 <$1B 23,452 665 59,974 212 Southern Community Financial NC 83,167 623 $1B-$10B 17,339 410 65,828 213 First South Bancorp, Inc. NC 77,058 639 <$1B 16,536 443 60,522 196 GE Capital Financial, Inc. UT 74,319 20,112 $1B-$10B 73,374 20,109 945 3 United Community Banks, Inc. GA 62,710 863 $1B-$10B 21,318 698 41,392 165 BNC Bancorp NC 61,314 432 <$1B 11,042 282 50,272 150 Four Oaks Fincorp, Inc. NC 55,069 786 <$1B 20,538 668 34,531 118 High Point Bank Corporation NC 54,782 493 <$1B 12,195 344 42,587 149 Advanta Bank Corporation UT 54,157 6,434 $1B-$10B 54,157 6,434 - - U.S. Bancorp MN 53,334 2,065 >$50B 28,634 1,983 24,700 82 First National Bank NC 53,113 643 <$1B 15,905 508 37,208 135
Wells Fargo & Company CA 210,565 2,597 >$50B 59,221 2,183 151,344 414 State Bankshares, Inc. ND 145,208 980 $1B-$10B 23,871 651 121,337 329 Otto Bremer Foundation MN 129,858 1,061 $1B-$10B 25,858 739 104,000 322 Watford City Bancshares, Inc. ND 87,011 940 <$1B 21,826 703 65,185 237 Alerus Financial Corporation ND 70,321 429 <$1B 11,659 263 58,662 166 U.S. Bancorp MN 52,376 1,360 >$50B 14,828 1,272 37,548 88
Fifth Third Bancorp OH 1,919,121 8,686 >$50B 216,826 4,049 1,702,295 4,637 National City Corporation OH 988,949 10,536 >$50B 185,217 8,223 803,732 2,313 Huntington Bancshares, Inc. OH 759,379 8,148 $10B-$50B 254,058 6,738 505,321 1,410 JPMorgan Chase & Co. NY 643,605 19,745 >$50B 255,962 18,691 387,643 1,054 U.S. Bancorp MN 610,680 10,633 >$50B 152,655 9,314 458,025 1,319 Firstmerit Corporation OH 577,063 2,596 $10B-$50B 69,721 1,229 507,342 1,367 Keycorp OH 542,754 3,009 >$50B 68,700 1,759 474,054 1,250 Park National Corporation OH 467,395 4,139 $1B-$10B 109,629 2,978 357,766 1,161 Sky Financial Group, Inc. OH 398,802 2,699 $10B-$50B 71,338 1,708 327,464 991 First Federal Bank of The Midwest OH 204,544 1,575 $1B-$10B 39,850 987 164,694 588 Wells Fargo & Company CA 195,426 6,633 >$50B 182,733 6,569 12,693 64 Citigroup, Inc. NY 168,161 33,762 >$50B 166,644 33,751 1,517 11 MBNA Corporation DE 159,675 25,243 >$50B 137,341 25,154 22,334 89 First Financial Bancorp OH 148,267 1,428 $1B-$10B 35,903 1,074 112,364 354 PNC Financial Services Group PA 148,088 1,644 >$50B 47,961 1,368 100,127 276 Capital One FSB VA 144,851 46,481 $10B-$50B 144,251 46,477 600 4
Ohio
North Dakota
Page 74
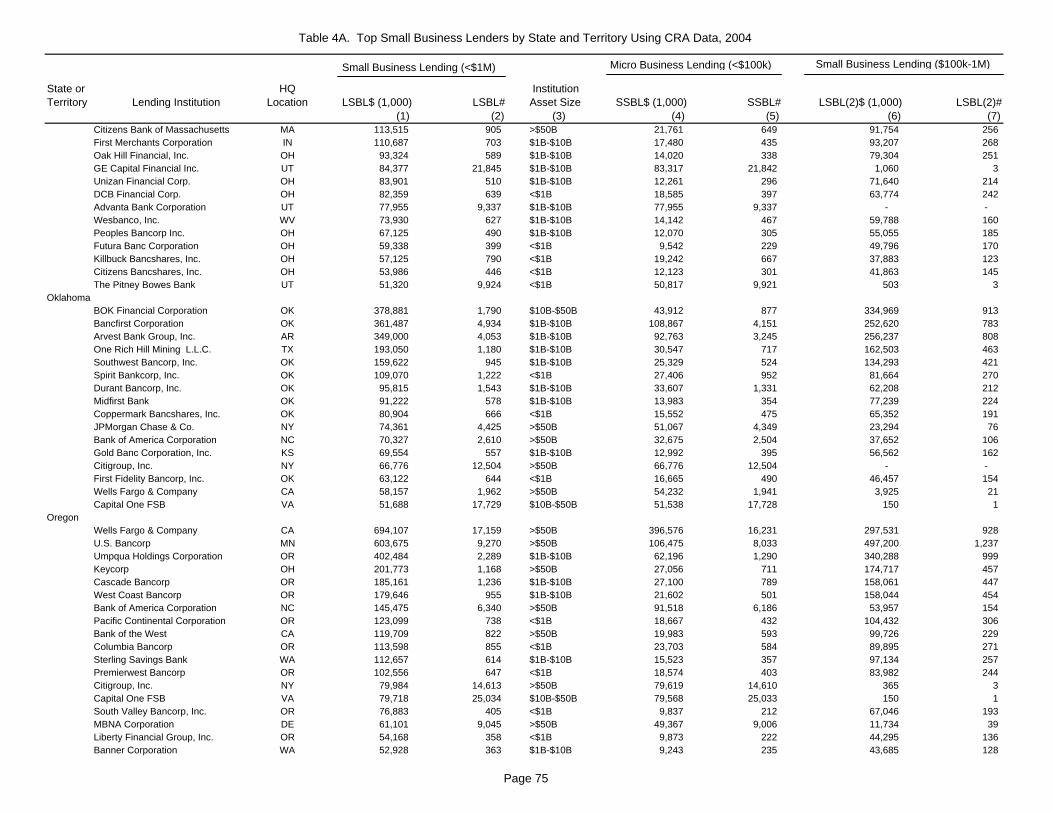
Table 4A. Top Small Business Lenders by State and Territory Using CRA Data, 2004
State or Territory Lending Institution
HQ Location LSBL$ (1,000) LSBL#
Institution Asset Size SSBL$ (1,000) SSBL# LSBL(2)$ (1,000) LSBL(2)#
(1) (2) (3) (4) (5) (6) (7)
Small Business Lending (<$1M) Micro Business Lending (<$100k) Small Business Lending ($100k-1M)
Citizens Bank of Massachusetts MA 113,515 905 >$50B 21,761 649 91,754 256 First Merchants Corporation IN 110,687 703 $1B-$10B 17,480 435 93,207 268 Oak Hill Financial, Inc. OH 93,324 589 $1B-$10B 14,020 338 79,304 251 GE Capital Financial Inc. UT 84,377 21,845 $1B-$10B 83,317 21,842 1,060 3 Unizan Financial Corp. OH 83,901 510 $1B-$10B 12,261 296 71,640 214 DCB Financial Corp. OH 82,359 639 <$1B 18,585 397 63,774 242 Advanta Bank Corporation UT 77,955 9,337 $1B-$10B 77,955 9,337 - - Wesbanco, Inc. WV 73,930 627 $1B-$10B 14,142 467 59,788 160 Peoples Bancorp Inc. OH 67,125 490 $1B-$10B 12,070 305 55,055 185 Futura Banc Corporation OH 59,338 399 <$1B 9,542 229 49,796 170 Killbuck Bancshares, Inc. OH 57,125 790 <$1B 19,242 667 37,883 123 Citizens Bancshares, Inc. OH 53,986 446 <$1B 12,123 301 41,863 145 The Pitney Bowes Bank UT 51,320 9,924 <$1B 50,817 9,921 503 3
BOK Financial Corporation OK 378,881 1,790 $10B-$50B 43,912 877 334,969 913 Bancfirst Corporation OK 361,487 4,934 $1B-$10B 108,867 4,151 252,620 783 Arvest Bank Group, Inc. AR 349,000 4,053 $1B-$10B 92,763 3,245 256,237 808 One Rich Hill Mining L.L.C. TX 193,050 1,180 $1B-$10B 30,547 717 162,503 463 Southwest Bancorp, Inc. OK 159,622 945 $1B-$10B 25,329 524 134,293 421 Spirit Bankcorp, Inc. OK 109,070 1,222 <$1B 27,406 952 81,664 270 Durant Bancorp, Inc. OK 95,815 1,543 $1B-$10B 33,607 1,331 62,208 212 Midfirst Bank OK 91,222 578 $1B-$10B 13,983 354 77,239 224 Coppermark Bancshares, Inc. OK 80,904 666 <$1B 15,552 475 65,352 191 JPMorgan Chase & Co. NY 74,361 4,425 >$50B 51,067 4,349 23,294 76 Bank of America Corporation NC 70,327 2,610 >$50B 32,675 2,504 37,652 106 Gold Banc Corporation, Inc. KS 69,554 557 $1B-$10B 12,992 395 56,562 162 Citigroup, Inc. NY 66,776 12,504 >$50B 66,776 12,504 - - First Fidelity Bancorp, Inc. OK 63,122 644 <$1B 16,665 490 46,457 154 Wells Fargo & Company CA 58,157 1,962 >$50B 54,232 1,941 3,925 21 Capital One FSB VA 51,688 17,729 $10B-$50B 51,538 17,728 150 1
Wells Fargo & Company CA 694,107 17,159 >$50B 396,576 16,231 297,531 928 U.S. Bancorp MN 603,675 9,270 >$50B 106,475 8,033 497,200 1,237 Umpqua Holdings Corporation OR 402,484 2,289 $1B-$10B 62,196 1,290 340,288 999 Keycorp OH 201,773 1,168 >$50B 27,056 711 174,717 457 Cascade Bancorp OR 185,161 1,236 $1B-$10B 27,100 789 158,061 447 West Coast Bancorp OR 179,646 955 $1B-$10B 21,602 501 158,044 454 Bank of America Corporation NC 145,475 6,340 >$50B 91,518 6,186 53,957 154 Pacific Continental Corporation OR 123,099 738 <$1B 18,667 432 104,432 306 Bank of the West CA 119,709 822 >$50B 19,983 593 99,726 229 Columbia Bancorp OR 113,598 855 <$1B 23,703 584 89,895 271 Sterling Savings Bank WA 112,657 614 $1B-$10B 15,523 357 97,134 257 Premierwest Bancorp OR 102,556 647 <$1B 18,574 403 83,982 244 Citigroup, Inc. NY 79,984 14,613 >$50B 79,619 14,610 365 3 Capital One FSB VA 79,718 25,034 $10B-$50B 79,568 25,033 150 1 South Valley Bancorp, Inc. OR 76,883 405 <$1B 9,837 212 67,046 193 MBNA Corporation DE 61,101 9,045 >$50B 49,367 9,006 11,734 39 Liberty Financial Group, Inc. OR 54,168 358 <$1B 9,873 222 44,295 136 Banner Corporation WA 52,928 363 $1B-$10B 9,243 235 43,685 128
Oregon
Oklahoma
Page 75
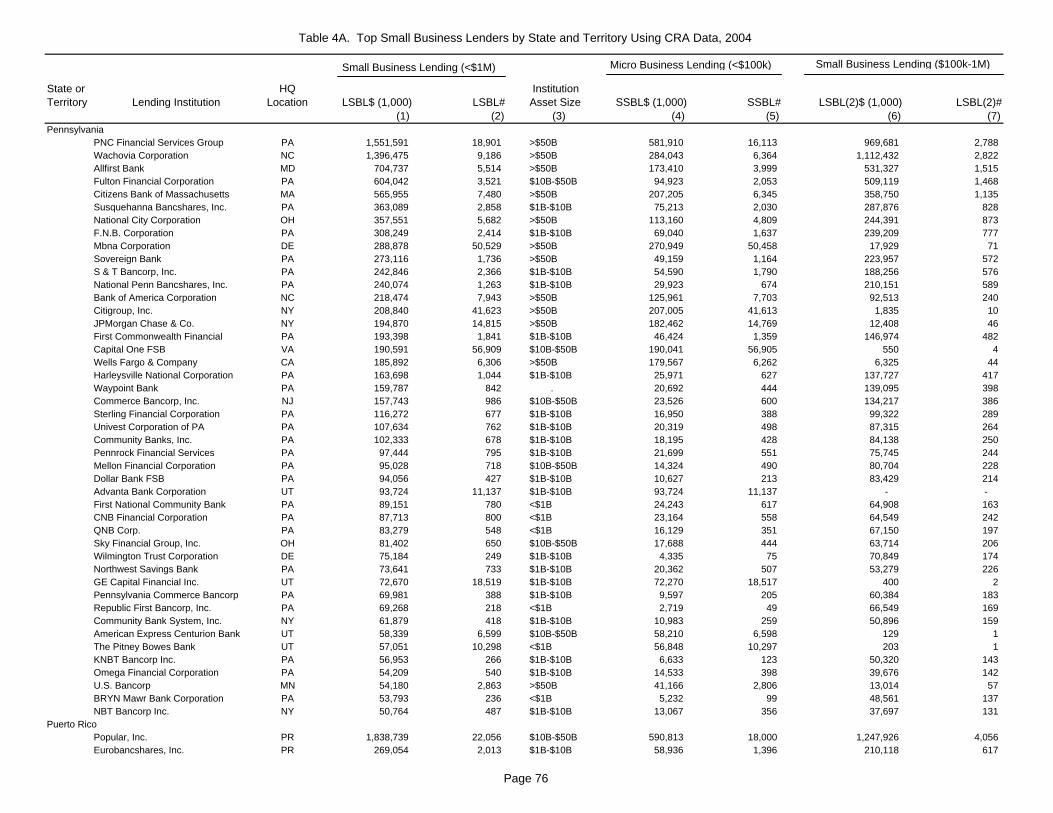
Table 4A. Top Small Business Lenders by State and Territory Using CRA Data, 2004
State or Territory Lending Institution
HQ Location LSBL$ (1,000) LSBL#
Institution Asset Size SSBL$ (1,000) SSBL# LSBL(2)$ (1,000) LSBL(2)#
(1) (2) (3) (4) (5) (6) (7)
Small Business Lending (<$1M) Micro Business Lending (<$100k) Small Business Lending ($100k-1M)
PNC Financial Services Group PA 1,551,591 18,901 >$50B 581,910 16,113 969,681 2,788 Wachovia Corporation NC 1,396,475 9,186 >$50B 284,043 6,364 1,112,432 2,822 Allfirst Bank MD 704,737 5,514 >$50B 173,410 3,999 531,327 1,515 Fulton Financial Corporation PA 604,042 3,521 $10B-$50B 94,923 2,053 509,119 1,468 Citizens Bank of Massachusetts MA 565,955 7,480 >$50B 207,205 6,345 358,750 1,135 Susquehanna Bancshares, Inc. PA 363,089 2,858 $1B-$10B 75,213 2,030 287,876 828 National City Corporation OH 357,551 5,682 >$50B 113,160 4,809 244,391 873 F.N.B. Corporation PA 308,249 2,414 $1B-$10B 69,040 1,637 239,209 777 Mbna Corporation DE 288,878 50,529 >$50B 270,949 50,458 17,929 71 Sovereign Bank PA 273,116 1,736 >$50B 49,159 1,164 223,957 572 S & T Bancorp, Inc. PA 242,846 2,366 $1B-$10B 54,590 1,790 188,256 576 National Penn Bancshares, Inc. PA 240,074 1,263 $1B-$10B 29,923 674 210,151 589 Bank of America Corporation NC 218,474 7,943 >$50B 125,961 7,703 92,513 240 Citigroup, Inc. NY 208,840 41,623 >$50B 207,005 41,613 1,835 10 JPMorgan Chase & Co. NY 194,870 14,815 >$50B 182,462 14,769 12,408 46 First Commonwealth Financial PA 193,398 1,841 $1B-$10B 46,424 1,359 146,974 482 Capital One FSB VA 190,591 56,909 $10B-$50B 190,041 56,905 550 4 Wells Fargo & Company CA 185,892 6,306 >$50B 179,567 6,262 6,325 44 Harleysville National Corporation PA 163,698 1,044 $1B-$10B 25,971 627 137,727 417 Waypoint Bank PA 159,787 842 . 20,692 444 139,095 398 Commerce Bancorp, Inc. NJ 157,743 986 $10B-$50B 23,526 600 134,217 386 Sterling Financial Corporation PA 116,272 677 $1B-$10B 16,950 388 99,322 289 Univest Corporation of PA PA 107,634 762 $1B-$10B 20,319 498 87,315 264 Community Banks, Inc. PA 102,333 678 $1B-$10B 18,195 428 84,138 250 Pennrock Financial Services PA 97,444 795 $1B-$10B 21,699 551 75,745 244 Mellon Financial Corporation PA 95,028 718 $10B-$50B 14,324 490 80,704 228 Dollar Bank FSB PA 94,056 427 $1B-$10B 10,627 213 83,429 214 Advanta Bank Corporation UT 93,724 11,137 $1B-$10B 93,724 11,137 - - First National Community Bank PA 89,151 780 <$1B 24,243 617 64,908 163 CNB Financial Corporation PA 87,713 800 <$1B 23,164 558 64,549 242 QNB Corp. PA 83,279 548 <$1B 16,129 351 67,150 197 Sky Financial Group, Inc. OH 81,402 650 $10B-$50B 17,688 444 63,714 206 Wilmington Trust Corporation DE 75,184 249 $1B-$10B 4,335 75 70,849 174 Northwest Savings Bank PA 73,641 733 $1B-$10B 20,362 507 53,279 226 GE Capital Financial Inc. UT 72,670 18,519 $1B-$10B 72,270 18,517 400 2 Pennsylvania Commerce Bancorp PA 69,981 388 $1B-$10B 9,597 205 60,384 183 Republic First Bancorp, Inc. PA 69,268 218 <$1B 2,719 49 66,549 169 Community Bank System, Inc. NY 61,879 418 $1B-$10B 10,983 259 50,896 159 American Express Centurion Bank UT 58,339 6,599 $10B-$50B 58,210 6,598 129 1 The Pitney Bowes Bank UT 57,051 10,298 <$1B 56,848 10,297 203 1 KNBT Bancorp Inc. PA 56,953 266 $1B-$10B 6,633 123 50,320 143 Omega Financial Corporation PA 54,209 540 $1B-$10B 14,533 398 39,676 142 U.S. Bancorp MN 54,180 2,863 >$50B 41,166 2,806 13,014 57 BRYN Mawr Bank Corporation PA 53,793 236 <$1B 5,232 99 48,561 137 NBT Bancorp Inc. NY 50,764 487 $1B-$10B 13,067 356 37,697 131
Popular, Inc. PR 1,838,739 22,056 $10B-$50B 590,813 18,000 1,247,926 4,056 Eurobancshares, Inc. PR 269,054 2,013 $1B-$10B 58,936 1,396 210,118 617
Pennsylvania
Puerto Rico
Page 76

Table 4A. Top Small Business Lenders by State and Territory Using CRA Data, 2004
State or Territory Lending Institution
HQ Location LSBL$ (1,000) LSBL#
Institution Asset Size SSBL$ (1,000) SSBL# LSBL(2)$ (1,000) LSBL(2)#
(1) (2) (3) (4) (5) (6) (7)
Small Business Lending (<$1M) Micro Business Lending (<$100k) Small Business Lending ($100k-1M)
Banco Santander PR 223,847 2,347 $1B-$10B 56,596 1,877 167,251 470 W Holding Company, Inc. PR 221,284 969 $10B-$50B 20,457 439 200,827 530 First Bancorp PR 188,962 1,017 $10B-$50B 20,586 363 168,376 654 BBVA Puerto Rico PR 151,422 1,689 $1B-$10B 44,835 1,349 106,587 340 R&G Financial Corporation PR 108,602 600 $1B-$10B 14,944 340 93,658 260 Doral Financial Corporation PR 55,978 241 $10B-$50B 3,208 49 52,770 192
Citizens Bank of Massachusetts MA 215,438 2,973 >$50B 78,014 2,592 137,424 381 Bank of America Corporation NC 116,903 2,254 >$50B 38,808 2,041 78,095 213 Bancorp Rhode Island, Inc. RI 116,872 677 $1B-$10B 20,883 391 95,989 286 Washington Trust Bancorp, Inc. RI 94,727 583 $1B-$10B 11,397 328 83,330 255 Sovereign Bank PA 84,619 479 >$50B 13,807 293 70,812 186
Wachovia Corporation NC 675,023 3,334 >$50B 80,955 1,786 594,068 1,548 BB&T Corporation NC 673,222 6,418 >$50B 153,082 4,781 520,140 1,637 Synovus Financial Corp. GA 487,961 4,468 $10B-$50B 111,665 3,283 376,296 1,185 First Citizens Bancorporation SC 296,349 3,407 $1B-$10B 84,111 2,670 212,238 737 Bank of America Corporation NC 280,469 5,302 >$50B 83,657 4,751 196,812 551 SCBT Financial Corporation SC 271,034 2,615 $1B-$10B 71,901 1,905 199,133 710 South Financial Group SC 212,937 2,005 $10B-$50B 47,791 1,459 165,146 546 CNB Corporation SC 193,639 3,227 <$1B 70,701 2,732 122,938 495 Regions Financial Corporation AL 147,377 1,076 >$50B 25,783 713 121,594 363 Palmetto Bancshares, Inc. SC 121,651 1,502 $1B-$10B 36,009 1,211 85,642 291 Summit Financial Corporation SC 67,027 464 <$1B 11,531 285 55,496 179 MBNA Corporation DE 63,143 11,333 >$50B 60,267 11,318 2,876 15 Coastal Federal Savings Bank SC 63,139 680 $1B-$10B 18,893 529 44,246 151 Suntrust Banks, Inc. GA 61,006 482 >$50B 10,770 336 50,236 146 Community Capital Corporation SC 60,640 743 <$1B 16,991 582 43,649 161 First Federal of Charleston SC 60,143 569 $1B-$10B 16,403 421 43,740 148 Enterprise Bank of S.C. SC 59,020 1,352 <$1B 24,258 1,199 34,762 153 RBC Centura Bank NC 56,013 184 $10B-$50B 2,983 64 53,030 120 Citigroup, Inc. NY 54,814 11,028 >$50B 53,345 11,021 1,469 7 Capital One FSB VA 50,772 15,810 $10B-$50B 50,347 15,807 425 3
Wells Fargo & Company CA 327,605 4,453 >$50B 101,295 3,810 226,310 643 U.S. Bancorp MN 133,916 1,336 >$50B 21,612 1,024 112,304 312 Minnehaha Banshares, Inc. SD 133,284 964 <$1B 23,305 681 109,979 283 Dacotah Banks, Inc. SD 118,028 1,718 $1B-$10B 32,855 1,403 85,173 315 Great Western Bancorporation NE 106,068 1,116 $1B-$10B 25,695 831 80,373 285 South Dakota Bancshares, Inc. SD 58,811 561 <$1B 13,978 426 44,833 135
First Horizon National Corp. TN 1,017,755 6,848 $10B-$50B 189,900 4,418 827,855 2,430 Amsouth Bancorporation AL 827,254 13,565 >$50B 398,282 12,448 428,972 1,117 Suntrust Banks, Inc. GA 685,398 6,404 >$50B 109,763 4,797 575,635 1,607 Regions Financial Corporation AL 500,959 3,632 >$50B 84,869 2,413 416,090 1,219 Greene County Bancshares, Inc. TN 196,777 2,144 $1B-$10B 45,504 1,679 151,273 465 Bank of America Corporation NC 175,041 4,261 >$50B 63,903 3,942 111,138 319 First South Bancorp, Inc. TN 168,244 3,270 $1B-$10B 49,912 2,882 118,332 388 BB&T Corporation NC 167,756 1,527 >$50B 37,547 1,127 130,209 400
South Dakota
South Carolina
Rhode Island
Tennessee
Page 77
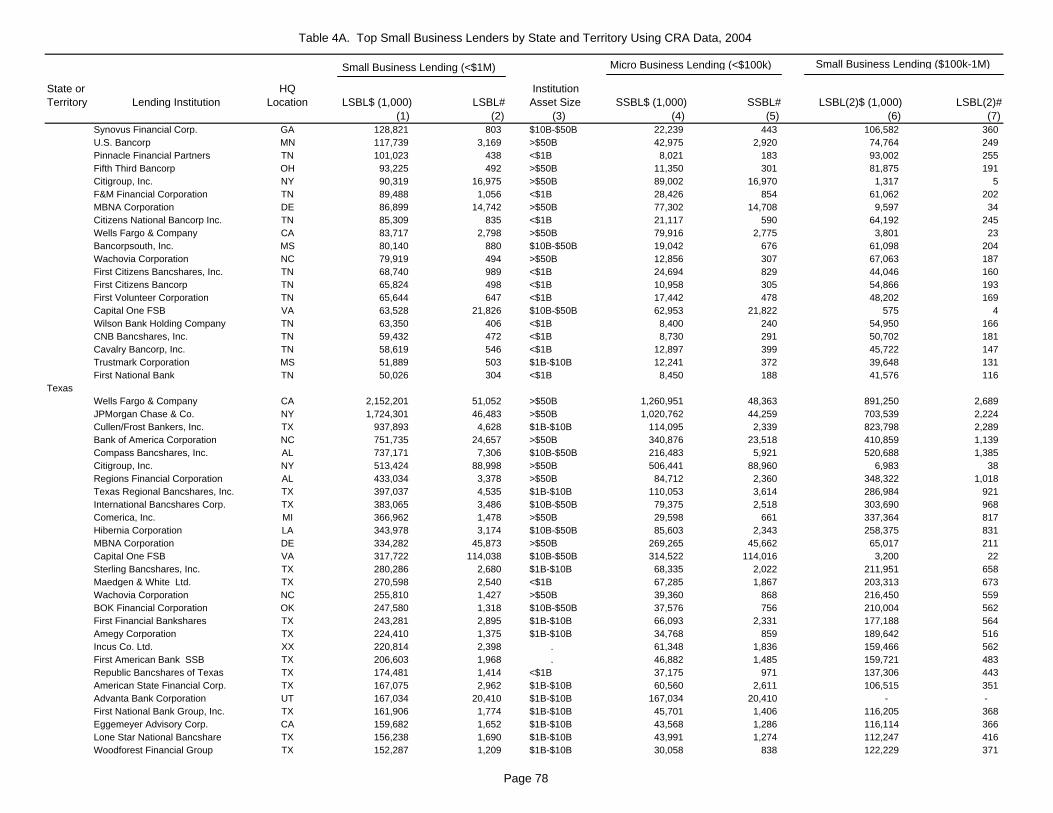
Table 4A. Top Small Business Lenders by State and Territory Using CRA Data, 2004
State or Territory Lending Institution
HQ Location LSBL$ (1,000) LSBL#
Institution Asset Size SSBL$ (1,000) SSBL# LSBL(2)$ (1,000) LSBL(2)#
(1) (2) (3) (4) (5) (6) (7)
Small Business Lending (<$1M) Micro Business Lending (<$100k) Small Business Lending ($100k-1M)
Synovus Financial Corp. GA 128,821 803 $10B-$50B 22,239 443 106,582 360 U.S. Bancorp MN 117,739 3,169 >$50B 42,975 2,920 74,764 249 Pinnacle Financial Partners TN 101,023 438 <$1B 8,021 183 93,002 255 Fifth Third Bancorp OH 93,225 492 >$50B 11,350 301 81,875 191 Citigroup, Inc. NY 90,319 16,975 >$50B 89,002 16,970 1,317 5 F&M Financial Corporation TN 89,488 1,056 <$1B 28,426 854 61,062 202 MBNA Corporation DE 86,899 14,742 >$50B 77,302 14,708 9,597 34 Citizens National Bancorp Inc. TN 85,309 835 <$1B 21,117 590 64,192 245 Wells Fargo & Company CA 83,717 2,798 >$50B 79,916 2,775 3,801 23 Bancorpsouth, Inc. MS 80,140 880 $10B-$50B 19,042 676 61,098 204 Wachovia Corporation NC 79,919 494 >$50B 12,856 307 67,063 187 First Citizens Bancshares, Inc. TN 68,740 989 <$1B 24,694 829 44,046 160 First Citizens Bancorp TN 65,824 498 <$1B 10,958 305 54,866 193 First Volunteer Corporation TN 65,644 647 <$1B 17,442 478 48,202 169 Capital One FSB VA 63,528 21,826 $10B-$50B 62,953 21,822 575 4 Wilson Bank Holding Company TN 63,350 406 <$1B 8,400 240 54,950 166 CNB Bancshares, Inc. TN 59,432 472 <$1B 8,730 291 50,702 181 Cavalry Bancorp, Inc. TN 58,619 546 <$1B 12,897 399 45,722 147 Trustmark Corporation MS 51,889 503 $1B-$10B 12,241 372 39,648 131 First National Bank TN 50,026 304 <$1B 8,450 188 41,576 116
Wells Fargo & Company CA 2,152,201 51,052 >$50B 1,260,951 48,363 891,250 2,689 JPMorgan Chase & Co. NY 1,724,301 46,483 >$50B 1,020,762 44,259 703,539 2,224 Cullen/Frost Bankers, Inc. TX 937,893 4,628 $1B-$10B 114,095 2,339 823,798 2,289 Bank of America Corporation NC 751,735 24,657 >$50B 340,876 23,518 410,859 1,139 Compass Bancshares, Inc. AL 737,171 7,306 $10B-$50B 216,483 5,921 520,688 1,385 Citigroup, Inc. NY 513,424 88,998 >$50B 506,441 88,960 6,983 38 Regions Financial Corporation AL 433,034 3,378 >$50B 84,712 2,360 348,322 1,018 Texas Regional Bancshares, Inc. TX 397,037 4,535 $1B-$10B 110,053 3,614 286,984 921 International Bancshares Corp. TX 383,065 3,486 $10B-$50B 79,375 2,518 303,690 968 Comerica, Inc. MI 366,962 1,478 >$50B 29,598 661 337,364 817 Hibernia Corporation LA 343,978 3,174 $10B-$50B 85,603 2,343 258,375 831 MBNA Corporation DE 334,282 45,873 >$50B 269,265 45,662 65,017 211 Capital One FSB VA 317,722 114,038 $10B-$50B 314,522 114,016 3,200 22 Sterling Bancshares, Inc. TX 280,286 2,680 $1B-$10B 68,335 2,022 211,951 658 Maedgen & White Ltd. TX 270,598 2,540 <$1B 67,285 1,867 203,313 673 Wachovia Corporation NC 255,810 1,427 >$50B 39,360 868 216,450 559 BOK Financial Corporation OK 247,580 1,318 $10B-$50B 37,576 756 210,004 562 First Financial Bankshares TX 243,281 2,895 $1B-$10B 66,093 2,331 177,188 564 Amegy Corporation TX 224,410 1,375 $1B-$10B 34,768 859 189,642 516 Incus Co. Ltd. XX 220,814 2,398 . 61,348 1,836 159,466 562 First American Bank SSB TX 206,603 1,968 . 46,882 1,485 159,721 483 Republic Bancshares of Texas TX 174,481 1,414 <$1B 37,175 971 137,306 443 American State Financial Corp. TX 167,075 2,962 $1B-$10B 60,560 2,611 106,515 351 Advanta Bank Corporation UT 167,034 20,410 $1B-$10B 167,034 20,410 - - First National Bank Group, Inc. TX 161,906 1,774 $1B-$10B 45,701 1,406 116,205 368 Eggemeyer Advisory Corp. CA 159,682 1,652 $1B-$10B 43,568 1,286 116,114 366 Lone Star National Bancshare TX 156,238 1,690 $1B-$10B 43,991 1,274 112,247 416 Woodforest Financial Group TX 152,287 1,209 $1B-$10B 30,058 838 122,229 371
Texas
Page 78

Table 4A. Top Small Business Lenders by State and Territory Using CRA Data, 2004
State or Territory Lending Institution
HQ Location LSBL$ (1,000) LSBL#
Institution Asset Size SSBL$ (1,000) SSBL# LSBL(2)$ (1,000) LSBL(2)#
(1) (2) (3) (4) (5) (6) (7)
Small Business Lending (<$1M) Micro Business Lending (<$100k) Small Business Lending ($100k-1M)
A.N.B. Holding Company Ltd. TX 146,505 1,479 $1B-$10B 38,389 1,148 108,116 331 Amarillo National Bancorp, Inc. TX 145,482 2,987 $1B-$10B 49,396 2,703 96,086 284 GE Capital Financial Inc. UT 137,666 35,927 $1B-$10B 135,897 35,918 1,769 9 Whitney Holding Corporation LA 132,634 758 $1B-$10B 22,180 436 110,454 322 Central Bancorp, Inc. TX 131,499 743 <$1B 19,892 399 111,607 344 South Plains Financial, Inc. TX 130,691 1,342 $1B-$10B 30,092 998 100,599 344 JSA Family Limited Partnership TX 126,885 1,758 <$1B 44,052 1,480 82,833 278 Overton Financial Corporation TX 123,961 1,527 <$1B 35,698 1,223 88,263 304 Summit Bancshares, Inc. TX 122,197 1,041 $1B-$10B 28,388 748 93,809 293 First Community Capital Corp. TX 118,665 1,023 <$1B 27,847 736 90,818 287 American Express Centurion Bank UT 114,981 12,600 $10B-$50B 114,376 12,597 605 3 Broadway Bancshares, Inc. TX 112,102 943 $1B-$10B 26,735 671 85,367 272 MOW/RPW II Ltd. TX 111,181 1,009 <$1B 25,576 733 85,605 276 Central Community Corporation TX 110,735 1,195 <$1B 27,259 910 83,476 285 WNB Bancshares, Inc. TX 109,484 516 <$1B 12,485 290 96,999 226 Southside Bancshares , Inc. TX 108,423 1,134 $1B-$10B 29,421 876 79,002 258 U.S. Bancorp MN 100,528 4,424 >$50B 58,150 4,303 42,378 121 The Pitney Bowes Bank UT 98,393 19,760 <$1B 97,987 19,758 406 2 Texas Capital Bancshares, Inc. TX 97,323 470 $1B-$10B 12,235 248 85,088 222 Security Holding Company TX 95,446 1,261 <$1B 28,139 1,040 67,307 221 Metrocorp Bancshares, Inc. TX 93,720 433 <$1B 10,004 201 83,716 232 West Financial, Inc. TX 93,339 614 <$1B 16,719 388 76,620 226 Colonial Bancgroup, Inc. AL 93,129 575 $10B-$50B 15,821 346 77,308 229 Washington Mutual Bank FA WA 92,933 973 >$50B 28,067 801 64,866 172 Texas United Bancshares, Inc. TX 92,009 1,357 $1B-$10B 30,981 1,151 61,028 206 INB Financial Corporation TX 91,248 628 <$1B 14,861 422 76,387 206 Firstcapital Bank SSB TX 89,078 808 . 20,707 621 68,371 187 Prosperity Bancshares, Inc. TX 88,475 1,101 $1B-$10B 31,632 912 56,843 189 Horizon Capital Bank TX 85,636 738 <$1B 14,716 545 70,920 193 Guaranty Bancshares, Inc. TX 83,941 1,359 <$1B 30,256 1,159 53,685 200 SNB Bancshares, Inc. TX 83,513 483 $1B-$10B 12,844 288 70,669 195 Plains Bancorp, Inc. TX 81,539 1,356 <$1B 25,993 1,136 55,546 220 Legacytexas Group, Inc. TX 80,746 1,173 <$1B 23,667 990 57,079 183 American Bank Holding Corp. TX 78,902 749 <$1B 22,071 565 56,831 184 Jefferson Bancshares, Inc. TX 74,637 687 <$1B 19,694 525 54,943 162 Firstperryton Bancorp, Inc. TX 70,989 1,000 <$1B 25,841 834 45,148 166 Midland Bancshares, Inc. TX 70,272 608 <$1B 16,109 450 54,163 158 Inwood Bancshares, Inc. TX 69,723 514 <$1B 14,702 344 55,021 170 Doss Ltd. TX 67,911 1,046 $1B-$10B 23,806 888 44,105 158 Commerce National Financial TX 61,456 584 <$1B 15,318 433 46,138 151 Moody Bancshares, Inc. TX 58,716 438 $1B-$10B 11,655 304 47,061 134 Century Bancshares, Inc. TX 57,577 472 <$1B 11,260 328 46,317 144 Diboll State Bancshares, Inc. TX 56,224 913 <$1B 22,660 789 33,564 124 Extraco Corporation TX 55,760 637 <$1B 14,732 496 41,028 141 Americo Bancshares, Inc. TX 54,640 637 <$1B 14,784 509 39,856 128 Bancshares, Inc. TX 51,586 264 <$1B 5,748 139 45,838 125 The Community Company TX 50,687 564 <$1B 13,408 440 37,279 124
Wells Fargo & Company CA 777,063 14,385 >$50B 294,044 12,977 483,019 1,408 Utah
Page 79

Table 4A. Top Small Business Lenders by State and Territory Using CRA Data, 2004
State or Territory Lending Institution
HQ Location LSBL$ (1,000) LSBL#
Institution Asset Size SSBL$ (1,000) SSBL# LSBL(2)$ (1,000) LSBL(2)#
(1) (2) (3) (4) (5) (6) (7)
Small Business Lending (<$1M) Micro Business Lending (<$100k) Small Business Lending ($100k-1M)
Zions Bancorporation UT 616,360 5,473 $10B-$50B 134,993 4,109 481,367 1,364 U.S. Bancorp MN 111,947 2,086 >$50B 23,707 1,849 88,240 237 BOU Bancorp, Inc. UT 96,694 589 <$1B 13,108 347 83,586 242 Keycorp OH 91,478 504 >$50B 10,098 300 81,380 204 People S Utah Bancorp UT 77,711 958 <$1B 19,702 758 58,009 200 JPMorgan Chase & Co. NY 69,376 2,829 >$50B 30,269 2,721 39,107 108 Southern Utah Bancorporation UT 50,748 669 <$1B 16,638 535 34,110 134
Chittenden Corporation VT 206,475 1,452 $1B-$10B 38,565 937 167,910 515 TD Banknorth Inc. ME 190,564 1,547 . 38,767 1,104 151,797 443 Merchants Bank VT 54,272 534 $1B-$10B 10,600 387 43,672 147 Factory Point Bancorp, Inc. VT 52,291 521 <$1B 15,044 379 37,247 142
BB&T Corporation NC 1,206,341 10,128 >$50B 248,974 7,303 957,367 2,825 Wachovia Corporation NC 1,045,954 6,410 >$50B 187,442 4,279 858,512 2,131 Suntrust Banks, Inc. GA 824,075 8,891 >$50B 154,805 7,128 669,270 1,763 Bank of America Corporation NC 382,595 9,124 >$50B 130,728 8,385 251,867 739 First Citizens Bancshares, Inc. NC 183,139 1,639 $10B-$50B 36,530 1,178 146,609 461 MBNA Corporation DE 164,359 25,482 >$50B 143,207 25,416 21,152 66 Wells Fargo & Company CA 128,788 4,089 >$50B 122,980 4,044 5,808 45 Citigroup, Inc. NY 125,127 22,926 >$50B 124,200 22,923 927 3 Union Bankshares Corporation VA 124,140 1,128 $1B-$10B 28,998 810 95,142 318 Virginia Financial Group, Inc. VA 123,236 859 $1B-$10B 19,804 573 103,432 286 Capital One FSB VA 119,549 35,188 $10B-$50B 118,949 35,184 600 4 Mercantile Bankshares Corp. MD 111,188 710 $10B-$50B 16,737 453 94,451 257 Townebank VA 108,577 1,049 $1B-$10B 24,052 770 84,525 279 Virginia Commerce Bancorp, Inc. VA 96,768 449 $1B-$10B 11,576 223 85,192 226 JPMorgan Chase & Co. NY 90,283 7,976 >$50B 86,391 7,957 3,892 19 Fulton Financial Corporation PA 85,002 458 $10B-$50B 11,587 237 73,415 221 FNB Corporation VA 82,593 1,026 $1B-$10B 25,153 844 57,440 182 Burke & Herbert Bank & Trust VA 82,046 576 $1B-$10B 13,677 357 68,369 219 United Bankshares, Inc. WV 67,209 327 $1B-$10B 7,978 168 59,231 159 Provident Bankshares Corporation MD 62,632 275 $1B-$10B 6,449 129 56,183 146 C&F Financial Corporation VA 62,399 438 <$1B 11,948 269 50,451 169 Old Point Financial Corporation VA 59,397 538 <$1B 16,501 389 42,896 149 American National Bankshares VA 55,642 486 <$1B 13,277 369 42,365 117 First Bancorp, Inc. VA 52,205 570 <$1B 11,842 441 40,363 129
U.S. Bancorp MN 818,456 9,340 >$50B 131,140 7,652 687,316 1,688 Wells Fargo & Company CA 741,482 17,838 >$50B 400,535 16,840 340,947 998 Bank of America Corporation NC 598,758 17,107 >$50B 262,637 16,217 336,121 890 W.T.B. Financial Corporation WA 383,381 2,406 $1B-$10B 59,492 1,478 323,889 928 Keycorp OH 358,081 2,031 >$50B 44,753 1,203 313,328 828 Columbia Banking System, Inc. WA 263,920 1,541 $1B-$10B 41,018 960 222,902 581 Frontier Financial Corporation WA 261,121 1,782 $1B-$10B 48,273 1,105 212,848 677 Banner Corporation WA 249,501 1,451 $1B-$10B 40,739 826 208,762 625 Americanwest Bancorporation WA 129,275 1,075 $1B-$10B 28,748 746 100,527 329 Citigroup, Inc. NY 123,727 23,087 >$50B 122,017 23,082 1,710 5 Capital One FSB VA 116,223 36,562 $10B-$50B 115,498 36,557 725 5
Washington
Virginia
Vermont
Page 80
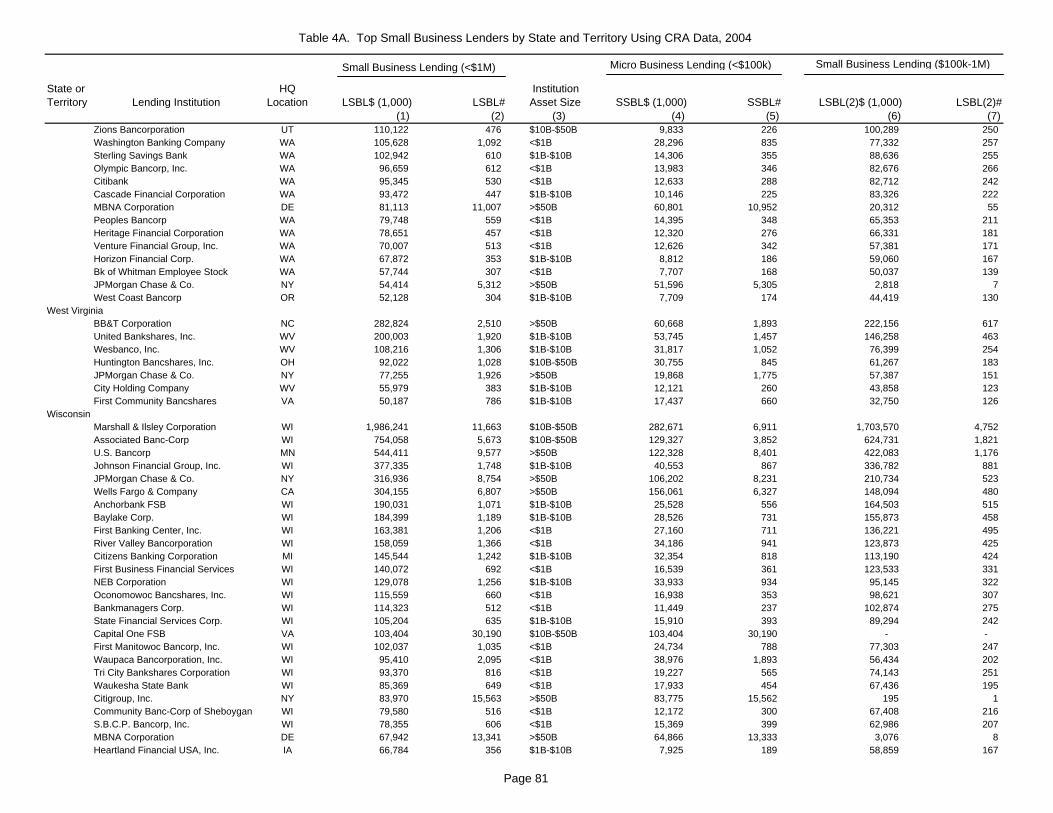
Table 4A. Top Small Business Lenders by State and Territory Using CRA Data, 2004
State or Territory Lending Institution
HQ Location LSBL$ (1,000) LSBL#
Institution Asset Size SSBL$ (1,000) SSBL# LSBL(2)$ (1,000) LSBL(2)#
(1) (2) (3) (4) (5) (6) (7)
Small Business Lending (<$1M) Micro Business Lending (<$100k) Small Business Lending ($100k-1M)
Zions Bancorporation UT 110,122 476 $10B-$50B 9,833 226 100,289 250 Washington Banking Company WA 105,628 1,092 <$1B 28,296 835 77,332 257 Sterling Savings Bank WA 102,942 610 $1B-$10B 14,306 355 88,636 255 Olympic Bancorp, Inc. WA 96,659 612 <$1B 13,983 346 82,676 266 Citibank WA 95,345 530 <$1B 12,633 288 82,712 242 Cascade Financial Corporation WA 93,472 447 $1B-$10B 10,146 225 83,326 222 MBNA Corporation DE 81,113 11,007 >$50B 60,801 10,952 20,312 55 Peoples Bancorp WA 79,748 559 <$1B 14,395 348 65,353 211 Heritage Financial Corporation WA 78,651 457 <$1B 12,320 276 66,331 181 Venture Financial Group, Inc. WA 70,007 513 <$1B 12,626 342 57,381 171 Horizon Financial Corp. WA 67,872 353 $1B-$10B 8,812 186 59,060 167 Bk of Whitman Employee Stock WA 57,744 307 <$1B 7,707 168 50,037 139 JPMorgan Chase & Co. NY 54,414 5,312 >$50B 51,596 5,305 2,818 7 West Coast Bancorp OR 52,128 304 $1B-$10B 7,709 174 44,419 130
BB&T Corporation NC 282,824 2,510 >$50B 60,668 1,893 222,156 617 United Bankshares, Inc. WV 200,003 1,920 $1B-$10B 53,745 1,457 146,258 463 Wesbanco, Inc. WV 108,216 1,306 $1B-$10B 31,817 1,052 76,399 254 Huntington Bancshares, Inc. OH 92,022 1,028 $10B-$50B 30,755 845 61,267 183 JPMorgan Chase & Co. NY 77,255 1,926 >$50B 19,868 1,775 57,387 151 City Holding Company WV 55,979 383 $1B-$10B 12,121 260 43,858 123 First Community Bancshares VA 50,187 786 $1B-$10B 17,437 660 32,750 126
Marshall & Ilsley Corporation WI 1,986,241 11,663 $10B-$50B 282,671 6,911 1,703,570 4,752 Associated Banc-Corp WI 754,058 5,673 $10B-$50B 129,327 3,852 624,731 1,821 U.S. Bancorp MN 544,411 9,577 >$50B 122,328 8,401 422,083 1,176 Johnson Financial Group, Inc. WI 377,335 1,748 $1B-$10B 40,553 867 336,782 881 JPMorgan Chase & Co. NY 316,936 8,754 >$50B 106,202 8,231 210,734 523 Wells Fargo & Company CA 304,155 6,807 >$50B 156,061 6,327 148,094 480 Anchorbank FSB WI 190,031 1,071 $1B-$10B 25,528 556 164,503 515 Baylake Corp. WI 184,399 1,189 $1B-$10B 28,526 731 155,873 458 First Banking Center, Inc. WI 163,381 1,206 <$1B 27,160 711 136,221 495 River Valley Bancorporation WI 158,059 1,366 <$1B 34,186 941 123,873 425 Citizens Banking Corporation MI 145,544 1,242 $1B-$10B 32,354 818 113,190 424 First Business Financial Services WI 140,072 692 <$1B 16,539 361 123,533 331 NEB Corporation WI 129,078 1,256 $1B-$10B 33,933 934 95,145 322 Oconomowoc Bancshares, Inc. WI 115,559 660 <$1B 16,938 353 98,621 307 Bankmanagers Corp. WI 114,323 512 <$1B 11,449 237 102,874 275 State Financial Services Corp. WI 105,204 635 $1B-$10B 15,910 393 89,294 242 Capital One FSB VA 103,404 30,190 $10B-$50B 103,404 30,190 - - First Manitowoc Bancorp, Inc. WI 102,037 1,035 <$1B 24,734 788 77,303 247 Waupaca Bancorporation, Inc. WI 95,410 2,095 <$1B 38,976 1,893 56,434 202 Tri City Bankshares Corporation WI 93,370 816 <$1B 19,227 565 74,143 251 Waukesha State Bank WI 85,369 649 <$1B 17,933 454 67,436 195 Citigroup, Inc. NY 83,970 15,563 >$50B 83,775 15,562 195 1 Community Banc-Corp of Sheboygan WI 79,580 516 <$1B 12,172 300 67,408 216 S.B.C.P. Bancorp, Inc. WI 78,355 606 <$1B 15,369 399 62,986 207 MBNA Corporation DE 67,942 13,341 >$50B 64,866 13,333 3,076 8 Heartland Financial USA, Inc. IA 66,784 356 $1B-$10B 7,925 189 58,859 167
Wisconsin
West Virginia
Page 81

Table 4A. Top Small Business Lenders by State and Territory Using CRA Data, 2004
State or Territory Lending Institution
HQ Location LSBL$ (1,000) LSBL#
Institution Asset Size SSBL$ (1,000) SSBL# LSBL(2)$ (1,000) LSBL(2)#
(1) (2) (3) (4) (5) (6) (7)
Small Business Lending (<$1M) Micro Business Lending (<$100k) Small Business Lending ($100k-1M)
Mid America Bank FSB IL 65,950 461 $1B-$10B 12,096 276 53,854 185 Sword Financial Corporation WI 61,905 563 <$1B 14,545 396 47,360 167 Otto Bremer Foundation MN 60,945 696 $1B-$10B 17,084 546 43,861 150 Citizens Bank Holding, Inc. WI 58,792 584 <$1B 13,461 436 45,331 148 Merchants & Manufacturers Bank WI 55,161 274 $1B-$10B 7,307 138 47,854 136
First Interstate Bancsystem MT 140,240 1,856 $1B-$10B 45,414 1,552 94,826 304 Wells Fargo & Company CA 88,673 1,821 >$50B 42,147 1,666 46,526 155 United Bancorporation of WY WY 68,323 439 $1B-$10B 10,676 286 57,647 153 Bank of The West CA 57,509 839 >$50B 20,157 697 37,352 142 Midland Financial Corporation WY 56,034 704 <$1B 19,338 567 36,696 137
Note: Small businesses seeking loans should also consider banks that participate in SBA loan programs. To locate an SBA certified lender near you, call 1-800-8-ASK- SBA or check SBA'swebsite at: http://www.sba.gov.Source: U.S. Small Business Administration, Office of Advocacy, from Community Reinvestment Act reports.
Wyoming
Page 82

4B. Top Micro Business Lenders by State and Territory Using CRA Data, 2004
State or Territory Lending Institution
HQ Location SSBL $(1,000) SSBL#
Institution Asset Size LSBL$ (1,000) LSBL# LSBL(2) $(1,000) LSBL(2)#
(1) (2) (3) (4) (5) (6) (7)
Amsouth Bancorporation AL 399,991 12,045 >$50B 854,889 13,317 454,898 1,272Regions Financial Corporation AL 263,469 8,047 >$50B 1,260,037 11,055 996,568 3,008Synovus Financial Corp. GA 127,199 3,486 $10B-$50B 649,024 5,156 521,825 1,670Wachovia Corporation NC 107,409 2,493 >$50B 722,719 4,264 615,310 1,771Compass Bancshares, Inc. AL 104,617 2,800 $10B-$50B 495,530 3,914 390,913 1,114Colonial Bancgroup, Inc. AL 79,586 2,282 $10B-$50B 326,250 3,100 246,664 818MBNA Corporation DE 64,723 13,394 >$50B 69,463 13,413 4,740 19Citigroup, Inc. NY 58,580 11,840 >$50B 59,421 11,844 841 4Wells Fargo & Company CA 50,037 1,813 >$50B 51,352 1,825 1,315 12Capital One FSB VA 47,953 16,190 $10B-$50B 48,078 16,191 125 1Alabama National Bancorporation AL 40,924 1,292 $1B-$10B 183,236 1,727 142,312 435Aliant Financial Corporation AL 37,753 718 <$1B 210,973 1,435 173,220 717JPMorgan Chase & Co. NY 33,621 3,551 >$50B 34,221 3,553 600 2GE Capital Financial Inc. UT 31,555 8,607 $1B-$10B 31,555 8,607 0 0Metro Bank AL 30,609 1,107 <$1B 103,818 1,395 73,209 288Banc Corporation AL 30,311 810 $1B-$10B 127,920 1,157 97,609 347Advanta Bank Corporation UT 23,952 2,827 $1B-$10B 23,952 2,827 0 0Community Bancshares, Inc. AL 23,893 794 <$1B 71,258 973 47,365 179American Express Centurion Bank UT 20,240 2,176 $10B-$50B 20,240 2,176 0 0Whitney Holding Corporation LA 17,316 431 $1B-$10B 131,473 762 114,157 331United Security Bancshares AL 16,963 746 <$1B 44,210 855 27,247 109The Pitney Bowes Bank UT 16,763 3,428 <$1B 16,966 3,429 203 1West Alabama Capital Corp. AL 14,547 556 <$1B 41,096 649 26,549 93Bancorpsouth, Inc. MS 13,674 484 $10B-$50B 70,678 673 57,004 189Auburn National Bancorporation AL 11,480 333 <$1B 52,944 455 41,464 122Peoples Banctrust Company, Inc. AL 11,353 321 <$1B 37,966 418 26,613 97
Wells Fargo & Company CA 101,678 3,756 >$50B 222,544 4,115 120,866 359First National Bank Alaska AK 68,325 1,854 $1B-$10B 331,258 2,728 262,933 874Bank of America Corporation NC 37,546 3,325 >$50B 40,321 3,333 2,775 8Northrim Bancorp, Inc. AK 22,719 499 <$1B 133,027 842 110,308 343Citigroup, Inc. NY 11,187 1,746 >$50B 11,337 1,747 150 1Capital One FSB VA 11,126 4,329 $10B-$50B 11,126 4,329 0 0
Wells Fargo & Company CA 650,113 28,887 >$50B 1,120,359 30,257 470,246 1,370JPMorgan Chase & Co. NY 169,694 11,600 >$50B 322,477 12,028 152,783 428Bank of America Corporation NC 150,516 10,172 >$50B 306,490 10,613 155,974 441Citigroup, Inc. NY 108,987 20,650 >$50B 110,867 20,659 1,880 9Capital One FSB VA 84,174 28,885 $10B-$50B 84,299 28,886 125 1MBNA Corporation DE 59,047 9,890 >$50B 110,512 10,048 51,465 158Compass Bancshares, Inc. AL 53,398 1,383 $10B-$50B 238,085 1,850 184,687 467Zions Bancorporation UT 46,302 1,221 $10B-$50B 414,116 2,187 367,814 966Marshall & Ilsley Corporation WI 39,716 934 $10B-$50B 341,211 1,688 301,495 754Advanta Bank Corporation UT 37,021 4,764 $1B-$10B 37,021 4,764 0 0American Express Centurion Bank UT 33,846 5,328 $10B-$50B 33,984 5,329 138 1Capitol Bancorp Ltd. MI 29,708 582 $1B-$10B 259,533 1,210 229,825 628
Alaska
Alabama
Arizona
Mirco Business Lending (<$100k) Small Business Lending (<$1M) Small Business Lending (<$100k- $1M)
Page 83
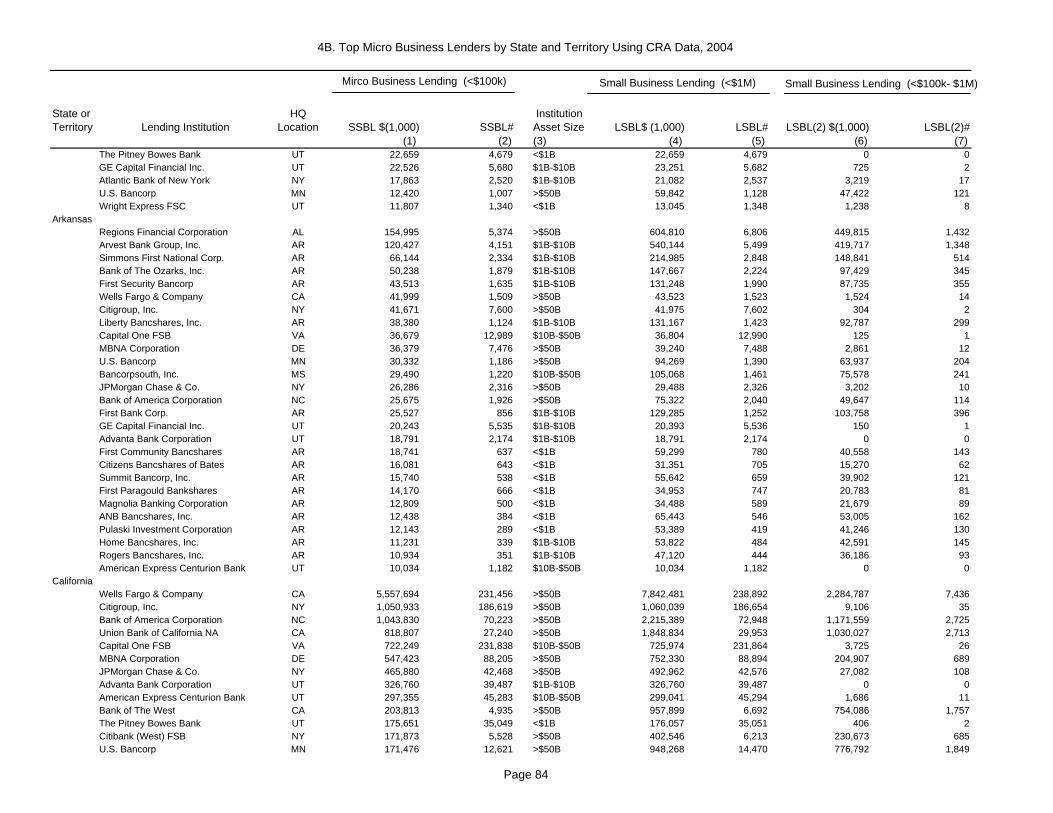
4B. Top Micro Business Lenders by State and Territory Using CRA Data, 2004
State or Territory Lending Institution
HQ Location SSBL $(1,000) SSBL#
Institution Asset Size LSBL$ (1,000) LSBL# LSBL(2) $(1,000) LSBL(2)#
(1) (2) (3) (4) (5) (6) (7)
Mirco Business Lending (<$100k) Small Business Lending (<$1M) Small Business Lending (<$100k- $1M)
The Pitney Bowes Bank UT 22,659 4,679 <$1B 22,659 4,679 0 0GE Capital Financial Inc. UT 22,526 5,680 $1B-$10B 23,251 5,682 725 2Atlantic Bank of New York NY 17,863 2,520 $1B-$10B 21,082 2,537 3,219 17U.S. Bancorp MN 12,420 1,007 >$50B 59,842 1,128 47,422 121Wright Express FSC UT 11,807 1,340 <$1B 13,045 1,348 1,238 8
Regions Financial Corporation AL 154,995 5,374 >$50B 604,810 6,806 449,815 1,432Arvest Bank Group, Inc. AR 120,427 4,151 $1B-$10B 540,144 5,499 419,717 1,348Simmons First National Corp. AR 66,144 2,334 $1B-$10B 214,985 2,848 148,841 514Bank of The Ozarks, Inc. AR 50,238 1,879 $1B-$10B 147,667 2,224 97,429 345First Security Bancorp AR 43,513 1,635 $1B-$10B 131,248 1,990 87,735 355Wells Fargo & Company CA 41,999 1,509 >$50B 43,523 1,523 1,524 14Citigroup, Inc. NY 41,671 7,600 >$50B 41,975 7,602 304 2Liberty Bancshares, Inc. AR 38,380 1,124 $1B-$10B 131,167 1,423 92,787 299Capital One FSB VA 36,679 12,989 $10B-$50B 36,804 12,990 125 1MBNA Corporation DE 36,379 7,476 >$50B 39,240 7,488 2,861 12U.S. Bancorp MN 30,332 1,186 >$50B 94,269 1,390 63,937 204Bancorpsouth, Inc. MS 29,490 1,220 $10B-$50B 105,068 1,461 75,578 241JPMorgan Chase & Co. NY 26,286 2,316 >$50B 29,488 2,326 3,202 10Bank of America Corporation NC 25,675 1,926 >$50B 75,322 2,040 49,647 114First Bank Corp. AR 25,527 856 $1B-$10B 129,285 1,252 103,758 396GE Capital Financial Inc. UT 20,243 5,535 $1B-$10B 20,393 5,536 150 1Advanta Bank Corporation UT 18,791 2,174 $1B-$10B 18,791 2,174 0 0First Community Bancshares AR 18,741 637 <$1B 59,299 780 40,558 143Citizens Bancshares of Bates AR 16,081 643 <$1B 31,351 705 15,270 62Summit Bancorp, Inc. AR 15,740 538 <$1B 55,642 659 39,902 121First Paragould Bankshares AR 14,170 666 <$1B 34,953 747 20,783 81Magnolia Banking Corporation AR 12,809 500 <$1B 34,488 589 21,679 89ANB Bancshares, Inc. AR 12,438 384 <$1B 65,443 546 53,005 162Pulaski Investment Corporation AR 12,143 289 <$1B 53,389 419 41,246 130Home Bancshares, Inc. AR 11,231 339 $1B-$10B 53,822 484 42,591 145Rogers Bancshares, Inc. AR 10,934 351 $1B-$10B 47,120 444 36,186 93American Express Centurion Bank UT 10,034 1,182 $10B-$50B 10,034 1,182 0 0
Wells Fargo & Company CA 5,557,694 231,456 >$50B 7,842,481 238,892 2,284,787 7,436Citigroup, Inc. NY 1,050,933 186,619 >$50B 1,060,039 186,654 9,106 35Bank of America Corporation NC 1,043,830 70,223 >$50B 2,215,389 72,948 1,171,559 2,725Union Bank of California NA CA 818,807 27,240 >$50B 1,848,834 29,953 1,030,027 2,713Capital One FSB VA 722,249 231,838 $10B-$50B 725,974 231,864 3,725 26MBNA Corporation DE 547,423 88,205 >$50B 752,330 88,894 204,907 689JPMorgan Chase & Co. NY 465,880 42,468 >$50B 492,962 42,576 27,082 108Advanta Bank Corporation UT 326,760 39,487 $1B-$10B 326,760 39,487 0 0American Express Centurion Bank UT 297,355 45,283 $10B-$50B 299,041 45,294 1,686 11Bank of The West CA 203,813 4,935 >$50B 957,899 6,692 754,086 1,757The Pitney Bowes Bank UT 175,651 35,049 <$1B 176,057 35,051 406 2Citibank (West) FSB NY 171,873 5,528 >$50B 402,546 6,213 230,673 685U.S. Bancorp MN 171,476 12,621 >$50B 948,268 14,470 776,792 1,849
Arkansas
California
Page 84

4B. Top Micro Business Lenders by State and Territory Using CRA Data, 2004
State or Territory Lending Institution
HQ Location SSBL $(1,000) SSBL#
Institution Asset Size LSBL$ (1,000) LSBL# LSBL(2) $(1,000) LSBL(2)#
(1) (2) (3) (4) (5) (6) (7)
Mirco Business Lending (<$100k) Small Business Lending (<$1M) Small Business Lending (<$100k- $1M)
Zions Bancorporation UT 110,521 2,303 $10B-$50B 748,046 3,900 637,525 1,597GE Capital Financial Inc. UT 95,446 23,730 $1B-$10B 97,101 23,738 1,655 8City National Corporation CA 73,622 1,393 $10B-$50B 833,101 3,184 759,479 1,791Westamerica Bancorporation CA 66,245 1,094 $1B-$10B 407,806 2,098 341,561 1,004Washington Mutual Bank FA WA 63,768 2,090 >$50B 156,830 2,280 93,062 190Hanmi Financial Corporation CA 58,292 999 $1B-$10B 381,606 1,945 323,314 946Pacific Capital Bancorp CA 50,041 1,262 $1B-$10B 260,393 1,821 210,352 559Mellon Financial Corporation PA 43,552 1,873 $10B-$50B 376,648 2,706 333,096 833Eggemeyer Advisory Corp. CA 41,514 652 $1B-$10B 352,246 1,435 310,732 783Lauritzen Corporation NE 41,412 5,509 $10B-$50B 49,722 5,530 8,310 21Comerica, Inc. MI 37,102 608 >$50B 842,106 2,313 805,004 1,705Trico Bancshares CA 37,026 936 $1B-$10B 171,096 1,335 134,070 399CVB Financial Corp. CA 35,865 666 $1B-$10B 302,096 1,359 266,231 693Greater Bay Bancorp CA 34,760 545 $1B-$10B 637,319 1,918 602,559 1,373Center Financial Corporation CA 32,435 512 $1B-$10B 228,476 1,065 196,041 553Sierra Bancorp CA 27,104 706 $1B-$10B 215,590 1,425 188,486 719Mid-State Bancshares CA 26,022 500 $1B-$10B 187,458 930 161,436 430Umpqua Holdings Corporation OR 22,795 438 $1B-$10B 206,335 1,007 183,540 569The Mechanics Bank CA 22,613 565 $1B-$10B 119,595 769 96,982 204Farmers & Merchants Bank CA 21,641 460 $1B-$10B 198,306 904 176,665 444Wilshire Bancorp, Inc. CA 20,910 334 $1B-$10B 183,488 757 162,578 423Exchange Bank CA 20,691 483 $1B-$10B 87,897 685 67,206 202Nara Bancorp, Inc. CA 19,903 298 $1B-$10B 236,405 899 216,502 601First Banks, Inc. MO 18,909 335 $1B-$10B 275,879 927 256,970 592Central Coast Bancorp CA 18,348 353 $1B-$10B 162,360 711 144,012 358Bank of Marin CA 17,937 486 <$1B 106,219 721 88,282 235HSBC Bank USA NY 17,805 591 >$50B 38,910 646 21,105 55California Community Financial CA 17,425 295 $1B-$10B 184,235 731 166,810 4361867 Western Financial Corp. CA 17,075 296 $1B-$10B 157,177 692 140,102 396Valley Independent Bank CA 15,747 408 $1B-$10B 103,019 646 87,272 238Community Bank CA 15,745 288 $1B-$10B 226,132 797 210,387 509First Northern Community Bank CA 14,729 308 <$1B 110,638 567 95,909 259Heritage Commerce Corp. CA 14,135 222 $1B-$10B 174,106 641 159,971 419Wright Express FSC UT 13,626 1,234 <$1B 16,478 1,248 2,852 14Cathay General Bancorp CA 12,597 216 $1B-$10B 218,724 629 206,127 413San Joaquin Bank CA 12,590 339 <$1B 73,783 521 61,193 182Guaranty Bank TX 11,502 296 $10B-$50B 30,213 352 18,711 56FBOP Corporation IL 11,432 213 $10B-$50B 104,555 440 93,123 227Saehan Bancorp CA 11,336 174 <$1B 105,047 444 93,711 270BWC Financial Corp. CA 11,120 179 <$1B 69,217 318 58,097 139Savings Bank of Mendocino CA 10,832 309 <$1B 34,178 388 23,346 79Heritage Oaks Bancorp CA 10,816 224 <$1B 72,075 395 61,259 171First Regional Bancorp CA 10,714 157 $1B-$10B 143,668 458 132,954 301RCB Corporation CA 10,221 185 <$1B 80,015 368 69,794 183Bank of Commerce Holdings CA 10,123 182 <$1B 68,485 337 58,362 155Fremont Bancorporation CA 10,038 142 $1B-$10B 149,379 482 139,341 340
Page 85
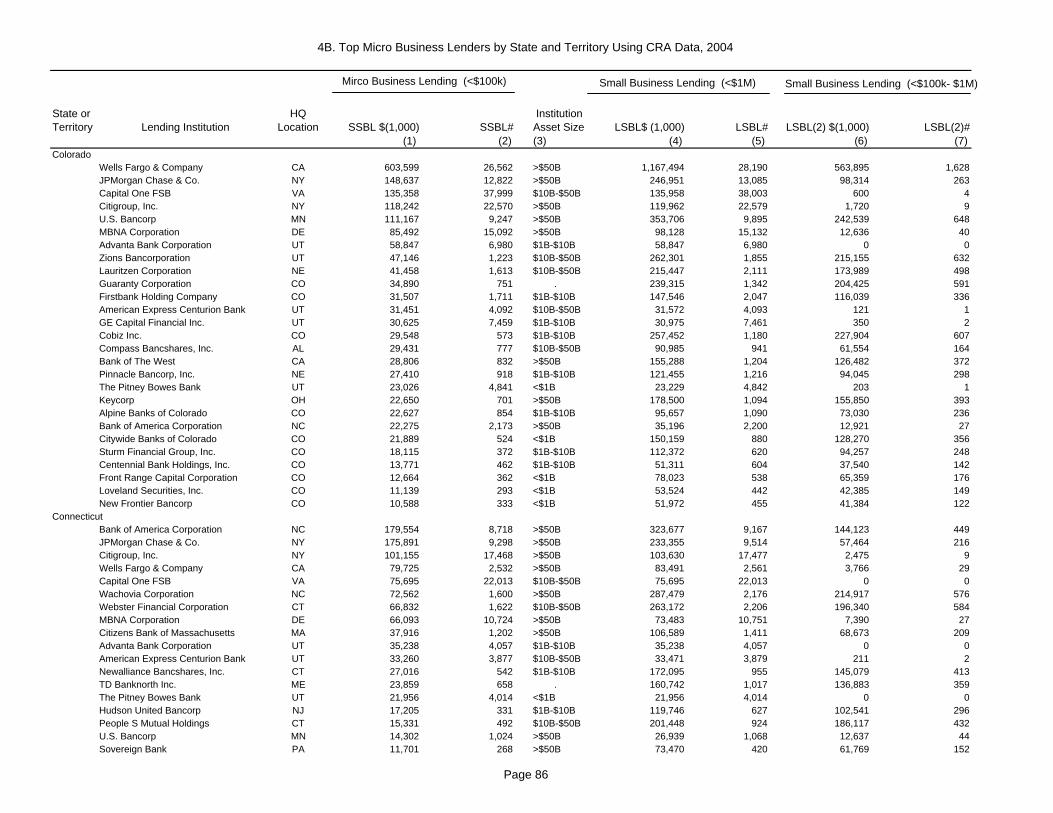
4B. Top Micro Business Lenders by State and Territory Using CRA Data, 2004
State or Territory Lending Institution
HQ Location SSBL $(1,000) SSBL#
Institution Asset Size LSBL$ (1,000) LSBL# LSBL(2) $(1,000) LSBL(2)#
(1) (2) (3) (4) (5) (6) (7)
Mirco Business Lending (<$100k) Small Business Lending (<$1M) Small Business Lending (<$100k- $1M)
Wells Fargo & Company CA 603,599 26,562 >$50B 1,167,494 28,190 563,895 1,628JPMorgan Chase & Co. NY 148,637 12,822 >$50B 246,951 13,085 98,314 263Capital One FSB VA 135,358 37,999 $10B-$50B 135,958 38,003 600 4Citigroup, Inc. NY 118,242 22,570 >$50B 119,962 22,579 1,720 9U.S. Bancorp MN 111,167 9,247 >$50B 353,706 9,895 242,539 648MBNA Corporation DE 85,492 15,092 >$50B 98,128 15,132 12,636 40Advanta Bank Corporation UT 58,847 6,980 $1B-$10B 58,847 6,980 0 0Zions Bancorporation UT 47,146 1,223 $10B-$50B 262,301 1,855 215,155 632Lauritzen Corporation NE 41,458 1,613 $10B-$50B 215,447 2,111 173,989 498Guaranty Corporation CO 34,890 751 . 239,315 1,342 204,425 591Firstbank Holding Company CO 31,507 1,711 $1B-$10B 147,546 2,047 116,039 336American Express Centurion Bank UT 31,451 4,092 $10B-$50B 31,572 4,093 121 1GE Capital Financial Inc. UT 30,625 7,459 $1B-$10B 30,975 7,461 350 2Cobiz Inc. CO 29,548 573 $1B-$10B 257,452 1,180 227,904 607Compass Bancshares, Inc. AL 29,431 777 $10B-$50B 90,985 941 61,554 164Bank of The West CA 28,806 832 >$50B 155,288 1,204 126,482 372Pinnacle Bancorp, Inc. NE 27,410 918 $1B-$10B 121,455 1,216 94,045 298The Pitney Bowes Bank UT 23,026 4,841 <$1B 23,229 4,842 203 1Keycorp OH 22,650 701 >$50B 178,500 1,094 155,850 393Alpine Banks of Colorado CO 22,627 854 $1B-$10B 95,657 1,090 73,030 236Bank of America Corporation NC 22,275 2,173 >$50B 35,196 2,200 12,921 27Citywide Banks of Colorado CO 21,889 524 <$1B 150,159 880 128,270 356Sturm Financial Group, Inc. CO 18,115 372 $1B-$10B 112,372 620 94,257 248Centennial Bank Holdings, Inc. CO 13,771 462 $1B-$10B 51,311 604 37,540 142Front Range Capital Corporation CO 12,664 362 <$1B 78,023 538 65,359 176Loveland Securities, Inc. CO 11,139 293 <$1B 53,524 442 42,385 149New Frontier Bancorp CO 10,588 333 <$1B 51,972 455 41,384 122
Bank of America Corporation NC 179,554 8,718 >$50B 323,677 9,167 144,123 449JPMorgan Chase & Co. NY 175,891 9,298 >$50B 233,355 9,514 57,464 216Citigroup, Inc. NY 101,155 17,468 >$50B 103,630 17,477 2,475 9Wells Fargo & Company CA 79,725 2,532 >$50B 83,491 2,561 3,766 29Capital One FSB VA 75,695 22,013 $10B-$50B 75,695 22,013 0 0Wachovia Corporation NC 72,562 1,600 >$50B 287,479 2,176 214,917 576Webster Financial Corporation CT 66,832 1,622 $10B-$50B 263,172 2,206 196,340 584MBNA Corporation DE 66,093 10,724 >$50B 73,483 10,751 7,390 27Citizens Bank of Massachusetts MA 37,916 1,202 >$50B 106,589 1,411 68,673 209Advanta Bank Corporation UT 35,238 4,057 $1B-$10B 35,238 4,057 0 0American Express Centurion Bank UT 33,260 3,877 $10B-$50B 33,471 3,879 211 2Newalliance Bancshares, Inc. CT 27,016 542 $1B-$10B 172,095 955 145,079 413TD Banknorth Inc. ME 23,859 658 . 160,742 1,017 136,883 359The Pitney Bowes Bank UT 21,956 4,014 <$1B 21,956 4,014 0 0Hudson United Bancorp NJ 17,205 331 $1B-$10B 119,746 627 102,541 296People S Mutual Holdings CT 15,331 492 $10B-$50B 201,448 924 186,117 432U.S. Bancorp MN 14,302 1,024 >$50B 26,939 1,068 12,637 44Sovereign Bank PA 11,701 268 >$50B 73,470 420 61,769 152
Colorado
Connecticut
Page 86
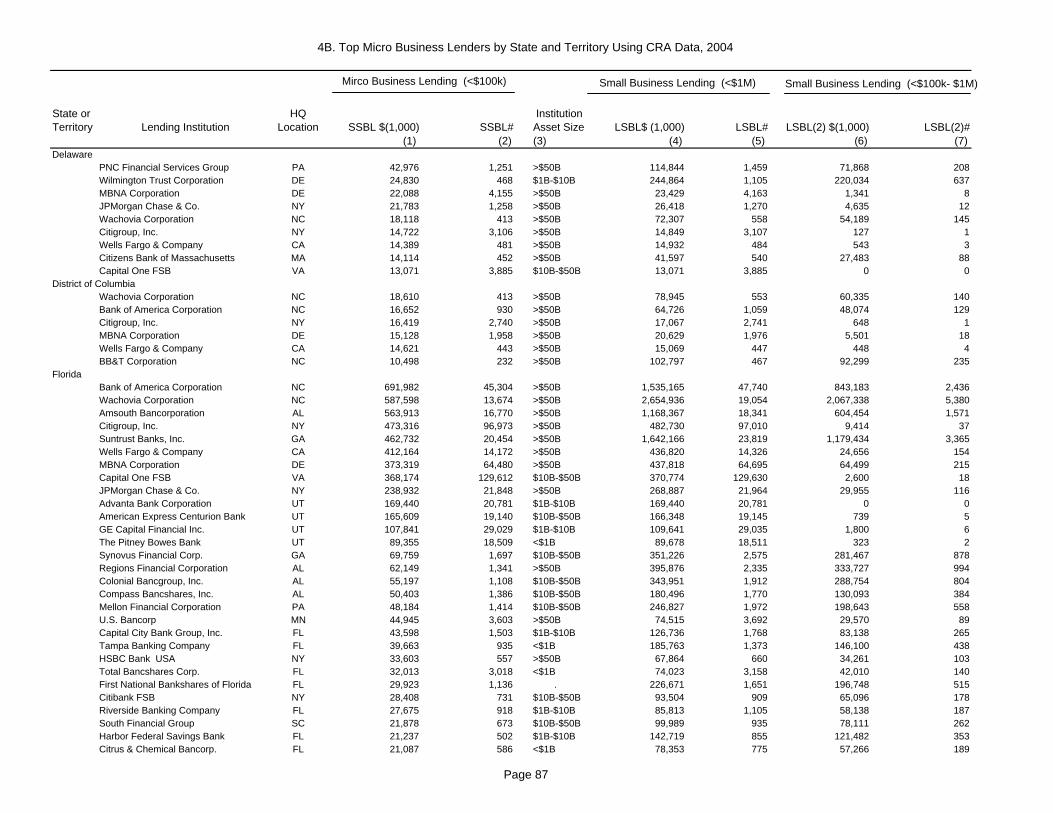
4B. Top Micro Business Lenders by State and Territory Using CRA Data, 2004
State or Territory Lending Institution
HQ Location SSBL $(1,000) SSBL#
Institution Asset Size LSBL$ (1,000) LSBL# LSBL(2) $(1,000) LSBL(2)#
(1) (2) (3) (4) (5) (6) (7)
Mirco Business Lending (<$100k) Small Business Lending (<$1M) Small Business Lending (<$100k- $1M)
PNC Financial Services Group PA 42,976 1,251 >$50B 114,844 1,459 71,868 208Wilmington Trust Corporation DE 24,830 468 $1B-$10B 244,864 1,105 220,034 637MBNA Corporation DE 22,088 4,155 >$50B 23,429 4,163 1,341 8JPMorgan Chase & Co. NY 21,783 1,258 >$50B 26,418 1,270 4,635 12Wachovia Corporation NC 18,118 413 >$50B 72,307 558 54,189 145Citigroup, Inc. NY 14,722 3,106 >$50B 14,849 3,107 127 1Wells Fargo & Company CA 14,389 481 >$50B 14,932 484 543 3Citizens Bank of Massachusetts MA 14,114 452 >$50B 41,597 540 27,483 88Capital One FSB VA 13,071 3,885 $10B-$50B 13,071 3,885 0 0
Wachovia Corporation NC 18,610 413 >$50B 78,945 553 60,335 140Bank of America Corporation NC 16,652 930 >$50B 64,726 1,059 48,074 129Citigroup, Inc. NY 16,419 2,740 >$50B 17,067 2,741 648 1MBNA Corporation DE 15,128 1,958 >$50B 20,629 1,976 5,501 18Wells Fargo & Company CA 14,621 443 >$50B 15,069 447 448 4BB&T Corporation NC 10,498 232 >$50B 102,797 467 92,299 235
Bank of America Corporation NC 691,982 45,304 >$50B 1,535,165 47,740 843,183 2,436Wachovia Corporation NC 587,598 13,674 >$50B 2,654,936 19,054 2,067,338 5,380Amsouth Bancorporation AL 563,913 16,770 >$50B 1,168,367 18,341 604,454 1,571Citigroup, Inc. NY 473,316 96,973 >$50B 482,730 97,010 9,414 37Suntrust Banks, Inc. GA 462,732 20,454 >$50B 1,642,166 23,819 1,179,434 3,365Wells Fargo & Company CA 412,164 14,172 >$50B 436,820 14,326 24,656 154MBNA Corporation DE 373,319 64,480 >$50B 437,818 64,695 64,499 215Capital One FSB VA 368,174 129,612 $10B-$50B 370,774 129,630 2,600 18JPMorgan Chase & Co. NY 238,932 21,848 >$50B 268,887 21,964 29,955 116Advanta Bank Corporation UT 169,440 20,781 $1B-$10B 169,440 20,781 0 0American Express Centurion Bank UT 165,609 19,140 $10B-$50B 166,348 19,145 739 5GE Capital Financial Inc. UT 107,841 29,029 $1B-$10B 109,641 29,035 1,800 6The Pitney Bowes Bank UT 89,355 18,509 <$1B 89,678 18,511 323 2Synovus Financial Corp. GA 69,759 1,697 $10B-$50B 351,226 2,575 281,467 878Regions Financial Corporation AL 62,149 1,341 >$50B 395,876 2,335 333,727 994Colonial Bancgroup, Inc. AL 55,197 1,108 $10B-$50B 343,951 1,912 288,754 804Compass Bancshares, Inc. AL 50,403 1,386 $10B-$50B 180,496 1,770 130,093 384Mellon Financial Corporation PA 48,184 1,414 $10B-$50B 246,827 1,972 198,643 558U.S. Bancorp MN 44,945 3,603 >$50B 74,515 3,692 29,570 89Capital City Bank Group, Inc. FL 43,598 1,503 $1B-$10B 126,736 1,768 83,138 265Tampa Banking Company FL 39,663 935 <$1B 185,763 1,373 146,100 438HSBC Bank USA NY 33,603 557 >$50B 67,864 660 34,261 103Total Bancshares Corp. FL 32,013 3,018 <$1B 74,023 3,158 42,010 140First National Bankshares of Florida FL 29,923 1,136 . 226,671 1,651 196,748 515Citibank FSB NY 28,408 731 $10B-$50B 93,504 909 65,096 178Riverside Banking Company FL 27,675 918 $1B-$10B 85,813 1,105 58,138 187South Financial Group SC 21,878 673 $10B-$50B 99,989 935 78,111 262Harbor Federal Savings Bank FL 21,237 502 $1B-$10B 142,719 855 121,482 353Citrus & Chemical Bancorp. FL 21,087 586 <$1B 78,353 775 57,266 189
Florida
District of Columbia
Delaware
Page 87
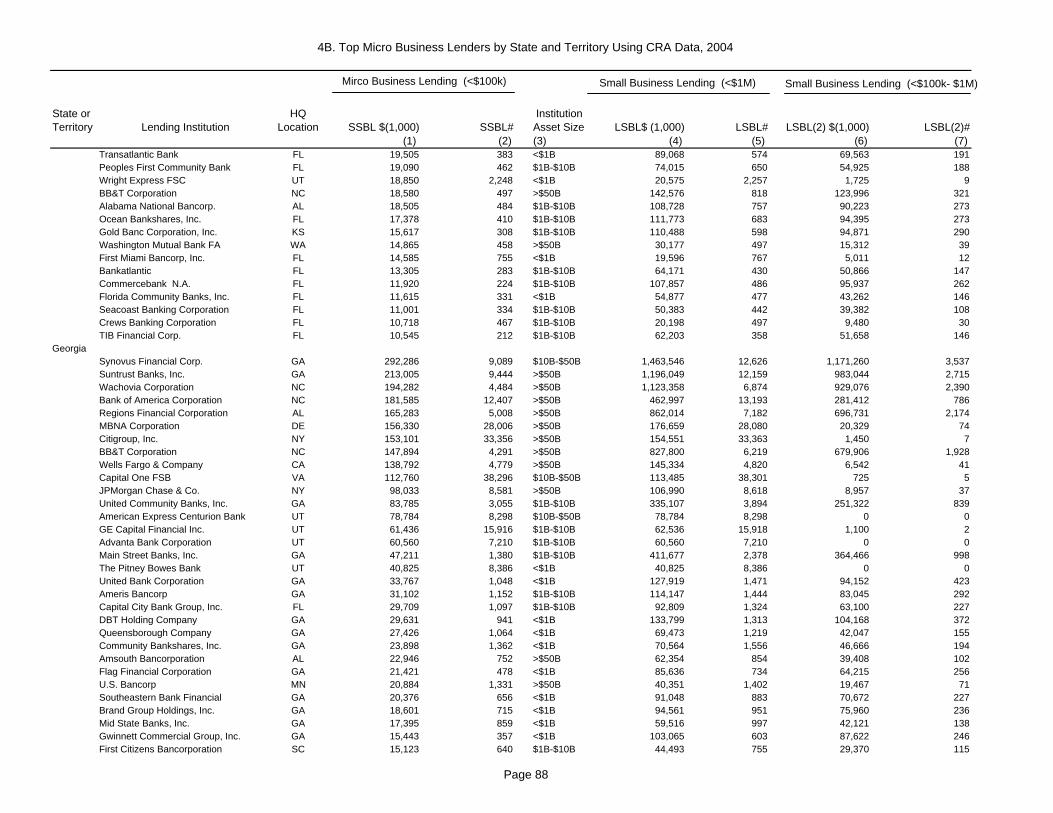
4B. Top Micro Business Lenders by State and Territory Using CRA Data, 2004
State or Territory Lending Institution
HQ Location SSBL $(1,000) SSBL#
Institution Asset Size LSBL$ (1,000) LSBL# LSBL(2) $(1,000) LSBL(2)#
(1) (2) (3) (4) (5) (6) (7)
Mirco Business Lending (<$100k) Small Business Lending (<$1M) Small Business Lending (<$100k- $1M)
Transatlantic Bank FL 19,505 383 <$1B 89,068 574 69,563 191Peoples First Community Bank FL 19,090 462 $1B-$10B 74,015 650 54,925 188Wright Express FSC UT 18,850 2,248 <$1B 20,575 2,257 1,725 9BB&T Corporation NC 18,580 497 >$50B 142,576 818 123,996 321Alabama National Bancorp. AL 18,505 484 $1B-$10B 108,728 757 90,223 273Ocean Bankshares, Inc. FL 17,378 410 $1B-$10B 111,773 683 94,395 273Gold Banc Corporation, Inc. KS 15,617 308 $1B-$10B 110,488 598 94,871 290Washington Mutual Bank FA WA 14,865 458 >$50B 30,177 497 15,312 39First Miami Bancorp, Inc. FL 14,585 755 <$1B 19,596 767 5,011 12Bankatlantic FL 13,305 283 $1B-$10B 64,171 430 50,866 147Commercebank N.A. FL 11,920 224 $1B-$10B 107,857 486 95,937 262Florida Community Banks, Inc. FL 11,615 331 <$1B 54,877 477 43,262 146Seacoast Banking Corporation FL 11,001 334 $1B-$10B 50,383 442 39,382 108Crews Banking Corporation FL 10,718 467 $1B-$10B 20,198 497 9,480 30TIB Financial Corp. FL 10,545 212 $1B-$10B 62,203 358 51,658 146
Synovus Financial Corp. GA 292,286 9,089 $10B-$50B 1,463,546 12,626 1,171,260 3,537Suntrust Banks, Inc. GA 213,005 9,444 >$50B 1,196,049 12,159 983,044 2,715Wachovia Corporation NC 194,282 4,484 >$50B 1,123,358 6,874 929,076 2,390Bank of America Corporation NC 181,585 12,407 >$50B 462,997 13,193 281,412 786Regions Financial Corporation AL 165,283 5,008 >$50B 862,014 7,182 696,731 2,174MBNA Corporation DE 156,330 28,006 >$50B 176,659 28,080 20,329 74Citigroup, Inc. NY 153,101 33,356 >$50B 154,551 33,363 1,450 7BB&T Corporation NC 147,894 4,291 >$50B 827,800 6,219 679,906 1,928Wells Fargo & Company CA 138,792 4,779 >$50B 145,334 4,820 6,542 41Capital One FSB VA 112,760 38,296 $10B-$50B 113,485 38,301 725 5JPMorgan Chase & Co. NY 98,033 8,581 >$50B 106,990 8,618 8,957 37United Community Banks, Inc. GA 83,785 3,055 $1B-$10B 335,107 3,894 251,322 839American Express Centurion Bank UT 78,784 8,298 $10B-$50B 78,784 8,298 0 0GE Capital Financial Inc. UT 61,436 15,916 $1B-$10B 62,536 15,918 1,100 2Advanta Bank Corporation UT 60,560 7,210 $1B-$10B 60,560 7,210 0 0Main Street Banks, Inc. GA 47,211 1,380 $1B-$10B 411,677 2,378 364,466 998The Pitney Bowes Bank UT 40,825 8,386 <$1B 40,825 8,386 0 0United Bank Corporation GA 33,767 1,048 <$1B 127,919 1,471 94,152 423Ameris Bancorp GA 31,102 1,152 $1B-$10B 114,147 1,444 83,045 292Capital City Bank Group, Inc. FL 29,709 1,097 $1B-$10B 92,809 1,324 63,100 227DBT Holding Company GA 29,631 941 <$1B 133,799 1,313 104,168 372Queensborough Company GA 27,426 1,064 <$1B 69,473 1,219 42,047 155Community Bankshares, Inc. GA 23,898 1,362 <$1B 70,564 1,556 46,666 194Amsouth Bancorporation AL 22,946 752 >$50B 62,354 854 39,408 102Flag Financial Corporation GA 21,421 478 <$1B 85,636 734 64,215 256U.S. Bancorp MN 20,884 1,331 >$50B 40,351 1,402 19,467 71Southeastern Bank Financial GA 20,376 656 <$1B 91,048 883 70,672 227Brand Group Holdings, Inc. GA 18,601 715 <$1B 94,561 951 75,960 236Mid State Banks, Inc. GA 17,395 859 <$1B 59,516 997 42,121 138Gwinnett Commercial Group, Inc. GA 15,443 357 <$1B 103,065 603 87,622 246First Citizens Bancorporation SC 15,123 640 $1B-$10B 44,493 755 29,370 115
Georgia
Page 88

4B. Top Micro Business Lenders by State and Territory Using CRA Data, 2004
State or Territory Lending Institution
HQ Location SSBL $(1,000) SSBL#
Institution Asset Size LSBL$ (1,000) LSBL# LSBL(2) $(1,000) LSBL(2)#
(1) (2) (3) (4) (5) (6) (7)
Mirco Business Lending (<$100k) Small Business Lending (<$1M) Small Business Lending (<$100k- $1M)
Crescent Banking Company GA 14,901 453 <$1B 63,876 602 48,975 149Savannah Bancorp, Inc. GA 13,904 267 <$1B 101,147 594 87,243 327PAB Bankshares, Inc. GA 13,509 417 <$1B 69,512 605 56,003 188WGNB Corp. GA 13,185 534 <$1B 50,599 662 37,414 128Fidelity Southern Corporation GA 13,141 381 $1B-$10B 70,916 531 57,775 150GB&T Bancshares, Inc. GA 12,615 397 $1B-$10B 74,551 577 61,936 180Colonial Bancgroup, Inc. AL 12,463 311 $10B-$50B 63,194 465 50,731 154Southeastern Banking Corp. GA 11,350 431 <$1B 28,007 490 16,657 59ABS Investors LLC GA 11,100 235 <$1B 79,069 428 67,969 193Security Bank Corporation GA 10,639 291 $1B-$10B 53,763 429 43,124 138Bartow Bancshares, Inc. GA 10,527 331 <$1B 42,768 431 32,241 100
Bank of The West CA 94,864 4,461 >$50B 348,668 5,165 253,804 704Central Pacific Financial Company HI 40,988 801 $1B-$10B 227,279 1,269 186,291 468Wells Fargo & Company CA 36,548 1,217 >$50B 39,036 1,233 2,488 16Citigroup, Inc. NY 29,790 5,420 >$50B 30,117 5,422 327 2Bank of Hawaii Corporation HI 28,707 768 $1B-$10B 98,087 955 69,380 187Capital One FSB VA 28,350 8,989 $10B-$50B 28,350 8,989 0 0MBNA Corporation DE 19,790 3,612 >$50B 21,878 3,621 2,088 9JPMorgan Chase & Co. NY 17,519 1,781 >$50B 17,519 1,781 0 0Hawaii National Bancshares HI 17,265 427 <$1B 91,644 640 74,379 213American Savings Bank HI 13,540 428 $1B-$10B 61,398 566 47,858 138Advanta Bank Corporation UT 10,272 1,280 $1B-$10B 10,272 1,280 0 0
Wells Fargo & Company CA 195,448 7,867 >$50B 625,799 9,196 430,351 1,329U.S. Bancorp MN 58,668 3,080 >$50B 243,820 3,582 185,152 502The Bank of Commerce ID 32,122 1,050 <$1B 126,391 1,318 94,269 268Capital One FSB VA 30,250 10,007 $10B-$50B 30,250 10,007 0 0Zions Bancorporation UT 30,168 785 $10B-$50B 119,458 1,092 89,290 307Intermountain Community Bancorp ID 28,041 700 <$1B 98,580 969 70,539 269F & M Holding Company ID 27,717 840 <$1B 99,928 1,078 72,211 238Idaho Independent Bank ID 27,548 673 <$1B 111,667 949 84,119 276Citigroup, Inc. NY 23,801 4,898 >$50B 23,801 4,898 0 0Farmers Bancorporation, Inc. ID 22,611 752 <$1B 60,539 890 37,928 138D. L. Evans Bancorp ID 20,873 625 <$1B 74,593 836 53,720 211MBNA Corporation DE 18,448 3,469 >$50B 21,411 3,478 2,963 9Bank of America Corporation NC 18,200 1,406 >$50B 41,238 1,462 23,038 56W.T.B. Financial Corporation WA 17,549 481 $1B-$10B 121,687 769 104,138 288JPMorgan Chase & Co. NY 16,962 1,636 >$50B 17,798 1,640 836 4Americanwest Bancorporation WA 13,528 370 $1B-$10B 37,296 469 23,768 99Keycorp OH 13,466 322 >$50B 92,004 549 78,538 227Advanta Bank Corporation UT 13,226 1,595 $1B-$10B 13,226 1,595 0 0
JPMorgan Chase & Co. NY 311,854 23,465 >$50B 752,287 24,583 440,433 1,118Citigroup, Inc. NY 293,534 48,311 >$50B 294,907 48,317 1,373 6Wells Fargo & Company CA 218,200 8,000 >$50B 267,692 8,178 49,492 178Capital One FSB VA 203,115 60,369 $10B-$50B 203,865 60,374 750 5
Idaho
Hawaii
Illinois
Page 89

4B. Top Micro Business Lenders by State and Territory Using CRA Data, 2004
State or Territory Lending Institution
HQ Location SSBL $(1,000) SSBL#
Institution Asset Size LSBL$ (1,000) LSBL# LSBL(2) $(1,000) LSBL(2)#
(1) (2) (3) (4) (5) (6) (7)
Mirco Business Lending (<$100k) Small Business Lending (<$1M) Small Business Lending (<$100k- $1M)
Lasalle Bank IL 173,293 4,329 >$50B 839,042 5,806 665,749 1,477MBNA Corporation DE 156,614 29,148 >$50B 181,736 29,234 25,122 86U.S. Bancorp MN 116,344 6,776 >$50B 409,689 7,685 293,345 909Harris Trust And Savings Bank IL 107,816 5,436 $10B-$50B 648,647 6,985 540,831 1,549Advanta Bank Corporation UT 94,306 11,567 $1B-$10B 94,306 11,567 0 0First Midwest Bancorp, Inc. IL 82,793 1,957 $1B-$10B 560,785 3,311 477,992 1,354GE Capital Financial Inc. UT 69,022 17,797 $1B-$10B 69,997 17,800 975 3The Pitney Bowes Bank UT 63,665 11,648 <$1B 63,665 11,648 0 0American Express Centurion Bank UT 61,203 6,983 $10B-$50B 61,758 6,986 555 3Bank of America Corporation NC 55,161 4,083 >$50B 109,046 4,206 53,885 123Fifth Third Bancorp OH 53,129 954 >$50B 571,324 2,338 518,195 1,384MB Financial, Inc. IL 42,566 804 $1B-$10B 452,142 1,873 409,576 1,069First Mid-Illinois Bancshare IL 37,544 1,217 <$1B 128,825 1,518 91,281 301National City Corporation OH 37,401 1,732 >$50B 173,814 2,152 136,413 420First Banks, Inc. MO 34,501 1,044 $1B-$10B 141,498 1,360 106,997 316Wintrust Financial Corporation IL 31,312 683 $1B-$10B 248,146 1,291 216,834 608Citibank FSB NY 29,804 816 $10B-$50B 99,979 1,026 70,175 210American Chartered Bancorp IL 28,721 505 $1B-$10B 257,552 1,049 228,831 544Old Second Bancorp, Inc. IL 27,766 826 $1B-$10B 162,443 1,222 134,677 396Alpine Bancorporation, Inc. IL 26,352 886 <$1B 51,906 963 25,554 77West Suburban Bancorp, Inc. IL 26,037 513 $1B-$10B 282,602 1,207 256,565 694Regions Financial Corporation AL 25,447 638 >$50B 127,709 940 102,262 302Banc Ed Corp. IL 25,175 641 $1B-$10B 115,515 914 90,340 273Associated Banc-Corp WI 24,135 581 $10B-$50B 230,123 1,089 205,988 508Banterra Corp. IL 22,618 736 <$1B 85,943 933 63,325 197Heartland Bancorp, Inc. IL 21,210 624 <$1B 87,385 816 66,175 192Lauritzen Corporation NE 20,724 950 $10B-$50B 77,478 1,133 56,754 183Princeton National Bancorp IL 19,042 560 <$1B 101,846 817 82,804 257Standard Bancshares, Inc. IL 18,006 362 $1B-$10B 144,031 735 126,025 373Metropolitan Bank Group, Inc. IL 17,265 345 $1B-$10B 194,232 852 176,967 507Old National Bancorp IN 17,231 548 $1B-$10B 70,535 717 53,304 169Midwest Banc Holdings, Inc. IL 17,018 421 $1B-$10B 122,130 717 105,112 296West Pointe Bancorp, Inc. IL 16,822 407 <$1B 84,183 621 67,361 214First American Bank Corp. IL 16,611 356 $1B-$10B 213,205 801 196,594 445Great Lakes Financial Resource IL 16,513 372 <$1B 80,049 566 63,536 194Home State Bancorp, Inc. IL 15,753 490 <$1B 91,803 704 76,050 214First Busey Corporation IL 14,810 418 $1B-$10B 69,708 586 54,898 168Taylor Capital Group, Inc. IL 14,393 250 $1B-$10B 132,369 571 117,976 321Midland States Bancorp, Inc. IL 14,384 385 <$1B 57,892 515 43,508 130Hometown Community Bancorp IL 14,339 469 $1B-$10B 61,327 615 46,988 146Market Street Bancshares, Inc. IL 14,202 472 <$1B 52,824 600 38,622 128Commerce Bancshares, Inc. MO 14,151 425 $10B-$50B 89,433 632 75,282 207Illinois National Bancorp, Inc. IL 14,086 464 <$1B 85,638 747 71,552 283Peotone Bancorp, Inc. IL 13,764 286 $1B-$10B 101,137 545 87,373 259Wright Express FSC UT 13,456 2,296 <$1B 14,361 2,301 905 5First Oak Brook Bancshares IL 13,261 332 $1B-$10B 34,574 385 21,313 53FBOP Corporation IL 12,452 242 $10B-$50B 115,875 529 103,423 287
Page 90

4B. Top Micro Business Lenders by State and Territory Using CRA Data, 2004
State or Territory Lending Institution
HQ Location SSBL $(1,000) SSBL#
Institution Asset Size LSBL$ (1,000) LSBL# LSBL(2) $(1,000) LSBL(2)#
(1) (2) (3) (4) (5) (6) (7)
Mirco Business Lending (<$100k) Small Business Lending (<$1M) Small Business Lending (<$100k- $1M)
Northern Trust Corporation IL 12,232 255 $10B-$50B 88,397 458 76,165 203Heartland Financial USA, Inc. IA 12,184 311 $1B-$10B 60,773 470 48,589 159Main Street Trust, Inc. IL 12,070 376 $1B-$10B 74,691 553 62,621 177Unionbancorp, Inc. IL 11,522 417 <$1B 50,350 545 38,828 128Privatebancorp, Inc. IL 11,516 186 $1B-$10B 129,177 476 117,661 290Mid Illinois Bancorp, Inc. IL 11,219 301 <$1B 46,349 409 35,130 108Blackhawk Bancorp, Inc. WI 10,853 265 <$1B 58,197 416 47,344 151Spring Bancorp, Inc. IL 10,839 254 <$1B 78,628 447 67,789 193
Wells Fargo & Company CA 134,390 5,090 >$50B 237,668 5,390 103,278 300JPMorgan Chase & Co. NY 112,480 9,005 >$50B 354,101 9,665 241,621 660MBNA Corporation DE 96,488 19,280 >$50B 105,783 19,314 9,295 34Old National Bancorp IN 89,736 2,378 $1B-$10B 401,287 3,335 311,551 957Fifth Third Bancorp OH 87,333 1,809 >$50B 697,476 3,515 610,143 1,706Citigroup, Inc. NY 80,969 15,268 >$50B 81,449 15,271 480 3Capital One FSB VA 79,126 24,848 $10B-$50B 79,701 24,852 575 4First Merchants Corporation IN 65,660 1,772 $1B-$10B 271,552 2,455 205,892 683National City Corporation OH 65,166 3,039 >$50B 384,135 3,894 318,969 855Advanta Bank Corporation UT 47,191 5,611 $1B-$10B 47,191 5,611 0 0GE Capital Financial Inc. UT 37,158 9,953 $1B-$10B 37,658 9,955 500 21st Source Corporation IN 35,788 832 $1B-$10B 206,622 1,372 170,834 540Lakeland Financial Corporation IN 34,028 760 $1B-$10B 237,490 1,325 203,462 565Mainsource Financial Group IN 33,746 1,346 $1B-$10B 72,559 1,486 38,813 140Star Financial Group, Inc. IN 28,224 685 $1B-$10B 156,074 1,089 127,850 404Regions Financial Corporation AL 26,577 619 >$50B 185,548 1,065 158,971 446Huntington Bancshares, Inc. OH 26,138 766 $10B-$50B 77,136 890 50,998 124First Financial Corporation IN 25,913 732 $1B-$10B 101,008 984 75,095 252First Financial Bancorp OH 25,061 777 $1B-$10B 85,074 991 60,013 214The Pitney Bowes Bank UT 24,993 4,748 <$1B 25,196 4,749 203 1U.S. Bancorp MN 23,834 1,700 >$50B 59,296 1,815 35,462 115Salin Bancshares, Inc. IN 22,987 466 <$1B 136,603 804 113,616 338Irwin Financial Corporation IN 22,507 386 $1B-$10B 178,808 848 156,301 462American Express Centurion Bank UT 20,387 2,233 $10B-$50B 20,602 2,234 215 1Community Bank Shares of Indiana IN 20,278 379 <$1B 121,873 694 101,595 315Crystal Valley Financial Corp. IN 19,753 625 <$1B 71,894 819 52,141 194Monroe Bancorp IN 19,115 507 <$1B 89,895 736 70,780 229Hasten Bancshares IN 15,852 445 $1B-$10B 66,398 608 50,546 163First Bancshares, Inc. IN 15,820 337 $1B-$10B 81,087 561 65,267 224Bank of America Corporation NC 15,595 1,586 >$50B 19,032 1,597 3,437 11Keycorp OH 14,433 418 >$50B 118,470 675 104,037 257First Farmers Financial Corp. IN 13,937 506 <$1B 59,632 653 45,695 147Bank Calumet, Inc. IN 13,522 293 $1B-$10B 69,465 454 55,943 161Tower Financial Corporation IN 12,431 231 <$1B 92,559 490 80,128 259Pnc Financial Services Group PA 10,338 279 >$50B 24,633 320 14,295 41
Wells Fargo & Company CA 169,574 6,837 >$50B 447,224 7,608 277,650 771U.S. Bancorp MN 100,488 4,603 >$50B 416,794 5,562 316,306 959
Indiana
Iowa
Page 91

4B. Top Micro Business Lenders by State and Territory Using CRA Data, 2004
State or Territory Lending Institution
HQ Location SSBL $(1,000) SSBL#
Institution Asset Size LSBL$ (1,000) LSBL# LSBL(2) $(1,000) LSBL(2)#
(1) (2) (3) (4) (5) (6) (7)
Mirco Business Lending (<$100k) Small Business Lending (<$1M) Small Business Lending (<$100k- $1M)
Capital One FSB VA 49,522 14,854 $10B-$50B 49,522 14,854 0 0Citigroup, Inc. NY 45,115 7,929 >$50B 45,115 7,929 0 0Neighbor Insurance Agency, Inc. IA 41,569 2,185 <$1B 81,333 2,312 39,764 127MBNA Corporation DE 41,081 8,363 >$50B 42,271 8,367 1,190 4Hills Bancorporation IA 39,332 1,247 $1B-$10B 134,688 1,560 95,356 313JPMorgan Chase & Co. NY 38,580 3,591 >$50B 41,475 3,599 2,895 8West Bancorporation, Inc. IA 30,438 774 $1B-$10B 172,272 1,157 141,834 383Advanta Bank Corporation UT 24,764 2,812 $1B-$10B 24,764 2,812 0 0Stark Bank Group Ltd. IA 21,769 560 $1B-$10B 158,486 931 136,717 371Great Western Bancorporation NE 18,506 669 $1B-$10B 58,779 839 40,273 170First Citizens Financial Corp. IA 18,361 929 <$1B 44,099 1,030 25,738 101GE Capital Financial Inc. UT 17,424 4,495 $1B-$10B 17,424 4,495 0 0Bank of America Corporation NC 16,255 1,293 >$50B 29,004 1,332 12,749 39IDA Grove Bancshares, Inc. IA 15,611 667 <$1B 39,997 747 24,386 80The Pitney Bowes Bank UT 14,974 2,471 <$1B 14,974 2,471 0 0QCR Holdings, Inc. IL 14,643 450 <$1B 85,016 657 70,373 207Fidelity Ban Corporation IA 14,261 576 <$1B 57,047 703 42,786 127Commercial Federal Bank NE 14,024 426 $10B-$50B 76,868 595 62,844 169Heartland Financial USA, Inc. IA 13,465 342 $1B-$10B 113,044 637 99,579 295River Valley Bancorp, Inc. IA 13,306 278 <$1B 62,146 446 48,840 168Northwest Federal Savings Bank IA 13,050 329 <$1B 71,670 513 58,620 184Iowa First Bancshares Corp. IA 12,590 371 <$1B 53,730 501 41,140 130Lauritzen Corporation NE 12,575 734 $10B-$50B 42,753 812 30,178 78Lincoln Bancorp IA 12,253 369 <$1B 57,671 510 45,418 141ISB Financial Corp. IA 10,602 321 <$1B 50,499 449 39,897 128Atbancorp IA 10,104 250 <$1B 62,701 399 52,597 149
Citigroup, Inc. NY 50,128 9,273 >$50B 51,139 9,279 1,011 6Capital One FSB VA 44,837 13,884 $10B-$50B 44,837 13,884 0 0Wells Fargo & Company CA 43,614 1,593 >$50B 49,312 1,616 5,698 23Commerce Bancshares, Inc. MO 40,668 1,470 $10B-$50B 181,226 1,865 140,558 395MBNA Corporation DE 40,025 7,880 >$50B 44,448 7,898 4,423 18Intrust Financial Corporation KS 38,770 1,380 $1B-$10B 226,691 1,912 187,921 532Bank of America Corporation NC 37,902 2,473 >$50B 117,968 2,686 80,066 213JPMorgan Chase & Co. NY 34,054 3,282 >$50B 34,689 3,285 635 3Advanta Bank Corporation UT 24,204 2,938 $1B-$10B 24,204 2,938 0 0U.S. Bancorp MN 24,119 1,310 >$50B 150,492 1,655 126,373 345UMB Financial Corporation MO 23,847 793 $1B-$10B 142,131 1,087 118,284 294Hillcrest Bancshares, Inc. KS 23,635 458 $1B-$10B 75,378 669 51,743 211Sunflower Banks, Inc. KS 23,448 695 $1B-$10B 99,222 917 75,774 222Kaw Valley Bancorp, Inc. KS 22,479 816 <$1B 70,571 991 48,092 175Prairie Capital, Inc. KS 22,077 1,051 <$1B 55,142 1,167 33,065 116Commerce Financial Corporation KS 20,489 921 $1B-$10B 87,480 1,127 66,991 206Central Of Kansas, Inc. KS 19,891 834 <$1B 51,372 958 31,481 124GE Capital Financial, Inc. UT 16,529 4,426 $1B-$10B 17,029 4,428 500 2The Pitney Bowes Bank UT 15,479 2,727 <$1B 16,088 2,730 609 3GN Bankshares, Inc. KS 15,048 755 <$1B 39,468 839 24,420 84
Kansas
Page 92
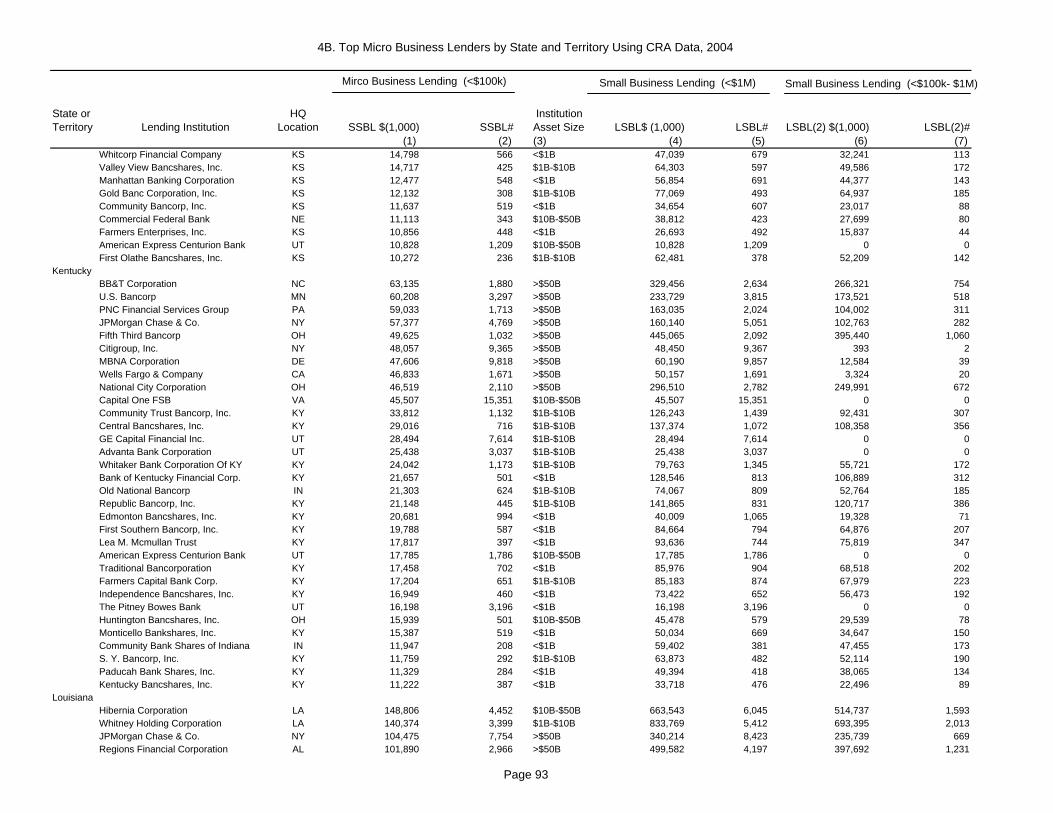
4B. Top Micro Business Lenders by State and Territory Using CRA Data, 2004
State or Territory Lending Institution
HQ Location SSBL $(1,000) SSBL#
Institution Asset Size LSBL$ (1,000) LSBL# LSBL(2) $(1,000) LSBL(2)#
(1) (2) (3) (4) (5) (6) (7)
Mirco Business Lending (<$100k) Small Business Lending (<$1M) Small Business Lending (<$100k- $1M)
Whitcorp Financial Company KS 14,798 566 <$1B 47,039 679 32,241 113Valley View Bancshares, Inc. KS 14,717 425 $1B-$10B 64,303 597 49,586 172Manhattan Banking Corporation KS 12,477 548 <$1B 56,854 691 44,377 143Gold Banc Corporation, Inc. KS 12,132 308 $1B-$10B 77,069 493 64,937 185Community Bancorp, Inc. KS 11,637 519 <$1B 34,654 607 23,017 88Commercial Federal Bank NE 11,113 343 $10B-$50B 38,812 423 27,699 80Farmers Enterprises, Inc. KS 10,856 448 <$1B 26,693 492 15,837 44American Express Centurion Bank UT 10,828 1,209 $10B-$50B 10,828 1,209 0 0First Olathe Bancshares, Inc. KS 10,272 236 $1B-$10B 62,481 378 52,209 142
BB&T Corporation NC 63,135 1,880 >$50B 329,456 2,634 266,321 754U.S. Bancorp MN 60,208 3,297 >$50B 233,729 3,815 173,521 518PNC Financial Services Group PA 59,033 1,713 >$50B 163,035 2,024 104,002 311JPMorgan Chase & Co. NY 57,377 4,769 >$50B 160,140 5,051 102,763 282Fifth Third Bancorp OH 49,625 1,032 >$50B 445,065 2,092 395,440 1,060Citigroup, Inc. NY 48,057 9,365 >$50B 48,450 9,367 393 2MBNA Corporation DE 47,606 9,818 >$50B 60,190 9,857 12,584 39Wells Fargo & Company CA 46,833 1,671 >$50B 50,157 1,691 3,324 20National City Corporation OH 46,519 2,110 >$50B 296,510 2,782 249,991 672Capital One FSB VA 45,507 15,351 $10B-$50B 45,507 15,351 0 0Community Trust Bancorp, Inc. KY 33,812 1,132 $1B-$10B 126,243 1,439 92,431 307Central Bancshares, Inc. KY 29,016 716 $1B-$10B 137,374 1,072 108,358 356GE Capital Financial Inc. UT 28,494 7,614 $1B-$10B 28,494 7,614 0 0Advanta Bank Corporation UT 25,438 3,037 $1B-$10B 25,438 3,037 0 0Whitaker Bank Corporation Of KY KY 24,042 1,173 $1B-$10B 79,763 1,345 55,721 172Bank of Kentucky Financial Corp. KY 21,657 501 <$1B 128,546 813 106,889 312Old National Bancorp IN 21,303 624 $1B-$10B 74,067 809 52,764 185Republic Bancorp, Inc. KY 21,148 445 $1B-$10B 141,865 831 120,717 386Edmonton Bancshares, Inc. KY 20,681 994 <$1B 40,009 1,065 19,328 71First Southern Bancorp, Inc. KY 19,788 587 <$1B 84,664 794 64,876 207Lea M. Mcmullan Trust KY 17,817 397 <$1B 93,636 744 75,819 347American Express Centurion Bank UT 17,785 1,786 $10B-$50B 17,785 1,786 0 0Traditional Bancorporation KY 17,458 702 <$1B 85,976 904 68,518 202Farmers Capital Bank Corp. KY 17,204 651 $1B-$10B 85,183 874 67,979 223Independence Bancshares, Inc. KY 16,949 460 <$1B 73,422 652 56,473 192The Pitney Bowes Bank UT 16,198 3,196 <$1B 16,198 3,196 0 0Huntington Bancshares, Inc. OH 15,939 501 $10B-$50B 45,478 579 29,539 78Monticello Bankshares, Inc. KY 15,387 519 <$1B 50,034 669 34,647 150Community Bank Shares of Indiana IN 11,947 208 <$1B 59,402 381 47,455 173S. Y. Bancorp, Inc. KY 11,759 292 $1B-$10B 63,873 482 52,114 190Paducah Bank Shares, Inc. KY 11,329 284 <$1B 49,394 418 38,065 134Kentucky Bancshares, Inc. KY 11,222 387 <$1B 33,718 476 22,496 89
Hibernia Corporation LA 148,806 4,452 $10B-$50B 663,543 6,045 514,737 1,593Whitney Holding Corporation LA 140,374 3,399 $1B-$10B 833,769 5,412 693,395 2,013JPMorgan Chase & Co. NY 104,475 7,754 >$50B 340,214 8,423 235,739 669Regions Financial Corporation AL 101,890 2,966 >$50B 499,582 4,197 397,692 1,231
Louisiana
Kentucky
Page 93
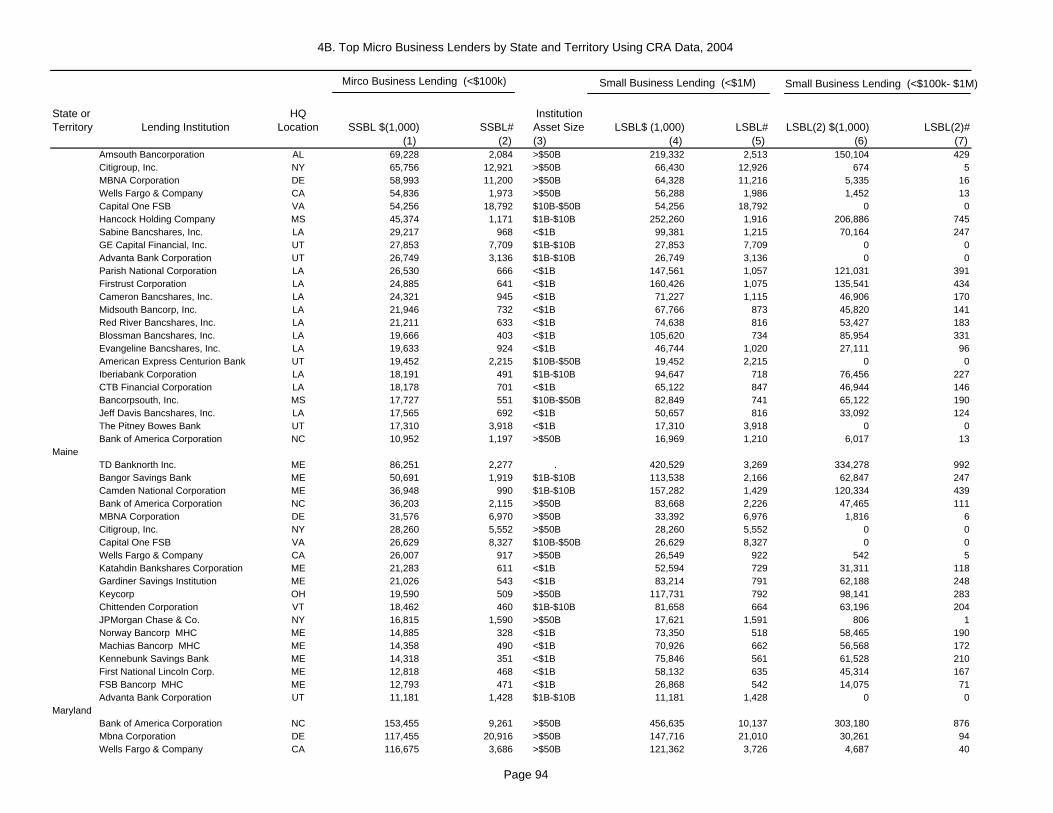
4B. Top Micro Business Lenders by State and Territory Using CRA Data, 2004
State or Territory Lending Institution
HQ Location SSBL $(1,000) SSBL#
Institution Asset Size LSBL$ (1,000) LSBL# LSBL(2) $(1,000) LSBL(2)#
(1) (2) (3) (4) (5) (6) (7)
Mirco Business Lending (<$100k) Small Business Lending (<$1M) Small Business Lending (<$100k- $1M)
Amsouth Bancorporation AL 69,228 2,084 >$50B 219,332 2,513 150,104 429Citigroup, Inc. NY 65,756 12,921 >$50B 66,430 12,926 674 5MBNA Corporation DE 58,993 11,200 >$50B 64,328 11,216 5,335 16Wells Fargo & Company CA 54,836 1,973 >$50B 56,288 1,986 1,452 13Capital One FSB VA 54,256 18,792 $10B-$50B 54,256 18,792 0 0Hancock Holding Company MS 45,374 1,171 $1B-$10B 252,260 1,916 206,886 745Sabine Bancshares, Inc. LA 29,217 968 <$1B 99,381 1,215 70,164 247GE Capital Financial, Inc. UT 27,853 7,709 $1B-$10B 27,853 7,709 0 0Advanta Bank Corporation UT 26,749 3,136 $1B-$10B 26,749 3,136 0 0Parish National Corporation LA 26,530 666 <$1B 147,561 1,057 121,031 391Firstrust Corporation LA 24,885 641 <$1B 160,426 1,075 135,541 434Cameron Bancshares, Inc. LA 24,321 945 <$1B 71,227 1,115 46,906 170Midsouth Bancorp, Inc. LA 21,946 732 <$1B 67,766 873 45,820 141Red River Bancshares, Inc. LA 21,211 633 <$1B 74,638 816 53,427 183Blossman Bancshares, Inc. LA 19,666 403 <$1B 105,620 734 85,954 331Evangeline Bancshares, Inc. LA 19,633 924 <$1B 46,744 1,020 27,111 96American Express Centurion Bank UT 19,452 2,215 $10B-$50B 19,452 2,215 0 0Iberiabank Corporation LA 18,191 491 $1B-$10B 94,647 718 76,456 227CTB Financial Corporation LA 18,178 701 <$1B 65,122 847 46,944 146Bancorpsouth, Inc. MS 17,727 551 $10B-$50B 82,849 741 65,122 190Jeff Davis Bancshares, Inc. LA 17,565 692 <$1B 50,657 816 33,092 124The Pitney Bowes Bank UT 17,310 3,918 <$1B 17,310 3,918 0 0Bank of America Corporation NC 10,952 1,197 >$50B 16,969 1,210 6,017 13
TD Banknorth Inc. ME 86,251 2,277 . 420,529 3,269 334,278 992Bangor Savings Bank ME 50,691 1,919 $1B-$10B 113,538 2,166 62,847 247Camden National Corporation ME 36,948 990 $1B-$10B 157,282 1,429 120,334 439Bank of America Corporation NC 36,203 2,115 >$50B 83,668 2,226 47,465 111MBNA Corporation DE 31,576 6,970 >$50B 33,392 6,976 1,816 6Citigroup, Inc. NY 28,260 5,552 >$50B 28,260 5,552 0 0Capital One FSB VA 26,629 8,327 $10B-$50B 26,629 8,327 0 0Wells Fargo & Company CA 26,007 917 >$50B 26,549 922 542 5Katahdin Bankshares Corporation ME 21,283 611 <$1B 52,594 729 31,311 118Gardiner Savings Institution ME 21,026 543 <$1B 83,214 791 62,188 248Keycorp OH 19,590 509 >$50B 117,731 792 98,141 283Chittenden Corporation VT 18,462 460 $1B-$10B 81,658 664 63,196 204JPMorgan Chase & Co. NY 16,815 1,590 >$50B 17,621 1,591 806 1Norway Bancorp MHC ME 14,885 328 <$1B 73,350 518 58,465 190Machias Bancorp MHC ME 14,358 490 <$1B 70,926 662 56,568 172Kennebunk Savings Bank ME 14,318 351 <$1B 75,846 561 61,528 210First National Lincoln Corp. ME 12,818 468 <$1B 58,132 635 45,314 167FSB Bancorp MHC ME 12,793 471 <$1B 26,868 542 14,075 71Advanta Bank Corporation UT 11,181 1,428 $1B-$10B 11,181 1,428 0 0
Bank of America Corporation NC 153,455 9,261 >$50B 456,635 10,137 303,180 876Mbna Corporation DE 117,455 20,916 >$50B 147,716 21,010 30,261 94Wells Fargo & Company CA 116,675 3,686 >$50B 121,362 3,726 4,687 40
Maine
Maryland
Page 94
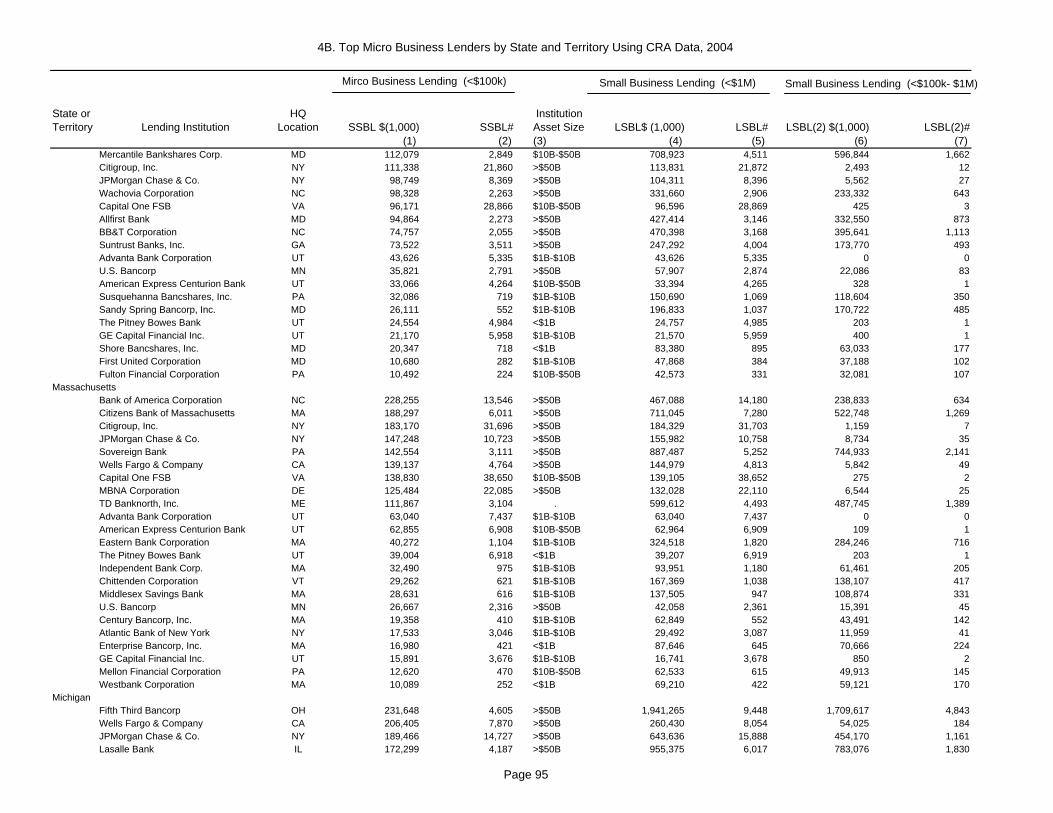
4B. Top Micro Business Lenders by State and Territory Using CRA Data, 2004
State or Territory Lending Institution
HQ Location SSBL $(1,000) SSBL#
Institution Asset Size LSBL$ (1,000) LSBL# LSBL(2) $(1,000) LSBL(2)#
(1) (2) (3) (4) (5) (6) (7)
Mirco Business Lending (<$100k) Small Business Lending (<$1M) Small Business Lending (<$100k- $1M)
Mercantile Bankshares Corp. MD 112,079 2,849 $10B-$50B 708,923 4,511 596,844 1,662Citigroup, Inc. NY 111,338 21,860 >$50B 113,831 21,872 2,493 12JPMorgan Chase & Co. NY 98,749 8,369 >$50B 104,311 8,396 5,562 27Wachovia Corporation NC 98,328 2,263 >$50B 331,660 2,906 233,332 643Capital One FSB VA 96,171 28,866 $10B-$50B 96,596 28,869 425 3Allfirst Bank MD 94,864 2,273 >$50B 427,414 3,146 332,550 873BB&T Corporation NC 74,757 2,055 >$50B 470,398 3,168 395,641 1,113Suntrust Banks, Inc. GA 73,522 3,511 >$50B 247,292 4,004 173,770 493Advanta Bank Corporation UT 43,626 5,335 $1B-$10B 43,626 5,335 0 0U.S. Bancorp MN 35,821 2,791 >$50B 57,907 2,874 22,086 83American Express Centurion Bank UT 33,066 4,264 $10B-$50B 33,394 4,265 328 1Susquehanna Bancshares, Inc. PA 32,086 719 $1B-$10B 150,690 1,069 118,604 350Sandy Spring Bancorp, Inc. MD 26,111 552 $1B-$10B 196,833 1,037 170,722 485The Pitney Bowes Bank UT 24,554 4,984 <$1B 24,757 4,985 203 1GE Capital Financial Inc. UT 21,170 5,958 $1B-$10B 21,570 5,959 400 1Shore Bancshares, Inc. MD 20,347 718 <$1B 83,380 895 63,033 177First United Corporation MD 10,680 282 $1B-$10B 47,868 384 37,188 102Fulton Financial Corporation PA 10,492 224 $10B-$50B 42,573 331 32,081 107
Bank of America Corporation NC 228,255 13,546 >$50B 467,088 14,180 238,833 634Citizens Bank of Massachusetts MA 188,297 6,011 >$50B 711,045 7,280 522,748 1,269Citigroup, Inc. NY 183,170 31,696 >$50B 184,329 31,703 1,159 7JPMorgan Chase & Co. NY 147,248 10,723 >$50B 155,982 10,758 8,734 35Sovereign Bank PA 142,554 3,111 >$50B 887,487 5,252 744,933 2,141Wells Fargo & Company CA 139,137 4,764 >$50B 144,979 4,813 5,842 49Capital One FSB VA 138,830 38,650 $10B-$50B 139,105 38,652 275 2MBNA Corporation DE 125,484 22,085 >$50B 132,028 22,110 6,544 25TD Banknorth, Inc. ME 111,867 3,104 . 599,612 4,493 487,745 1,389Advanta Bank Corporation UT 63,040 7,437 $1B-$10B 63,040 7,437 0 0American Express Centurion Bank UT 62,855 6,908 $10B-$50B 62,964 6,909 109 1Eastern Bank Corporation MA 40,272 1,104 $1B-$10B 324,518 1,820 284,246 716The Pitney Bowes Bank UT 39,004 6,918 <$1B 39,207 6,919 203 1Independent Bank Corp. MA 32,490 975 $1B-$10B 93,951 1,180 61,461 205Chittenden Corporation VT 29,262 621 $1B-$10B 167,369 1,038 138,107 417Middlesex Savings Bank MA 28,631 616 $1B-$10B 137,505 947 108,874 331U.S. Bancorp MN 26,667 2,316 >$50B 42,058 2,361 15,391 45Century Bancorp, Inc. MA 19,358 410 $1B-$10B 62,849 552 43,491 142Atlantic Bank of New York NY 17,533 3,046 $1B-$10B 29,492 3,087 11,959 41Enterprise Bancorp, Inc. MA 16,980 421 <$1B 87,646 645 70,666 224GE Capital Financial Inc. UT 15,891 3,676 $1B-$10B 16,741 3,678 850 2Mellon Financial Corporation PA 12,620 470 $10B-$50B 62,533 615 49,913 145Westbank Corporation MA 10,089 252 <$1B 69,210 422 59,121 170
Fifth Third Bancorp OH 231,648 4,605 >$50B 1,941,265 9,448 1,709,617 4,843Wells Fargo & Company CA 206,405 7,870 >$50B 260,430 8,054 54,025 184JPMorgan Chase & Co. NY 189,466 14,727 >$50B 643,636 15,888 454,170 1,161Lasalle Bank IL 172,299 4,187 >$50B 955,375 6,017 783,076 1,830
Michigan
Massachusetts
Page 95
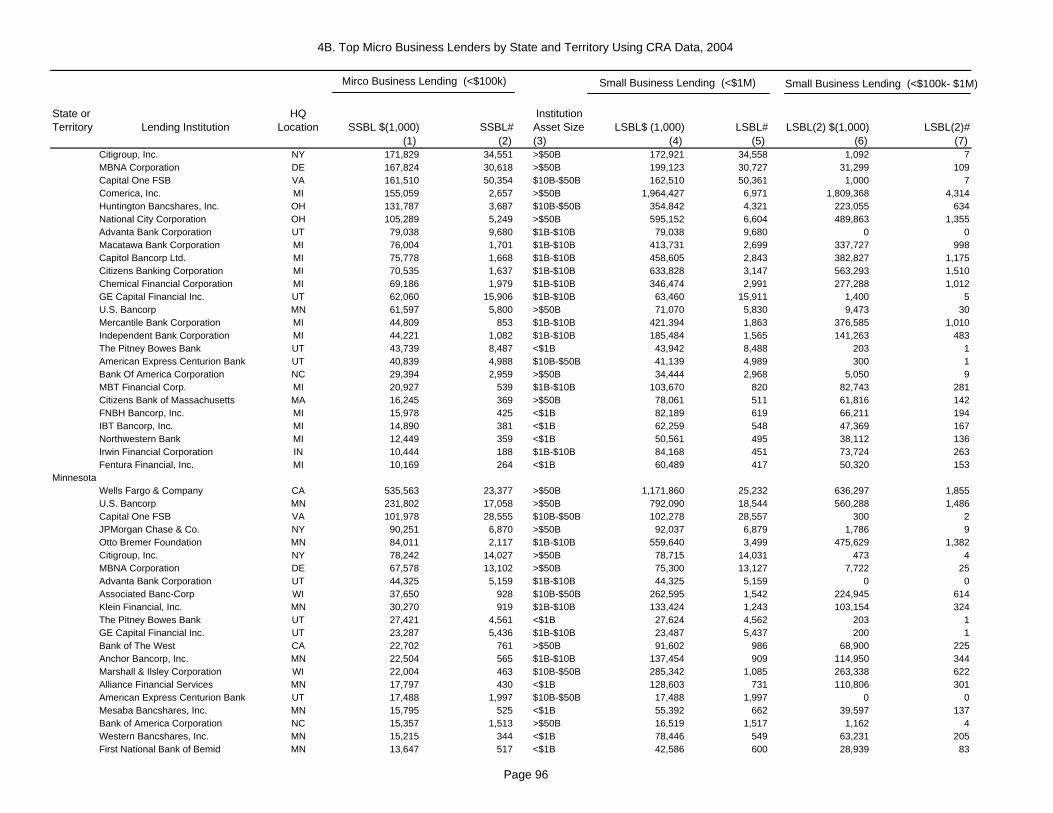
4B. Top Micro Business Lenders by State and Territory Using CRA Data, 2004
State or Territory Lending Institution
HQ Location SSBL $(1,000) SSBL#
Institution Asset Size LSBL$ (1,000) LSBL# LSBL(2) $(1,000) LSBL(2)#
(1) (2) (3) (4) (5) (6) (7)
Mirco Business Lending (<$100k) Small Business Lending (<$1M) Small Business Lending (<$100k- $1M)
Citigroup, Inc. NY 171,829 34,551 >$50B 172,921 34,558 1,092 7MBNA Corporation DE 167,824 30,618 >$50B 199,123 30,727 31,299 109Capital One FSB VA 161,510 50,354 $10B-$50B 162,510 50,361 1,000 7Comerica, Inc. MI 155,059 2,657 >$50B 1,964,427 6,971 1,809,368 4,314Huntington Bancshares, Inc. OH 131,787 3,687 $10B-$50B 354,842 4,321 223,055 634National City Corporation OH 105,289 5,249 >$50B 595,152 6,604 489,863 1,355Advanta Bank Corporation UT 79,038 9,680 $1B-$10B 79,038 9,680 0 0Macatawa Bank Corporation MI 76,004 1,701 $1B-$10B 413,731 2,699 337,727 998Capitol Bancorp Ltd. MI 75,778 1,668 $1B-$10B 458,605 2,843 382,827 1,175Citizens Banking Corporation MI 70,535 1,637 $1B-$10B 633,828 3,147 563,293 1,510Chemical Financial Corporation MI 69,186 1,979 $1B-$10B 346,474 2,991 277,288 1,012GE Capital Financial Inc. UT 62,060 15,906 $1B-$10B 63,460 15,911 1,400 5U.S. Bancorp MN 61,597 5,800 >$50B 71,070 5,830 9,473 30Mercantile Bank Corporation MI 44,809 853 $1B-$10B 421,394 1,863 376,585 1,010Independent Bank Corporation MI 44,221 1,082 $1B-$10B 185,484 1,565 141,263 483The Pitney Bowes Bank UT 43,739 8,487 <$1B 43,942 8,488 203 1American Express Centurion Bank UT 40,839 4,988 $10B-$50B 41,139 4,989 300 1Bank Of America Corporation NC 29,394 2,959 >$50B 34,444 2,968 5,050 9MBT Financial Corp. MI 20,927 539 $1B-$10B 103,670 820 82,743 281Citizens Bank of Massachusetts MA 16,245 369 >$50B 78,061 511 61,816 142FNBH Bancorp, Inc. MI 15,978 425 <$1B 82,189 619 66,211 194IBT Bancorp, Inc. MI 14,890 381 <$1B 62,259 548 47,369 167Northwestern Bank MI 12,449 359 <$1B 50,561 495 38,112 136Irwin Financial Corporation IN 10,444 188 $1B-$10B 84,168 451 73,724 263Fentura Financial, Inc. MI 10,169 264 <$1B 60,489 417 50,320 153
Wells Fargo & Company CA 535,563 23,377 >$50B 1,171,860 25,232 636,297 1,855U.S. Bancorp MN 231,802 17,058 >$50B 792,090 18,544 560,288 1,486Capital One FSB VA 101,978 28,555 $10B-$50B 102,278 28,557 300 2JPMorgan Chase & Co. NY 90,251 6,870 >$50B 92,037 6,879 1,786 9Otto Bremer Foundation MN 84,011 2,117 $1B-$10B 559,640 3,499 475,629 1,382Citigroup, Inc. NY 78,242 14,027 >$50B 78,715 14,031 473 4MBNA Corporation DE 67,578 13,102 >$50B 75,300 13,127 7,722 25Advanta Bank Corporation UT 44,325 5,159 $1B-$10B 44,325 5,159 0 0Associated Banc-Corp WI 37,650 928 $10B-$50B 262,595 1,542 224,945 614Klein Financial, Inc. MN 30,270 919 $1B-$10B 133,424 1,243 103,154 324The Pitney Bowes Bank UT 27,421 4,561 <$1B 27,624 4,562 203 1GE Capital Financial Inc. UT 23,287 5,436 $1B-$10B 23,487 5,437 200 1Bank of The West CA 22,702 761 >$50B 91,602 986 68,900 225Anchor Bancorp, Inc. MN 22,504 565 $1B-$10B 137,454 909 114,950 344Marshall & Ilsley Corporation WI 22,004 463 $10B-$50B 285,342 1,085 263,338 622Alliance Financial Services MN 17,797 430 <$1B 128,603 731 110,806 301American Express Centurion Bank UT 17,488 1,997 $10B-$50B 17,488 1,997 0 0Mesaba Bancshares, Inc. MN 15,795 525 <$1B 55,392 662 39,597 137Bank of America Corporation NC 15,357 1,513 >$50B 16,519 1,517 1,162 4Western Bancshares, Inc. MN 15,215 344 <$1B 78,446 549 63,231 205First National Bank of Bemid MN 13,647 517 <$1B 42,586 600 28,939 83
Minnesota
Page 96
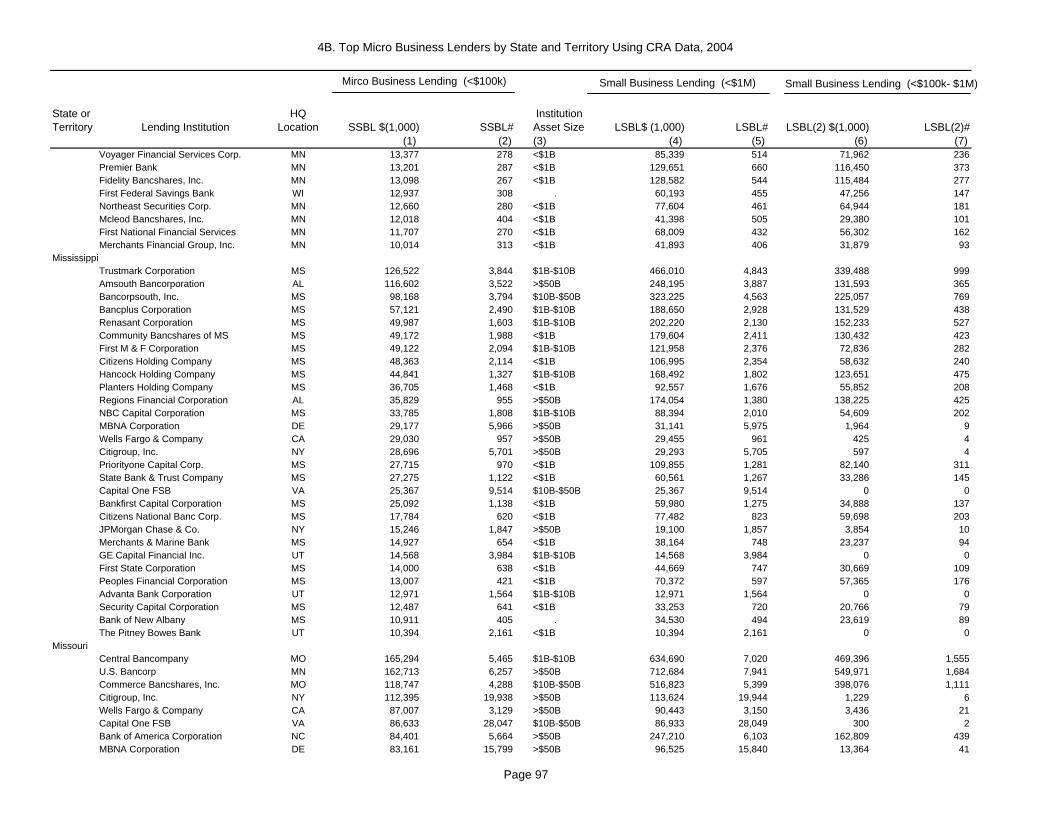
4B. Top Micro Business Lenders by State and Territory Using CRA Data, 2004
State or Territory Lending Institution
HQ Location SSBL $(1,000) SSBL#
Institution Asset Size LSBL$ (1,000) LSBL# LSBL(2) $(1,000) LSBL(2)#
(1) (2) (3) (4) (5) (6) (7)
Mirco Business Lending (<$100k) Small Business Lending (<$1M) Small Business Lending (<$100k- $1M)
Voyager Financial Services Corp. MN 13,377 278 <$1B 85,339 514 71,962 236Premier Bank MN 13,201 287 <$1B 129,651 660 116,450 373Fidelity Bancshares, Inc. MN 13,098 267 <$1B 128,582 544 115,484 277First Federal Savings Bank WI 12,937 308 . 60,193 455 47,256 147Northeast Securities Corp. MN 12,660 280 <$1B 77,604 461 64,944 181Mcleod Bancshares, Inc. MN 12,018 404 <$1B 41,398 505 29,380 101First National Financial Services MN 11,707 270 <$1B 68,009 432 56,302 162Merchants Financial Group, Inc. MN 10,014 313 <$1B 41,893 406 31,879 93
Trustmark Corporation MS 126,522 3,844 $1B-$10B 466,010 4,843 339,488 999Amsouth Bancorporation AL 116,602 3,522 >$50B 248,195 3,887 131,593 365Bancorpsouth, Inc. MS 98,168 3,794 $10B-$50B 323,225 4,563 225,057 769Bancplus Corporation MS 57,121 2,490 $1B-$10B 188,650 2,928 131,529 438Renasant Corporation MS 49,987 1,603 $1B-$10B 202,220 2,130 152,233 527Community Bancshares of MS MS 49,172 1,988 <$1B 179,604 2,411 130,432 423First M & F Corporation MS 49,122 2,094 $1B-$10B 121,958 2,376 72,836 282Citizens Holding Company MS 48,363 2,114 <$1B 106,995 2,354 58,632 240Hancock Holding Company MS 44,841 1,327 $1B-$10B 168,492 1,802 123,651 475Planters Holding Company MS 36,705 1,468 <$1B 92,557 1,676 55,852 208Regions Financial Corporation AL 35,829 955 >$50B 174,054 1,380 138,225 425NBC Capital Corporation MS 33,785 1,808 $1B-$10B 88,394 2,010 54,609 202MBNA Corporation DE 29,177 5,966 >$50B 31,141 5,975 1,964 9Wells Fargo & Company CA 29,030 957 >$50B 29,455 961 425 4Citigroup, Inc. NY 28,696 5,701 >$50B 29,293 5,705 597 4Priorityone Capital Corp. MS 27,715 970 <$1B 109,855 1,281 82,140 311State Bank & Trust Company MS 27,275 1,122 <$1B 60,561 1,267 33,286 145Capital One FSB VA 25,367 9,514 $10B-$50B 25,367 9,514 0 0Bankfirst Capital Corporation MS 25,092 1,138 <$1B 59,980 1,275 34,888 137Citizens National Banc Corp. MS 17,784 620 <$1B 77,482 823 59,698 203JPMorgan Chase & Co. NY 15,246 1,847 >$50B 19,100 1,857 3,854 10Merchants & Marine Bank MS 14,927 654 <$1B 38,164 748 23,237 94GE Capital Financial Inc. UT 14,568 3,984 $1B-$10B 14,568 3,984 0 0First State Corporation MS 14,000 638 <$1B 44,669 747 30,669 109Peoples Financial Corporation MS 13,007 421 <$1B 70,372 597 57,365 176Advanta Bank Corporation UT 12,971 1,564 $1B-$10B 12,971 1,564 0 0Security Capital Corporation MS 12,487 641 <$1B 33,253 720 20,766 79Bank of New Albany MS 10,911 405 . 34,530 494 23,619 89The Pitney Bowes Bank UT 10,394 2,161 <$1B 10,394 2,161 0 0
Central Bancompany MO 165,294 5,465 $1B-$10B 634,690 7,020 469,396 1,555U.S. Bancorp MN 162,713 6,257 >$50B 712,684 7,941 549,971 1,684Commerce Bancshares, Inc. MO 118,747 4,288 $10B-$50B 516,823 5,399 398,076 1,111Citigroup, Inc. NY 112,395 19,938 >$50B 113,624 19,944 1,229 6Wells Fargo & Company CA 87,007 3,129 >$50B 90,443 3,150 3,436 21Capital One FSB VA 86,633 28,047 $10B-$50B 86,933 28,049 300 2Bank of America Corporation NC 84,401 5,664 >$50B 247,210 6,103 162,809 439MBNA Corporation DE 83,161 15,799 >$50B 96,525 15,840 13,364 41
Mississippi
Missouri
Page 97
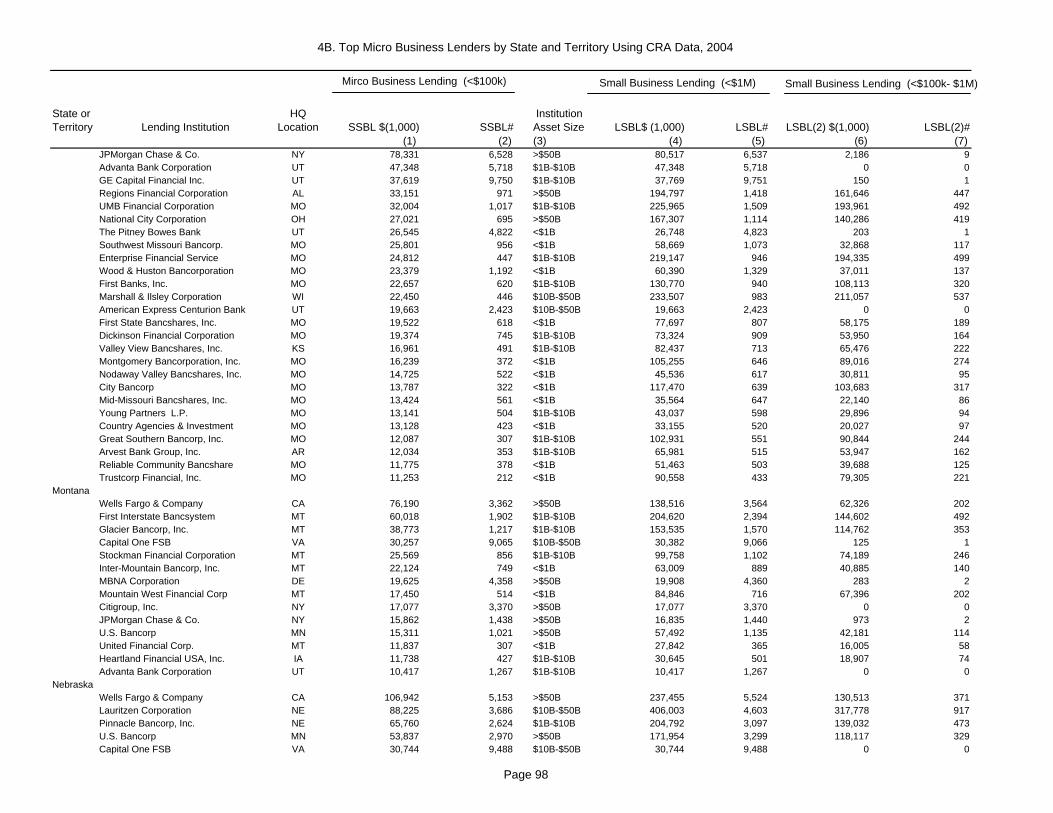
4B. Top Micro Business Lenders by State and Territory Using CRA Data, 2004
State or Territory Lending Institution
HQ Location SSBL $(1,000) SSBL#
Institution Asset Size LSBL$ (1,000) LSBL# LSBL(2) $(1,000) LSBL(2)#
(1) (2) (3) (4) (5) (6) (7)
Mirco Business Lending (<$100k) Small Business Lending (<$1M) Small Business Lending (<$100k- $1M)
JPMorgan Chase & Co. NY 78,331 6,528 >$50B 80,517 6,537 2,186 9Advanta Bank Corporation UT 47,348 5,718 $1B-$10B 47,348 5,718 0 0GE Capital Financial Inc. UT 37,619 9,750 $1B-$10B 37,769 9,751 150 1Regions Financial Corporation AL 33,151 971 >$50B 194,797 1,418 161,646 447UMB Financial Corporation MO 32,004 1,017 $1B-$10B 225,965 1,509 193,961 492National City Corporation OH 27,021 695 >$50B 167,307 1,114 140,286 419The Pitney Bowes Bank UT 26,545 4,822 <$1B 26,748 4,823 203 1Southwest Missouri Bancorp. MO 25,801 956 <$1B 58,669 1,073 32,868 117Enterprise Financial Service MO 24,812 447 $1B-$10B 219,147 946 194,335 499Wood & Huston Bancorporation MO 23,379 1,192 <$1B 60,390 1,329 37,011 137First Banks, Inc. MO 22,657 620 $1B-$10B 130,770 940 108,113 320Marshall & Ilsley Corporation WI 22,450 446 $10B-$50B 233,507 983 211,057 537American Express Centurion Bank UT 19,663 2,423 $10B-$50B 19,663 2,423 0 0First State Bancshares, Inc. MO 19,522 618 <$1B 77,697 807 58,175 189Dickinson Financial Corporation MO 19,374 745 $1B-$10B 73,324 909 53,950 164Valley View Bancshares, Inc. KS 16,961 491 $1B-$10B 82,437 713 65,476 222Montgomery Bancorporation, Inc. MO 16,239 372 <$1B 105,255 646 89,016 274Nodaway Valley Bancshares, Inc. MO 14,725 522 <$1B 45,536 617 30,811 95City Bancorp MO 13,787 322 <$1B 117,470 639 103,683 317Mid-Missouri Bancshares, Inc. MO 13,424 561 <$1B 35,564 647 22,140 86Young Partners L.P. MO 13,141 504 $1B-$10B 43,037 598 29,896 94Country Agencies & Investment MO 13,128 423 <$1B 33,155 520 20,027 97Great Southern Bancorp, Inc. MO 12,087 307 $1B-$10B 102,931 551 90,844 244Arvest Bank Group, Inc. AR 12,034 353 $1B-$10B 65,981 515 53,947 162Reliable Community Bancshare MO 11,775 378 <$1B 51,463 503 39,688 125Trustcorp Financial, Inc. MO 11,253 212 <$1B 90,558 433 79,305 221
Wells Fargo & Company CA 76,190 3,362 >$50B 138,516 3,564 62,326 202First Interstate Bancsystem MT 60,018 1,902 $1B-$10B 204,620 2,394 144,602 492Glacier Bancorp, Inc. MT 38,773 1,217 $1B-$10B 153,535 1,570 114,762 353Capital One FSB VA 30,257 9,065 $10B-$50B 30,382 9,066 125 1Stockman Financial Corporation MT 25,569 856 $1B-$10B 99,758 1,102 74,189 246Inter-Mountain Bancorp, Inc. MT 22,124 749 <$1B 63,009 889 40,885 140MBNA Corporation DE 19,625 4,358 >$50B 19,908 4,360 283 2Mountain West Financial Corp MT 17,450 514 <$1B 84,846 716 67,396 202Citigroup, Inc. NY 17,077 3,370 >$50B 17,077 3,370 0 0JPMorgan Chase & Co. NY 15,862 1,438 >$50B 16,835 1,440 973 2U.S. Bancorp MN 15,311 1,021 >$50B 57,492 1,135 42,181 114United Financial Corp. MT 11,837 307 <$1B 27,842 365 16,005 58Heartland Financial USA, Inc. IA 11,738 427 $1B-$10B 30,645 501 18,907 74Advanta Bank Corporation UT 10,417 1,267 $1B-$10B 10,417 1,267 0 0
Wells Fargo & Company CA 106,942 5,153 >$50B 237,455 5,524 130,513 371Lauritzen Corporation NE 88,225 3,686 $10B-$50B 406,003 4,603 317,778 917Pinnacle Bancorp, Inc. NE 65,760 2,624 $1B-$10B 204,792 3,097 139,032 473U.S. Bancorp MN 53,837 2,970 >$50B 171,954 3,299 118,117 329Capital One FSB VA 30,744 9,488 $10B-$50B 30,744 9,488 0 0
Nebraska
Montana
Page 98
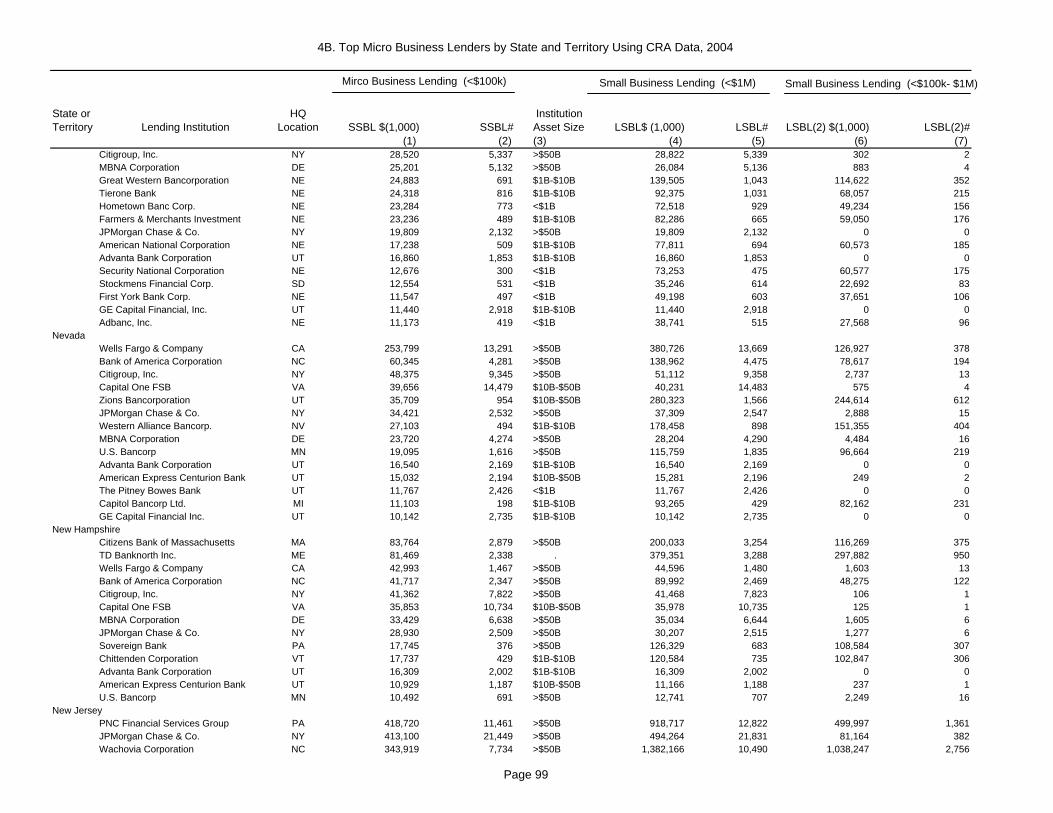
4B. Top Micro Business Lenders by State and Territory Using CRA Data, 2004
State or Territory Lending Institution
HQ Location SSBL $(1,000) SSBL#
Institution Asset Size LSBL$ (1,000) LSBL# LSBL(2) $(1,000) LSBL(2)#
(1) (2) (3) (4) (5) (6) (7)
Mirco Business Lending (<$100k) Small Business Lending (<$1M) Small Business Lending (<$100k- $1M)
Citigroup, Inc. NY 28,520 5,337 >$50B 28,822 5,339 302 2MBNA Corporation DE 25,201 5,132 >$50B 26,084 5,136 883 4Great Western Bancorporation NE 24,883 691 $1B-$10B 139,505 1,043 114,622 352Tierone Bank NE 24,318 816 $1B-$10B 92,375 1,031 68,057 215Hometown Banc Corp. NE 23,284 773 <$1B 72,518 929 49,234 156Farmers & Merchants Investment NE 23,236 489 $1B-$10B 82,286 665 59,050 176JPMorgan Chase & Co. NY 19,809 2,132 >$50B 19,809 2,132 0 0American National Corporation NE 17,238 509 $1B-$10B 77,811 694 60,573 185Advanta Bank Corporation UT 16,860 1,853 $1B-$10B 16,860 1,853 0 0Security National Corporation NE 12,676 300 <$1B 73,253 475 60,577 175Stockmens Financial Corp. SD 12,554 531 <$1B 35,246 614 22,692 83First York Bank Corp. NE 11,547 497 <$1B 49,198 603 37,651 106GE Capital Financial, Inc. UT 11,440 2,918 $1B-$10B 11,440 2,918 0 0Adbanc, Inc. NE 11,173 419 <$1B 38,741 515 27,568 96
Wells Fargo & Company CA 253,799 13,291 >$50B 380,726 13,669 126,927 378Bank of America Corporation NC 60,345 4,281 >$50B 138,962 4,475 78,617 194Citigroup, Inc. NY 48,375 9,345 >$50B 51,112 9,358 2,737 13Capital One FSB VA 39,656 14,479 $10B-$50B 40,231 14,483 575 4Zions Bancorporation UT 35,709 954 $10B-$50B 280,323 1,566 244,614 612JPMorgan Chase & Co. NY 34,421 2,532 >$50B 37,309 2,547 2,888 15Western Alliance Bancorp. NV 27,103 494 $1B-$10B 178,458 898 151,355 404MBNA Corporation DE 23,720 4,274 >$50B 28,204 4,290 4,484 16U.S. Bancorp MN 19,095 1,616 >$50B 115,759 1,835 96,664 219Advanta Bank Corporation UT 16,540 2,169 $1B-$10B 16,540 2,169 0 0American Express Centurion Bank UT 15,032 2,194 $10B-$50B 15,281 2,196 249 2The Pitney Bowes Bank UT 11,767 2,426 <$1B 11,767 2,426 0 0Capitol Bancorp Ltd. MI 11,103 198 $1B-$10B 93,265 429 82,162 231GE Capital Financial Inc. UT 10,142 2,735 $1B-$10B 10,142 2,735 0 0
Citizens Bank of Massachusetts MA 83,764 2,879 >$50B 200,033 3,254 116,269 375TD Banknorth Inc. ME 81,469 2,338 . 379,351 3,288 297,882 950Wells Fargo & Company CA 42,993 1,467 >$50B 44,596 1,480 1,603 13Bank of America Corporation NC 41,717 2,347 >$50B 89,992 2,469 48,275 122Citigroup, Inc. NY 41,362 7,822 >$50B 41,468 7,823 106 1Capital One FSB VA 35,853 10,734 $10B-$50B 35,978 10,735 125 1MBNA Corporation DE 33,429 6,638 >$50B 35,034 6,644 1,605 6JPMorgan Chase & Co. NY 28,930 2,509 >$50B 30,207 2,515 1,277 6Sovereign Bank PA 17,745 376 >$50B 126,329 683 108,584 307Chittenden Corporation VT 17,737 429 $1B-$10B 120,584 735 102,847 306Advanta Bank Corporation UT 16,309 2,002 $1B-$10B 16,309 2,002 0 0American Express Centurion Bank UT 10,929 1,187 $10B-$50B 11,166 1,188 237 1U.S. Bancorp MN 10,492 691 >$50B 12,741 707 2,249 16
PNC Financial Services Group PA 418,720 11,461 >$50B 918,717 12,822 499,997 1,361JPMorgan Chase & Co. NY 413,100 21,449 >$50B 494,264 21,831 81,164 382Wachovia Corporation NC 343,919 7,734 >$50B 1,382,166 10,490 1,038,247 2,756
New Jersey
New Hampshire
Nevada
Page 99

4B. Top Micro Business Lenders by State and Territory Using CRA Data, 2004
State or Territory Lending Institution
HQ Location SSBL $(1,000) SSBL#
Institution Asset Size LSBL$ (1,000) LSBL# LSBL(2) $(1,000) LSBL(2)#
(1) (2) (3) (4) (5) (6) (7)
Mirco Business Lending (<$100k) Small Business Lending (<$1M) Small Business Lending (<$100k- $1M)
Bank of America Corporation NC 324,669 17,673 >$50B 595,372 18,422 270,703 749Citigroup, Inc. NY 188,718 36,990 >$50B 202,709 37,031 13,991 41MBNA Corporation DE 186,396 31,109 >$50B 218,404 31,211 32,008 102Wells Fargo & Company CA 185,323 5,927 >$50B 192,863 5,987 7,540 60Capital One FSB VA 176,638 52,521 $10B-$50B 177,488 52,527 850 6American Express Centurion Bank UT 94,535 10,907 $10B-$50B 95,039 10,910 504 3Advanta Bank Corporation UT 86,342 10,203 $1B-$10B 86,342 10,203 0 0Commerce Bancorp, Inc. NJ 78,303 2,156 $10B-$50B 426,062 3,125 347,759 969Atlantic Bank of New York NY 62,233 7,111 $1B-$10B 94,865 7,240 32,632 129Valley National Bancorp NJ 56,505 1,414 $10B-$50B 417,017 2,280 360,512 866The Pitney Bowes Bank UT 51,039 9,157 <$1B 51,242 9,158 203 1Sovereign Bank PA 39,499 833 >$50B 164,339 1,173 124,840 340Sun Bancorp, Inc. NJ 35,150 695 $1B-$10B 201,771 1,129 166,621 434HSBC Bank USA NY 34,063 559 >$50B 68,231 632 34,168 73GE Capital Financial Inc. UT 33,173 8,101 $1B-$10B 33,173 8,101 0 0North Fork Bancorporation, Inc. NY 30,565 680 >$50B 152,929 1,029 122,364 349Fulton Financial Corporation PA 30,110 655 $10B-$50B 186,984 1,122 156,874 467U.S. Bancorp MN 30,098 2,954 >$50B 40,855 2,988 10,757 34Bank of New York Company, Inc. NY 24,912 1,156 >$50B 36,513 1,194 11,601 38Lakeland Bancorp, Inc. NJ 20,029 378 $1B-$10B 150,511 743 130,482 365Minotola National Bank NJ 17,943 413 <$1B 86,895 609 68,952 196Yardville National Bancorp NJ 17,734 352 $1B-$10B 146,569 715 128,835 363Hudson United Bancorp NJ 15,677 325 $1B-$10B 110,615 596 94,938 271Citizens Bank of Massachusetts MA 12,260 301 >$50B 32,635 356 20,375 55Provident Financial Services NJ 12,057 319 $1B-$10B 41,005 414 28,948 95Interchange Financial Services NJ 11,544 154 $1B-$10B 65,821 300 54,277 146
Wells Fargo & Company CA 184,821 7,184 >$50B 346,962 7,650 162,141 466Citigroup, Inc. NY 35,103 6,195 >$50B 35,103 6,195 0 0Bank of America Corporation NC 34,797 2,168 >$50B 84,896 2,320 50,099 152First State Bancorporation NM 31,367 999 $1B-$10B 177,813 1,458 146,446 459Capital One FSB VA 29,222 10,065 $10B-$50B 29,672 10,068 450 3MBNA Corporation DE 24,826 4,737 >$50B 26,947 4,745 2,121 8First Artesia Bancshares, Inc. NM 20,846 553 <$1B 86,094 817 65,248 264JPMorgan Chase & Co. NY 19,724 1,995 >$50B 22,334 2,001 2,610 6Heartland Financial USA, Inc. IA 16,851 387 $1B-$10B 82,027 605 65,176 218Bank of The West CA 16,566 467 >$50B 78,108 661 61,542 194Compass Bancshares, Inc. AL 16,117 432 $10B-$50B 47,577 531 31,460 99Advanta Bank Corporation UT 15,110 1,829 $1B-$10B 15,110 1,829 0 0Trinity Capital Corporation NM 12,541 329 $1B-$10B 123,827 651 111,286 322Employee Stock Bonus Trust for the Employees NM 12,520 344 <$1B 41,407 454 28,887 110GE Capital Financial Inc. UT 12,197 2,959 $1B-$10B 12,197 2,959 0 0BOK Financial Corporation OK 10,324 184 $10B-$50B 78,976 347 68,652 163
JPMorgan Chase & Co. NY 2,083,697 76,140 >$50B 3,040,063 80,017 956,366 3,877Citigroup, Inc. NY 663,113 81,531 >$50B 1,383,673 83,558 720,560 2,027
New Mexico
New York
Page 100

4B. Top Micro Business Lenders by State and Territory Using CRA Data, 2004
State or Territory Lending Institution
HQ Location SSBL $(1,000) SSBL#
Institution Asset Size LSBL$ (1,000) LSBL# LSBL(2) $(1,000) LSBL(2)#
(1) (2) (3) (4) (5) (6) (7)
Mirco Business Lending (<$100k) Small Business Lending (<$1M) Small Business Lending (<$100k- $1M)
HSBC Bank USA NY 662,984 14,458 >$50B 1,600,183 17,035 937,199 2,577Bank of America Corporation NC 433,141 23,530 >$50B 749,814 24,353 316,673 823Wells Fargo & Company CA 386,207 12,374 >$50B 405,479 12,518 19,272 144North Fork Bancorporation, Inc. NY 383,203 9,043 >$50B 1,168,638 11,151 785,435 2,108Capital One FSB VA 305,847 99,323 $10B-$50B 307,822 99,337 1,975 14Mbna Corporation DE 275,152 44,698 >$50B 345,401 44,925 70,249 227Allfirst Bank MD 229,909 5,208 >$50B 1,282,353 7,957 1,052,444 2,749American Express Centurion Bank UT 187,948 20,859 $10B-$50B 188,877 20,866 929 7Advanta Bank Corporation UT 157,488 19,119 $1B-$10B 157,488 19,119 0 0The Pitney Bowes Bank UT 93,471 16,997 <$1B 93,884 16,999 413 2Bank of New York Company, Inc. NY 80,975 3,979 >$50B 184,081 4,254 103,106 275GE Capital Financial Inc. UT 67,324 14,937 $1B-$10B 67,794 14,939 470 2NBT Bancorp Inc. NY 61,094 1,690 $1B-$10B 218,348 2,221 157,254 531Financial Institutions, Inc. NY 58,020 1,481 $1B-$10B 191,132 1,933 133,112 452Atlantic Bank of New York NY 56,330 5,427 $1B-$10B 125,550 5,665 69,220 238Wachovia Corporation NC 50,150 1,181 >$50B 249,843 1,649 199,693 468Keycorp OH 45,689 1,283 >$50B 306,581 1,987 260,892 704Community Bank System, Inc. NY 36,679 1,151 $1B-$10B 87,846 1,347 51,167 196Tompkins Trustco, Inc. NY 30,804 781 $1B-$10B 128,624 1,099 97,820 318U.S. Bancorp MN 29,977 2,244 >$50B 41,143 2,286 11,166 42First Niagara Bank NY 28,360 644 $1B-$10B 187,935 1,108 159,575 464Citizens Bank of Massachusetts MA 26,917 788 >$50B 122,191 1,078 95,274 290Canandaigua National Corp. NY 26,458 734 $1B-$10B 93,625 944 67,167 210Commerce Bancorp, Inc. NJ 24,823 752 $10B-$50B 170,776 1,096 145,953 344TD Banknorth Inc. ME 23,090 708 . 102,218 941 79,128 233Solvay Bank Corp. NY 20,909 514 <$1B 68,220 668 47,311 154Arrow Financial Corporation NY 20,754 658 $1B-$10B 69,042 805 48,288 147State Bancorp, Inc. NY 19,857 357 $1B-$10B 269,336 951 249,479 594Provident Bank NY 17,448 442 $1B-$10B 74,922 626 57,474 184Astoria Federal Savings NY 14,947 568 $10B-$50B 27,953 620 13,006 52The Adirondack Trust Company NY 14,863 460 <$1B 63,665 629 48,802 169Washington Mutual Bank FA WA 14,162 402 >$50B 116,728 650 102,566 248Suffolk Bancorp NY 13,059 284 $1B-$10B 61,171 427 48,112 143SBU Bank NY 12,983 343 $1B-$10B 55,734 466 42,751 123Popular, Inc. PR 12,972 458 $10B-$50B 179,693 877 166,721 419Alliance Financial Corporation NY 12,359 359 <$1B 57,685 520 45,326 161Signature Bank NY 11,597 238 $1B-$10B 93,567 439 81,970 201Valley National Bancorp NJ 11,436 192 $10B-$50B 161,525 510 150,089 318Hudson River Bank & Trust Co NY 11,335 242 . 86,339 494 75,004 252Wright Express FSC UT 10,708 1,505 <$1B 11,553 1,509 845 4
BB&T Corporation NC 586,400 17,828 >$50B 2,524,362 23,713 1,937,962 5,885First Citizens Bancshares, Inc. NC 318,753 11,165 $10B-$50B 1,326,656 14,322 1,007,903 3,157Wachovia Corporation NC 255,644 5,879 >$50B 1,572,553 9,176 1,316,909 3,297MBNA Corporation DE 164,909 29,456 >$50B 238,464 29,806 73,555 350Bank of America Corporation NC 142,260 9,267 >$50B 414,295 10,041 272,035 774Citigroup, Inc. NY 141,150 27,212 >$50B 144,697 27,223 3,547 11
North Carolina
Page 101

4B. Top Micro Business Lenders by State and Territory Using CRA Data, 2004
State or Territory Lending Institution
HQ Location SSBL $(1,000) SSBL#
Institution Asset Size LSBL$ (1,000) LSBL# LSBL(2) $(1,000) LSBL(2)#
(1) (2) (3) (4) (5) (6) (7)
Mirco Business Lending (<$100k) Small Business Lending (<$1M) Small Business Lending (<$100k- $1M)
Wells Fargo & Company CA 116,517 4,046 >$50B 120,130 4,078 3,613 32Capital One FSB VA 112,754 35,171 $10B-$50B 112,904 35,172 150 1JPMorgan Chase & Co. NY 92,165 7,480 >$50B 97,464 7,492 5,299 12Suntrust Banks, Inc. GA 87,950 3,140 >$50B 330,564 3,901 242,614 761GE Capital Financial Inc. UT 73,374 20,109 $1B-$10B 74,319 20,112 945 3RBC Centura Bank NC 64,005 1,671 $10B-$50B 382,177 2,595 318,172 924Advanta Bank Corporation UT 54,157 6,434 $1B-$10B 54,157 6,434 0 0South Financial Group SC 46,429 1,113 $10B-$50B 301,654 1,929 255,225 816Fidelity Bancshares (N.C.) NC 40,813 1,084 $1B-$10B 213,087 1,676 172,274 592The Pitney Bowes Bank UT 37,153 7,701 <$1B 37,756 7,703 603 2Southern Bancshares (N.C.) NC 35,875 1,156 $1B-$10B 133,089 1,491 97,214 335Bank of Granite Corporation NC 35,063 1,175 $1B-$10B 133,796 1,520 98,733 345First Bancorp NC 34,676 1,315 $1B-$10B 103,506 1,572 68,830 257American Express Centurion Bank UT 33,234 3,724 $10B-$50B 33,234 3,724 0 0LSB Bancshares, Inc. NC 32,602 741 <$1B 149,582 1,119 116,980 378U.S. Bancorp MN 28,634 1,983 >$50B 53,334 2,065 24,700 82First Charter Corporation NC 28,296 632 $1B-$10B 152,074 1,024 123,778 392Peoples Bancorp of North Carolina NC 23,452 665 <$1B 83,426 877 59,974 212ECB Bancorp, Inc. NC 22,564 610 <$1B 108,205 914 85,641 304Yadkin Valley Bank & Trust Co. NC 22,112 638 <$1B 112,391 946 90,279 308FNB Corp. NC 22,036 488 <$1B 107,072 728 85,036 240United Community Banks, Inc. GA 21,318 698 $1B-$10B 62,710 863 41,392 165Four Oaks Fincorp, Inc. NC 20,538 668 <$1B 55,069 786 34,531 118Southern Community Financial NC 17,339 410 $1B-$10B 83,167 623 65,828 213First South Bancorp, Inc. NC 16,536 443 <$1B 77,058 639 60,522 196First National Bank NC 15,905 508 <$1B 53,113 643 37,208 135Regions Financial Corporation AL 14,635 364 >$50B 108,765 613 94,130 249High Point Bank Corporation NC 12,195 344 <$1B 54,782 493 42,587 149BNC Bancorp NC 11,042 282 <$1B 61,314 432 50,272 150FNB Financial Services Corp. NC 10,959 253 <$1B 97,200 611 86,241 358Capital Bank Corporation NC 10,603 310 <$1B 45,348 419 34,745 109
Wells Fargo & Company CA 59,221 2,183 >$50B 210,565 2,597 151,344 414Otto Bremer Foundation MN 25,858 739 $1B-$10B 129,858 1,061 104,000 322State Bankshares, Inc. ND 23,871 651 $1B-$10B 145,208 980 121,337 329Watford City Bancshares, Inc. ND 21,826 703 <$1B 87,011 940 65,185 237U.S. Bancorp MN 14,828 1,272 >$50B 52,376 1,360 37,548 88Capital One FSB VA 14,798 4,576 $10B-$50B 14,798 4,576 0 0Starion Bancorporation ND 13,938 486 <$1B 44,726 595 30,788 109Alerus Financial Corporation ND 11,659 263 <$1B 70,321 429 58,662 166
JPMorgan Chase & Co. NY 255,962 18,691 >$50B 643,605 19,745 387,643 1,054Huntington Bancshares, Inc. OH 254,058 6,738 $10B-$50B 759,379 8,148 505,321 1,410Fifth Third Bancorp OH 216,826 4,049 >$50B 1,919,121 8,686 1,702,295 4,637National City Corporation OH 185,217 8,223 >$50B 988,949 10,536 803,732 2,313Wells Fargo & Company CA 182,733 6,569 >$50B 195,426 6,633 12,693 64Citigroup, Inc. NY 166,644 33,751 >$50B 168,161 33,762 1,517 11
Ohio
North Dakota
Page 102

4B. Top Micro Business Lenders by State and Territory Using CRA Data, 2004
State or Territory Lending Institution
HQ Location SSBL $(1,000) SSBL#
Institution Asset Size LSBL$ (1,000) LSBL# LSBL(2) $(1,000) LSBL(2)#
(1) (2) (3) (4) (5) (6) (7)
Mirco Business Lending (<$100k) Small Business Lending (<$1M) Small Business Lending (<$100k- $1M)
U.S. Bancorp MN 152,655 9,314 >$50B 610,680 10,633 458,025 1,319Capital One FSB VA 144,251 46,477 $10B-$50B 144,851 46,481 600 4MBNA Corporation DE 137,341 25,154 >$50B 159,675 25,243 22,334 89Park National Corporation OH 109,629 2,978 $1B-$10B 467,395 4,139 357,766 1,161GE Capital Financial Inc. UT 83,317 21,842 $1B-$10B 84,377 21,845 1,060 3Advanta Bank Corporation UT 77,955 9,337 $1B-$10B 77,955 9,337 0 0Sky Financial Group, Inc. OH 71,338 1,708 $10B-$50B 398,802 2,699 327,464 991Firstmerit Corporation OH 69,721 1,229 $10B-$50B 577,063 2,596 507,342 1,367Keycorp OH 68,700 1,759 >$50B 542,754 3,009 474,054 1,250The Pitney Bowes Bank UT 50,817 9,921 <$1B 51,320 9,924 503 3Pnc Financial Services Group PA 47,961 1,368 >$50B 148,088 1,644 100,127 276American Express Centurion Bank UT 47,502 5,024 $10B-$50B 47,502 5,024 0 0First Federal Bank of The Midwest OH 39,850 987 $1B-$10B 204,544 1,575 164,694 588First Financial Bancorp OH 35,903 1,074 $1B-$10B 148,267 1,428 112,364 354Bank of America Corporation NC 33,080 3,107 >$50B 38,064 3,116 4,984 9Citizens Bank of Massachusetts MA 21,761 649 >$50B 113,515 905 91,754 256Killbuck Bancshares, Inc. OH 19,242 667 <$1B 57,125 790 37,883 123DCB Financial Corp. OH 18,585 397 <$1B 82,359 639 63,774 242First Merchants Corporation IN 17,480 435 $1B-$10B 110,687 703 93,207 268Farmers & Merchants Bancorp OH 15,504 552 <$1B 36,602 629 21,098 77Wesbanco, Inc. WV 14,142 467 $1B-$10B 73,930 627 59,788 160Oak Hill Financial, Inc. OH 14,020 338 $1B-$10B 93,324 589 79,304 251Unizan Financial Corp. OH 12,261 296 $1B-$10B 83,901 510 71,640 214Citizens Bancshares, Inc. OH 12,123 301 <$1B 53,986 446 41,863 145Peoples Bancorp Inc. OH 12,070 305 $1B-$10B 67,125 490 55,055 185Merchants Bancorp, Inc. OH 11,591 408 <$1B 29,750 471 18,159 63Community Bancshares, Inc. OH 10,632 354 <$1B 35,674 458 25,042 104NB&T Financial Group, Inc. OH 10,175 293 <$1B 31,331 367 21,156 74
Bancfirst Corporation OK 108,867 4,151 $1B-$10B 361,487 4,934 252,620 783Arvest Bank Group, Inc. AR 92,763 3,245 $1B-$10B 349,000 4,053 256,237 808Citigroup, Inc. NY 66,776 12,504 >$50B 66,776 12,504 0 0Wells Fargo & Company CA 54,232 1,941 >$50B 58,157 1,962 3,925 21Capital One FSB VA 51,538 17,728 $10B-$50B 51,688 17,729 150 1JPMorgan Chase & Co. NY 51,067 4,349 >$50B 74,361 4,425 23,294 76BOK Financial Corporation OK 43,912 877 $10B-$50B 378,881 1,790 334,969 913MBNA Corporation DE 41,269 8,008 >$50B 43,142 8,014 1,873 6Durant Bancorp, Inc. OK 33,607 1,331 $1B-$10B 95,815 1,543 62,208 212Bank of America Corporation NC 32,675 2,504 >$50B 70,327 2,610 37,652 106One Rich Hill Mining L.L.C. TX 30,547 717 $1B-$10B 193,050 1,180 162,503 463Spirit Bankcorp, Inc. OK 27,406 952 <$1B 109,070 1,222 81,664 270Advanta Bank Corporation UT 26,564 3,186 $1B-$10B 26,564 3,186 0 0GE Capital Financial Inc. UT 25,849 6,842 $1B-$10B 26,419 6,843 570 1Southwest Bancorp, Inc. OK 25,329 524 $1B-$10B 159,622 945 134,293 421First Fidelity Bancorp, Inc. OK 16,665 490 <$1B 63,122 644 46,457 154Coppermark Bancshares, Inc. OK 15,552 475 <$1B 80,904 666 65,352 191The Pitney Bowes Bank UT 14,663 2,911 <$1B 14,663 2,911 0 0
Oklahoma
Page 103
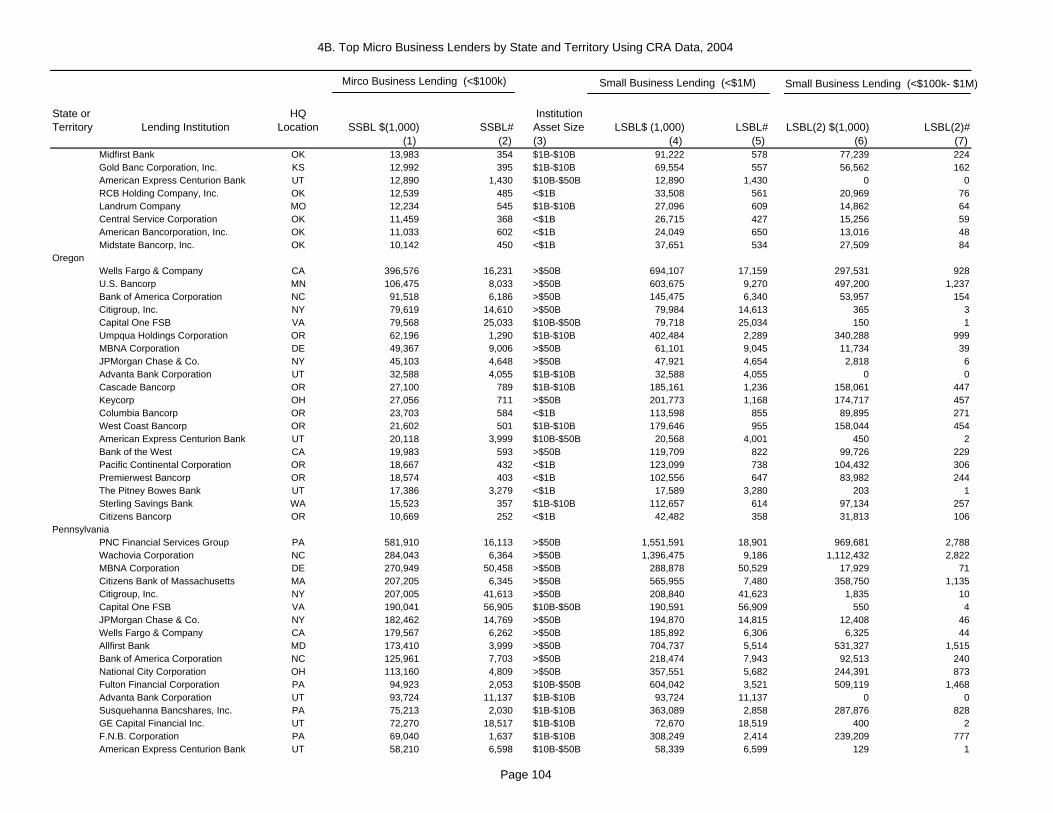
4B. Top Micro Business Lenders by State and Territory Using CRA Data, 2004
State or Territory Lending Institution
HQ Location SSBL $(1,000) SSBL#
Institution Asset Size LSBL$ (1,000) LSBL# LSBL(2) $(1,000) LSBL(2)#
(1) (2) (3) (4) (5) (6) (7)
Mirco Business Lending (<$100k) Small Business Lending (<$1M) Small Business Lending (<$100k- $1M)
Midfirst Bank OK 13,983 354 $1B-$10B 91,222 578 77,239 224Gold Banc Corporation, Inc. KS 12,992 395 $1B-$10B 69,554 557 56,562 162American Express Centurion Bank UT 12,890 1,430 $10B-$50B 12,890 1,430 0 0RCB Holding Company, Inc. OK 12,539 485 <$1B 33,508 561 20,969 76Landrum Company MO 12,234 545 $1B-$10B 27,096 609 14,862 64Central Service Corporation OK 11,459 368 <$1B 26,715 427 15,256 59American Bancorporation, Inc. OK 11,033 602 <$1B 24,049 650 13,016 48Midstate Bancorp, Inc. OK 10,142 450 <$1B 37,651 534 27,509 84
Wells Fargo & Company CA 396,576 16,231 >$50B 694,107 17,159 297,531 928U.S. Bancorp MN 106,475 8,033 >$50B 603,675 9,270 497,200 1,237Bank of America Corporation NC 91,518 6,186 >$50B 145,475 6,340 53,957 154Citigroup, Inc. NY 79,619 14,610 >$50B 79,984 14,613 365 3Capital One FSB VA 79,568 25,033 $10B-$50B 79,718 25,034 150 1Umpqua Holdings Corporation OR 62,196 1,290 $1B-$10B 402,484 2,289 340,288 999MBNA Corporation DE 49,367 9,006 >$50B 61,101 9,045 11,734 39JPMorgan Chase & Co. NY 45,103 4,648 >$50B 47,921 4,654 2,818 6Advanta Bank Corporation UT 32,588 4,055 $1B-$10B 32,588 4,055 0 0Cascade Bancorp OR 27,100 789 $1B-$10B 185,161 1,236 158,061 447Keycorp OH 27,056 711 >$50B 201,773 1,168 174,717 457Columbia Bancorp OR 23,703 584 <$1B 113,598 855 89,895 271West Coast Bancorp OR 21,602 501 $1B-$10B 179,646 955 158,044 454American Express Centurion Bank UT 20,118 3,999 $10B-$50B 20,568 4,001 450 2Bank of the West CA 19,983 593 >$50B 119,709 822 99,726 229Pacific Continental Corporation OR 18,667 432 <$1B 123,099 738 104,432 306Premierwest Bancorp OR 18,574 403 <$1B 102,556 647 83,982 244The Pitney Bowes Bank UT 17,386 3,279 <$1B 17,589 3,280 203 1Sterling Savings Bank WA 15,523 357 $1B-$10B 112,657 614 97,134 257Citizens Bancorp OR 10,669 252 <$1B 42,482 358 31,813 106
PNC Financial Services Group PA 581,910 16,113 >$50B 1,551,591 18,901 969,681 2,788Wachovia Corporation NC 284,043 6,364 >$50B 1,396,475 9,186 1,112,432 2,822MBNA Corporation DE 270,949 50,458 >$50B 288,878 50,529 17,929 71Citizens Bank of Massachusetts MA 207,205 6,345 >$50B 565,955 7,480 358,750 1,135Citigroup, Inc. NY 207,005 41,613 >$50B 208,840 41,623 1,835 10Capital One FSB VA 190,041 56,905 $10B-$50B 190,591 56,909 550 4JPMorgan Chase & Co. NY 182,462 14,769 >$50B 194,870 14,815 12,408 46Wells Fargo & Company CA 179,567 6,262 >$50B 185,892 6,306 6,325 44Allfirst Bank MD 173,410 3,999 >$50B 704,737 5,514 531,327 1,515Bank of America Corporation NC 125,961 7,703 >$50B 218,474 7,943 92,513 240National City Corporation OH 113,160 4,809 >$50B 357,551 5,682 244,391 873Fulton Financial Corporation PA 94,923 2,053 $10B-$50B 604,042 3,521 509,119 1,468Advanta Bank Corporation UT 93,724 11,137 $1B-$10B 93,724 11,137 0 0Susquehanna Bancshares, Inc. PA 75,213 2,030 $1B-$10B 363,089 2,858 287,876 828GE Capital Financial Inc. UT 72,270 18,517 $1B-$10B 72,670 18,519 400 2F.N.B. Corporation PA 69,040 1,637 $1B-$10B 308,249 2,414 239,209 777American Express Centurion Bank UT 58,210 6,598 $10B-$50B 58,339 6,599 129 1
Oregon
Pennsylvania
Page 104

4B. Top Micro Business Lenders by State and Territory Using CRA Data, 2004
State or Territory Lending Institution
HQ Location SSBL $(1,000) SSBL#
Institution Asset Size LSBL$ (1,000) LSBL# LSBL(2) $(1,000) LSBL(2)#
(1) (2) (3) (4) (5) (6) (7)
Mirco Business Lending (<$100k) Small Business Lending (<$1M) Small Business Lending (<$100k- $1M)
The Pitney Bowes Bank UT 56,848 10,297 <$1B 57,051 10,298 203 1S & T Bancorp, Inc. PA 54,590 1,790 $1B-$10B 242,846 2,366 188,256 576Sovereign Bank PA 49,159 1,164 >$50B 273,116 1,736 223,957 572First Commonwealth Financial PA 46,424 1,359 $1B-$10B 193,398 1,841 146,974 482U.S. Bancorp MN 41,166 2,806 >$50B 54,180 2,863 13,014 57National Penn Bancshares, Inc. PA 29,923 674 $1B-$10B 240,074 1,263 210,151 589Harleysville National Corp. PA 25,971 627 $1B-$10B 163,698 1,044 137,727 417First National Community Bank PA 24,243 617 <$1B 89,151 780 64,908 163Commerce Bancorp, Inc. NJ 23,526 600 $10B-$50B 157,743 986 134,217 386CNB Financial Corporation PA 23,164 558 <$1B 87,713 800 64,549 242Pennrock Financial Services PA 21,699 551 $1B-$10B 97,444 795 75,745 244Waypoint Bank PA 20,692 444 . 159,787 842 139,095 398Northwest Savings Bank PA 20,362 507 $1B-$10B 73,641 733 53,279 226Univest Corporation of PA PA 20,319 498 $1B-$10B 107,634 762 87,315 264Community Banks, Inc. PA 18,195 428 $1B-$10B 102,333 678 84,138 250Sky Financial Group, Inc. OH 17,688 444 $10B-$50B 81,402 650 63,714 206Sterling Financial Corporation PA 16,950 388 $1B-$10B 116,272 677 99,322 289QNBCorp. PA 16,129 351 <$1B 83,279 548 67,150 197Penns Woods Bancorp, Inc. PA 15,787 555 <$1B 40,838 646 25,051 91Omega Financial Corporation PA 14,533 398 $1B-$10B 54,209 540 39,676 142Mellon Financial Corporation PA 14,324 490 $10B-$50B 95,028 718 80,704 228Citizens Financial Services PA 13,452 346 <$1B 31,230 426 17,778 80NBT Bancorp Inc. NY 13,067 356 $1B-$10B 50,764 487 37,697 131Hibshman Trust For Ephrata PA 12,852 459 <$1B 43,632 573 30,780 114Citizens And Northern Corp. PA 12,029 359 $1B-$10B 29,113 430 17,084 71Dimeco, Inc. PA 11,073 351 <$1B 45,984 458 34,911 107Community Bank System, Inc. NY 10,983 259 $1B-$10B 61,879 418 50,896 1591st Summit Bancorp of Johnstown PA 10,848 326 <$1B 35,707 410 24,859 84Dollar Bank FSB PA 10,627 213 $1B-$10B 94,056 427 83,429 214Atlantic Bank of New York NY 10,558 1,103 $1B-$10B 15,971 1,124 5,413 21
Popular, Inc. PR 590,813 18,000 $10B-$50B 1,838,739 22,056 1,247,926 4,056Eurobancshares, Inc. PR 58,936 1,396 $1B-$10B 269,054 2,013 210,118 617Banco Santander PR 56,596 1,877 $1B-$10B 223,847 2,347 167,251 470Bbva Puerto Rico PR 44,835 1,349 $1B-$10B 151,422 1,689 106,587 340Wells Fargo & Company CA 22,324 752 >$50B 22,740 756 416 4First Bancorp PR 20,586 363 $10B-$50B 188,962 1,017 168,376 654W Holding Company, Inc. PR 20,457 439 $10B-$50B 221,284 969 200,827 530R&G Financial Corporation PR 14,944 340 $1B-$10B 108,602 600 93,658 260
Citizens Bank of Massachusetts MA 78,014 2,592 >$50B 215,438 2,973 137,424 381Bank of America Corporation NC 38,808 2,041 >$50B 116,903 2,254 78,095 213Citigroup, Inc. NY 25,023 4,801 >$50B 25,023 4,801 0 0Wells Fargo & Company CA 24,627 827 >$50B 25,481 835 854 8MBNA Corporation DE 22,515 3,790 >$50B 23,185 3,793 670 3Capital One FSB VA 21,633 6,441 $10B-$50B 21,633 6,441 0 0Bancorp Rhode Island, Inc. RI 20,883 391 $1B-$10B 116,872 677 95,989 286
Rhode Island
Puerto Rico
Page 105
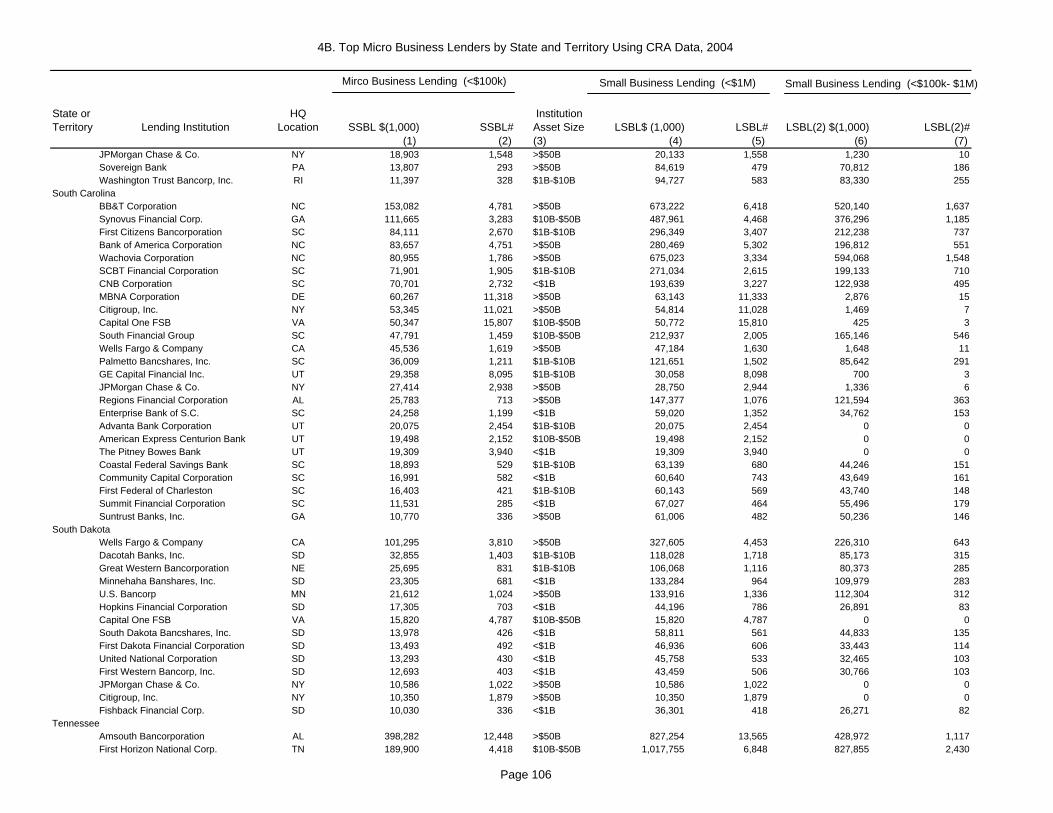
4B. Top Micro Business Lenders by State and Territory Using CRA Data, 2004
State or Territory Lending Institution
HQ Location SSBL $(1,000) SSBL#
Institution Asset Size LSBL$ (1,000) LSBL# LSBL(2) $(1,000) LSBL(2)#
(1) (2) (3) (4) (5) (6) (7)
Mirco Business Lending (<$100k) Small Business Lending (<$1M) Small Business Lending (<$100k- $1M)
JPMorgan Chase & Co. NY 18,903 1,548 >$50B 20,133 1,558 1,230 10Sovereign Bank PA 13,807 293 >$50B 84,619 479 70,812 186Washington Trust Bancorp, Inc. RI 11,397 328 $1B-$10B 94,727 583 83,330 255
BB&T Corporation NC 153,082 4,781 >$50B 673,222 6,418 520,140 1,637Synovus Financial Corp. GA 111,665 3,283 $10B-$50B 487,961 4,468 376,296 1,185First Citizens Bancorporation SC 84,111 2,670 $1B-$10B 296,349 3,407 212,238 737Bank of America Corporation NC 83,657 4,751 >$50B 280,469 5,302 196,812 551Wachovia Corporation NC 80,955 1,786 >$50B 675,023 3,334 594,068 1,548SCBT Financial Corporation SC 71,901 1,905 $1B-$10B 271,034 2,615 199,133 710CNB Corporation SC 70,701 2,732 <$1B 193,639 3,227 122,938 495MBNA Corporation DE 60,267 11,318 >$50B 63,143 11,333 2,876 15Citigroup, Inc. NY 53,345 11,021 >$50B 54,814 11,028 1,469 7Capital One FSB VA 50,347 15,807 $10B-$50B 50,772 15,810 425 3South Financial Group SC 47,791 1,459 $10B-$50B 212,937 2,005 165,146 546Wells Fargo & Company CA 45,536 1,619 >$50B 47,184 1,630 1,648 11Palmetto Bancshares, Inc. SC 36,009 1,211 $1B-$10B 121,651 1,502 85,642 291GE Capital Financial Inc. UT 29,358 8,095 $1B-$10B 30,058 8,098 700 3JPMorgan Chase & Co. NY 27,414 2,938 >$50B 28,750 2,944 1,336 6Regions Financial Corporation AL 25,783 713 >$50B 147,377 1,076 121,594 363Enterprise Bank of S.C. SC 24,258 1,199 <$1B 59,020 1,352 34,762 153Advanta Bank Corporation UT 20,075 2,454 $1B-$10B 20,075 2,454 0 0American Express Centurion Bank UT 19,498 2,152 $10B-$50B 19,498 2,152 0 0The Pitney Bowes Bank UT 19,309 3,940 <$1B 19,309 3,940 0 0Coastal Federal Savings Bank SC 18,893 529 $1B-$10B 63,139 680 44,246 151Community Capital Corporation SC 16,991 582 <$1B 60,640 743 43,649 161First Federal of Charleston SC 16,403 421 $1B-$10B 60,143 569 43,740 148Summit Financial Corporation SC 11,531 285 <$1B 67,027 464 55,496 179Suntrust Banks, Inc. GA 10,770 336 >$50B 61,006 482 50,236 146
Wells Fargo & Company CA 101,295 3,810 >$50B 327,605 4,453 226,310 643Dacotah Banks, Inc. SD 32,855 1,403 $1B-$10B 118,028 1,718 85,173 315Great Western Bancorporation NE 25,695 831 $1B-$10B 106,068 1,116 80,373 285Minnehaha Banshares, Inc. SD 23,305 681 <$1B 133,284 964 109,979 283U.S. Bancorp MN 21,612 1,024 >$50B 133,916 1,336 112,304 312Hopkins Financial Corporation SD 17,305 703 <$1B 44,196 786 26,891 83Capital One FSB VA 15,820 4,787 $10B-$50B 15,820 4,787 0 0South Dakota Bancshares, Inc. SD 13,978 426 <$1B 58,811 561 44,833 135First Dakota Financial Corporation SD 13,493 492 <$1B 46,936 606 33,443 114United National Corporation SD 13,293 430 <$1B 45,758 533 32,465 103First Western Bancorp, Inc. SD 12,693 403 <$1B 43,459 506 30,766 103JPMorgan Chase & Co. NY 10,586 1,022 >$50B 10,586 1,022 0 0Citigroup, Inc. NY 10,350 1,879 >$50B 10,350 1,879 0 0Fishback Financial Corp. SD 10,030 336 <$1B 36,301 418 26,271 82
Amsouth Bancorporation AL 398,282 12,448 >$50B 827,254 13,565 428,972 1,117First Horizon National Corp. TN 189,900 4,418 $10B-$50B 1,017,755 6,848 827,855 2,430
South Dakota
Tennessee
South Carolina
Page 106

4B. Top Micro Business Lenders by State and Territory Using CRA Data, 2004
State or Territory Lending Institution
HQ Location SSBL $(1,000) SSBL#
Institution Asset Size LSBL$ (1,000) LSBL# LSBL(2) $(1,000) LSBL(2)#
(1) (2) (3) (4) (5) (6) (7)
Mirco Business Lending (<$100k) Small Business Lending (<$1M) Small Business Lending (<$100k- $1M)
Suntrust Banks, Inc. GA 109,763 4,797 >$50B 685,398 6,404 575,635 1,607Citigroup, Inc. NY 89,002 16,970 >$50B 90,319 16,975 1,317 5Regions Financial Corporation AL 84,869 2,413 >$50B 500,959 3,632 416,090 1,219Wells Fargo & Company CA 79,916 2,775 >$50B 83,717 2,798 3,801 23MBNA Corporation DE 77,302 14,708 >$50B 86,899 14,742 9,597 34Bank of America Corporation NC 63,903 3,942 >$50B 175,041 4,261 111,138 319Capital One FSB VA 62,953 21,822 $10B-$50B 63,528 21,826 575 4First South Bancorp, Inc. TN 49,912 2,882 $1B-$10B 168,244 3,270 118,332 388Greene County Bancshares, Inc. TN 45,504 1,679 $1B-$10B 196,777 2,144 151,273 465U.S. Bancorp MN 42,975 2,920 >$50B 117,739 3,169 74,764 249GE Capital Financial Inc. UT 41,277 11,066 $1B-$10B 43,122 11,069 1,845 3JPMorgan Chase & Co. NY 38,855 4,150 >$50B 47,240 4,168 8,385 18BB&T Corporation NC 37,547 1,127 >$50B 167,756 1,527 130,209 400Advanta Bank Corporation UT 30,717 3,656 $1B-$10B 30,717 3,656 0 0F&M Financial Corporation TN 28,426 854 <$1B 89,488 1,056 61,062 202The Pitney Bowes Bank UT 24,980 4,851 <$1B 25,583 4,853 603 2First Citizens Bancshares, Inc. TN 24,694 829 <$1B 68,740 989 44,046 160American Express Centurion Bank UT 23,714 2,831 $10B-$50B 23,714 2,831 0 0Synovus Financial Corp. GA 22,239 443 $10B-$50B 128,821 803 106,582 360Citizens National Bancorp, Inc. TN 21,117 590 <$1B 85,309 835 64,192 245Bancorpsouth, Inc. MS 19,042 676 $10B-$50B 80,140 880 61,098 204First Volunteer Corporation TN 17,442 478 <$1B 65,644 647 48,202 169Robertson Holding Company TN 15,661 1,583 <$1B 29,871 1,631 14,210 48Home Federal Bank of Tennessee TN 15,315 450 $1B-$10B 48,421 567 33,106 117Cavalry Bancorp, Inc. TN 12,897 399 <$1B 58,619 546 45,722 147Wachovia Corporation NC 12,856 307 >$50B 79,919 494 67,063 187First Pulaski National Corp. TN 12,782 521 <$1B 41,132 615 28,350 94Trustmark Corporation MS 12,241 372 $1B-$10B 51,889 503 39,648 131First Farmers Bancshares, Inc. TN 12,193 478 <$1B 30,051 540 17,858 62Fifth Third Bancorp OH 11,350 301 >$50B 93,225 492 81,875 191Citizens Bank TN 11,232 521 <$1B 17,169 553 5,937 32First Natl Bank of The Cumbe TN 10,979 402 <$1B 46,771 535 35,792 133First Citizens Bancorp TN 10,958 305 <$1B 65,824 498 54,866 193Banctenn Corporation TN 10,363 293 <$1B 47,713 414 37,350 121
Wells Fargo & Company CA 1,260,951 48,363 >$50B 2,152,201 51,052 891,250 2,689JPMorgan Chase & Co. NY 1,020,762 44,259 >$50B 1,724,301 46,483 703,539 2,224Citigroup, Inc. NY 506,441 88,960 >$50B 513,424 88,998 6,983 38Bank of America Corporation NC 340,876 23,518 >$50B 751,735 24,657 410,859 1,139Capital One FSB VA 314,522 114,016 $10B-$50B 317,722 114,038 3,200 22MBNA Corporation DE 269,265 45,662 >$50B 334,282 45,873 65,017 211Compass Bancshares, Inc. AL 216,483 5,921 $10B-$50B 737,171 7,306 520,688 1,385Advanta Bank Corporation UT 167,034 20,410 $1B-$10B 167,034 20,410 0 0GE Capital Financial Inc. UT 135,897 35,918 $1B-$10B 137,666 35,927 1,769 9American Express Centurion Bank UT 114,376 12,597 $10B-$50B 114,981 12,600 605 3Cullen/Frost Bankers, Inc. TX 114,095 2,339 $1B-$10B 937,893 4,628 823,798 2,289Texas Regional Bancshares, Inc. TX 110,053 3,614 $1B-$10B 397,037 4,535 286,984 921
Texas
Page 107

4B. Top Micro Business Lenders by State and Territory Using CRA Data, 2004
State or Territory Lending Institution
HQ Location SSBL $(1,000) SSBL#
Institution Asset Size LSBL$ (1,000) LSBL# LSBL(2) $(1,000) LSBL(2)#
(1) (2) (3) (4) (5) (6) (7)
Mirco Business Lending (<$100k) Small Business Lending (<$1M) Small Business Lending (<$100k- $1M)
The Pitney Bowes Bank UT 97,987 19,758 <$1B 98,393 19,760 406 2Hibernia Corporation LA 85,603 2,343 $10B-$50B 343,978 3,174 258,375 831Regions Financial Corporation AL 84,712 2,360 >$50B 433,034 3,378 348,322 1,018International Bancshares Corp. TX 79,375 2,518 $10B-$50B 383,065 3,486 303,690 968Sterling Bancshares, Inc. TX 68,335 2,022 $1B-$10B 280,286 2,680 211,951 658Maedgen & White Ltd. TX 67,285 1,867 <$1B 270,598 2,540 203,313 673First Financial Bankshares TX 66,093 2,331 $1B-$10B 243,281 2,895 177,188 564Incus Co. Ltd. XX 61,348 1,836 . 220,814 2,398 159,466 562American State Financial Corp. TX 60,560 2,611 $1B-$10B 167,075 2,962 106,515 351U.S. Bancorp MN 58,150 4,303 >$50B 100,528 4,424 42,378 121Amarillo National Bancorp, Inc. TX 49,396 2,703 $1B-$10B 145,482 2,987 96,086 284First American Bank SSB TX 46,882 1,485 . 206,603 1,968 159,721 483First National Bank Group, Inc. TX 45,701 1,406 $1B-$10B 161,906 1,774 116,205 368JSA Family Limited Partnership TX 44,052 1,480 <$1B 126,885 1,758 82,833 278Lone Star National Bancshare TX 43,991 1,274 $1B-$10B 156,238 1,690 112,247 416Eggemeyer Advisory Corp. CA 43,568 1,286 $1B-$10B 159,682 1,652 116,114 366Wachovia Corporation NC 39,360 868 >$50B 255,810 1,427 216,450 559A.N.B. Holding Company Ltd. TX 38,389 1,148 $1B-$10B 146,505 1,479 108,116 331BOK Financial Corporation OK 37,576 756 $10B-$50B 247,580 1,318 210,004 562Republic Bancshares of Texas TX 37,175 971 <$1B 174,481 1,414 137,306 443Overton Financial Corporation TX 35,698 1,223 <$1B 123,961 1,527 88,263 304Amegy Corporation TX 34,768 859 $1B-$10B 224,410 1,375 189,642 516Prosperity Bancshares, Inc. TX 31,632 912 $1B-$10B 88,475 1,101 56,843 189Texas United Bancshares, Inc. TX 30,981 1,151 $1B-$10B 92,009 1,357 61,028 206Guaranty Bancshares, Inc. TX 30,256 1,159 <$1B 83,941 1,359 53,685 200South Plains Financial, Inc. TX 30,092 998 $1B-$10B 130,691 1,342 100,599 344Woodforest Financial Group TX 30,058 838 $1B-$10B 152,287 1,209 122,229 371Comerica, Inc. MI 29,598 661 >$50B 366,962 1,478 337,364 817Southside Bancshares , Inc. TX 29,421 876 $1B-$10B 108,423 1,134 79,002 258Summit Bancshares, Inc. TX 28,388 748 $1B-$10B 122,197 1,041 93,809 293Security Holding Company TX 28,139 1,040 <$1B 95,446 1,261 67,307 221Washington Mutual Bank FA WA 28,067 801 >$50B 92,933 973 64,866 172First Community Capital Corp. TX 27,847 736 <$1B 118,665 1,023 90,818 287Central Community Corporation TX 27,259 910 <$1B 110,735 1,195 83,476 285Broadway Bancshares, Inc. TX 26,735 671 $1B-$10B 112,102 943 85,367 272Plains Bancorp, Inc. TX 25,993 1,136 <$1B 81,539 1,356 55,546 220Firstperryton Bancorp, Inc. TX 25,841 834 <$1B 70,989 1,000 45,148 166MOW/RPW II Ltd. TX 25,576 733 <$1B 111,181 1,009 85,605 276Doss Ltd. TX 23,806 888 $1B-$10B 67,911 1,046 44,105 158Legacytexas Group, Inc. TX 23,667 990 <$1B 80,746 1,173 57,079 183Diboll State Bancshares, Inc. TX 22,660 789 <$1B 56,224 913 33,564 124Whitney Holding Corporation LA 22,180 436 $1B-$10B 132,634 758 110,454 322American Bank Holding Corp. TX 22,071 565 <$1B 78,902 749 56,831 184Firstcapital Bank SSB TX 20,707 621 . 89,078 808 68,371 187Central Bancorp, Inc. TX 19,892 399 <$1B 131,499 743 111,607 344Jefferson Bancshares, Inc. TX 19,694 525 <$1B 74,637 687 54,943 162Atlantic Bank of New York NY 18,344 3,133 $1B-$10B 21,382 3,152 3,038 19
Page 108
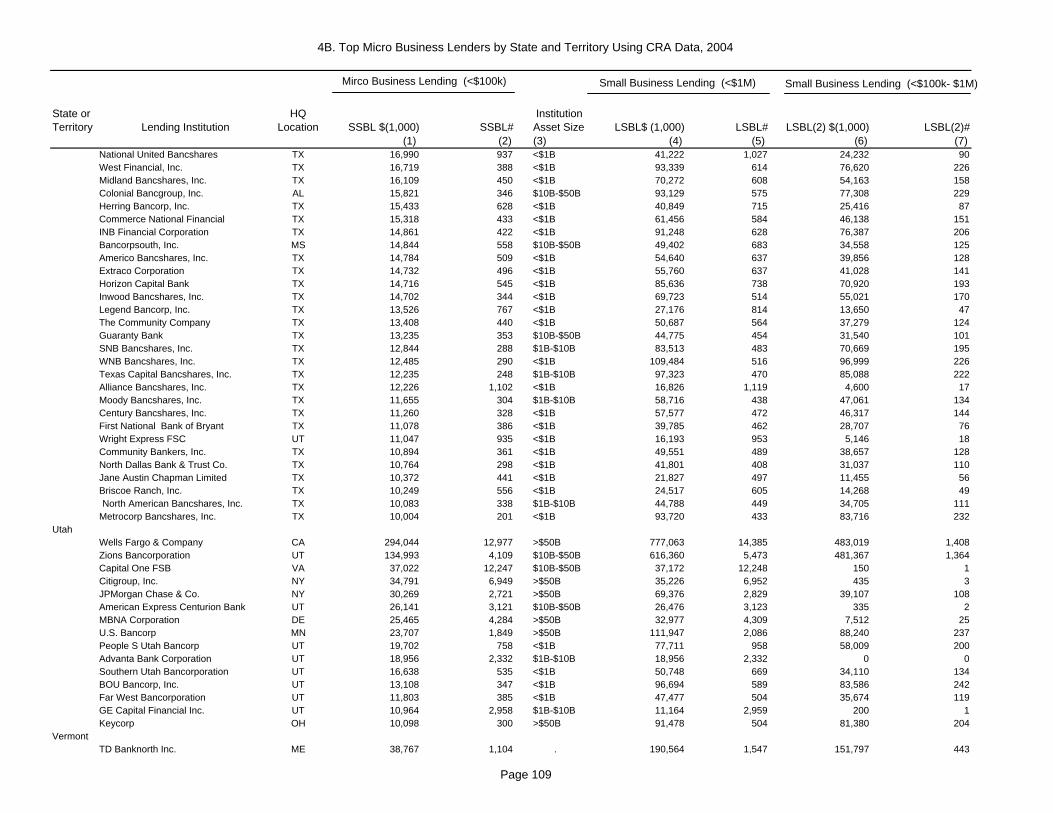
4B. Top Micro Business Lenders by State and Territory Using CRA Data, 2004
State or Territory Lending Institution
HQ Location SSBL $(1,000) SSBL#
Institution Asset Size LSBL$ (1,000) LSBL# LSBL(2) $(1,000) LSBL(2)#
(1) (2) (3) (4) (5) (6) (7)
Mirco Business Lending (<$100k) Small Business Lending (<$1M) Small Business Lending (<$100k- $1M)
National United Bancshares TX 16,990 937 <$1B 41,222 1,027 24,232 90West Financial, Inc. TX 16,719 388 <$1B 93,339 614 76,620 226Midland Bancshares, Inc. TX 16,109 450 <$1B 70,272 608 54,163 158Colonial Bancgroup, Inc. AL 15,821 346 $10B-$50B 93,129 575 77,308 229Herring Bancorp, Inc. TX 15,433 628 <$1B 40,849 715 25,416 87Commerce National Financial TX 15,318 433 <$1B 61,456 584 46,138 151INB Financial Corporation TX 14,861 422 <$1B 91,248 628 76,387 206Bancorpsouth, Inc. MS 14,844 558 $10B-$50B 49,402 683 34,558 125Americo Bancshares, Inc. TX 14,784 509 <$1B 54,640 637 39,856 128Extraco Corporation TX 14,732 496 <$1B 55,760 637 41,028 141Horizon Capital Bank TX 14,716 545 <$1B 85,636 738 70,920 193Inwood Bancshares, Inc. TX 14,702 344 <$1B 69,723 514 55,021 170Legend Bancorp, Inc. TX 13,526 767 <$1B 27,176 814 13,650 47The Community Company TX 13,408 440 <$1B 50,687 564 37,279 124Guaranty Bank TX 13,235 353 $10B-$50B 44,775 454 31,540 101SNB Bancshares, Inc. TX 12,844 288 $1B-$10B 83,513 483 70,669 195WNB Bancshares, Inc. TX 12,485 290 <$1B 109,484 516 96,999 226Texas Capital Bancshares, Inc. TX 12,235 248 $1B-$10B 97,323 470 85,088 222Alliance Bancshares, Inc. TX 12,226 1,102 <$1B 16,826 1,119 4,600 17Moody Bancshares, Inc. TX 11,655 304 $1B-$10B 58,716 438 47,061 134Century Bancshares, Inc. TX 11,260 328 <$1B 57,577 472 46,317 144First National Bank of Bryant TX 11,078 386 <$1B 39,785 462 28,707 76Wright Express FSC UT 11,047 935 <$1B 16,193 953 5,146 18Community Bankers, Inc. TX 10,894 361 <$1B 49,551 489 38,657 128North Dallas Bank & Trust Co. TX 10,764 298 <$1B 41,801 408 31,037 110Jane Austin Chapman Limited TX 10,372 441 <$1B 21,827 497 11,455 56Briscoe Ranch, Inc. TX 10,249 556 <$1B 24,517 605 14,268 49North American Bancshares, Inc. TX 10,083 338 $1B-$10B 44,788 449 34,705 111
Metrocorp Bancshares, Inc. TX 10,004 201 <$1B 93,720 433 83,716 232
Wells Fargo & Company CA 294,044 12,977 >$50B 777,063 14,385 483,019 1,408Zions Bancorporation UT 134,993 4,109 $10B-$50B 616,360 5,473 481,367 1,364Capital One FSB VA 37,022 12,247 $10B-$50B 37,172 12,248 150 1Citigroup, Inc. NY 34,791 6,949 >$50B 35,226 6,952 435 3JPMorgan Chase & Co. NY 30,269 2,721 >$50B 69,376 2,829 39,107 108American Express Centurion Bank UT 26,141 3,121 $10B-$50B 26,476 3,123 335 2MBNA Corporation DE 25,465 4,284 >$50B 32,977 4,309 7,512 25U.S. Bancorp MN 23,707 1,849 >$50B 111,947 2,086 88,240 237People S Utah Bancorp UT 19,702 758 <$1B 77,711 958 58,009 200Advanta Bank Corporation UT 18,956 2,332 $1B-$10B 18,956 2,332 0 0Southern Utah Bancorporation UT 16,638 535 <$1B 50,748 669 34,110 134BOU Bancorp, Inc. UT 13,108 347 <$1B 96,694 589 83,586 242Far West Bancorporation UT 11,803 385 <$1B 47,477 504 35,674 119GE Capital Financial Inc. UT 10,964 2,958 $1B-$10B 11,164 2,959 200 1Keycorp OH 10,098 300 >$50B 91,478 504 81,380 204
TD Banknorth Inc. ME 38,767 1,104 . 190,564 1,547 151,797 443Vermont
Utah
Page 109
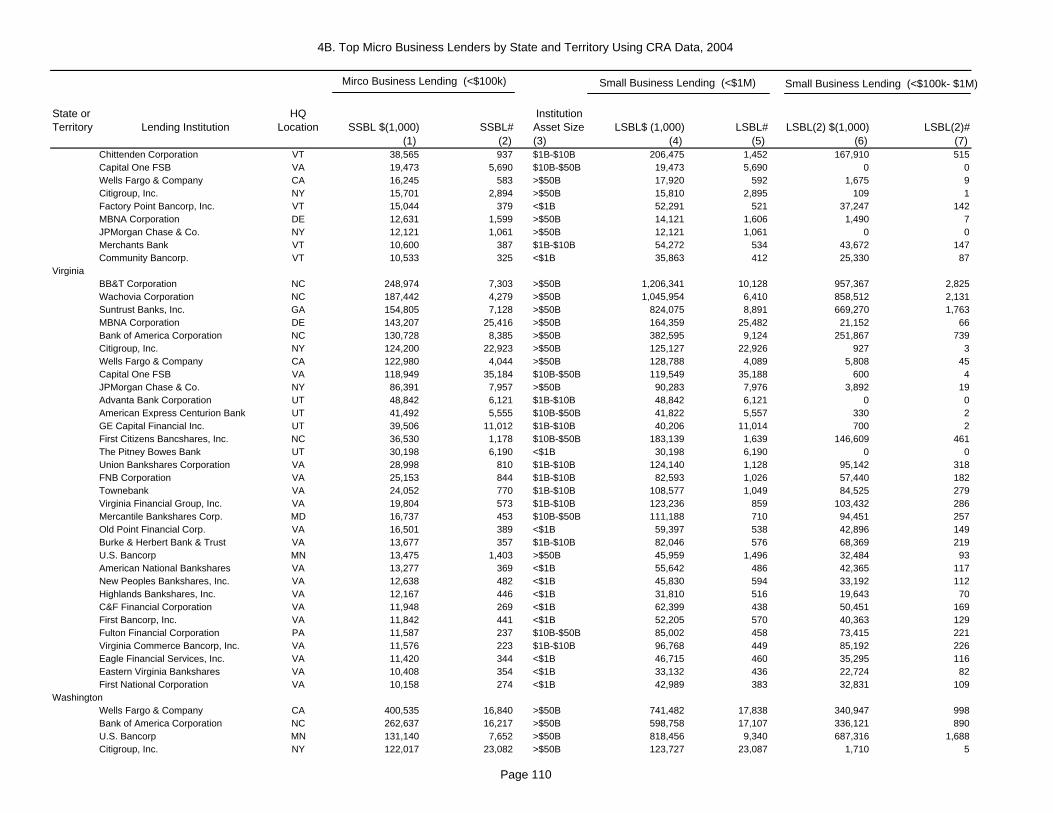
4B. Top Micro Business Lenders by State and Territory Using CRA Data, 2004
State or Territory Lending Institution
HQ Location SSBL $(1,000) SSBL#
Institution Asset Size LSBL$ (1,000) LSBL# LSBL(2) $(1,000) LSBL(2)#
(1) (2) (3) (4) (5) (6) (7)
Mirco Business Lending (<$100k) Small Business Lending (<$1M) Small Business Lending (<$100k- $1M)
Chittenden Corporation VT 38,565 937 $1B-$10B 206,475 1,452 167,910 515Capital One FSB VA 19,473 5,690 $10B-$50B 19,473 5,690 0 0Wells Fargo & Company CA 16,245 583 >$50B 17,920 592 1,675 9Citigroup, Inc. NY 15,701 2,894 >$50B 15,810 2,895 109 1Factory Point Bancorp, Inc. VT 15,044 379 <$1B 52,291 521 37,247 142MBNA Corporation DE 12,631 1,599 >$50B 14,121 1,606 1,490 7JPMorgan Chase & Co. NY 12,121 1,061 >$50B 12,121 1,061 0 0Merchants Bank VT 10,600 387 $1B-$10B 54,272 534 43,672 147Community Bancorp. VT 10,533 325 <$1B 35,863 412 25,330 87
BB&T Corporation NC 248,974 7,303 >$50B 1,206,341 10,128 957,367 2,825Wachovia Corporation NC 187,442 4,279 >$50B 1,045,954 6,410 858,512 2,131Suntrust Banks, Inc. GA 154,805 7,128 >$50B 824,075 8,891 669,270 1,763MBNA Corporation DE 143,207 25,416 >$50B 164,359 25,482 21,152 66Bank of America Corporation NC 130,728 8,385 >$50B 382,595 9,124 251,867 739Citigroup, Inc. NY 124,200 22,923 >$50B 125,127 22,926 927 3Wells Fargo & Company CA 122,980 4,044 >$50B 128,788 4,089 5,808 45Capital One FSB VA 118,949 35,184 $10B-$50B 119,549 35,188 600 4JPMorgan Chase & Co. NY 86,391 7,957 >$50B 90,283 7,976 3,892 19Advanta Bank Corporation UT 48,842 6,121 $1B-$10B 48,842 6,121 0 0American Express Centurion Bank UT 41,492 5,555 $10B-$50B 41,822 5,557 330 2GE Capital Financial Inc. UT 39,506 11,012 $1B-$10B 40,206 11,014 700 2First Citizens Bancshares, Inc. NC 36,530 1,178 $10B-$50B 183,139 1,639 146,609 461The Pitney Bowes Bank UT 30,198 6,190 <$1B 30,198 6,190 0 0Union Bankshares Corporation VA 28,998 810 $1B-$10B 124,140 1,128 95,142 318FNB Corporation VA 25,153 844 $1B-$10B 82,593 1,026 57,440 182Townebank VA 24,052 770 $1B-$10B 108,577 1,049 84,525 279Virginia Financial Group, Inc. VA 19,804 573 $1B-$10B 123,236 859 103,432 286Mercantile Bankshares Corp. MD 16,737 453 $10B-$50B 111,188 710 94,451 257Old Point Financial Corp. VA 16,501 389 <$1B 59,397 538 42,896 149Burke & Herbert Bank & Trust VA 13,677 357 $1B-$10B 82,046 576 68,369 219U.S. Bancorp MN 13,475 1,403 >$50B 45,959 1,496 32,484 93American National Bankshares VA 13,277 369 <$1B 55,642 486 42,365 117New Peoples Bankshares, Inc. VA 12,638 482 <$1B 45,830 594 33,192 112Highlands Bankshares, Inc. VA 12,167 446 <$1B 31,810 516 19,643 70C&F Financial Corporation VA 11,948 269 <$1B 62,399 438 50,451 169First Bancorp, Inc. VA 11,842 441 <$1B 52,205 570 40,363 129Fulton Financial Corporation PA 11,587 237 $10B-$50B 85,002 458 73,415 221Virginia Commerce Bancorp, Inc. VA 11,576 223 $1B-$10B 96,768 449 85,192 226Eagle Financial Services, Inc. VA 11,420 344 <$1B 46,715 460 35,295 116Eastern Virginia Bankshares VA 10,408 354 <$1B 33,132 436 22,724 82First National Corporation VA 10,158 274 <$1B 42,989 383 32,831 109
Wells Fargo & Company CA 400,535 16,840 >$50B 741,482 17,838 340,947 998Bank of America Corporation NC 262,637 16,217 >$50B 598,758 17,107 336,121 890U.S. Bancorp MN 131,140 7,652 >$50B 818,456 9,340 687,316 1,688Citigroup, Inc. NY 122,017 23,082 >$50B 123,727 23,087 1,710 5
Washington
Virginia
Page 110

4B. Top Micro Business Lenders by State and Territory Using CRA Data, 2004
State or Territory Lending Institution
HQ Location SSBL $(1,000) SSBL#
Institution Asset Size LSBL$ (1,000) LSBL# LSBL(2) $(1,000) LSBL(2)#
(1) (2) (3) (4) (5) (6) (7)
Mirco Business Lending (<$100k) Small Business Lending (<$1M) Small Business Lending (<$100k- $1M)
Capital One FSB VA 115,498 36,557 $10B-$50B 116,223 36,562 725 5MBNA Corporation DE 60,801 10,952 >$50B 81,113 11,007 20,312 55W.T.B. Financial Corporation WA 59,492 1,478 $1B-$10B 383,381 2,406 323,889 928JPMorgan Chase & Co. NY 51,596 5,305 >$50B 54,414 5,312 2,818 7Frontier Financial Corporation WA 48,273 1,105 $1B-$10B 261,121 1,782 212,848 677Advanta Bank Corporation UT 47,595 5,813 $1B-$10B 47,595 5,813 0 0Keycorp OH 44,753 1,203 >$50B 358,081 2,031 313,328 828Columbia Banking System, Inc. WA 41,018 960 $1B-$10B 263,920 1,541 222,902 581Banner Corporation WA 40,739 826 $1B-$10B 249,501 1,451 208,762 625American Express Centurion Bank UT 33,952 6,740 $10B-$50B 33,952 6,740 0 0Americanwest Bancorporation WA 28,748 746 $1B-$10B 129,275 1,075 100,527 329The Pitney Bowes Bank UT 28,372 5,489 <$1B 28,778 5,491 406 2Washington Banking Company WA 28,296 835 <$1B 105,628 1,092 77,332 257GE Capital Financial Inc. UT 18,225 4,395 $1B-$10B 18,880 4,397 655 2Peoples Bancorp WA 14,395 348 <$1B 79,748 559 65,353 211Sterling Savings Bank WA 14,306 355 $1B-$10B 102,942 610 88,636 255Olympic Bancorp, Inc. WA 13,983 346 <$1B 96,659 612 82,676 266Citibank WA 12,633 288 <$1B 95,345 530 82,712 242Venture Financial Group, Inc. WA 12,626 342 <$1B 70,007 513 57,381 171Heritage Financial Corporation WA 12,320 276 <$1B 78,651 457 66,331 181Cashmere Valley Bank WA 11,958 438 . 48,708 557 36,750 119Cascade Financial Corporation WA 10,146 225 $1B-$10B 93,472 447 83,326 222Skagit State Bank WA 10,082 350 <$1B 49,521 490 39,439 140
BB&T Corporation NC 60,668 1,893 >$50B 282,824 2,510 222,156 617United Bankshares, Inc. WV 53,745 1,457 $1B-$10B 200,003 1,920 146,258 463Wesbanco, Inc. WV 31,817 1,052 $1B-$10B 108,216 1,306 76,399 254Huntington Bancshares, Inc. OH 30,755 845 $10B-$50B 92,022 1,028 61,267 183JPMorgan Chase & Co. NY 19,868 1,775 >$50B 77,255 1,926 57,387 151Capital One FSB VA 18,605 6,680 $10B-$50B 18,755 6,681 150 1Wells Fargo & Company CA 18,056 606 >$50B 18,161 607 105 1First Community Bancshares VA 17,437 660 $1B-$10B 50,187 786 32,750 126Citigroup, Inc. NY 15,674 2,757 >$50B 15,674 2,757 0 0MBNA Corporation DE 14,580 2,916 >$50B 17,228 2,926 2,648 10GE Capital Financial Inc. UT 13,079 3,576 $1B-$10B 13,079 3,576 0 0City Holding Company WV 12,121 260 $1B-$10B 55,979 383 43,858 123
Marshall & Ilsley Corporation WI 282,671 6,911 $10B-$50B 1,986,241 11,663 1,703,570 4,752Wells Fargo & Company CA 156,061 6,327 >$50B 304,155 6,807 148,094 480Associated Banc-Corp WI 129,327 3,852 $10B-$50B 754,058 5,673 624,731 1,821U.S. Bancorp MN 122,328 8,401 >$50B 544,411 9,577 422,083 1,176JPMorgan Chase & Co. NY 106,202 8,231 >$50B 316,936 8,754 210,734 523Capital One FSB VA 103,404 30,190 $10B-$50B 103,404 30,190 0 0Citigroup, Inc. NY 83,775 15,562 >$50B 83,970 15,563 195 1MBNA Corporation DE 64,866 13,333 >$50B 67,942 13,341 3,076 8Advanta Bank Corporation UT 44,251 5,499 $1B-$10B 44,251 5,499 0 0Johnson Financial Group, Inc. WI 40,553 867 $1B-$10B 377,335 1,748 336,782 881
West Virginia
Wisconsin
Page 111

4B. Top Micro Business Lenders by State and Territory Using CRA Data, 2004
State or Territory Lending Institution
HQ Location SSBL $(1,000) SSBL#
Institution Asset Size LSBL$ (1,000) LSBL# LSBL(2) $(1,000) LSBL(2)#
(1) (2) (3) (4) (5) (6) (7)
Mirco Business Lending (<$100k) Small Business Lending (<$1M) Small Business Lending (<$100k- $1M)
Waupaca Bancorporation, Inc. WI 38,976 1,893 <$1B 95,410 2,095 56,434 202River Valley Bancorporation WI 34,186 941 <$1B 158,059 1,366 123,873 425NEB Corporation WI 33,933 934 $1B-$10B 129,078 1,256 95,145 322Citizens Banking Corporation MI 32,354 818 $1B-$10B 145,544 1,242 113,190 424Baylake Corp. WI 28,526 731 $1B-$10B 184,399 1,189 155,873 458First Banking Center, Inc. WI 27,160 711 <$1B 163,381 1,206 136,221 495Anchorbank FSB WI 25,528 556 $1B-$10B 190,031 1,071 164,503 515The Pitney Bowes Bank UT 24,748 4,406 <$1B 24,951 4,407 203 1First Manitowoc Bancorp, Inc. WI 24,734 788 <$1B 102,037 1,035 77,303 247GE Capital Financial Inc. UT 20,215 5,245 $1B-$10B 20,215 5,245 0 0Tri City Bankshares Corp. WI 19,227 565 <$1B 93,370 816 74,143 251Waukesha State Bank WI 17,933 454 <$1B 85,369 649 67,436 195Otto Bremer Foundation MN 17,084 546 $1B-$10B 60,945 696 43,861 150Oconomowoc Bancshares, Inc. WI 16,938 353 <$1B 115,559 660 98,621 307First Business Financial Services WI 16,539 361 <$1B 140,072 692 123,533 331State Financial Services Corp. WI 15,910 393 $1B-$10B 105,204 635 89,294 242S.B.C.P. Bancorp, Inc. WI 15,369 399 <$1B 78,355 606 62,986 207Bank of America Corporation NC 14,854 1,534 >$50B 18,954 1,540 4,100 6Sword Financial Corporation WI 14,545 396 <$1B 61,905 563 47,360 167American Express Centurion Bank UT 14,009 1,467 $10B-$50B 14,009 1,467 0 0Citizens Bank Holding, Inc. WI 13,461 436 <$1B 58,792 584 45,331 148First State Bancshares, Inc. WI 12,741 351 <$1B 44,040 465 31,299 114Community Banc-Corp of Sheboygan WI 12,172 300 <$1B 79,580 516 67,408 216Mid America Bank FSB IL 12,096 276 $1B-$10B 65,950 461 53,854 185Bankmanagers Corp. WI 11,449 237 <$1B 114,323 512 102,874 275Mid-Wisconsin Financial Services WI 10,649 473 <$1B 42,138 599 31,489 126Ozaukee Bank WI 10,403 292 <$1B 47,788 412 37,385 120NW Bancshares, Inc. WI 10,324 322 <$1B 41,784 438 31,460 116Denmark Bancshares, Inc. WI 10,309 337 <$1B 42,105 441 31,796 104
First Interstate Bancsystem MT 45,414 1,552 $1B-$10B 140,240 1,856 94,826 304Wells Fargo & Company CA 42,147 1,666 >$50B 88,673 1,821 46,526 155Bank of The West CA 20,157 697 >$50B 57,509 839 37,352 142Midland Financial Corporation WY 19,338 567 <$1B 56,034 704 36,696 137Pinnacle Bancorp, Inc. NE 13,492 405 $1B-$10B 38,385 499 24,893 94Capital One FSB VA 12,814 4,023 $10B-$50B 12,964 4,024 150 1MBNA Corporation DE 12,107 2,538 >$50B 12,430 2,540 323 2JPMorgan Chase & Co. NY 11,240 894 >$50B 11,240 894 0 0United Bancorporation of WY WY 10,676 286 $1B-$10B 68,323 439 57,647 153
Note: Small businesses seeking loans should also consider banks that participate in SBA loan programs. To locate an SBA certified lender near you, call 1-800-8-ASK- SBA or check SBA'swebsite at: http://www.sba.gov.Source: U.S. Small Business Administration, Office of Advocacy, from Community Reinvestment Act reports.
Wyoming
Page 112

Table 5. Number of Reporting Institutions by Asset Size and by State annd Territory, June 2004-June 2005
2005 Lending Institutions by Asset Size ClassState or Territory 2004 2005 <$100M $100M–$500M $500M–$1B $1B–$10B $10-$50B >$50B
National 9,100 8,799 3,971 3,643 579 493 84 29
Alabama 164 161 72 72 9 4 2 2Alaska 7 7 1 4 1 1 - -American Samoa 1 1 1 - - - - -Arizona 50 51 21 21 3 5 - 1Arkansas 169 163 56 94 7 6 - -California 302 298 64 133 35 55 8 3Colorado 177 175 78 80 8 9 - -Connecticut 69 58 11 27 12 6 2 -Delaware 36 35 6 7 4 11 5 2District of Columbia 6 7 3 4 - - -Florida 308 293 77 170 24 22 - -Federated States of Micronesia 1 1 1 - - - - -Georgia 349 346 126 186 24 9 - 1Guam 3 3 1 1 1 - - -Hawaii 8 7 - 1 1 4 1 -Idaho 18 17 2 9 6 - - -Illinois 766 717 352 288 43 29 4 1Indiana 202 193 62 98 17 15 1 -Iowa 420 413 272 123 13 5 - -Kansas 378 371 266 86 10 9 - -Kentucky 243 230 98 118 8 5 1 -Louisiana 168 164 80 70 10 3 1 -Maine 38 37 9 13 12 2 1 -Maryland 122 113 31 61 12 9 - -Massachusetts 140 127 9 70 28 17 2 1Michigan 177 173 54 94 12 9 3 1Minnesota 484 470 315 143 7 4 1 -Mississippi 100 99 38 49 5 6 1 -Missouri 377 372 209 134 17 11 1 -Montana 80 82 55 23 2 2 - -Nebraska 269 262 197 58 - 6 1 -Nevada 37 38 6 19 2 10 1 -New Hampshire 31 30 5 17 5 2 1 -New Jersey 146 136 19 68 20 24 5 -New Mexico 60 57 23 27 2 5 - -New York 207 199 38 94 23 33 7 4North Carolina 106 108 32 46 18 7 2 3North Dakota 104 100 74 19 4 3 - -Ohio 309 281 128 111 16 16 5 5Oklahoma 274 274 172 91 5 5 1 -Oregon 40 39 13 17 5 4 - -Pennsylvania 272 254 65 120 40 24 3 2Puerto Rico 10 10 - - - 6 4 -Rhode Island 15 14 5 3 2 3 1 -South Carolina 98 97 35 49 4 8 1 -South Dakota 93 90 60 19 6 4 - 1Tennessee 211 202 80 105 12 4 1 -Texas 699 677 375 238 33 28 3 -Utah 64 68 25 20 9 7 6 1Vermont 19 19 3 14 2 - -Virginia 143 140 26 86 11 10 6 1Virginia Islands 2 2 2 - - - - -Washington 99 100 30 43 15 12 - -West Virginia 74 71 30 37 1 3 - -Wisconsin 311 303 133 145 14 9 2 -Wyoming 44 44 25 18 1 - - -Source: U.S Small Business Administration, Office of Advocacy, from the Federal Reserve Board's Call Reports.
Page 113