u.s. voters send trump approval to near … · april 19 survey by the independent quinnipiac...
TRANSCRIPT

FOR RELEASE: MAY 10, 2017
U.S. VOTERS SEND TRUMP APPROVAL TO NEAR RECORD LOW;
QUINNIPIAC UNIVERSITY NATIONAL POLL FINDS;
NO WINNER IN MEDIA WAR, BUT VOTERS TRUST MEDIA MORE
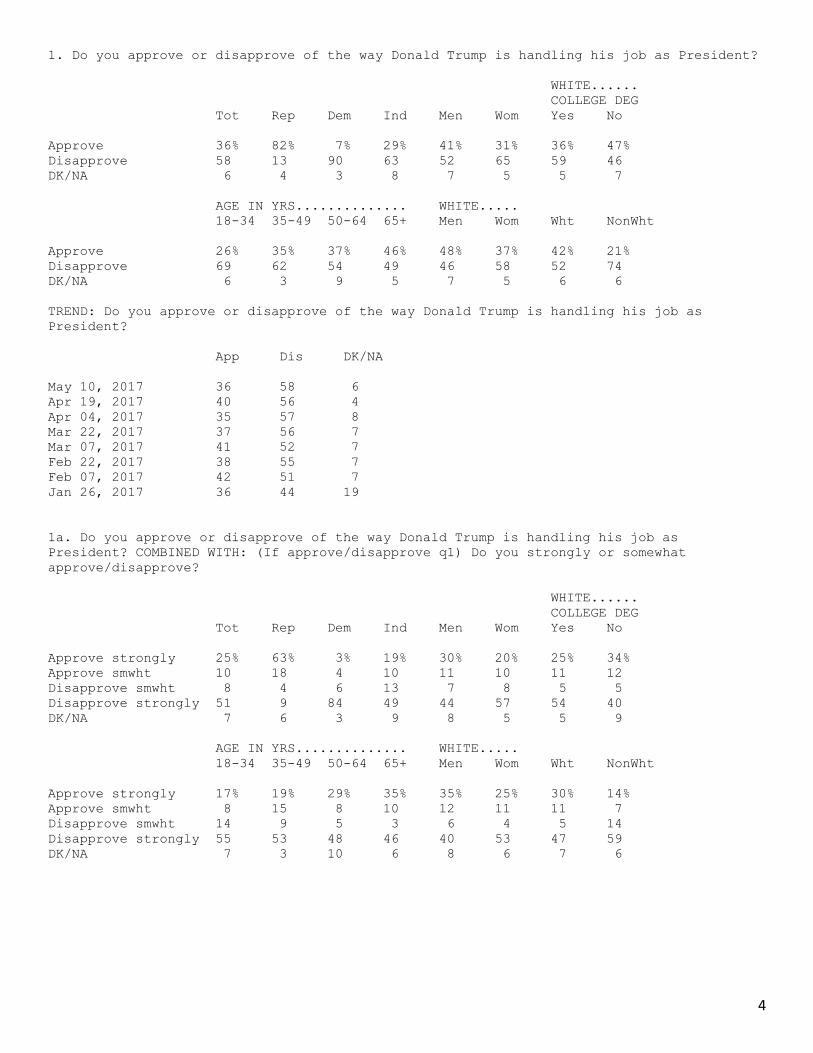
American voters, who gave President Donald Trump a slight approval bump after the missile strike
in Syria, today give him a near-record negative 36 – 58 percent job approval rating, according to a
Quinnipiac University national poll released today. Critical are big losses among white voters
with no college degree, white men and independent voters.
Today’s job approval rating compares to a negative 40 – 56 percent approval rating in an
April 19 survey by the independent Quinnipiac (KWIN-uh-pe-ack) University and a negative
35 – 57 percent score April 4, his lowest approval rating since he became president.
The president is losing support among independent voters and groups which are
important parts of his base. Approval ratings are:
Negative 29 – 63 percent among independent voters, down from a negative 38 – 56
percent April 19;
A split among white voters with no college degree, as 47 percent approve and 46 percent
disapprove, compared to a 57 – 38 percent approval April 19;
White men go from a 53 – 41 percent approval April 19 to a split today with 48 percent
approving and 46 percent disapproving.
American voters’ opinions of several of Trump’s personal qualities are down:
61 – 33 percent that he is not honest, compared to 58 – 37 percent April 19;
56 – 41 percent that he does not have good leadership skills, little change;
59 – 38 percent that he does not care about average Americans, compared to 57 – 42
percent April 19;
66 – 29 percent that he is not level-headed, compared to 63 – 33 percent last month;
62 – 35 percent that he is a strong person, little change;
56 – 41 percent that he is intelligent, compared to 58 – 38 percent;
64 – 32 percent that he does not share their values, compared to 61 – 35 percent.
“There is no way to spin or sugarcoat these sagging numbers,” said Tim Malloy, assistant
director of the Quinnipiac University Poll.
-more-
Tim Malloy, Assistant Director
(203) 645-8043
Rubenstein
Pat Smith (212) 843-8026

2
Quinnipiac University Poll/May 10, 2017 – page 2
“The erosion of white men, white voters without college degrees and independent voters,
the declaration by voters that President Donald Trump’s first 100 days were mainly a failure and
deepening concerns about Trump’s honesty, intelligence and level headedness are red flags that
the administration simply can't brush away,” Malloy added.
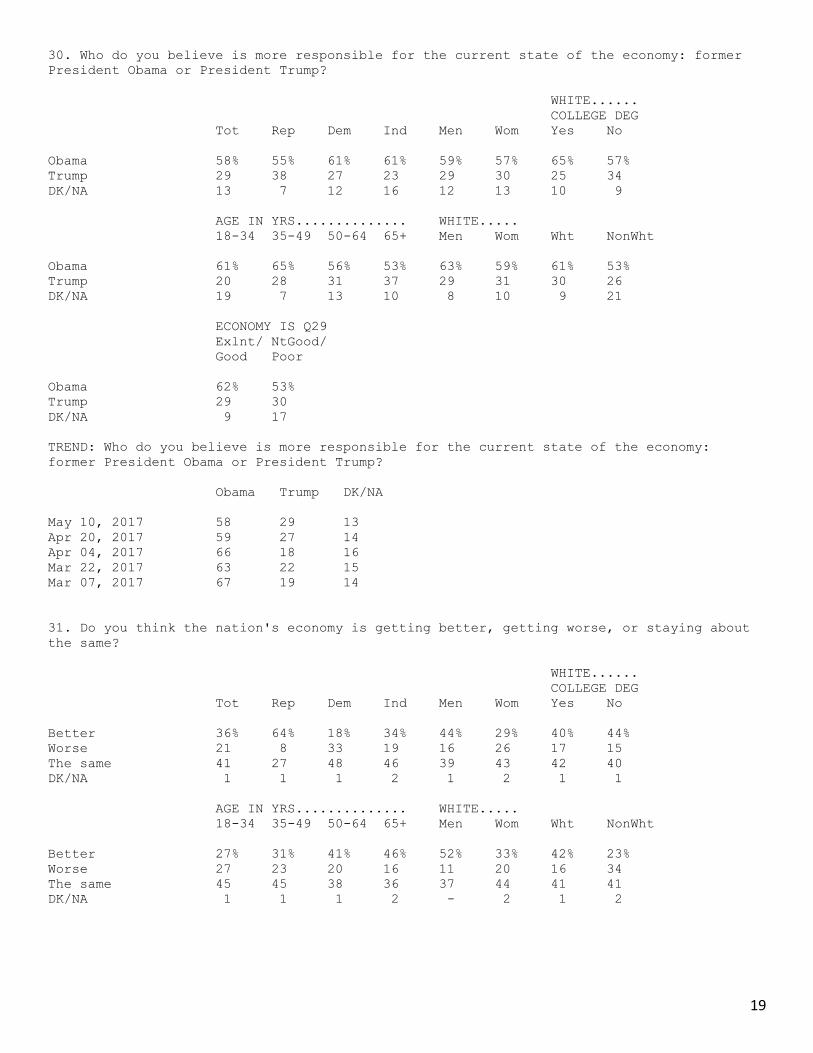
American voters disapprove 52 – 40 percent of the way Trump is handling the economy.
His grades on handling other issues are:
44 percent approve of the way he is handling U.S. policy toward North Korea and 48
percent disapprove;
Disapprove 59 – 36 percent of the way he is handling foreign policy;
45 percent approve of the way he is handling terrorism and 48 percent disapprove;
Disapprove 62 – 35 percent of the way he is handling immigration.
Trump and the Media
American voters disapprove 58 – 37 percent of the way the news media covers Trump.
Voters disapprove 65 – 31 percent of the way Trump talks about the media. And voters trust the
media more than Trump 57 – 31 percent to tell the truth about important issues.
Trump’s first 100 days in office have been “mainly a failure,” 58 percent of voters say,
while 38 percent say they have been “mainly a success.”
By a 54 – 38 percent margin, American voters want the Democratic Party to win control
of the U.S. House of Representatives. This is the widest margin ever measured for this question
in a Quinnipiac University poll, exceeding a 5 percentage point margin for Republicans in 2013.
If Democrats had won control of the U.S. Senate in the 2016 elections, the country would
be in a better place than it is now, 41 percent of voters say, while 27 percent say it would be in a
worse place and 30 percent say it would be the same.
American voters dislike Democrats less than they dislike Republicans:
Voters disapprove 71 – 22 percent of the way Republicans in Congress do their job;
Voters disapprove 58 – 34 percent of the way Democrats in Congress are doing their job.
From May 4 – 9, Quinnipiac University surveyed 1,078 voters nationwide with a margin
of error of +/- 3 percentage points. Live interviewers call landlines and cell phones.
The Quinnipiac University Poll, directed by Douglas Schwartz, Ph.D., conducts public
opinion surveys in Pennsylvania, New York, New Jersey, Connecticut, Florida, Ohio, Virginia,
Iowa, Colorado and the nation as a public service and for research.
Visit poll.qu.edu or www.facebook.com/quinnipiacpoll Call (203) 582-5201, or follow us
on Twitter @QuinnipiacPoll.

3
4
1. Do you approve or disapprove of the way Donald Trump is handling his job as President?
WHITE......
COLLEGE DEG
Tot Rep Dem Ind Men Wom Yes No
Approve 36% 82% 7% 29% 41% 31% 36% 47%
Disapprove 58 13 90 63 52 65 59 46
DK/NA 6 4 3 8 7 5 5 7
AGE IN YRS.............. WHITE.....
18-34 35-49 50-64 65+ Men Wom Wht NonWht
Approve 26% 35% 37% 46% 48% 37% 42% 21%
Disapprove 69 62 54 49 46 58 52 74
DK/NA 6 3 9 5 7 5 6 6
TREND: Do you approve or disapprove of the way Donald Trump is handling his job as
President?
App Dis DK/NA
May 10, 2017 36 58 6
Apr 19, 2017 40 56 4
Apr 04, 2017 35 57 8
Mar 22, 2017 37 56 7
Mar 07, 2017 41 52 7
Feb 22, 2017 38 55 7
Feb 07, 2017 42 51 7
Jan 26, 2017 36 44 19
1a. Do you approve or disapprove of the way Donald Trump is handling his job as
President? COMBINED WITH: (If approve/disapprove q1) Do you strongly or somewhat
approve/disapprove?
WHITE......
COLLEGE DEG
Tot Rep Dem Ind Men Wom Yes No
Approve strongly 25% 63% 3% 19% 30% 20% 25% 34%
Approve smwht 10 18 4 10 11 10 11 12
Disapprove smwht 8 4 6 13 7 8 5 5
Disapprove strongly 51 9 84 49 44 57 54 40
DK/NA 7 6 3 9 8 5 5 9
AGE IN YRS.............. WHITE.....
18-34 35-49 50-64 65+ Men Wom Wht NonWht
Approve strongly 17% 19% 29% 35% 35% 25% 30% 14%
Approve smwht 8 15 8 10 12 11 11 7
Disapprove smwht 14 9 5 3 6 4 5 14
Disapprove strongly 55 53 48 46 40 53 47 59
DK/NA 7 3 10 6 8 6 7 6

5
TREND: Do you approve or disapprove of the way Donald Trump is handling his job as
President? COMBINED WITH: (If approve/disapprove) Do you strongly or somewhat
approve/disapprove?
App App Dis Dis
Strngly Smwht Smwht Strngly DK/NA
May 10, 2017 25 10 8 51 7
Apr 19, 2017 28 11 6 50 5
Apr 04, 2017 25 9 7 49 9
Mar 22, 2017 26 10 6 50 8
Mar 07, 2017 31 10 6 45 8
Feb 22, 2017 29 9 6 49 8
Feb 07, 2017 33 9 6 45 8
Jan 26, 2017 29 6 4 40 20
2. Do you approve or disapprove of the way the Republicans in Congress are handling their
job?
WHITE......
COLLEGE DEG
Tot Rep Dem Ind Men Wom Yes No
Approve 22% 54% 5% 17% 22% 22% 22% 27%
Disapprove 71 39 89 76 71 71 73 66
DK/NA 7 7 6 7 6 8 5 8
AGE IN YRS.............. WHITE.....
18-34 35-49 50-64 65+ Men Wom Wht NonWht
Approve 19% 17% 26% 25% 25% 24% 24% 16%
Disapprove 69 78 69 68 70 69 69 74
DK/NA 12 5 5 7 6 7 6 10
TREND: Do you approve or disapprove of the way the Republicans in Congress are handling
their job?
App Dis DK/NA
May 10, 2017 22 71 7
Apr 19, 2017 24 68 7
Apr 04, 2017 21 70 9
Mar 22, 2017 29 64 7
Feb 22, 2017 31 62 8
Link to full trend on website
3. Do you approve or disapprove of the way the Democrats in Congress are handling their
job?
WHITE......
COLLEGE DEG
Tot Rep Dem Ind Men Wom Yes No
Approve 34% 10% 64% 24% 28% 39% 40% 28%
Disapprove 58 84 28 67 64 52 54 64
DK/NA 9 7 9 9 8 9 6 8
AGE IN YRS.............. WHITE.....
18-34 35-49 50-64 65+ Men Wom Wht NonWht
Approve 31% 35% 35% 33% 29% 38% 34% 33%
Disapprove 51 57 62 61 63 56 59 55
DK/NA 17 8 3 6 8 6 7 12

6
TREND: Do you approve or disapprove of the way the Democrats in Congress are handling
their job?
App Dis DK/NA
May 10, 2017 34 58 9
Apr 19, 2017 29 63 7
Apr 04, 2017 34 57 9
Mar 22, 2017 30 60 10
Feb 22, 2017 32 59 8
Link to full trend on website
4. Is your opinion of Donald Trump favorable, unfavorable or haven't you heard enough
about him?
WHITE......
COLLEGE DEG
Tot Rep Dem Ind Men Wom Yes No
Favorable 35% 82% 5% 30% 41% 31% 36% 46%
Unfavorable 58 12 90 62 52 64 60 47
Hvn't hrd enough 4 5 3 6 5 4 3 5
REFUSED 2 1 2 2 2 2 2 2
AGE IN YRS.............. WHITE.....
18-34 35-49 50-64 65+ Men Wom Wht NonWht
Favorable 23% 37% 38% 43% 46% 37% 41% 21%
Unfavorable 70 58 54 51 47 58 53 70
Hvn't hrd enough 4 5 5 4 4 4 4 6
REFUSED 3 - 3 2 3 1 2 2
TREND: Is your opinion of Donald Trump favorable, unfavorable or haven't you heard enough
about him?
Fav Unfav HvntHrd REF
May 10, 2017 35 58 4 2
Apr 19, 2017 39 56 3 2
Apr 04, 2017 36 59 3 2
Mar 22, 2017 36 57 5 2
Mar 07, 2017 43 53 3 1
Feb 22, 2017 39 55 4 2
Feb 07, 2017 43 52 3 2
Jan 26, 2017 39 52 6 2
Jan 10, 2017 37 51 8 4
Nov 22, 2016 44 46 6 3

7
5. Is your opinion of Paul Ryan favorable, unfavorable or haven't you heard enough about
him?
WHITE......
COLLEGE DEG
Tot Rep Dem Ind Men Wom Yes No
Favorable 24% 54% 6% 20% 26% 23% 28% 29%
Unfavorable 56 23 77 59 53 58 62 46
Hvn't hrd enough 19 22 17 19 20 19 8 23
REFUSED 1 1 1 2 2 1 1 1
AGE IN YRS.............. WHITE.....
18-34 35-49 50-64 65+ Men Wom Wht NonWht
Favorable 16% 18% 29% 32% 31% 27% 29% 12%
Unfavorable 56 57 57 52 53 55 54 59
Hvn't hrd enough 27 23 13 15 15 17 16 27
REFUSED - 1 1 1 2 1 1 1
TREND: Is your opinion of Paul Ryan favorable, unfavorable or haven't you heard enough
about him?
Fav Unfav HvntHrd REF
May 10, 2017 24 56 19 1
Apr 04, 2017 28 52 18 2
Mar 22, 2017 27 48 24 2
Link to full trend on website
6. Is your opinion of Nancy Pelosi favorable, unfavorable or haven't you heard enough
about her?
WHITE......
COLLEGE DEG
Tot Rep Dem Ind Men Wom Yes No
Favorable 31% 5% 60% 26% 23% 39% 38% 26%
Unfavorable 48 79 14 55 57 40 51 57
Hvn't hrd enough 19 15 24 18 19 20 10 16
REFUSED 1 1 3 1 1 1 1 1
AGE IN YRS.............. WHITE.....
18-34 35-49 50-64 65+ Men Wom Wht NonWht
Favorable 23% 32% 33% 38% 25% 38% 32% 30%
Unfavorable 37 46 53 53 63 46 54 33
Hvn't hrd enough 39 21 11 9 10 16 13 34
REFUSED 1 1 2 1 1 1 1 3
TREND: Is your opinion of Nancy Pelosi favorable, unfavorable or haven't you heard enough
about her?
Fav Unfav HvntHrd REF
May 10, 2017 31 48 19 1
Apr 04, 2017 30 47 21 2
Link to full trend on website

8
7. Is your opinion of Mitch McConnell favorable, unfavorable or haven't you heard enough
about him?
WHITE......
COLLEGE DEG
Tot Rep Dem Ind Men Wom Yes No
Favorable 16% 31% 5% 16% 17% 15% 18% 15%
Unfavorable 48 25 66 49 50 47 57 46
Hvn't hrd enough 35 43 29 34 33 37 23 37
REFUSED 1 1 1 1 1 1 1 1
AGE IN YRS.............. WHITE.....
18-34 35-49 50-64 65+ Men Wom Wht NonWht
Favorable 11% 13% 13% 27% 18% 15% 17% 13%
Unfavorable 35 51 54 48 55 49 52 40
Hvn't hrd enough 53 37 32 22 26 35 31 46
REFUSED - - 1 3 1 2 1 -
TREND: Is your opinion of Mitch McConnell favorable, unfavorable or haven't you heard
enough about him?
Fav Unfav HvntHrd REF
May 10, 2017 16 48 35 1
Apr 04, 2017 14 47 37 2
Feb 07, 2017 20 40 38 2
Link to full trend on website
8. Is your opinion of Chuck Schumer favorable, unfavorable or haven't you heard enough
about him?
WHITE......
COLLEGE DEG
Tot Rep Dem Ind Men Wom Yes No
Favorable 25% 8% 44% 23% 21% 29% 34% 19%
Unfavorable 34 49 15 38 42 26 35 38
Hvn't hrd enough 39 42 39 37 36 43 29 41
REFUSED 2 1 2 2 1 2 2 2
AGE IN YRS.............. WHITE.....
18-34 35-49 50-64 65+ Men Wom Wht NonWht
Favorable 7% 28% 31% 31% 23% 30% 27% 21%
Unfavorable 39 24 33 39 45 28 36 28
Hvn't hrd enough 51 47 35 28 31 40 35 50
REFUSED 3 1 1 2 2 2 2 2
TREND: Is your opinion of Chuck Schumer favorable, unfavorable or haven't you heard
enough about him? (* "Charles")
Fav Unfav HvntHrd REF
May 10, 2017 25 34 39 2
Apr 04, 2017 25 36 38 1
Feb 07, 2017 26 31 41 2 *

9
9. What is the first word that comes to mind when you think of Donald Trump? (Numbers are
not percentages. Figures show the number of times each response was given. This table
reports only words that were mentioned at least five times.)
idiot 39
incompetent 31
liar 30
leader 25
unqualified 25
president 22
strong 21
businessman 18
ignorant 16
egotistical 15
asshole 13
stupid 13
arrogant 12
trying 12
bully 11
business 11
narcissist 11
successful 11
disgusting 10
great 10
clown 9
dishonest 9
racist 9
American 8
bigot 8
good 8
money 8
smart 8
buffoon 7
con-man 7
crazy 7
different 7
disaster 7
rich 7
despicable 6
dictator 6
aggressive 5
blowhard 5
decisive 5
embarrassment 5
evil 5
greedy 5
inexperienced 5
mental 5
negotiator 5
patriotism 5

10
10. Would you say that Donald Trump is doing a better job as president than you expected,
a worse job, or about what you expected?
WHITE......
COLLEGE DEG
Tot Rep Dem Ind Men Wom Yes No
Better 14% 32% 4% 12% 17% 12% 13% 16%
Worse 24 7 40 20 19 28 23 18
As expected 60 59 55 66 63 58 62 64
DK/NA 2 2 1 2 2 2 1 3
AGE IN YRS.............. WHITE.....
18-34 35-49 50-64 65+ Men Wom Wht NonWht
Better 12% 12% 15% 18% 16% 14% 15% 13%
Worse 23 28 22 21 15 25 20 32
As expected 63 60 62 58 68 59 63 53
DK/NA 2 1 1 3 2 2 2 2
TREND: Would you say that Donald Trump is doing a better job as president than you
expected, a worse job, or about what you expected?
Better Worse Expectd DK/NA
May 10, 2017 14 24 60 2
Apr 19, 2017 16 24 58 1
Mar 07, 2017 22 22 53 3
Feb 22, 2017 19 27 52 2
11. If the election were today, would you want to see the Republican Party or the
Democratic Party win control of the United States House of Representatives?
WHITE......
COLLEGE DEG
Tot Rep Dem Ind Men Wom Yes No
Republican Party 38% 88% 2% 37% 42% 34% 41% 50%
Democratic Party 54 9 96 50 49 60 53 44
DK/NA 8 3 2 14 9 7 6 7
AGE IN YRS.............. WHITE.....
18-34 35-49 50-64 65+ Men Wom Wht NonWht
Republican Party 30% 34% 42% 45% 50% 41% 45% 20%
Democratic Party 59 57 53 49 41 55 48 69
DK/NA 11 8 5 7 8 4 6 11

11
13. In general, how satisfied are you with the way things are going in the nation today;
are you very satisfied, somewhat satisfied, somewhat dissatisfied, or very dissatisfied?
WHITE......
COLLEGE DEG
Tot Rep Dem Ind Men Wom Yes No
Very satisfied 5% 11% 1% 5% 5% 5% 5% 5%
Smwht satisfied 28 55 15 24 35 22 25 36
Smwht dissatisfied 25 21 24 29 27 23 26 21
Very dissatisfied 41 12 60 42 32 49 43 36
DK/NA 1 1 - 1 1 1 1 1
AGE IN YRS.............. WHITE.....
18-34 35-49 50-64 65+ Men Wom Wht NonWht
Very satisfied 5% 2% 5% 8% 5% 5% 5% 4%
Smwht satisfied 27 29 27 32 38 24 31 22
Smwht dissatisfied 34 19 26 22 26 21 24 29
Very dissatisfied 34 50 42 37 30 48 40 44
DK/NA 1 - 1 1 1 1 1 1
TREND: In general, how satisfied are you with the way things are going in the nation
today; are you very satisfied, somewhat satisfied, somewhat dissatisfied, or very
dissatisfied?
Very Smwht Smwht Very
sat sat dis dis DK/NA
May 10, 2017 5 28 25 41 1
Apr 19, 2017 7 26 27 38 2
Apr 04, 2017 3 25 27 44 1
Mar 22, 2017 5 26 27 39 2
Mar 07, 2017 6 26 29 37 2
Feb 22, 2017 6 25 28 39 2
Feb 07, 2017 8 24 26 38 3
Jan 26, 2017 6 26 30 36 3
Jan 10, 2017 3 27 35 33 2
Nov 28, 2016 5 22 30 42 2
Link to full trend on website
14. Would you say that Donald Trump - is honest, or not?
WHITE......
COLLEGE DEG
Tot Rep Dem Ind Men Wom Yes No
Yes 33% 73% 9% 28% 39% 28% 31% 44%
No 61 21 88 67 58 65 63 50
DK/NA 5 6 3 5 4 7 6 6
AGE IN YRS.............. WHITE.....
18-34 35-49 50-64 65+ Men Wom Wht NonWht
Yes 22% 31% 37% 43% 44% 32% 38% 22%
No 74 65 56 50 52 60 56 73
DK/NA 4 4 7 7 4 7 6 4

12
TREND: Would you say that Donald Trump is honest, or not?
Yes No DK/NA
May 10, 2017 33 61 5
Apr 19, 2017 37 58 5
Apr 04, 2017 34 61 6
Mar 22, 2017 35 60 5
Mar 07, 2017 39 55 6
Feb 22, 2017 40 55 5
Feb 07, 2017 42 54 3
Jan 26, 2017 39 56 5
Jan 10, 2017 39 53 8
Nov 22, 2016 42 52 6
15. Would you say that Donald Trump - has good leadership skills, or not?
WHITE......
COLLEGE DEG
Tot Rep Dem Ind Men Wom Yes No
Yes 41% 84% 12% 37% 49% 34% 38% 53%
No 56 13 86 59 48 63 58 44
DK/NA 3 4 2 4 3 3 3 3
AGE IN YRS.............. WHITE.....
18-34 35-49 50-64 65+ Men Wom Wht NonWht
Yes 38% 39% 41% 47% 54% 38% 46% 30%
No 60 59 55 49 42 59 51 67
DK/NA 3 2 3 4 3 3 3 3
TREND: Would you say that Donald Trump has good leadership skills, or not?
Yes No DK/NA
May 10, 2017 41 56 3
Apr 19, 2017 40 55 4
Apr 04, 2017 40 55 4
Mar 22, 2017 40 55 5
Mar 07, 2017 47 50 4
Feb 22, 2017 42 55 3
Feb 07, 2017 47 50 4
Jan 26, 2017 49 46 5
Jan 10, 2017 49 44 6
Nov 22, 2016 56 38 6
16. Would you say that Donald Trump - cares about average Americans, or not?
WHITE......
COLLEGE DEG
Tot Rep Dem Ind Men Wom Yes No
Yes 38% 83% 8% 33% 45% 31% 40% 49%
No 59 14 89 64 52 66 58 46
DK/NA 3 3 3 3 3 3 2 5
AGE IN YRS.............. WHITE.....
18-34 35-49 50-64 65+ Men Wom Wht NonWht
Yes 28% 35% 41% 46% 51% 39% 45% 21%
No 67 63 57 51 45 58 52 77
DK/NA 5 2 2 4 4 3 3 2

13
TREND: Would you say that Donald Trump cares about average Americans, or not?
Yes No DK/NA
May 10, 2017 38 59 3
Apr 19, 2017 42 57 2
Apr 04, 2017 39 57 4
Mar 22, 2017 40 57 3
Mar 07, 2017 46 52 3
Feb 22, 2017 44 53 3
Feb 07, 2017 45 52 3
Jan 26, 2017 44 53 3
Jan 10, 2017 44 52 3
Nov 22, 2016 51 45 3
17. Would you say that Donald Trump - is level headed, or not?
WHITE......
COLLEGE DEG
Tot Rep Dem Ind Men Wom Yes No
Yes 29% 69% 6% 24% 33% 26% 25% 38%
No 66 27 90 73 62 70 72 57
DK/NA 5 4 4 2 5 4 3 4
AGE IN YRS.............. WHITE.....
18-34 35-49 50-64 65+ Men Wom Wht NonWht
Yes 16% 27% 34% 40% 35% 29% 32% 22%
No 76 73 62 55 60 68 64 71
DK/NA 8 1 5 5 5 3 4 7
TREND: Would you say that Donald Trump is level headed, or not?
Yes No DK/NA
May 10, 2017 29 66 5
Apr 19, 2017 33 63 4
Apr 04, 2017 29 66 5
Mar 22, 2017 30 66 4
Mar 07, 2017 34 61 5
Feb 22, 2017 33 63 4
Feb 07, 2017 35 60 5
Jan 26, 2017 33 62 5
Jan 10, 2017 33 62 5
Nov 22, 2016 38 57 5
18. Would you say that Donald Trump - is a strong person, or not?
WHITE......
COLLEGE DEG
Tot Rep Dem Ind Men Wom Yes No
Yes 62% 88% 42% 64% 68% 57% 63% 66%
No 35 10 56 33 30 40 34 32
DK/NA 3 1 2 3 2 3 3 2
AGE IN YRS.............. WHITE.....
18-34 35-49 50-64 65+ Men Wom Wht NonWht
Yes 59% 60% 63% 68% 72% 58% 65% 56%
No 38 39 33 30 27 38 33 41
DK/NA 3 1 3 2 2 4 3 3

14
TREND: Would you say that Donald Trump is a strong person, or not?
Yes No DK/NA
May 10, 2017 62 35 3
Apr 19, 2017 61 36 3
Apr 04, 2017 64 33 4
Mar 22, 2017 66 30 4
Mar 07, 2017 67 30 3
Feb 22, 2017 64 32 3
Feb 07, 2017 70 26 3
Jan 26, 2017 68 29 4
Jan 10, 2017 71 25 4
Nov 22, 2016 74 23 3
19. Would you say that Donald Trump - is intelligent, or not?
WHITE......
COLLEGE DEG
Tot Rep Dem Ind Men Wom Yes No
Yes 56% 87% 31% 57% 63% 48% 53% 67%
No 41 12 65 40 33 49 44 31
DK/NA 3 1 4 3 4 3 4 2
AGE IN YRS.............. WHITE.....
18-34 35-49 50-64 65+ Men Wom Wht NonWht
Yes 48% 52% 60% 62% 70% 51% 60% 45%
No 47 47 37 34 27 46 37 50
DK/NA 6 1 3 4 3 3 3 5
TREND: Would you say that Donald Trump is intelligent, or not?
Yes No DK/NA
May 10, 2017 56 41 3
Apr 19, 2017 58 38 4
Apr 04, 2017 60 35 5
Mar 22, 2017 59 36 5
Mar 07, 2017 64 32 4
Feb 22, 2017 58 38 4
Feb 07, 2017 65 31 4
Jan 26, 2017 65 32 3
Jan 10, 2017 68 27 5
Nov 22, 2016 74 21 4
20. Would you say that Donald Trump - is someone who shares your values, or not?
WHITE......
COLLEGE DEG
Tot Rep Dem Ind Men Wom Yes No
Yes 32% 77% 4% 27% 35% 28% 31% 45%
No 64 20 93 69 60 68 64 52
DK/NA 4 3 3 4 5 3 4 3
AGE IN YRS.............. WHITE.....
18-34 35-49 50-64 65+ Men Wom Wht NonWht
Yes 19% 30% 35% 43% 41% 36% 38% 16%
No 74 69 61 53 53 62 58 80
DK/NA 7 1 3 4 5 2 4 4

15
TREND: Would you say that Donald Trump is someone who shares your values, or not?
Yes No DK/NA
May 10, 2017 32 64 4
Apr 19, 2017 35 61 4
Apr 04, 2017 34 61 5
Mar 22, 2017 35 61 4
Mar 07, 2017 38 58 4
Feb 22, 2017 37 60 3
Feb 07, 2017 38 58 4
Link to full trend on website
21. Do you approve or disapprove of the way the news media has covered President Trump?
WHITE......
COLLEGE DEG
Tot Rep Dem Ind Men Wom Yes No
Approve 37% 8% 63% 36% 31% 43% 43% 31%
Disapprove 58 89 30 61 65 52 53 66
DK/NA 5 3 7 2 4 6 4 4
AGE IN YRS.............. WHITE.....
18-34 35-49 50-64 65+ Men Wom Wht NonWht
Approve 30% 38% 40% 39% 31% 42% 37% 38%
Disapprove 63 58 56 57 66 53 59 55
DK/NA 7 4 5 4 3 5 4 7
TREND: Do you approve or disapprove of the way the news media has covered
President Trump?
App Dis DK/NA
May 10, 2017 37 58 5
Mar 07, 2017 41 53 6
Feb 22, 2017 45 50 4
22. Do you approve or disapprove of the way President Trump talks about the media?
WHITE......
COLLEGE DEG
Tot Rep Dem Ind Men Wom Yes No
Approve 31% 69% 3% 29% 38% 25% 28% 41%
Disapprove 65 28 93 69 58 72 69 55
DK/NA 3 3 3 2 4 3 3 4
AGE IN YRS.............. WHITE.....
18-34 35-49 50-64 65+ Men Wom Wht NonWht
Approve 24% 31% 33% 36% 41% 29% 35% 23%
Disapprove 71 68 64 59 55 68 62 74
DK/NA 5 1 3 5 4 3 3 4
TREND: Do you approve or disapprove of the way President Trump talks about the media?
App Dis DK/NA
May 10, 2017 31 65 3
Mar 07, 2017 37 60 3
Feb 22, 2017 35 61 4

16
23. Who do you trust more to tell you the truth about important issues: President Trump
or the news media?
WHITE......
COLLEGE DEG
Tot Rep Dem Ind Men Wom Yes No
Trump 31% 72% 3% 27% 36% 26% 31% 41%
News Media 57 17 91 57 51 63 59 47
DK/NA 12 11 6 16 13 12 10 11
AGE IN YRS.............. WHITE.....
18-34 35-49 50-64 65+ Men Wom Wht NonWht
Trump 20% 28% 32% 43% 41% 31% 36% 17%
News Media 64 60 55 50 48 58 53 67
DK/NA 16 12 12 7 11 11 11 16
TREND: Who do you trust more to tell you the truth about important issues:
President Trump or the news media?
Trump News DK/NA
May 10, 2017 31 57 12
Mar 07, 2017 37 53 10
Feb 22, 2017 37 52 10
24. Do you think Donald Trump is keeping the promises he made during the presidential
election campaign or not?
WHITE......
COLLEGE DEG
Tot Rep Dem Ind Men Wom Yes No
Yes/keeping promises 51% 85% 27% 49% 53% 48% 52% 57%
No 45 12 67 47 42 48 44 38
DK/NA 5 3 5 4 4 5 4 4
AGE IN YRS.............. WHITE.....
18-34 35-49 50-64 65+ Men Wom Wht NonWht
Yes/keeping promises 41% 51% 57% 52% 57% 53% 55% 40%
No 53 47 38 43 38 44 41 54
DK/NA 7 2 4 5 5 3 4 6
TREND: Do you think Donald Trump is keeping the promises he made during the presidential
election campaign or not?
Yes No DK/NA
May 10, 2017 51 45 5
Apr 04, 2017 55 39 6

17
25. Has President Trump accomplished more than you expected in the first 100 days, less
than you expected, or has he accomplished about as much as you expected in the first 100
days?
WHITE......
COLLEGE DEG
Tot Rep Dem Ind Men Wom Yes No
More 17% 27% 7% 18% 17% 16% 15% 21%
Less 30 14 44 29 31 30 25 30
As expected 51 58 46 52 50 51 59 47
DK/NA 2 1 3 1 2 2 2 2
AGE IN YRS.............. WHITE.....
18-34 35-49 50-64 65+ Men Wom Wht NonWht
More 16% 17% 17% 17% 20% 17% 18% 13%
Less 38 34 25 24 30 25 27 38
As expected 45 48 57 54 49 56 53 47
DK/NA 1 - 1 5 1 2 2 2
26. Do you believe that President Trump's first 100 days in office have been: mainly a
success or mainly a failure?
WHITE......
COLLEGE DEG
Tot Rep Dem Ind Men Wom Yes No
Success 38% 84% 7% 34% 44% 33% 37% 51%
Failure 58 13 90 62 52 63 58 44
DK/NA 4 3 3 4 4 4 5 5
AGE IN YRS.............. WHITE.....
18-34 35-49 50-64 65+ Men Wom Wht NonWht
Success 26% 35% 43% 47% 50% 39% 44% 23%
Failure 69 64 53 48 45 56 51 75
DK/NA 4 1 4 5 5 5 5 2
27. If Hillary Clinton had won the 2016 presidential election instead of Donald Trump, do
you think that the country would be in a better place than it is now, a worse place, or
do you think it would be in about the same place as it is now?
WHITE......
COLLEGE DEG
Tot Rep Dem Ind Men Wom Yes No
Better 40% 7% 74% 34% 30% 50% 44% 30%
Worse 33 76 4 28 37 29 33 45
The same 25 16 21 35 30 20 22 23
DK/NA 2 1 2 3 2 2 1 2
AGE IN YRS.............. WHITE.....
18-34 35-49 50-64 65+ Men Wom Wht NonWht
Better 40% 46% 40% 35% 28% 45% 37% 48%
Worse 22 29 38 43 44 35 39 19
The same 35 24 22 19 26 19 22 30
DK/NA 3 1 1 2 2 1 2 4

18
28. If the Democrats had won control of the Senate in the 2016 election instead of the
Republicans, do you think that the country would be in a better place than it is now, a
worse place, or do you think it would be in about the same place as it is now?
WHITE......
COLLEGE DEG
Tot Rep Dem Ind Men Wom Yes No
Better 41% 6% 74% 37% 36% 46% 43% 32%
Worse 27 64 1 26 31 24 30 37
The same 30 28 24 36 31 28 25 31
DK/NA 2 2 1 2 1 2 2 -
AGE IN YRS.............. WHITE.....
18-34 35-49 50-64 65+ Men Wom Wht NonWht
Better 42% 42% 43% 36% 31% 43% 37% 50%
Worse 18 25 30 36 38 30 34 13
The same 36 31 25 27 31 26 28 33
DK/NA 4 2 1 1 - 2 1 4
29. Would you describe the state of the nation's economy these days as excellent, good,
not so good, or poor?
WHITE......
COLLEGE DEG
Tot Rep Dem Ind Men Wom Yes No
Excellent 3% 4% 3% 1% 3% 2% 3% 3%
Good 53 57 47 56 59 47 62 52
Not so good 29 32 30 26 26 32 26 31
Poor 14 6 18 14 12 15 8 13
DK/NA 2 1 2 2 1 3 1 1
AGE IN YRS.............. WHITE.....
18-34 35-49 50-64 65+ Men Wom Wht NonWht
Excellent 3% 1% 1% 5% 3% 2% 3% 3%
Good 41 58 56 54 63 52 57 42
Not so good 34 25 28 30 25 33 29 28
Poor 19 14 13 9 8 12 10 23
DK/NA 2 2 2 1 1 1 1 4
TREND: Would you describe the state of the nation's economy these days as excellent,
good, not so good, or poor?
Not so
Exclnt Good Good Poor DK/NA
May 10, 2017 3 53 29 14 2
Apr 20, 2017 4 49 31 14 2
Apr 04, 2017 4 48 32 13 2
Mar 22, 2017 3 56 28 11 1
Mar 07, 2017 4 51 33 10 2
Feb 22, 2017 5 55 26 12 2
Jan 10, 2017 4 42 34 19 2
Nov 28, 2016 2 37 37 23 1
Link to full trend on website
19
30. Who do you believe is more responsible for the current state of the economy: former
President Obama or President Trump?
WHITE......
COLLEGE DEG
Tot Rep Dem Ind Men Wom Yes No
Obama 58% 55% 61% 61% 59% 57% 65% 57%
Trump 29 38 27 23 29 30 25 34
DK/NA 13 7 12 16 12 13 10 9
AGE IN YRS.............. WHITE.....
18-34 35-49 50-64 65+ Men Wom Wht NonWht
Obama 61% 65% 56% 53% 63% 59% 61% 53%
Trump 20 28 31 37 29 31 30 26
DK/NA 19 7 13 10 8 10 9 21
ECONOMY IS Q29
Exlnt/ NtGood/
Good Poor
Obama 62% 53%
Trump 29 30
DK/NA 9 17
TREND: Who do you believe is more responsible for the current state of the economy:
former President Obama or President Trump?
Obama Trump DK/NA
May 10, 2017 58 29 13
Apr 20, 2017 59 27 14
Apr 04, 2017 66 18 16
Mar 22, 2017 63 22 15
Mar 07, 2017 67 19 14
31. Do you think the nation's economy is getting better, getting worse, or staying about
the same?
WHITE......
COLLEGE DEG
Tot Rep Dem Ind Men Wom Yes No
Better 36% 64% 18% 34% 44% 29% 40% 44%
Worse 21 8 33 19 16 26 17 15
The same 41 27 48 46 39 43 42 40
DK/NA 1 1 1 2 1 2 1 1
AGE IN YRS.............. WHITE.....
18-34 35-49 50-64 65+ Men Wom Wht NonWht
Better 27% 31% 41% 46% 52% 33% 42% 23%
Worse 27 23 20 16 11 20 16 34
The same 45 45 38 36 37 44 41 41
DK/NA 1 1 1 2 - 2 1 2

20
TREND: Do you think the nation's economy is getting better, getting worse, or staying
about the same?
Better Worse Same DK/NA
May 10, 2017 36 21 41 1
Apr 20, 2017 34 16 49 2
Apr 04, 2017 32 16 48 4
Mar 22, 2017 40 16 39 4
Mar 07, 2017 41 15 42 3
Feb 22, 2017 37 15 46 2
Jan 10, 2017 40 14 44 2
Nov 28, 2016 30 24 45 1
Link to full trend on website
32. Would you describe your financial situation these days as excellent, good, not so
good, or poor?
WHITE......
COLLEGE DEG
Tot Rep Dem Ind Men Wom Yes No
Excellent 13% 18% 9% 11% 15% 10% 18% 10%
Good 60 61 63 58 61 60 67 61
Not so good 19 16 19 23 17 21 12 18
Poor 7 4 8 7 6 7 3 9
DK/NA 1 1 1 2 1 2 - 1
AGE IN YRS.............. WHITE.....
18-34 35-49 50-64 65+ Men Wom Wht NonWht
Excellent 6% 14% 14% 16% 17% 11% 14% 9%
Good 64 57 59 61 64 63 64 52
Not so good 22 22 17 16 13 17 15 29
Poor 7 6 9 6 5 7 6 8
DK/NA 1 1 1 1 1 1 1 2
TREND: Would you describe your financial situation these days as excellent, good, not so
good, or poor?
Not so
Exclnt Good Good Poor DK/NA
May 10, 2017 13 60 19 7 1
Apr 20, 2017 13 63 17 7 1
33. Do you approve or disapprove of the way Donald Trump is handling - the economy?
WHITE......
COLLEGE DEG
Tot Rep Dem Ind Men Wom Yes No
Approve 40% 82% 9% 39% 48% 33% 43% 52%
Disapprove 52 11 85 52 45 58 51 40
DK/NA 8 7 6 9 7 9 7 8
AGE IN YRS.............. WHITE.....
18-34 35-49 50-64 65+ Men Wom Wht NonWht
Approve 33% 37% 44% 48% 55% 41% 48% 22%
Disapprove 60 54 49 43 39 51 45 67
DK/NA 8 9 6 9 6 8 7 10

21
TREND: Do you approve or disapprove of the way Donald Trump is handling - the economy?
App Dis DK/NA
May 10, 2017 40 52 8
Apr 19, 2017 42 49 10
Apr 04, 2017 41 48 11
Mar 22, 2017 42 48 10
Mar 07, 2017 49 41 11
Feb 22, 2017 47 41 13
Feb 07, 2017 44 41 14
34. Do you approve or disapprove of the way Donald Trump is handling - foreign policy?
WHITE......
COLLEGE DEG
Tot Rep Dem Ind Men Wom Yes No
Approve 36% 80% 8% 29% 44% 28% 35% 45%
Disapprove 59 14 88 64 51 65 60 48
DK/NA 6 6 4 7 5 6 5 7
AGE IN YRS.............. WHITE.....
18-34 35-49 50-64 65+ Men Wom Wht NonWht
Approve 25% 32% 38% 46% 47% 34% 40% 25%
Disapprove 70 65 54 48 48 59 54 72
DK/NA 5 3 8 6 5 7 6 4
TREND: Do you approve or disapprove of the way Donald Trump is handling - foreign policy?
App Dis DK/NA
May 10, 2017 36 59 6
Apr 19, 2017 40 56 4
Apr 04, 2017 33 58 9
Mar 22, 2017 34 58 7
Mar 07, 2017 38 54 8
Feb 22, 2017 36 56 7
Feb 07, 2017 38 56 6
35. Do you approve or disapprove of the way Donald Trump is handling - terrorism?
WHITE......
COLLEGE DEG
Tot Rep Dem Ind Men Wom Yes No
Approve 45% 87% 13% 44% 53% 37% 43% 57%
Disapprove 48 9 78 48 41 54 50 35
DK/NA 7 4 8 8 6 8 7 7
AGE IN YRS.............. WHITE.....
18-34 35-49 50-64 65+ Men Wom Wht NonWht
Approve 34% 43% 52% 51% 58% 43% 51% 31%
Disapprove 59 52 42 40 36 49 42 62
DK/NA 8 5 6 9 6 8 7 7

22
TREND: Do you approve or disapprove of the way Donald Trump is handling - terrorism?
App Dis DK/NA
May 10, 2017 45 48 7
Apr 19, 2017 44 51 5
Apr 04, 2017 42 49 10
Mar 22, 2017 42 50 8
Mar 07, 2017 45 46 9
Feb 22, 2017 44 49 7
Feb 07, 2017 44 49 7
36. Do you approve or disapprove of the way Donald Trump is handling - immigration
issues?
WHITE......
COLLEGE DEG
Tot Rep Dem Ind Men Wom Yes No
Approve 35% 78% 7% 30% 39% 31% 33% 50%
Disapprove 62 19 91 66 58 66 64 47
DK/NA 3 3 2 3 3 3 3 3
AGE IN YRS.............. WHITE.....
18-34 35-49 50-64 65+ Men Wom Wht NonWht
Approve 21% 33% 43% 44% 46% 37% 42% 19%
Disapprove 75 66 55 52 51 60 56 78
DK/NA 4 2 3 4 3 3 3 3
TREND: Do you approve or disapprove of the way Donald Trump is handling - immigration
issues?
App Dis DK/NA
May 10, 2017 35 62 3
Apr 19, 2017 39 58 2
Apr 04, 2017 39 57 4
Mar 22, 2017 38 60 3
Mar 07, 2017 41 56 3
Feb 22, 2017 40 58 2
Feb 07, 2017 41 56 3
39. Do you approve or disapprove of the way Donald Trump is handling - trade?
WHITE......
COLLEGE DEG
Tot Rep Dem Ind Men Wom Yes No
Approve 38% 76% 9% 37% 44% 32% 39% 47%
Disapprove 49 14 78 50 43 55 51 38
DK/NA 13 10 13 12 12 13 11 15
AGE IN YRS.............. WHITE.....
18-34 35-49 50-64 65+ Men Wom Wht NonWht
Approve 25% 35% 45% 44% 49% 38% 43% 25%
Disapprove 61 54 44 40 39 49 44 62
DK/NA 14 11 11 15 12 13 13 13

23
40. Do you approve or disapprove of the way Donald Trump is handling - the nation's
policy toward Russia?
WHITE......
COLLEGE DEG
Tot Rep Dem Ind Men Wom Yes No
Approve 32% 69% 9% 29% 38% 27% 35% 42%
Disapprove 56 17 82 62 51 61 58 46
DK/NA 11 14 9 10 11 12 7 12
AGE IN YRS.............. WHITE.....
18-34 35-49 50-64 65+ Men Wom Wht NonWht
Approve 19% 33% 36% 42% 45% 33% 38% 18%
Disapprove 65 59 53 48 46 57 52 66
DK/NA 16 8 11 10 9 11 10 15
TREND: Do you approve or disapprove of the way Donald Trump is handling - the nation's
policy toward Russia?
App Dis DK/NA
May 10, 2017 32 56 11
Apr 19, 2017 37 55 9
Apr 05, 2017 30 56 15
Mar 24, 2017 27 59 14
Mar 08, 2017 32 54 14
Feb 22, 2017 31 57 13
41. Do you approve or disapprove of the way Donald Trump is handling - the nation's
policy toward North Korea?
WHITE......
COLLEGE DEG
Tot Rep Dem Ind Men Wom Yes No
Approve 44% 82% 15% 45% 53% 36% 43% 57%
Disapprove 48 13 77 47 40 55 51 37
DK/NA 7 6 8 8 6 8 6 7
AGE IN YRS.............. WHITE.....
18-34 35-49 50-64 65+ Men Wom Wht NonWht
Approve 35% 42% 50% 51% 58% 43% 50% 30%
Disapprove 56 53 42 40 37 50 43 60
DK/NA 9 5 7 9 5 8 6 10
TREND: Do you approve or disapprove of the way Donald Trump is handling - the nation's
policy toward North Korea?
App Dis DK/NA
May 10, 2017 44 48 7
Apr 19, 2017 45 42 13

24
76. As president, do you think Donald Trump should continue tweeting from his personal
Twitter account, or not?
WHITE......
COLLEGE DEG
Tot Rep Dem Ind Men Wom Yes No
Yes/Should 33% 48% 20% 33% 40% 26% 29% 38%
No 61 43 74 63 55 67 67 55
DK/NA 6 8 7 4 6 6 5 7
AGE IN YRS.............. WHITE.....
18-34 35-49 50-64 65+ Men Wom Wht NonWht
Yes/Should 31% 32% 32% 33% 41% 26% 33% 32%
No 64 63 62 59 53 68 61 62
DK/NA 5 5 6 9 6 7 6 6
TREND: As president, do you think Donald Trump should continue tweeting from his personal
Twitter account, or not?
Yes No DK/NA
May 10, 2017 33 61 6
Apr 19, 2017 28 68 4
77. How often do you think that President Trump and his administration make statements
without evidence to support them: very often, somewhat often, not so often, or not often
at all?
WHITE......
COLLEGE DEG
Tot Rep Dem Ind Men Wom Yes No
Very often 52% 13% 80% 55% 47% 57% 55% 42%
Smwht often 25 36 15 26 30 20 23 32
Not so often 14 33 1 10 13 14 12 17
Not often at all 6 11 2 6 6 5 6 6
DK/NA 4 7 2 2 3 5 4 4
AGE IN YRS.............. WHITE.....
18-34 35-49 50-64 65+ Men Wom Wht NonWht
Very often 54% 54% 53% 48% 42% 54% 49% 61%
Smwht often 23 23 22 30 34 22 28 17
Not so often 15 15 13 13 14 14 14 12
Not often at all 4 5 8 5 6 5 6 5
DK/NA 4 3 4 5 3 4 4 4
TREND: How often do you think that President Trump and his administration make statements
without evidence to support them: very often, somewhat often, not so often, or not often
at all?
Very Smwht NotSo NotOftn
Often Often Often AtAll DK/NA
May 10, 2017 52 25 14 6 4
Apr 04, 2017 48 25 15 9 3
Mar 22, 2017 52 21 16 8 3

25
78. Does the election of Donald Trump make you feel more safe, less safe, or just as safe
as you did before?
WHITE......
COLLEGE DEG
Tot Rep Dem Ind Men Wom Yes No
More safe 24% 60% 3% 20% 27% 21% 27% 31%
Less safe 53 12 84 53 44 61 56 38
Just as safe 23 28 13 27 29 17 17 31
DK/NA - - - - - 1 - -
AGE IN YRS.............. WHITE.....
18-34 35-49 50-64 65+ Men Wom Wht NonWht
More safe 12% 24% 27% 33% 32% 26% 29% 13%
Less safe 58 55 51 46 37 55 47 67
Just as safe 30 20 22 20 30 18 24 20
DK/NA - - - 1 - 1 - -
TREND: Does the election of Donald Trump make you feel more safe, less safe, or just as
safe as you did before?
More Less JustAs
Safe Safe Safe DK/NA
May 10, 2017 24 53 23 -
Apr 19, 2017 28 52 19 1
Apr 04, 2017 27 48 24 1
Mar 22, 2017 27 52 20 1
Mar 08, 2017 28 49 23 -
Feb 23, 2017 27 51 21 1
Feb 08, 2017 33 50 16 1
Jan 26, 2017 28 45 26 1
Jan 10, 2017 27 45 27 1
Nov 22, 2016 29 39 32 1