usage analysis of the nist internet time servicethe internet time service (its)at the national...
TRANSCRIPT
Volume 121 (2016) http://dx.doi.org/10.6028/jres.121.003 Journal of Research of the National Institute of Standards and Technology
33
Usage Analysis of the NIST Internet Time Service
Jeff A. Sherman1 and Judah Levine1,2
1National Institute of Standards and Technology, Boulder, CO 80305
2JILA, University of Colorado, Boulder, CO 80309
[email protected] [email protected]
The Internet Time Service (ITS) at the National Institute of Standards and Technology (NIST) currently receives over 16 billion time requests per day. ITS servers derive their system time from the NIST atomic-referenced time scale and distribute it freely to the public. Here we explore ITS usage patterns discovered by analysis of inbound network traffic. For example, over a period of four weeks, just two of the ≈ 20 ITS servers received requests from 316 million unique Internet Protocol (IPv4) addresses, which is at least 8.5 % of the entire Internet. We offer recommendations for networked device/software manufacturers, and providers and consumers of network time services.
Key words: internet time service; network time protocol (NTP); time transfer.
Accepted: February 23, 2016
Published: March 8, 2016
http://dx.doi.org/10.6028/jres.121.003
1. Overview
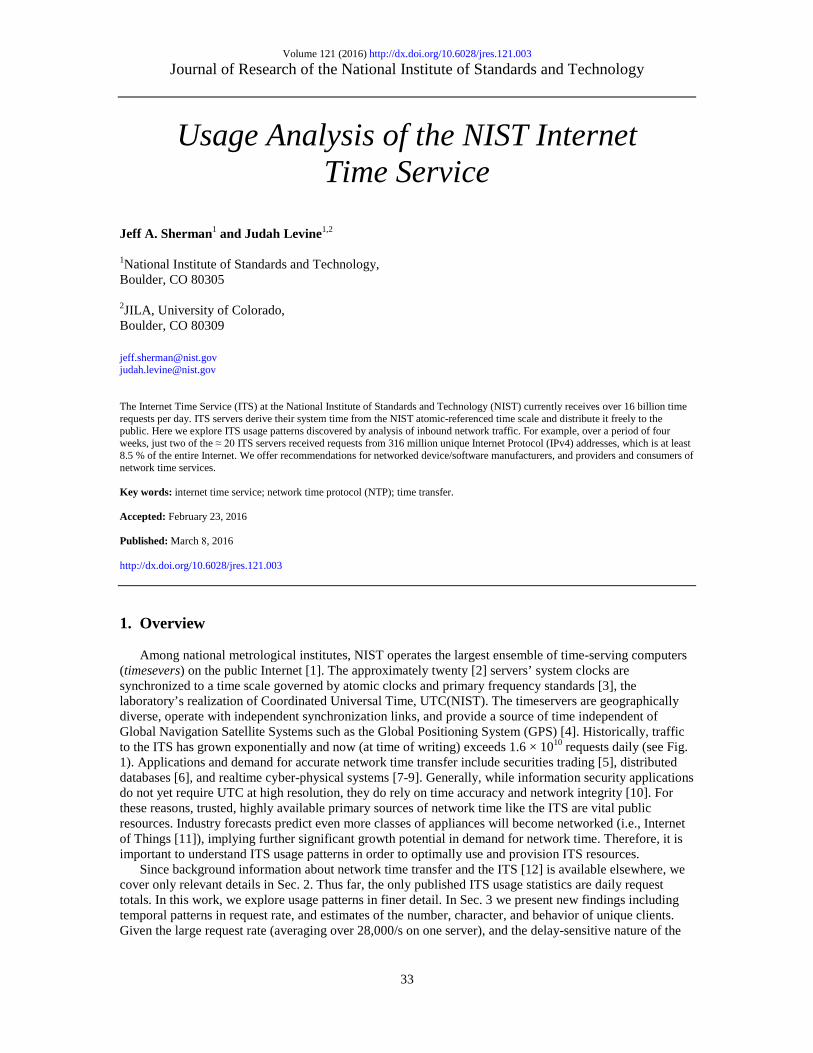
Among national metrological institutes, NIST operates the largest ensemble of time-serving computers(timesevers) on the public Internet [1]. The approximately twenty [2] servers’ system clocks are synchronized to a time scale governed by atomic clocks and primary frequency standards [3], the laboratory’s realization of Coordinated Universal Time, UTC(NIST). The timeservers are geographically diverse, operate with independent synchronization links, and provide a source of time independent of Global Navigation Satellite Systems such as the Global Positioning System (GPS) [4]. Historically, traffic to the ITS has grown exponentially and now (at time of writing) exceeds 1.6 × 10¹⁰ requests daily (see Fig. 1). Applications and demand for accurate network time transfer include securities trading [5], distributed databases [6], and realtime cyber-physical systems [7-9]. Generally, while information security applications do not yet require UTC at high resolution, they do rely on time accuracy and network integrity [10]. For these reasons, trusted, highly available primary sources of network time like the ITS are vital public resources. Industry forecasts predict even more classes of appliances will become networked (i.e., Internet of Things [11]), implying further significant growth potential in demand for network time. Therefore, it is important to understand ITS usage patterns in order to optimally use and provision ITS resources. Since background information about network time transfer and the ITS [12] is available elsewhere, we cover only relevant details in Sec. 2. Thus far, the only published ITS usage statistics are daily request totals. In this work, we explore usage patterns in finer detail. In Sec. 3 we present new findings including temporal patterns in request rate, and estimates of the number, character, and behavior of unique clients. Given the large request rate (averaging over 28,000/s on one server), and the delay-sensitive nature of the
Volume 121 (2016) http://dx.doi.org/10.6028/jres.121.003 Journal of Research of the National Institute of Standards and Technology
34 http://dx.doi.org/10.6028/jres.121.003
Fig. 1. a) Daily request rate (averaged weekly) to NIST’s Internet Time Service over nearly two decades of operation. The growth is not well described by a single exponential rate. A red-dashed line illustrates a doubling interval of 3.4 years, obtained by a least-squares fit over the most recent 3000 days. b) On a logarithmic scale, we separately plot Network Time Protocol (blue) and other protocol (DAYTIME, TIME; red) request rates. application, the information capture process had to be fast, non-blocking, and stable; a description of methodology follows in Sec. 4. In Sec. 5 we make data-driven recommendations to consumers and providers of network time, and note how the same technology used in this study can be leveraged to help mitigate abusive traffic loads. 2. Introduction Time transfer over the Internet is most often accomplished using the Network Time Protocol (NTP) [13, 14] in a client/server mode. NTP messages are terse; requests and replies consist of 48 byte payloads in connectionless User Datagram Protocol (UDP) packets [15] (normally 90 bytes in total). An interaction begins when client software sends a request to an ITS timeserver. The client uses the server’s reply, along with the measured interval between request transmission and reply reception (round trip delay) to infer offset- and rate-corrections to the local clock. The ITS supports two other legacy message formats, known as DAYTIME [16] and TIME [17], which account for fewer than 3 % of requests. Disadvantages of these include increased resource overhead due to use of the Transport Control Protocol (TCP) [15], no in-band estimation of round-trip delay [18], decreased timestamp resolution, no cryptographic authentication option [19], and no metadata for preventing synchronization ‘loops’ among peers. Prior to this study we expected that the majority of ITS clients would generally adhere to the following important conventions in network time transfer:
1. Clients should not use the ITS for on-demand network timestamps; rather they should optimally discipline their local clock’s offset and rate [14].
2. Transport asymmetry between request and reply on the public Internet is a dominant noise source [20]; in many algorithms this effect makes local clock synchronization worse if the client polls too

Volume 121 (2016) http://dx.doi.org/10.6028/jres.121.003 Journal of Research of the National Institute of Standards and Technology
35 http://dx.doi.org/10.6028/jres.121.003
frequently. Therefore, clients should dynamically adjust their polling frequency according to observed noise levels.
3. Clients on a local area network (LAN) should organize hierarchically, whereby a small fraction query the ITS and propagate their synchronized time to downstream peers. Downstream clients do not suffer in this arrangement because network delay over LANs is often orders-of-magnitude lower than public Internet routes. In the jargon of NTP, hosts physically connected to a time standard are assigned a stratum number s = 1, and all direct clients of a stratum s server are stratum s + 1, forming a hierarchy.
Software packages such as ntpd (part of the NTP reference implementation [21]), chrony [22], and openntpd [23] generally adhere to these guidelines by default (others in early development, like ntimed [24], may as well) 1. However, data presented here demonstrate that a significant fraction of ITS clients are not doing so. 3. New Results For four weeks, we collected data on a single ITS timeserver thought to be typical, A. In a second month, we simultaneously studied two timeservers, A and B. For each inbound request, we recorded a timestamp, the requesting client’s IPv4 (Internet Protocol, version 4) address, and during the second month only, the request’s UDP or TCP port numbers. Certain other data (including full packet captures) were collected irregularly; further details are left to Sec. 4. 3.1 Temporal Patterns in Traffic/Protocols Figure 2a depicts intra-day variation in ITS requests. The dominant fluctuations are intense request bursts, almost an order-of-magnitude above average in size, synchronous with every UTC hour and half-hour, an effect present but smaller in a study by the US Naval Observatory [25]. A detailed examination (Fig. 2b) shows qualitatively different behaviors between two classes of NTP client. Requests with a UDP source port number 123 (typical of ntpd software running in its default mode) are more likely to correlate (by factors of two to three above average) on a 00:05 minute (UTC) schedule. NTP requests bearing other source port numbers exhibit bursts, about 50 % above average, synchronized to each UTC minute. It is not straightforward to map client software to port numbers alone (see Sec. 4), but this observed behavior is inconsistent with the reference NTP client implementation. Table 1 summarizes the request and traffic loads in terms of data throughput, and relative share of each protocol.
Fig. 2. a) ITS request rates as a function of time of day; the plot shows an average of 28 days. Dominating any diurnal variation are bursts of requests upon each UTC hour and half-hour. b) Typical time-series of request rates separated by protocol, with one point plotted per second on a logarithmic scale. MJD is the modified Julian date. Distinct behavior is observed between NTP requests using UDP source port 123 (higher request bursts on a 5-minute period) and other port numbers (regular bursts synchronous with every UTC minute).
1 Certain commercial equipment, instruments, or materials are identified in this paper to foster understanding. Such identification does not imply recommendation or endorsement by the National Institute of Standards and Technology, nor does it imply that the materials or equipment identified are necessarily the best available for the purpose.

Volume 121 (2016) http://dx.doi.org/10.6028/jres.121.003 Journal of Research of the National Institute of Standards and Technology
36 http://dx.doi.org/10.6028/jres.121.003
Table 1. Request rate and ITS resource use. Though representing a small fraction of requests, the legacy protocols require roughly three times the network load per transaction. Due to abuse mitigation, not all requests receive replies. The 95th percentile throughput statistic represents traffic volume averaged over 5-minute intervals. Throughput estimates (Mbps is megabits-per-second) exclude transport overheads (e.g., Ethernet framing) which are significant for small packets, and auxiliary ITS network traffic such as leap-second file dissemination.
Server A B Average request rate (per second) 6368 28254 Standard deviation of rate (per second) 1773 2847 Maximum request rate (per second) 67340 96277 Median data throughput (Mbps) 9.5 39.2 95th percentile throughput (Mbps) 12.7 44.0 Fraction of requests: NTP 95.2 % 99.4 % Fraction of requests: DAYTIME 3.1 % 0.2 % Fraction of requests: TIME 1.7 % 0.3 % Fraction of NTP from UDP port 123 17.0 % 11.5 % NTP as fraction of network load 87.8 % 98.5 %
3.2 Client Census Table 2 summarizes the count of unique IPv4 addresses observed during the study. The union of addresses observed during month 2 on servers A and B was approximately 316 million. There are 232 ≈ 4.295 billion possible IPv4 addresses, about 3.702 billion of which are routable on the public Internet due to various assignments and definitions made by the Internet Engineering Task Force and the Internet Assigned Numbers Authority [28]. Therefore, over a single month, the two study servers together observed requests from at least 8.5 % of the Internet. Alternatively, these observed addresses correspond to 11.5 % of addresses present in a free commercial GeoIP database (see Sec. 3.3). We observed requests from approximately 30 % of routable /24 subnets, 62 % of routable /16 subnets, and all but two routable /8 subnets (in this common notation, known as Classless Inter-domain Routing, a /k subnet is a contiguous block of 232−k IPv4 addresses, e.g. a /24 subnet contains 28 = 256 IPv4 addresses varying only in the least significant bits). Figure 3 illustrates the census of observed clients on a ‘map’ of the IPv4 Internet. Figure 4 shows the ‘per-capita’ request rates summed over subnets of size /8 and /16. Ideally, tallies of IPv4 addresses would correspond to unique users or at least unique client machines, but common network practices confound such identification [29]. Many internet service providers assign subscribers IPv4 addresses dynamically, such that a given client machine may change IPv4 addresses several times during the study month. An effect with the opposite bias is the practice of Network Address Translation (NAT), whereby several clients on a LAN share a single public IPv4 address. Translation of IPv6 traffic onto the IPv4 network is another NAT-like effect masking unique users. NAT also mutates UDP/TCP port numbers, confounding attempts to understand client software configurations. Finally, while some clients are configured to poll particular ITS timeservers, many use the globally load-balanced address time.nist.gov, which maps dynamically to the full server ensemble through a domain name system (DNS) weighted round-robin scheme [30]. Due to DNS caching, clients tend to ‘stick’ to server addresses after resolving time.nist.gov. Table 2. Count of unique client IPv4 addresses on the two study servers, A and B over study months 1 and 2. The intersection A∩B and union A∪B represent the count of IPv4 addresses observed on both/either server, respectively, during month 2.
Server A Server B Month 1 2 2 Unique IPv4 addresses 220,049,239 232,922,423 202,430,796 Fraction observed exactly once 25.5 % 25.6 % 26.2 % Month 2, A∩B 119,562,948 Month 2, A∪B 315,790,271

Volume 121 (2016) http://dx.doi.org/10.6028/jres.121.003 Journal of Research of the National Institute of Standards and Technology
37 http://dx.doi.org/10.6028/jres.121.003
Fig. 3. We observed a large fraction of the entire internet as ITS clients. Each pixel represents 1,024 IPv4 addresses (a /22 subnet), the color of which indicates the fraction observed as ITS clients of servers A or B during month 2. Blocks are bordered and labeled approximately by top-level allocation [26]; various reserved subnets are highlighted with gray shading. Addresses are arranged to keep consecutive subnets of all sizes in close proximity. Visualization tool: ipv4-heatmap [27].

Volume 121 (2016) http://dx.doi.org/10.6028/jres.121.003 Journal of Research of the National Institute of Standards and Technology
38 http://dx.doi.org/10.6028/jres.121.003
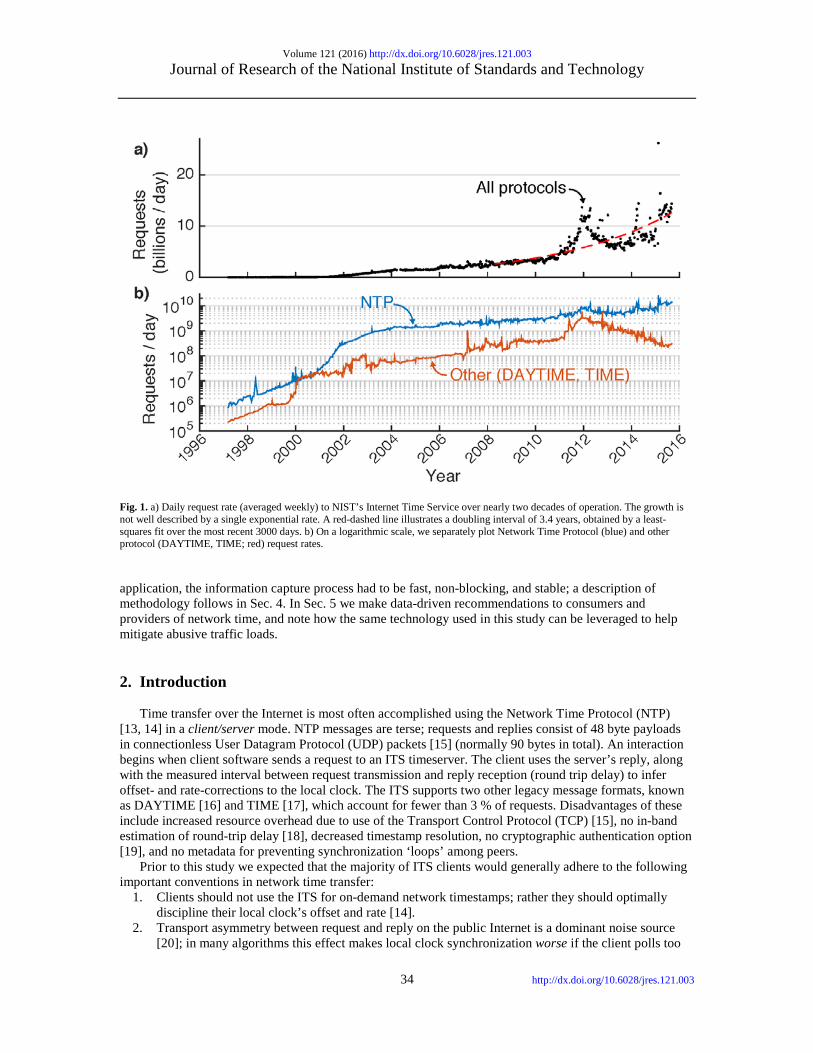
Fig. 4. To visualize the relative intensity distribution of request rates and user densities across different networks, we plot the number of requests observed vs. the number of unique requesting addresses grouped into the 221 observed /8 subnets (red open circles), and 35,145 observed /16 subnets (blue points). The black solid line represents a minimum count of one request per IPv4 in a subnet. The black dashed line illustrates one request per IPv4 address per hour: an approximately representative trend. We note that there is insufficient information in NTP request packets to unambiguously identify a requester’s operating system, hardware type, or exact NTP client software. Some useful information might be present in the case of clients using a source UDP port other than 123, since in many cases operating systems assign so-called ephemeral 16-bit port numbers from particular subsets of the full range. For example, many Linux kernels reportedly use the range 32768 through 61000. Figure 5 shows the distribution of UDP source port numbers in the NTP requests collected during study month 2. We do not attempt a quantitative analysis of this data to infer operating system, device-type, or client software distribution, because we lack detailed knowledge of diverse operating system behaviors, and because we fear a large portion of the data is likely mutated by NAT or similar network practices. Acknowledging these caveats, we describe protocol use per unique IPv4 address in Table 3. We see some significant variation between the two servers: clients of B appear more likely use the DAYTIME protocol and to emit NTP requests from UDP port 123. Many clients using legacy protocols also use NTP.
Volume 121 (2016) http://dx.doi.org/10.6028/jres.121.003 Journal of Research of the National Institute of Standards and Technology
39 http://dx.doi.org/10.6028/jres.121.003
Fig. 5. a) The distribution of observed UDP source port numbers in NTP requests during month 2; b) shows a detailed, re-scaled view of the lower port numbers. For port numbers other than the ntpd default of 123, some correlation with operating system or client software exists, but is not unambiguous or straightforward. Certain features are highlighted with decimal or hexadecimal tick labels. A red line depicts a uniformly random distribution.

Volume 121 (2016) http://dx.doi.org/10.6028/jres.121.003 Journal of Research of the National Institute of Standards and Technology
40 http://dx.doi.org/10.6028/jres.121.003
Table 3. Breakdown of protocol use by unique IPv4 addresses during study month 2.
Server A B Fraction of unique IPv4... using NTP 98.4 % 96.2 % using DAYTIME 1.1 % 5.9 % using TIME 2.8 % 3.0 % using NTP and one other 2.2 % 5.1 % using all three protocols 0.1 % 0.1 % using DAYTIME only 0.5 % 3.0 % using TIME only 1.1 % 0.8 % Fraction of NTP-using IPv4... from port ≠123 only 93.3 % 73.6 % from port =123 only 3.0 % 12.8 % from both port types 3.7 % 13.5 %
How often do clients poll the ITS? We propose two simple constructions for analyzing a client’s average polling interval. The first measure, suited to describing ‘persistent’ clients, is defined by
total1
requests
( ) = ,( )
TT a
N a (1)
where total 28T ≈ days is the duration of data collection and requests ( ) > 1N a is the number of requests logged for IPv4 address a. The second method, better suited for describing ‘ephemeral’ clients seen only for brief intervals, is defined as
2requests
( ) ( ) 1( ) = ,
( )f it a t a
T aN a
− + (2)
where ( )ft a and ( )it a are the latest and earliest request timestamps (integers, in seconds) recorded for address a in month 2. Figure 6 shows a histogram of these polling periods. To match the long-standing tradition of ntpd querying at intervals equal to integer power-of-2 seconds, we bin observations by nearest integer ( )2= round ( /1s)logi ip T for methods = 1,2i (the +1 in the numerator of Eq. (2) ensures that the logarithm exists). A common default configuration in ntpd allows 16 1 10(64 s 1024 s).p T≤ ≤ ≤ ≤ A persistent period 1 < 2p constitutes an abuse of ITS terms of service. Many popular client implementations employ ‘burst-on-startup’ features, whereby 4≈ initial requests occur rapidly. Such transitory bursts do not necessarily constitute abusive behavior, but may trigger reply-limiting logic in ITS systems. Observed artifacts of these startup-bursts are annotated in Fig. 6. The general trend in persistent polling periods is a roughly exponential distribution; perhaps surprisingly, no large surplus is observed in the range
16 10p≤ ≤ . 3.3 Correlations with GeoIP GeoIP databases correlate IPv4 addresses with additional information about operators or service providers: registering country or region, geographic locale (e.g., city), or autonomous system (AS) identifying a routing entity in the border gateway protocol (BGP) [31]. Servers A and B observed requests corresponding to 244 of the 250 countries/regions, and from at least 71 % of the 49,826 ASs defined in a free commerical GeoIP database [32]. The database entries covered 2.74 billion IPv4 addresses; only 0.01 % of observed IPv4 addresses had no entry in the database.

Volume 121 (2016) http://dx.doi.org/10.6028/jres.121.003 Journal of Research of the National Institute of Standards and Technology
41 http://dx.doi.org/10.6028/jres.121.003
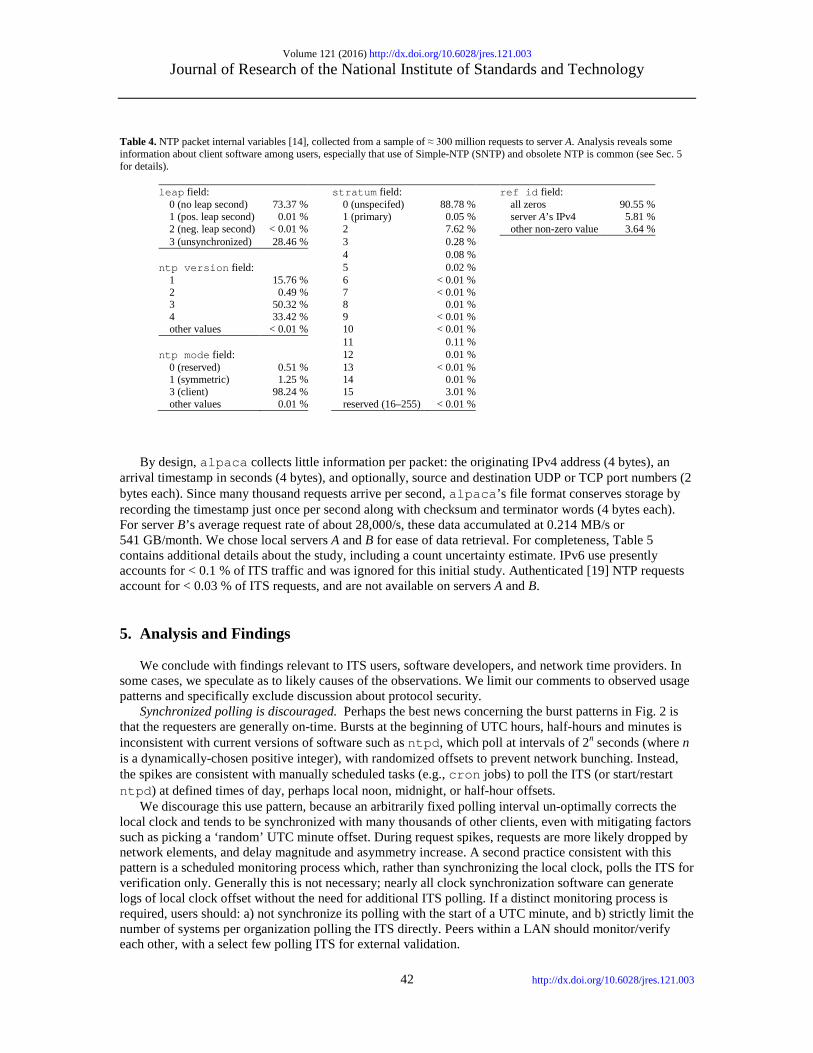
Fig. 6. Observed average client ITS polling intervals, defined heuristically assuming ‘persistent’ clients T1 (Eq. (1)) or ‘ephemeral’ clients T2 (Eq. (2)) during month 2. We follow a ntpd configuration convention, logarithmically binning Ti results into integers pi = round(log2 Ti), where Ti have units of seconds. We plot the cumulative distribution function (CDF) of addresses having a given pi or lower, and separately on the right, the fraction of IPv4 addresses observed with exactly one request during month 2. Characteristic intervals are labeled along the top axis for convenience. 4. Methodology For data collection, we authored a relatively simple program called alpaca (‘a lightweight packet capturer’) [33], making use of the network packet capture library libpcap [34] and the BSD packet filter module bpf [35]. alpaca only performs data collection and compression; analysis occurs offline. Gathering network traffic information this way has several advantages. First, no modification or processing is added to the software responsible for the NTP and legacy protocol services. Second, the extra processing occurs on separate threads and packet queues, decoupling asynchronous delays. Third, bpf already specifies a precise and efficient packet filter description language and is compatible with high packet input/output rates. The extra CPU-load measured ≤ 0.01 % except during periods of logfile compression, which occurred hourly on a separate low-priority thread. By comparison, the average NTP service CPU load was approximately 15 %. From independent tests using bpf as a firewall filter, added latency per incoming packet was ≤ 1 µs. We performed other statistical tests using the packet capture software tcpdump [35], including validation of alpaca and inspection of NTP packet content (see Table 4 and Fig. 7).
Volume 121 (2016) http://dx.doi.org/10.6028/jres.121.003 Journal of Research of the National Institute of Standards and Technology
42 http://dx.doi.org/10.6028/jres.121.003
Table 4. NTP packet internal variables [14], collected from a sample of ≈ 300 million requests to server A. Analysis reveals some information about client software among users, especially that use of Simple-NTP (SNTP) and obsolete NTP is common (see Sec. 5 for details).
leap field: stratum field: ref id field: 0 (no leap second) 73.37 % 0 (unspecifed) 88.78 % all zeros 90.55 % 1 (pos. leap second) 0.01 % 1 (primary) 0.05 % server A’s IPv4 5.81 % 2 (neg. leap second) < 0.01 % 2 7.62 % other non-zero value 3.64 % 3 (unsynchronized) 28.46 % 3 0.28 % 4 0.08 % ntp version field: 5 0.02 % 1 15.76 % 6 < 0.01 % 2 0.49 % 7 < 0.01 % 3 50.32 % 8 0.01 % 4 33.42 % 9 < 0.01 % other values < 0.01 % 10 < 0.01 % 11 0.11 % ntp mode field: 12 0.01 % 0 (reserved) 0.51 % 13 < 0.01 % 1 (symmetric) 1.25 % 14 0.01 % 3 (client) 98.24 % 15 3.01 % other values 0.01 % reserved (16–255) < 0.01 %
By design, alpaca collects little information per packet: the originating IPv4 address (4 bytes), an arrival timestamp in seconds (4 bytes), and optionally, source and destination UDP or TCP port numbers (2 bytes each). Since many thousand requests arrive per second, alpaca’s file format conserves storage by recording the timestamp just once per second along with checksum and terminator words (4 bytes each). For server B’s average request rate of about 28,000/s, these data accumulated at 0.214 MB/s or 541 GB/month. We chose local servers A and B for ease of data retrieval. For completeness, Table 5 contains additional details about the study, including a count uncertainty estimate. IPv6 use presently accounts for < 0.1 % of ITS traffic and was ignored for this initial study. Authenticated [19] NTP requests account for < 0.03 % of ITS requests, and are not available on servers A and B. 5. Analysis and Findings We conclude with findings relevant to ITS users, software developers, and network time providers. In some cases, we speculate as to likely causes of the observations. We limit our comments to observed usage patterns and specifically exclude discussion about protocol security. Synchronized polling is discouraged. Perhaps the best news concerning the burst patterns in Fig. 2 is that the requesters are generally on-time. Bursts at the beginning of UTC hours, half-hours and minutes is inconsistent with current versions of software such as ntpd, which poll at intervals of 2n seconds (where n is a dynamically-chosen positive integer), with randomized offsets to prevent network bunching. Instead, the spikes are consistent with manually scheduled tasks (e.g., cron jobs) to poll the ITS (or start/restart ntpd) at defined times of day, perhaps local noon, midnight, or half-hour offsets. We discourage this use pattern, because an arbitrarily fixed polling interval un-optimally corrects the local clock and tends to be synchronized with many thousands of other clients, even with mitigating factors such as picking a ‘random’ UTC minute offset. During request spikes, requests are more likely dropped by network elements, and delay magnitude and asymmetry increase. A second practice consistent with this pattern is a scheduled monitoring process which, rather than synchronizing the local clock, polls the ITS for verification only. Generally this is not necessary; nearly all clock synchronization software can generate logs of local clock offset without the need for additional ITS polling. If a distinct monitoring process is required, users should: a) not synchronize its polling with the start of a UTC minute, and b) strictly limit the number of systems per organization polling the ITS directly. Peers within a LAN should monitor/verify each other, with a select few polling ITS for external validation.

Volume 121 (2016) http://dx.doi.org/10.6028/jres.121.003 Journal of Research of the National Institute of Standards and Technology
43 http://dx.doi.org/10.6028/jres.121.003
Fig. 7. Cumulative distribution functions (CDFs) of NTP packet internal variables [14], collected from a sample of ≈ 300 million requests to server A (with version 3 or 4). While the ITS ignores these values, they offer a perspective on client (mis-configurations. a) poll and precision fields are 8-bit signed integers n representing quantities 2n in seconds. In b), we highlight the majority of requests on a linear scale; un-plotted values were never observed in the sample. poll should declare a client’s persistent polling interval p1 = round(log2 T1) (T1 in units of seconds; see Eq. (1)), but many clients apparently fix poll to 0 or 4. A small population exhibits varied but implausibly small poll < 0 or large poll > 32 values. The precision field should be a client’s estimated resolution or statistical noise in reading its system clock. We observe large precision values −6 or 0 for many clients. A small population exhibits implausibly small or large values precision ≤ −32, precision > 0. For context, a resolution of a few microseconds typical of modern systems should yield a precision of about −18. c) The root-delay field should represent the measured round-trip network delay between a client and its ultimate stratum-1 reference. root-dispersion should characterize reference clock noise as observed by a client. These quantities are transported as 16-bit unsigned whole integers and 16-bit fixed-point fractions of seconds. As discussed in Sec. 5, the fact that large populations fix these parameters to either 0 s or 1 s implies Simple-NTP (SNTP) is favored over strict NTP.

Volume 121 (2016) http://dx.doi.org/10.6028/jres.121.003 Journal of Research of the National Institute of Standards and Technology
44 http://dx.doi.org/10.6028/jres.121.003
Table 5. Details about the two servers studied. Here, ε is the approximate fraction of total ITS requests (at the time, ≈ 12.5 billion daily) each server received during the study intervals. Ttimestamps is the number of integer second timestamps for which any data was recorded; Tmissing is the number of ‘gaps’, or timestamps not recorded due to a buffer overflow or other error. Ncaptured is the total number of requests recorded; in month 1 we recorded NTP only. For TCP requests, only the initiating SYN packet is counted. Ndropped is a parameter reported by libpcap: the number of packets dropped by the kernel interface. The undercounting rate lies between the larger of ηT and ηN (defined below), and their sum, depending on how often these loss mechanisms coincided. We know of no over-counting bias.
Server A Server B Hostname time-a.timefreq.bldrdoc.gov utcnist2.colorado.edu IPv4 address 132.163.4.101 128.138.141.172 ITS load fraction ε 5 % 19 % Collection interval Month 1 Month 2 Month 2 Earliest record (UTC) 12-Mar-2015 20:10:03 7-May-2015 20:58:46 7-May-2015 20:58:46 Last record (UTC) 8-Apr-2015 20:21:14 4-Jun-2015 20:58:45 4-Jun-2015 20:58:46 Nominal duration 28 days 28 days 28 days Ttimestamps (seconds) 2,419,748 2,419,094 2,417,584 Tmissing (seconds) 119 106 1617 ηT = Tmissing/Ttimestamps 0.49 % 0.44 % 6.69 % Ncaptured (requests) 15,200,578,867 15,405,012,792 68,305,545,881 Ndropped (requests) 246,243 320,481 9,411,446 Approx. average daily requests 543 million 550 million 2,440 million ηN = Ndropped/Ncaptured 0.16 % 0.21 % 1.38 % η = ηT + ηN 0.65 % 0.65 % 8.07 %
Use of obsolete NTP and SNTP is common. Table 4 shows that a majority of sampled NTP requests exhibit a version below the current value, 4. While the message format is unchanged from version 3, the synchronization servo is much improved in later versions. Also, it is likely that security issues [10, 36] will be remedied only for current clients. Simple-NTP (SNTP) [14] shares NTP’s messaging format but implements fewer features, such as use of the stratum distribution model; popular implementations include sntp and ntpdate [21]. Inspection of request packet variables imply widespread use of SNTP: about 90 % of requests have ref-id [14] or stratum fields set to 0 (see Table 4), and about half have poll, precision, root-delay, and root-dispersion fields set to 0 (see Fig. 7). Another large cohort fixes root-delay, and root-dispersion at 1 s. This is further evidence that many clients, likely SNTP-based, are not making use of the hierarchy model of NTP time distribution and are therefore sub-optimally consuming ITS resources. Generally, clients are non-abusive. Figure 6 shows that even with common ‘burst-on-startup’ features, over 90 % of unique IPv4 addresses poll a server with an average period of T2 ≥ 512 s. On a persistent basis, over 99 % of client addresses exhibit T1 ≥ 512 s. Clearly abusive persistent traffic rates, with T1 ≤ 1 s, originate from 10−6 to 10−5 of observed addresses. These facts mean that address lookup tables for ITS abuse mitigation algorithms need not be very large. Migration from legacy protocols is encouraged. The present work confirms that legacy protocols represent a small and decreasing fraction of ITS requests. The DAYTIME protocol contains one useful datum not in NTP: a count of days before transitions to and from Daylight Saving Time (DST) in the United States. Clients who make use of this information should limit their DAYTIME polling to once per day. In cases where legacy systems require frequent DAYTIME responses, clients should implement local DAYTIME servers on their LAN. Many ITS clients per organization is discouraged. During analysis, we noticed thousands of instances of ≥ 250 addresses sharing the first three IPv4 octets (i.e., almost all hosts in a /24 subnet) polling an ITS server persistently. Such behavior is strongly discouraged; one or a few client machines should poll ITS timeservers and relay their results to downstream clients, as prescribed in NTP’s stratum model. Hypothetically, future ITS terms of service might limit access to logical blocks of IPv4 or IPv6 addresses which cumulatively exhibit high request rates. Polite polling of more than one ITS server is encouraged. About half of IPv4 addresses were observed to poll both servers A and B. This is due in part to recommended client use of the DNS load-balanced

Volume 121 (2016) http://dx.doi.org/10.6028/jres.121.003 Journal of Research of the National Institute of Standards and Technology
45 http://dx.doi.org/10.6028/jres.121.003
hostname time.nist.gov. For critical applications, there is good reason to diversify the stratum-1 timeservers to which one refers. Each stratum-1 server generally has a single connection to an atomic clock and no other time reference. Occasional hardware failures can temporarily steer a stratum-1 system clock erroneously. In contrast, a stratum-2 system using several independent stratum-1 references can detect and mitigate these errors when their magnitudes rise above network noise and system clock jitter. However, we strongly recommend that any client concurrently polling multiple ITS servers adhere to a hierarchy model within an organization. Packet filtering recommended for abuse mitigation. Often, the most efficient method of dealing with abusive request traffic (including denial-of-service attempts) is to simply not reply; malicious clients are unlikely to respect the in-band ‘cease’ signal [37]. The same kernel-level packet filter used to collect this study’s data can serve to rate-limit individual IP addresses, across all protocols, with lookup tables of configurable size, expiry criteria, and logging [38]. Filtering at the kernel-level relieves the NTP service of such ancillary processing. For TCP protocols, an additional benefit of kernel-level packet filtering is the suppression of abusive requests before the issuance of TCP handshaking [15], which consumes server memory and processing time. 5.1 Conclusions Inspection of a portion of ITS inbound traffic has revealed a client base spanning a significant fraction of the Internet. We were surprised to observe significant temporal bunching of requests, prevalent use of the SNTP protocol variant and obsolete NTP versions, all of which likely represents suboptimal use of ITS resources. Future studies could be improved by inclusion of IPv6 traffic, a larger selection of servers under study, and quantification of the technical delay as a function of inbound traffic volume. Acknowledgments The authors thank Robert Jördens and Joe Britton for close reading of the manuscript and suggestions. 6. References [1] NIST Internet Time Service, http://www.nist.gov/pml/div688/grp40/its.cfm. [2] List of NIST ITS servers, http://tf.nist.gov/tf-cgi/servers.cgi. [3] J. Levine, Invited review article: The statistical modeling of atomic clocks and the design of time scales, Review of Scientific
Instruments, vol. 83, no. 2, p. 021101, 2012. http://dx.doi.org/10.1063/1.3681448 [4] P. H. Dana, Global positioning system (GPS) time dissemination for real-time applications, Real-Time Systems, vol. 12, no. 1,
pp. 9-40, 1997. http://dx.doi.org/10.1023/A:1007906014916 [5] Financial Industry Regulatory Authority, Regulatory Notice 14-47: FINRA requests comments on a proposal to tighten
business clock synchronization requirements, http://www.finra.org/industry/notices/14-47, November 2014. [6] J. C. Corbett, J. Dean, M. Epstein, A. Fikes, C. Frost, J. J. Furman, S. Ghemawat, A. Gubarev, C. Heiser, P. Hochschild, et al.,
Spanner: Google’s globally distributed database, ACM Transactions on Computer Systems (TOCS), vol. 31, no. 3, p. 8, 2013. [7] H. Kopetz and W. Ochsenreiter, Clock synchronization in distributed real-time systems, Computers, IEEE Transactions on, vol.
C-36, no. 8, pp. 933-940, 1987. http://dx.doi.org/10.1109/TC.1987.5009516 [8] E. Lee, Cyber physical systems: Design challenges, in Object Oriented Real-Time Distributed Computing (ISORC), 2008 11th
IEEE International Symposium on. IEEE, 2008, pp. 363-369. [9] M. Weiss, S. Chandhoke, and H. Melvin, Time signals converging within cyber-physical systems, in Proc. 2015 Joint Mtg.
IEEE Intl. Freq. Cont. Symp. and EFTF Conf., 2015, pp. 684-689. http://dx.doi.org/10.1109/FCS.2015.7138935 [10] A. Malhotra, I. E. Cohen, E. Brakke, and S. Goldberg, Attacking the network time protocol, (to appear at Network and
Distributed System Security Symposium 2016). [11] L. Atzori, A. Iera, and G. Morabito, The internet of things: A survey, Computer networks, vol. 54, no. 15, pp. 2787-2805, 2010.
http://dx.doi.org//10.1016/j.comnet.2010.05.010 [12] J. Levine, M. A. Lombardi, and A. N. Novick, NIST computer time services: Internet Time Service (ITS), Automated
Computer Time Service (ACTS), and time.gov web sites, NIST Special Publication 250-59, 2002. [13] D. L. Mills, Internet time synchronization: the network time protocol, Communications, IEEE Transactions on, vol. 39, no. 10,
pp. 1482-1493, 1991. [14] D. Mills, J. Martin, J. Burbank, and W. Kasch, Network time protocol version 4: Protocol and algorithms specification, Internet
Requests for Comments, RFC Editor, RFC 5905, June 2010, http://www.rfc-editor.org/info/rfc5905. [15] W. R. Stevens, B. Fenner, and A. M. Rudoff, UNIX network programming. Addison-Wesley Professional, 2004, vol. 1.
Volume 121 (2016) http://dx.doi.org/10.6028/jres.121.003 Journal of Research of the National Institute of Standards and Technology
46 http://dx.doi.org/10.6028/jres.121.003
[16] J. Postel, Daytime protocol, Internet Requests for Comments, RFC Editor, RFC 867, May 1983, http://www.rfc-editor.org/rfc/rfc867.txt.
[17] J. Postel and K. Harrenstien, Time protocol, Internet Requests for Comments, RFC Editor, RFC 868, May 1983, http://www.rfc-editor.org/rfc/rfc868.txt.
[18] H. Jiang and C. Dovrolis, Passive estimation of TCP round-trip times, ACM SIGCOMM Computer Communication Review, vol. 32, no. 3, pp. 75-88, 2002.
[19] NIST Authenticated NTP Service, http://www.nist.gov/pml/div688/grp40/auth-ntp.cfm. [20] J. Ridoux and D. Veitch, Principles of robust timing over the internet, Communications of the ACM, vol. 53, no. 5, pp. 54-61,
2010. [21] Network Time Foundation, NTP reference implemenation, http://www.ntp.org/downloads.html. [22] R. Curnow and M. Lichvar, Chrony, http://chrony.tuxfamily.org/. [23] The OpenBSD Project, openNTPD, http://www.openntpd.org/. [24] P. Kamp, ntimed, https://github.com/bsdphk/Ntimed. [25] R. Schmidt, Reflections on ten years of network time service, in 36th Annual Precise Time and Time Interval (PTTI) Systems
and Applications Meeting, 2004, pp. 123-137. [26] I. A. N. Authority, IANA IPv4 Address Space Registry, http://www.iana.org/assignments/ipv4-address-space/. [27] The Measurement Factory, IPv4-heatmap software, http://maps.measurement-factory.com/software/. [28] M. Cotton, L. Vegodaq, R. Bonica, and B. Haberman, Special-purpose IP address registries, Internet Requests for Comments,
RFC Editor, RFC 6890, April 2013, http://www.rfc-editor.org/rfc/rfc6890.txt. [29] C. M. Kozierok, The TCP/IP Guide: A Comprehensive, Illustrated Internet Protocols Reference, 1st ed. No Starch Press, 2005. [30] T. Brisco, DNS support for load balancing, Internet Requests for Comments, RFC Editor, RFC 1794, April 1995,
http://www.rfc-editor.org/rfc/rfc1794.txt. [31] Y. Rekhter, T. Li, and S. Hares, A border gateway protocol 4 (BGP-4), Internet Requests for Comments, RFC Editor, RFC
4271, January 2006, http://www.rfc-editor.org/rfc/rfc4271.txt. [32] MaxMind Inc., Geolite data created by maxmind, http://dev.maxmind.com/geoip/legacy/geolite/, April 2015. [33] J. Sherman, alpaca: a lightweight packet capturer, https://github.com/jeff-sherman/alpaca, 2015. [34] The Tcpdump Group, Tcpdump and libpcap, http://www.tcpdump.org/. [35] S. McCanne and V. Jacobson, The bsd packet filter: A new architecture for user-level packet capture, in Proceedings of the
USENIX Winter 1993 Conference Proceedings on USENIX Winter 1993 Conference Proceedings. USENIX Association, 1993, pp. 259-2269.
[36] J. Czyz, M. Kallitsis, M. Gharaibeh, C. Papadopoulos, M. Bailey, and M. Karir, Taming the 800 pound gorilla: The rise and decline of ntp ddos attacks, in Proceedings of the 2014 Conference on Internet Measurement Conference. ACM, 2014, pp. 435-448. http://dx.doi.org/10.1145/2663716.2663717
[37] D. Mills, J. Levine, R. Schmidt, and D. Plonka, Coping with overload on the network time protocol public servers, in 36th Annual Precise Time and Time Interval (PTTI) Systems and Applications Meeting, 2004, pp. 5-15.
[38] OpenBSD, Pf: the openbsd packet filter, http://www.openbsd.org/faq/pf/. About the authors: Dr. Jeff A. Sherman is a physicist in the Time and Frequency Division at NIST, whose other work concerns optical frequency references based on ultracold atoms. Dr. Judah Levine is a NIST Fellow, JILA Fellow, and Professor Adjoint in the Department of Physics, University of Colorado, Boulder. Dr. Levine leads the Network Synchronization Project in the Time and Frequency Division at NIST, and designed and built the servers that support the Automated Computer Time Service (ACTS) and the Internet Time Service. He is also responsible for the design and implementation of the timescales AT1 and UTC(NIST). The National Institute of Standards and Technology is an agency of the U.S. Department of Commerce.