u.s.bancorp annual reports 2001
TRANSCRIPT

This changes banking forever.2001 ANNUAL REPORT AND FORM 10-K

Contents
The New U.S. Bancorp
1 Delivering Five Star Service Guaranteed
2 Graphs of Selected Financial Highlights
3 Financial Summary
5 Letter to Shareholders
6 Growing Diversified Businesses
8 Providing Convenient Access
10 Building the Best Bank in America
12 Capitalizing on GrowthOpportunities
14 Providing Local MarketLeadership and CommunitySupport
Financial Section
16 Management's Discussion and Analysis
48 Responsibility for Financial Statements
48 Report of IndependentAccountants
49 Consolidated FinancialStatements
53 Notes to Consolidated Financial Statements
84 Five-Year Consolidated Financial Statements
88 Quarterly Consolidated Financial Data
89 Supplemental Financial Data
90 Annual Report on Form 10-K
94 Executive Officers
96 Directors
Inside back cover Corporate Information
Back cover Corporate Profile

This changes banking forever.Guaranteed customer serviceby every business line andevery employee for every transaction, every day. Ourexclusive Five Star ServiceGuarantee puts customerneeds first and foremost.
Delivering Five Star Service Guaranteed
Outstanding customer service is so
fundamental to the way we do business
that our employees wear lapel pins with
the inscription “Service Guaranteed” as
a visible symbol of our commitment to
customers. A replica of that pin is on the
cover of this report, signifying its impor-
tance to U.S. Bank®.
In 1996, we created the original
Five Star Service Guarantee for all of
our customers who bank in a branch
office. Our goal: to bring customers the
highest level of service they have ever
experienced from a financial institution.
Since then, our pursuit of excellence
has expanded to every line of business
and department at U.S. Bank. Each one
has its own set of Five Star Service
Guarantees — more than 80 guarantees
in all, delivered by all business lines
throughout our organization.
This means that every employee is
working every day not just to meet cus-
tomer needs, but to exceed them. And, if
anyone at U.S. Bank fails to keep any of
our guarantees, we pay the customer for
the inconvenience.
We recognize that our service is
what differentiates U.S. Bank from our
competition. Product features and rates
may be similar among banks, but
guaranteed, outstanding service makes
U.S. Bank unique. We say that some
banks talk about great service, but only
U.S. Bank guarantees it.
Circle of Service ExcellenceOur Five Star Service Guarantee is
built on the outstanding efforts of our
employees and their commitment and
contribution to delivering the highest
level of quality service for our customers.
Each quarter we choose a select few
employees who exemplify outstanding
service for induction into the Circle of
Service Excellence. We honor them at
a luncheon hosted by U.S. Bancorp
executives and at a Board of Directors
meeting. We prominently display their
portraits at our Five Star Halls of Fame,
located in seven major markets. Stock
options and local recognition are among
the other ways we reward these top
performers. We invite you to nominate
an outstanding employee for our
Circle of Service Excellence using the
attached self-addressed, postage-paid
nomination form.
1U.S. Bancorp

2 U.S. Bancorp 3U.S. Bancorp
Percent Change Percent Change(Dollars in Millions, Except Per Share Data) 2001 2000 1999 2001 2000
Operating earnings (a) . . . . . . . . . . . . . . . . . . . . . . . . . . . . . . . . . . . $ 2,550.8 $ 3,106.9 $ 2,799.0 (17.9)% 11.0%Merger and restructuring-related items (after-tax) . . . . . . . . . . . . . . . (844.3) (231.3) (417.2)
Net income . . . . . . . . . . . . . . . . . . . . . . . . . . . . . . . . . . . . . . . . . $ 1,706.5 $ 2,875.6 $ 2,381.8 (40.7) 20.7
Per Common ShareEarnings per share . . . . . . . . . . . . . . . . . . . . . . . . . . . . . . . . . . . . . . $ .89 $ 1.51 $ 1.25 (41.1)% 20.8%Diluted earnings per share . . . . . . . . . . . . . . . . . . . . . . . . . . . . . . . . .88 1.50 1.23 (41.3) 22.0Dividends declared per share (b) . . . . . . . . . . . . . . . . . . . . . . . . . . . .75 .65 .46 15.4 41.3Book value per share . . . . . . . . . . . . . . . . . . . . . . . . . . . . . . . . . . . . 8.43 7.97 7.23 5.8 10.2Market value per share . . . . . . . . . . . . . . . . . . . . . . . . . . . . . . . . . . . 20.93 23.25 21.13 (10.0) 10.0
Financial RatiosReturn on average assets . . . . . . . . . . . . . . . . . . . . . . . . . . . . . . . . . 1.03% 1.81% 1.59%Return on average equity . . . . . . . . . . . . . . . . . . . . . . . . . . . . . . . . . 10.5 20.0 18.0Net interest margin (taxable-equivalent basis) . . . . . . . . . . . . . . . . . . 4.45 4.36 4.44Efficiency ratio . . . . . . . . . . . . . . . . . . . . . . . . . . . . . . . . . . . . . . . . . 57.5 51.9 55.7
Financial Ratios Excluding Merger and Restructuring-Related Items (a)
Return on average assets . . . . . . . . . . . . . . . . . . . . . . . . . . . . . . . . . 1.54% 1.96% 1.86%Return on average equity . . . . . . . . . . . . . . . . . . . . . . . . . . . . . . . . . 15.7 21.6 21.2Efficiency ratio . . . . . . . . . . . . . . . . . . . . . . . . . . . . . . . . . . . . . . . . . 49.5 48.8 50.5Banking efficiency ratio (c) . . . . . . . . . . . . . . . . . . . . . . . . . . . . . . . . 45.2 43.5 46.3
Average BalancesLoans . . . . . . . . . . . . . . . . . . . . . . . . . . . . . . . . . . . . . . . . . . . . . . . . $118,177 $118,317 $109,638 (.1)% 7.9%Earning assets . . . . . . . . . . . . . . . . . . . . . . . . . . . . . . . . . . . . . . . . . 145,165 140,606 133,757 3.2 5.1Assets . . . . . . . . . . . . . . . . . . . . . . . . . . . . . . . . . . . . . . . . . . . . . . . 165,944 158,481 150,167 4.7 5.5Deposits . . . . . . . . . . . . . . . . . . . . . . . . . . . . . . . . . . . . . . . . . . . . . . 104,956 103,426 99,920 1.5 3.5Total shareholders’ equity . . . . . . . . . . . . . . . . . . . . . . . . . . . . . . . . . 16,201 14,365 13,221 12.8 8.7
Period End BalancesLoans . . . . . . . . . . . . . . . . . . . . . . . . . . . . . . . . . . . . . . . . . . . . . . . . $114,405 $122,365 $113,229 (6.5)% 8.1%Allowance for credit losses . . . . . . . . . . . . . . . . . . . . . . . . . . . . . . . . 2,457 1,787 1,710 37.5 4.5Assets . . . . . . . . . . . . . . . . . . . . . . . . . . . . . . . . . . . . . . . . . . . . . . . 171,390 164,921 154,318 3.9 6.9Deposits . . . . . . . . . . . . . . . . . . . . . . . . . . . . . . . . . . . . . . . . . . . . . . 105,219 109,535 103,417 (3.9) 5.9Total shareholders’ equity . . . . . . . . . . . . . . . . . . . . . . . . . . . . . . . . . 16,461 15,168 13,947 8.5 8.8Regulatory capital ratios
Tangible common equity . . . . . . . . . . . . . . . . . . . . . . . . . . . . . . . 5.7% 6.3% 6.7%Tier 1 capital . . . . . . . . . . . . . . . . . . . . . . . . . . . . . . . . . . . . . . . . 7.7 7.2 7.4Total risk-based capital . . . . . . . . . . . . . . . . . . . . . . . . . . . . . . . . 11.7 10.6 11.0Leverage . . . . . . . . . . . . . . . . . . . . . . . . . . . . . . . . . . . . . . . . . . . 7.7 7.4 7.5
3,200
2,400
1,600
800
0
Net Income(In millions of dollars)
9797 9898 9999 0000 0101
2,123.9
2,519.3
2,799.0
3,106.9
2,550.8
1,599.3
2,123.9
2,381.8
2,875.6
1,706.5
Operating Earnings(a)Net Income
2.00
1.50
1.00
.50
0
Diluted Earnings Per Common Share(In dollars)
9797 9898 9999 0000 0101
1.13
.85
1.30
1.10
1.45
1.23
1.621.50
1.32
.88
Diluted Earnings Per Common Share
Diluted Earnings Per Common Share(Operating Basis)(a)
10
8
6
4
2
0
Average Equity to Average Assets(In percents)
9797 9898 9999 0000 0101
8.408.67 8.80 9.06
9.76
2.00
1.50
1.00
.50
0
Return on Average Assets(In percents)
9797 9898 9999 0000 0101
1.76
1.49
1.86
1.59
1.96
1.81
1.54
1.03
1.64
1.24
Return on Average AssetsReturn on Average Assets (Operating Basis)(a)
25
20
15
10
5
0
Return on Average Common Equity(In percents)
9797 9898 9999 0000 0101
19.5
14.7
20.3
17.2
21.2
18.0
21.620.0
15.7
10.5
Return on Average Common Equity
Return on Average Common Equity (Operating Basis)(a)
.75
.50
.25
0
Dividends Declared Per Common Share (b)(In dollars)
9797 9898 9999 0000 0101
.27.33
.46
.65
.75
5.00
3.75
2.50
1.25
0
Net Interest Margin(In percents)
9797 9898 9999 0000 0101
4.724.44 4.44 4.36 4.45
60
40
20
0
Banking Efficiency Ratio (c) (In percents)
9797 9898 9999 0000 0101
51.7
59.5
49.7
56.1
46.352.1
43.546.8 45.2
52.5
Banking Efficiency RatioBanking Efficiency Ratio (Operating Basis)(a)
60
40
20
0
Efficiency Ratio (In percents)
9797 9898 9999 0000 0101
59.9
52.2
58.3
52.255.7
50.5 51.948.8
57.5
49.5
Efficiency RatioEfficiency Ratio (Operating Basis)(a)
200,000
150,000
100,000
50,000
0
Average Assets(In millions of dollars)
9797 9898 9999 0000 0101
129,493142,887
150,167 158,481165,944
20,000
15,000
10,000
5,000
0
Average Shareholders’ Equity(In millions of dollars)
9898 9999 0000 0101
12,383
9797
10,882
13,22114,365
16,201
100
75
50
25
0
Dividend Payout Ratio (In percents)
9797 9898 9999 0000 0101
23.831.6
25.329.9 31.7
37.3 40.143.4
57.0
85.2
Dividend Payout RatioDividend Payout Ratio (Operating Basis)(a)
Financial Summary
(a) The Company analyzes its performance on a net income basis in accordance with accounting principles generally accepted in the United States, as well as on an operatingbasis before merger and restructuring-related items referred to as “operating earnings.” Operating earnings are presented as supplemental information to enhance the reader’sunderstanding of, and highlight trends in, the Company’s financial results excluding the impact of merger and restructuring-related items of specific business acquisitions andrestructuring activities. Operating earnings should not be viewed as a substitute for net income and earnings per share as determined in accordance with accounting principlesgenerally accepted in the United States. Merger and restructuring-related items excluded from net income to derive operating earnings may be significant and may not becomparable to other companies.
(b) Dividends per share have not been restated for the 2001 merger of Firstar and the former U.S. Bancorp (“USBM”).
(c) Without investment banking and brokerage activity.
Forward-Looking Statements
This Annual Report and Form 10-K contains forward-looking statements. Statements that are not historical or current facts, including statements about beliefs and expectations,are forward-looking statements. Forward-looking statements involve inherent risks and uncertainties, and important factors could cause actual results to differ materially fromthose anticipated, including the following, in addition to those contained in the Company’s reports on file with the SEC: (i) general economic or industry conditions could be less favorable than expected, resulting in a deterioration in credit quality, a change in the allowance for credit losses, or a reduced demand for credit or fee-based products and services; (ii) the Company could encounter unforeseen complications in connection with the ongoing integration of the products, operations and information systems ofFirstar with USBM that could adversely affect the Company’s operations or customer relationships; (iii) changes in the domestic interest rate environment could reduce net interest income and could increase credit losses; (iv) the conditions of the securities markets could change, adversely affecting revenues from capital markets businesses, thevalue or credit quality of the Company’s assets, or the availability and terms of funding necessary to meet the Company's liquidity needs; (v) changes in the extensive laws, regulations and policies governing financial services companies could alter the Company's business environment or affect operations; (vi) the potential need to adapt to industrychanges in information technology systems, on which the Company is highly dependent, could present operational issues or require significant capital spending; (vii) competitivepressures could intensify and affect the Company's profitability, including as a result of continued industry consolidation, the increased availability of financial services from non-banks, technological developments, or bank regulatory reform; (viii) acquisitions may not produce revenue enhancements or cost savings at levels or within time frames originally anticipated, or may result in unforeseen integration difficulties; and (ix) capital investments in the Company’s businesses may not produce expected growth in earningsanticipated at the time of the expenditure. Forward-looking statements speak only as of the date they are made, and the Company undertakes no obligation to update them inlight of new information or future events.

3U.S. Bancorp
Percent Change Percent Change(Dollars in Millions, Except Per Share Data) 2001 2000 1999 2001 2000
Operating earnings (a) . . . . . . . . . . . . . . . . . . . . . . . . . . . . . . . . . . . $ 2,550.8 $ 3,106.9 $ 2,799.0 (17.9)% 11.0%Merger and restructuring-related items (after-tax) . . . . . . . . . . . . . . . (844.3) (231.3) (417.2)
Net income . . . . . . . . . . . . . . . . . . . . . . . . . . . . . . . . . . . . . . . . . $ 1,706.5 $ 2,875.6 $ 2,381.8 (40.7) 20.7
Per Common ShareEarnings per share . . . . . . . . . . . . . . . . . . . . . . . . . . . . . . . . . . . . . . $ .89 $ 1.51 $ 1.25 (41.1)% 20.8%Diluted earnings per share . . . . . . . . . . . . . . . . . . . . . . . . . . . . . . . . .88 1.50 1.23 (41.3) 22.0Dividends declared per share (b) . . . . . . . . . . . . . . . . . . . . . . . . . . . .75 .65 .46 15.4 41.3Book value per share . . . . . . . . . . . . . . . . . . . . . . . . . . . . . . . . . . . . 8.43 7.97 7.23 5.8 10.2Market value per share . . . . . . . . . . . . . . . . . . . . . . . . . . . . . . . . . . . 20.93 23.25 21.13 (10.0) 10.0
Financial RatiosReturn on average assets . . . . . . . . . . . . . . . . . . . . . . . . . . . . . . . . . 1.03% 1.81% 1.59%Return on average equity . . . . . . . . . . . . . . . . . . . . . . . . . . . . . . . . . 10.5 20.0 18.0Net interest margin (taxable-equivalent basis) . . . . . . . . . . . . . . . . . . 4.45 4.36 4.44Efficiency ratio . . . . . . . . . . . . . . . . . . . . . . . . . . . . . . . . . . . . . . . . . 57.5 51.9 55.7
Financial Ratios Excluding Merger and Restructuring-Related Items (a)
Return on average assets . . . . . . . . . . . . . . . . . . . . . . . . . . . . . . . . . 1.54% 1.96% 1.86%Return on average equity . . . . . . . . . . . . . . . . . . . . . . . . . . . . . . . . . 15.7 21.6 21.2Efficiency ratio . . . . . . . . . . . . . . . . . . . . . . . . . . . . . . . . . . . . . . . . . 49.5 48.8 50.5Banking efficiency ratio (c) . . . . . . . . . . . . . . . . . . . . . . . . . . . . . . . . 45.2 43.5 46.3
Average BalancesLoans . . . . . . . . . . . . . . . . . . . . . . . . . . . . . . . . . . . . . . . . . . . . . . . . $118,177 $118,317 $109,638 (.1)% 7.9%Earning assets . . . . . . . . . . . . . . . . . . . . . . . . . . . . . . . . . . . . . . . . . 145,165 140,606 133,757 3.2 5.1Assets . . . . . . . . . . . . . . . . . . . . . . . . . . . . . . . . . . . . . . . . . . . . . . . 165,944 158,481 150,167 4.7 5.5Deposits . . . . . . . . . . . . . . . . . . . . . . . . . . . . . . . . . . . . . . . . . . . . . . 104,956 103,426 99,920 1.5 3.5Total shareholders’ equity . . . . . . . . . . . . . . . . . . . . . . . . . . . . . . . . . 16,201 14,365 13,221 12.8 8.7
Period End BalancesLoans . . . . . . . . . . . . . . . . . . . . . . . . . . . . . . . . . . . . . . . . . . . . . . . . $114,405 $122,365 $113,229 (6.5)% 8.1%Allowance for credit losses . . . . . . . . . . . . . . . . . . . . . . . . . . . . . . . . 2,457 1,787 1,710 37.5 4.5Assets . . . . . . . . . . . . . . . . . . . . . . . . . . . . . . . . . . . . . . . . . . . . . . . 171,390 164,921 154,318 3.9 6.9Deposits . . . . . . . . . . . . . . . . . . . . . . . . . . . . . . . . . . . . . . . . . . . . . . 105,219 109,535 103,417 (3.9) 5.9Total shareholders’ equity . . . . . . . . . . . . . . . . . . . . . . . . . . . . . . . . . 16,461 15,168 13,947 8.5 8.8Regulatory capital ratios
Tangible common equity . . . . . . . . . . . . . . . . . . . . . . . . . . . . . . . 5.7% 6.3% 6.7%Tier 1 capital . . . . . . . . . . . . . . . . . . . . . . . . . . . . . . . . . . . . . . . . 7.7 7.2 7.4Total risk-based capital . . . . . . . . . . . . . . . . . . . . . . . . . . . . . . . . 11.7 10.6 11.0Leverage . . . . . . . . . . . . . . . . . . . . . . . . . . . . . . . . . . . . . . . . . . . 7.7 7.4 7.5
Financial Summary
(a) The Company analyzes its performance on a net income basis in accordance with accounting principles generally accepted in the United States, as well as on an operatingbasis before merger and restructuring-related items referred to as “operating earnings.” Operating earnings are presented as supplemental information to enhance the reader’sunderstanding of, and highlight trends in, the Company’s financial results excluding the impact of merger and restructuring-related items of specific business acquisitions andrestructuring activities. Operating earnings should not be viewed as a substitute for net income and earnings per share as determined in accordance with accounting principlesgenerally accepted in the United States. Merger and restructuring-related items excluded from net income to derive operating earnings may be significant and may not becomparable to other companies.
(b) Dividends per share have not been restated for the 2001 merger of Firstar and the former U.S. Bancorp (“USBM”).
(c) Without investment banking and brokerage activity.
Forward-Looking Statements
This Annual Report and Form 10-K contains forward-looking statements. Statements that are not historical or current facts, including statements about beliefs and expectations,are forward-looking statements. Forward-looking statements involve inherent risks and uncertainties, and important factors could cause actual results to differ materially fromthose anticipated, including the following, in addition to those contained in the Company’s reports on file with the SEC: (i) general economic or industry conditions could be less favorable than expected, resulting in a deterioration in credit quality, a change in the allowance for credit losses, or a reduced demand for credit or fee-based products and services; (ii) the Company could encounter unforeseen complications in connection with the ongoing integration of the products, operations and information systems ofFirstar with USBM that could adversely affect the Company’s operations or customer relationships; (iii) changes in the domestic interest rate environment could reduce net interest income and could increase credit losses; (iv) the conditions of the securities markets could change, adversely affecting revenues from capital markets businesses, thevalue or credit quality of the Company’s assets, or the availability and terms of funding necessary to meet the Company's liquidity needs; (v) changes in the extensive laws, regulations and policies governing financial services companies could alter the Company's business environment or affect operations; (vi) the potential need to adapt to industrychanges in information technology systems, on which the Company is highly dependent, could present operational issues or require significant capital spending; (vii) competitivepressures could intensify and affect the Company's profitability, including as a result of continued industry consolidation, the increased availability of financial services from non-banks, technological developments, or bank regulatory reform; (viii) acquisitions may not produce revenue enhancements or cost savings at levels or within time frames originally anticipated, or may result in unforeseen integration difficulties; and (ix) capital investments in the Company’s businesses may not produce expected growth in earningsanticipated at the time of the expenditure. Forward-looking statements speak only as of the date they are made, and the Company undertakes no obligation to update them inlight of new information or future events.

This changes banking forever.
4 U.S. Bancorp

Dear Fellow Shareholders:We are pleased to tell you that the
seamless integration of Firstar and
U.S. Bancorp proceeds on schedule to be
completed by the end of the third quarter
of 2002. We continue to successfully
convert major systems and products to
single operating platforms with virtually
no customer disruption. The integration
process has been thoughtful and inten-
tional. We have worked very diligently
to blend the best practices, people and
products of both organizations.
Your corporation ended 2001
with strong fourth quarter performance,
highlighted by revenue momentum,
margin improvement and a companywide
focus on customer service quality. We
are committed to seeing these trends
continue through 2002.
The year 2001 brought unprece-
dented challenges for our country and
our company. During the third quarter,
we took action to increase our reserves
for potential loan losses and to strengthen
our balance sheet. While we were
disappointed in the resulting adverse
effect on earnings, U.S. Bancorp now
ranks among the top of our peer group
in the strength of our credit reserves.
We prudently recognized the economic
slowdown and our inability to predict its
length or the timing of a genuine recovery.
For a company that prides itself on
consistent earnings, our third quarter
action was not an easy step to take.
However, it helped us accomplish one
of our primary objectives: having a
balance sheet and a risk profile among
the strongest in the industry. We have
positioned ourselves to manage through
the current economic cycle. Our credit
quality remained stable in the fourth
quarter, but we are prepared for the
likelihood that nonperforming loans and
charge-offs will increase throughout 2002.
Providing outstanding service to all
customers, backed by our exclusive
Five Star Service Guarantee, is an ongoing
priority at U.S. Bancorp, as is selling more
of our products and services. You can
read more about our Five Star Service
Guarantee at the front of this report.
Our operating revenue growth in the
fourth quarter is a sure sign that our
sales and service culture is taking effect.
Although our combined franchise
has yet to fulfill all of its potential, we
are off to a strong start on a solid foun-
dation. The success of our integration to
date and the benefits of the merger
became evident in our year-end results.
We operate in stable, moderately grow-
ing and fast-growing markets, and we
have a multi-tiered and comprehensive
distribution system throughout those
markets. Our scope and scale make us
a low-cost provider with significant com-
petitive advantages. We have a proven
track record and skilled professionals
who are the best in the industry running
our businesses.
We assure you that, as always, our
highest priority is to increase the value
of your investment in U.S. Bancorp. It is
the reason we come to work each day.
Sincerely,
Jerry A. Grundhofer
President and Chief Executive Officer
John F. Grundhofer
Chairman
February 22, 2002
This changes banking forever.U.S. Bancorp is well positioned to capitalize on growth opportunities.
5U.S. Bancorp4 U.S. Bancorp

GrowingDiversifiedBusinesses
Each U.S. Bancorpbusiness line focuseson unique customersegments, enablingus to best meet theneeds of our broadcustomer base.
6 U.S. Bancorp
Consumer BankingDelivers comprehensive financial
products and services to the broad
consumer and small business
markets through 2,147 banking
offices, telesales and telephone
customer service, online banking,
direct mail and 4,904 automated
teller machines (ATMs)
Wholesale BankingOffers relationship-based lending,
depository, treasury management,
foreign exchange, international
banking, leasing and other finan-
cial services primarily to middle
market, large corporate, financial
institution and public sector clients
Payment ServicesIncludes consumer and business
credit and debit cards, corporate
and purchasing card services,
consumer lines of credit, ATM pro-
cessing and merchant processing
Private Client, Trust andAsset ManagementProvides a comprehensive array
of private banking, personal,
corporate and institutional trust,
investment management, financial
advisory, mutual fund and asset
management services to affluent
individuals, businesses, institutions
and mutual funds
Capital MarketsUnder the U.S. Bancorp Piper
Jaffray® brand, provides financial
advisory and securities brokerage
services, mutual funds, annuities
and insurance products to individ-
uals and businesses; for corporate
and public sector clients, engages
in equity and fixed income trading
activities and investment banking
and underwriting services
* Treasury and Corporate Support contributed (1.0)% of 2001 operatingincome. Operating income represents pretax earnings before the provision for credit losses and merger and restructuring-related items.
** Assets are as of December 31, 2001 and reflect U.S. Bancorp Asset Management,Inc. and its affiliated private asset management group within U.S. Bank NationalAssociation. Investment products, including shares of mutual funds, are not obligations of, or guaranteed by, any bank, including U.S. Bank or any U.S. Bancorpaffiliate, nor are they insured by the Federal Deposit Insurance Corporation, theFederal Reserve Board or any other agency. An investment in such productsinvolves investment risk, including possible loss of principal.

7U.S. Bancorp
32.1%
18.9%
10.7%
Key Business Units� Community Banking serves smaller and
non-urban markets� Metropolitan Banking serves larger
urban and high-growth markets� In-Store Banking complements tradi-
tional branches with accessible facilitiesin supermarkets, convenience storesand other locations
� Small Business Banking provides comprehensive financial solutions tobusinesses with annual revenue up to $5 million
� Consumer Lending provides studentloans and serves consumers purchasingor leasing vehicles or marine equipmentthrough franchised dealers
� Consumer Finance serves customersoutside the traditional bank credit profile
� Home Mortgage Lending originates,purchases, sells and services residentialmortgage loans
� Retail Brokerage and Insurance providesmutual funds, variable and fixed annuities,general securities and discount brokerage
37.5%37.5%
Contribution to 2001 U.S. BancorpOperating Income*
Key Business Units� Private Advisory Services helps affluent
clients meet their financial goals througha network of 123 brokerage offices
� Equity Capital Markets providesresearch, trading, sales and equityinvestment banking activities, includingpublic offerings and advisory servicesfor mergers and acquisitions, withniches in communications, consumer,health care, financial institutions, industrial growth and technology
� Fixed Income Capital Markets providesfinancing and investment expertise topublic finance issuers, corporate debtissuers and institutional investors
Key Business Units� Private Client Group fulfills private
banking, personal trust and investmentmanagement needs for affluent clientsand has $79 billion in assets underadministration
� Corporate Trust Services provides trusteeservices for more than $650 billion inmunicipal, corporate, asset-backed andinternational bonds
� Institutional Trust and Custody providesretirement, investment and custodianservices to institutional clients
� Fund Services provides transfer agent,fund accounting, fund administration/compliance and distribution to mutualfund complexes
� U.S. Bancorp Asset Management, Inc.,with more than $121 billion** in assetsunder management, advises the $54 billion** First American® family of mutualfunds and provides customized portfoliomanagement for individuals, corporations,endowments, foundations, pensionfunds, public entities and labor unions
Key Business Units� Corporate Payment Systems provides
Visa® corporate and purchasing cardsand other payment solutions to compa-nies with annual sales greater than $50 million, as well as federal, state and local governments
� Card Services provides credit and debitcard products to consumer and smallbusiness customers of U.S. Bancorp,correspondent financial institutions andco-brand partners
� NOVA Information Systems, Inc. specializes in integrated credit and debitcard payment processing services,related software application productsand value-added services for more than650,000 U.S. merchant locations
� Transaction Services specializes in ATMprocessing, supporting U.S. Bank ATMsand facilitating electronic transactionsfor other financial institutions and cor-porations through ATMs, debit cards,two proprietary regional networks and a network gateway
Key Business Units� Commercial Banking serves middle
market clients with annual salesbetween $5 million and $250 million,and clients in the commercial realestate, commercial vehicle dealershipand energy industries
� Corporate Banking serves clients withannual sales greater than $250 million,those with specialized lending, equipmentfinance and leasing needs, companiesin diverse specialty industries (such as
agribusiness, health care, mortgagebanking and media/communications),correspondent banks, government entities, and all wholesale clients in our headquarters market
� Treasury Management provides comprehensive cash management solutions to business clients, facilitatingtheir deposits and the collection offunds, payments, and information to assist in the management and optimization of their cash position
Contribution to 2001 U.S. BancorpOperating Income*
Contribution to 2001 U.S. BancorpOperating Income*
Contribution to 2001 U.S. BancorpOperating Income*
Contribution to 2001 U.S. BancorpOperating Income*
1.8%
Strengths and Successes� Segmented business model� Strong sales culture� Top 3 small business lender� Top 3 Small Business Administration
bank lender� Top 4 bank branch network� Top 7 home equity lender� Top 8 consumer lender
Strengths and Successes� Strong distribution system� Comprehensive product set� Relationship manager tenure
and expertise� Leading depository bank for federal,
state and municipal governments� Top 5 bank-owned leasing company� Top 7 treasury management provider
Strengths and Successes� Creative, needs-based solutions� Leading technology and operational
economies of scale� Breadth of asset management products� Top 2 municipal trustee� Top 3 transfer agent� Top 5 bank-affiliated U.S. mutual
fund family� Top 6 among banks in record
keeping assets
Strengths and Successes� Strong retail distribution network� “Middle Market Mergers & Acquisitions
Bank of the Year,” Mergers & Acquisitionsmagazine, February 2001
� Top-performing equity bookrunner for lead-managed IPOs and follow-on offerings
� Record year for Fixed Income Capital Markets
� Leading manager of fixed income newissuance, underwriting $11.5 billion inagency securities and $6.3 billion inmunicipal bonds
Strengths and Successes� Industry-leading products� Proprietary technology� Operational economies of scale� No. 1 Visa commercial card issuer� Top 2 universal fleet card provider� Top 3 bank-owned ATM network� Top 3 merchant processor� Top 6 Visa and MasterCard® issuer

8 U.S. Bancorp
ProvidingConvenient Access
Cutting-Edge Delivery Technologies
24-Hour Banking: Our
Consumer Banking customer serv-
ice call centers handled 126,207,713
inbound inquiries in 2001, including
99,783,801 served by our interactive
voice response system.
ATM Banking: 4,904 leading-
edge terminals are available around
the clock throughout our 24-state
banking region.
Internet Banking: 1,155,733
consumer and small business
customers are registered to
conduct most transactions and
inquiries at the click of a mouse.
Our customers can choosethe easiest way to bank,whether in person, by telephone, via ATM or online.

NM
TX
HI
Hong KongCanadaBuenos AiresCayman IslandsLondonTel Aviv
LA
MS AL
WVVA
GASC
NC
PA
NY
ME
MDDE
DC
NJCT
RI
MA
VTNH
FL
MI
OK
AK
Commercial BankingConsumer BankingCorporate BankingPayment ServicesPrivate Client, Trust and Asset ManagementTechnology and Operations ServicesU.S. Bancorp Piper Jaffray
Commercial BankingConsumer BankingCorporate BankingPayment ServicesPrivate Client, Trust and Asset ManagementTechnology and Operations ServicesU.S. Bancorp Piper Jaffray
Specialized Services/Offices
2,147 branch banking offices in 24 states
All Firstar locations will operate as U.S. Bank by mid-2002.
2,147 branch banking offices in 24 states
All Firstar locations will operate as U.S. Bank by mid-2002.
Branch Banking
9U.S. Bancorp
Consumer and business customers
alike increasingly use technology to
access their accounts with us. They also
frequent our extensive network of bank
branches and specialized offices, which
remain the foundation of our command-
ing presence in many of the highest
growth, most diversified markets in the
United States. Wherever customers inter-
act with us, they can count on consistent,
leading-edge service.
Branch BankingOur Community and Metropolitan
Banking branches deliver all the products
and services U.S. Bank has to offer. In
our larger markets, branch staff act as
concierges, connecting customers with
experts across the company for specialized
services. Nontraditional branch locations
bring banking directly to where our cus-
tomers live, work, study and shop inside
retirement centers, workplaces and corpo-
rate sites, colleges and universities, and
grocery and convenience stores. These
dynamic locations feature special products,
services and hours geared to the unique
needs of local customers. Additionally,
many specialized offices within and beyond
our 24-state region serve unique customer
segments such as brokerage, home mort-
gage and trust.
Telephone BankingUsing 24-Hour Banking, consumers
have anytime, anywhere access to their
accounts by telephone, including Spanish
language options. Dedicated call centers
provide expertise to various business
customer segments and others with
specialized needs. Our telesales efforts
offer customers new products and
services to meet more of their financial
needs while generating revenue growth
for the company. Consumer Banking
alone handled 1,402,849 inbound and
outbound telesales calls in 2001.
ATM BankingOur ATM network is great in number
as well as functionality.We are upgrading
approximately 1,500 branch terminals to
Super ATMs, bringing the total number
of Super ATMs to 3,444. These state-of-
the-art ATMs enable customers not only
to access funds, check balances and make
deposits, but also to obtain statements,
order checks, request check copies,
purchase stamps and phone minutes…
and more. Updated ATMs feature the new
bright and colorful U.S. Bank look—
signaling the best ATM service available.
Internet BankingWe offer comprehensive, fast, secure
online service on all accounts across all
business lines. Consumers enjoy the latest
Internet banking capabilities available on
www.usbank.com or www.firstar.com,
where they can learn about products,
open deposit accounts in real time, apply
for loans and lines of credit, access
account information, pay bills and more.
Businesses and investors also benefit
from increasingly sophisticated, specialized
online tools. For example, we offer
advanced capabilities to deliver check
images to commercial customers via the
Internet. Our Customer Automation
Reporting Environment (C.A.R.E.) pro-
vides Internet access for corporate and
purchasing card customers, merchants
and government clients, who can gener-
ate customized reports at any time. And
we recently became the first institution
to offer complete Web-based reporting
and processing for money market instru-
ment issuers. It’s all part of “e-enabling”
our customers and employees with the
latest technology.
Relationship BankingRelationships, complemented by com-
prehensive products and services, drive
several of our key businesses, including
Wholesale Banking, Private Client, Trust
and Asset Management, and U.S. Bancorp
Piper Jaffray. Clients of these businesses
not only want quick, convenient access
to conduct transactions, they also need
expert advice and support. We offer both.
Clients always have access to an experi-
enced relationship manager— an ambassa-
dor who can help fulfill their day-to-day
needs or direct them, as needed, to appro-
priate specialists across our organization
in areas as diverse as asset management,
investment banking and leasing.
Branch Banking and Specialized Services/Offices

10 U.S. Bancorp
Structure and ProcessEvery week for more than a year,
corporate and line-of-business leaders from
across U.S. Bancorp have been gathering
to execute our comprehensive plan to
integrate Firstar and U.S. Bank. They are
united by a common goal: to ensure a
flawless, cost-effective integration for the
benefit of customers, shareholders and
employees. Their stellar track record—
years of experience executing dozens
of successful mergers—produces out-
standing results.
The integration has been a textbook
example of careful planning and smooth
execution. Thorough preparation,
employee training, systems testing and
customer communication has ensured
success. A series of systems conversions
is bringing all our markets together on
common operating and delivery platforms.
Together we are equipped to handle
increased capacity, enhanced functionality,
and high-quality, consistent service wher-
ever customers interact with us.
Disciplined. Detailed. Deliberate.
The ongoing integration ofFirstar and U.S. Bank isseamlessly creating one financial powerhouse, united by a single brand.
Building theBest Bank in America
11U.S. Bancorp
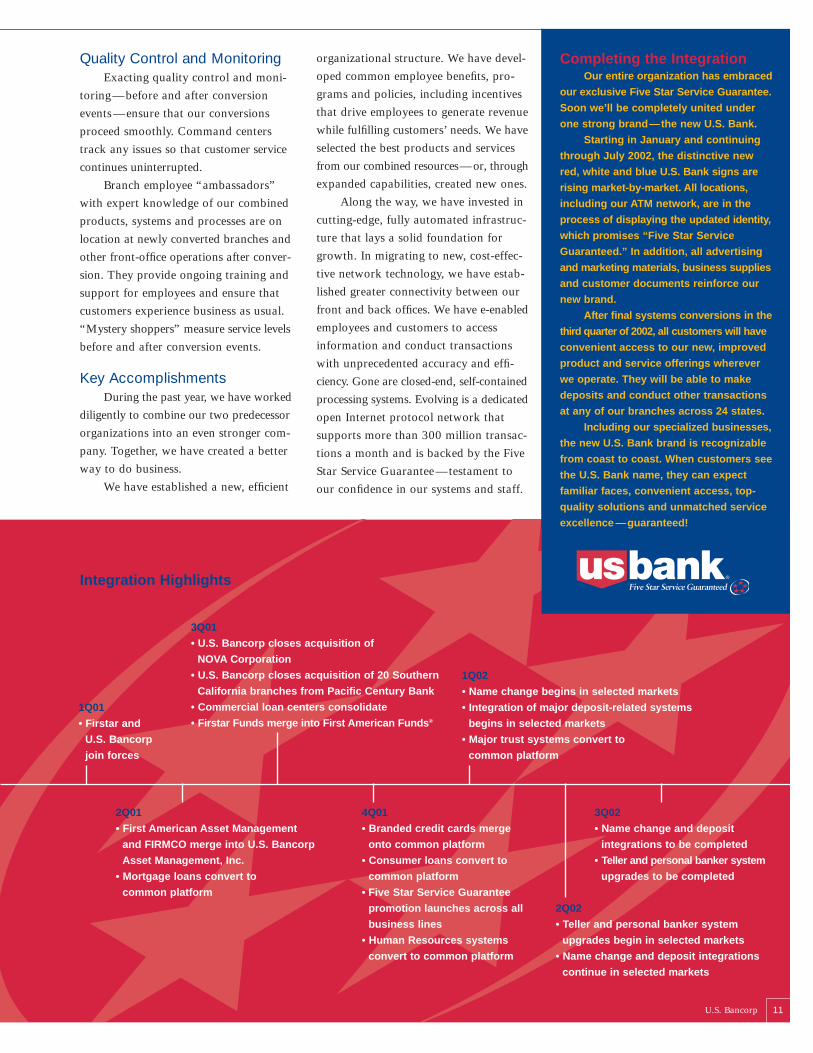
Quality Control and MonitoringExacting quality control and moni-
toring—before and after conversion
events—ensure that our conversions
proceed smoothly. Command centers
track any issues so that customer service
continues uninterrupted.
Branch employee “ambassadors”
with expert knowledge of our combined
products, systems and processes are on
location at newly converted branches and
other front-office operations after conver-
sion. They provide ongoing training and
support for employees and ensure that
customers experience business as usual.
“Mystery shoppers” measure service levels
before and after conversion events.
Key AccomplishmentsDuring the past year, we have worked
diligently to combine our two predecessor
organizations into an even stronger com-
pany. Together, we have created a better
way to do business.
We have established a new, efficient
Integration Highlights
2Q01
• First American Asset Management
and FIRMCO merge into U.S. Bancorp
Asset Management, Inc.
• Mortgage loans convert to
common platform
4Q01
• Branded credit cards merge
onto common platform
• Consumer loans convert to
common platform
• Five Star Service Guarantee
promotion launches across all
business lines
• Human Resources systems
convert to common platform
3Q02
• Name change and deposit
integrations to be completed
• Teller and personal banker system
upgrades to be completed
3Q01
• U.S. Bancorp closes acquisition of
NOVA Corporation
• U.S. Bancorp closes acquisition of 20 Southern
California branches from Pacific Century Bank
• Commercial loan centers consolidate
• Firstar Funds merge into First American Funds®
1Q02
• Name change begins in selected markets
• Integration of major deposit-related systems
begins in selected markets
• Major trust systems convert to
common platform
1Q01
• Firstar and
U.S. Bancorp
join forces
2Q02
• Teller and personal banker system
upgrades begin in selected markets
• Name change and deposit integrations
continue in selected markets
Completing the Integration Our entire organization has embraced
our exclusive Five Star Service Guarantee.
Soon we’ll be completely united under
one strong brand—the new U.S. Bank.
Starting in January and continuing
through July 2002, the distinctive new
red, white and blue U.S. Bank signs are
rising market-by-market. All locations,
including our ATM network, are in the
process of displaying the updated identity,
which promises “Five Star Service
Guaranteed.” In addition, all advertising
and marketing materials, business supplies
and customer documents reinforce our
new brand.
After final systems conversions in the
third quarter of 2002, all customers will have
convenient access to our new, improved
product and service offerings wherever
we operate. They will be able to make
deposits and conduct other transactions
at any of our branches across 24 states.
Including our specialized businesses,
the new U.S. Bank brand is recognizable
from coast to coast. When customers see
the U.S. Bank name, they can expect
familiar faces, convenient access, top-
quality solutions and unmatched service
excellence —guaranteed!
organizational structure. We have devel-
oped common employee benefits, pro-
grams and policies, including incentives
that drive employees to generate revenue
while fulfilling customers’ needs. We have
selected the best products and services
from our combined resources—or, through
expanded capabilities, created new ones.
Along the way, we have invested in
cutting-edge, fully automated infrastruc-
ture that lays a solid foundation for
growth. In migrating to new, cost-effec-
tive network technology, we have estab-
lished greater connectivity between our
front and back offices. We have e-enabled
employees and customers to access
information and conduct transactions
with unprecedented accuracy and effi-
ciency. Gone are closed-end, self-contained
processing systems. Evolving is a dedicated
open Internet protocol network that
supports more than 300 million transac-
tions a month and is backed by the Five
Star Service Guarantee—testament to
our confidence in our systems and staff.

12 U.S. Bancorp
The combination of Firstar and
U.S. Bancorp has created a larger,
stronger company with a solid founda-
tion for growth. We will grow by using
strategic cost advantage to gain market
share, emphasizing customer service and
investing in higher-growth businesses.
Our future begins with our basic
banking operations. We already rank
among the top three commercial banks in
50 metropolitan areas based on deposits.
We are penetrating all our markets even
further with our expanded, improved set
of high-quality products—backed every-
where by our Five Star Service Guarantee.
Consumers enjoy expanded access
through 2,147 branches and 4,904 ATMs
in 24 states, plus state-of-the-art telephone
and Internet banking channels. Businesses
also benefit from our expanded geographic
reach and technology investments.
Capitalizingon Growth Opportunities
Outstanding products. High-growth markets.Flourishing businesses.Convenient, efficient delivery.U.S. Bancorp is positioned to soar.

13U.S. Bancorp
National retailers, in particular, are bene-
fiting from enhanced depository and
treasury management products accessible
through common accounts across the
region, including the expansion of our
cash vault capabilities to new markets.
Trust customers benefit from our greater
economies of scale and state-of-the-art
products and systems.
We continually strive to serve cus-
tomers across business lines, gaining more
of their business. In 2001, for example,
U.S. Bancorp Piper Jaffray Fixed Income
Capital Markets had a record year in
corporate debt issuance, managing 35
issues with a par amount of more than
$19 billion, including preferred stock and
note issues for U.S. Bancorp. Meanwhile,
customers deposited more than $490
million into U.S. Bancorp Piper Jaffray
Prime AccountsSM and other brokerage
accounts through U.S. Bank branches and
ATMs—up over 134 percent from a year
earlier. When the integration is completed,
investors will have access to their broker-
age accounts at all of our bank branches.
Ultimately, our growth depends on
our people. We have created a sales
culture driven by customer needs and
rewarded by incentives for outstanding,
measurable performance. Every employee,
from the front line to the back office,
is eligible for incentives to strengthen
existing customer relationships, build
new ones, and provide outstanding
guaranteed service to all customers,
whether external or internal.
Hispanic Initiative Taps SuccessThe U.S. Hispanic community num-
bers more than 35 million consumers
with $450 billion in spending and invest-
ment power. Approximately 1.2 million
Hispanic businesses have $200 billion
in revenues. It’s a remarkable success
story —and opportunity.
Our Hispanic Initiative, launched in
2001, is our coordinated program to be
an outstanding bank, responsive business
partner and superior employer in key
markets. It focuses on more than 300
branches serving communities with large
Hispanic populations, both English- and
Spanish-speaking. More than ever before,
we are hiring additional Hispanic employ-
ees who reflect the diversity of their local
communities and who communicate
more effectively with customers. Our
employees are visible community leaders
who have strong relationships with
Hispanic individuals, businesses and
community organizations.
Our ATMs and 24-Hour Banking
system feature expanded Spanish language
options. Additionally, we have telephone
customer service representatives who speak
Spanish and other foreign languages.
We also are displaying more signs and
materials in Spanish.
We offer many programs that help
meet the needs of various segments of
Hispanic customers. To help first-time
borrowers, we created the Credit Builder
Secured Loan. We also accept identifica-
tion issued by the Consulate of Mexico,
issue the Visa® Payroll Card and offer a
low-cost money transfer program.
Our Hispanic Initiative extends to
partnerships with Hispanic Chambers of
Commerce and other organizations, and
to community service. Free seminars, for
example, cover topics ranging from the
basics of banking in the United States
(especially geared to Spanish-speaking
immigrants) to first-time home owner-
ship. Hispanic customers know they can
turn to U.S. Bank to turn their American
Dream into reality.
Payment Services: Growth EnginePayment Services represents one of
our greatest growth opportunities. We
continue to build our core commercial
and consumer card businesses while
investing in other industry-leading,
payment-related businesses.
PowerTrack®, our innovative online
payment processing and transaction
tracking system, has seemingly unlimited
potential. First introduced to the freight
industry, this single-source information
center provides powerful control for the
logistics process. On the Internet or via a
private network, shipment information is
stored as a single electronic document
that is instantly available to both shipper
and carrier. By eliminating manual rec-
onciliation of invoices and freight bills,
companies can save significantly on each
transaction. With expansion into other
industries, PowerTrack delivers the
future—faster, more accurate payments
and exceptional analytical reporting
tools for better management decisions.
The result is more efficiency and control
for both buyer and seller.
In 2001 we closed on our purchase
of NOVA Corporation, now known as
NOVA Information Systems, Inc., a wholly
owned subsidiary of U.S. Bancorp. This
merchant payment processor ranks as the
third-largest in the United States, serving
650,000 businesses of all sizes. Merchants
benefit from our industry-leading product
offerings, including electronic check
processing, a variety of Web-enabled
tools, and a full array of point-of-sale
applications in addition to credit card
and debit card processing.
Within our Transaction Services
division, Elan Financial Services serves
more than 3,000 financial institutions
through a complete range of products and
services including credit card issuing, and
ATM, debit card and merchant processing.
Elan also provides full-service support
and management tools that are offered
uniquely through a single source. The suite
of products enables small- to mid-sized
financial institution clients to compete
effectively with larger institutions. Elan
leverages these unique capabilities to also
provide ATM driving and deployment,
and debit gateway services to large
corporate clients.

Providing Local MarketLeadership and Community Support
14 U.S. Bancorp

15U.S. Bancorp
Local management. Localdecisions. Local involvement.At U.S. Bancorp, we are deeplyrooted in the communities we serve, and we recognizethat the best solutions come most often from those whoare closest to the market.
Local Market LeadershipU.S. Bank markets are segmented
into Metropolitan Banking in large
urban areas and Community Banking in
smaller urban and non-urban locales.
U.S. Bank maximizes its ability to serve
our Metropolitan Banking markets
through the independent management of
our major lines of business. In Commu-
nity Banking markets, however, all lines
of business are offered and marketed
through branch offices. In every market,
large or small, our local management
teams make the decisions that most
directly affect their customers. Local
autonomy in resource allocation, com-
munity affairs, pricing and business devel-
opment enhances local market control.
Local Bank BoardsThe best decisions and the best cus-
tomer service come from knowing our
markets and our customers. To enhance
our own management’s understanding of
local economies, critical issues, business
and public affairs, we have established
local bank boards throughout our markets.
The boards include local business and
civic leaders in addition to U.S. Bank
executives. The perspective of these board
members is invaluable.
Community InvolvementAt U.S. Bancorp, community is
more than a location. Community is the
corporate spirit of accepting the role
as a facilitator for the people, businesses
and nonprofit organizations in our
markets to achieve their financial goals
and enrich their lives.
To that end, we provide both corpo-
rate and local leadership on issues of
community importance; we tailor our
products and services to our communi-
ties’ diverse needs; our local managers
are visible and involved in community
organizations and economic development
efforts; and we encourage and support
our employees’ ongoing volunteer efforts.
We believe that our success depends on
the vitality of the communities we serve,
and we bring together many resources to
help make possible economic, educational
and cultural development.
Through the U.S. Bancorp Founda-
tion, we contribute millions of dollars
back to the communities in which we do
business through charitable grants to
nonprofit organizations. We provide
critical financing for revitalization efforts,
job programs and affordable housing.
We sponsor the United Way at generous
levels to meet critical human service needs.
We sponsor a wide variety of amateur
and professional artistic groups; profes-
sional, college and high school sporting
events and teams; and neighborhood and
civic events. From the smallest towns to
the largest cities, U.S. Bancorp is an inte-
gral part of the fabric of every hometown.
Development NetworkThe U.S. Bancorp Development
Network comprises 35 geographically
based employee chapters with a common
mission —to promote the personal and
professional development of our employ-
ees, to provide networking opportunities
within our organization and to offer a
framework for involvement in commu-
nity service. Individual Development
Network chapters recruit public school
tutors and mentors from our employee
base, raise funds for many charitable
causes and community efforts, partici-
pate in various walkathons and races,
assist elderly residents with simple home
repairs and maintenance, build Habitat
for Humanity homes, and become
involved in other community services.
U.S. Bancorp Foundation2001 Charitable Contributions by Program Area
32% United Way & Human Services 28% Economic Opportunity 18% Arts & Culture 16% Education 5% Employee Matching Gifts 1% Miscellaneous

Management's Discussion and Analysis
OVERVIEW $2.6 billion in 2001, or $1.32 per diluted share, compared
with $3.1 billion, or $1.62 per diluted share in 2000.U.S. Bancorp and its subsidiaries (""the Company'')
Operating earnings on a ""cash basis'' (calculated by addingcompose the organization created by the acquisition by
amortization of goodwill and other intangible assets toFirstar Corporation (""Firstar'') of the former U.S. Bancorp
operating earnings) was $1.59 per diluted share in 2001,of Minneapolis, Minnesota (""USBM''). The merger was
compared with $1.82 per diluted share in 2000. Return oncompleted on February 27, 2001, as a pooling-of-interests,
average assets and return on average common equity,and accordingly all Ñnancial information has been restated
excluding merger-related items, were 1.54 percent andto include the historical information of both companies.
15.7 percent in 2001, compared with returns ofEach share of Firstar stock was exchanged for one share of
1.96 percent and 21.6 percent in 2000. Operating earningsthe Company's common stock while each share of USBM
in 2001 reÖected total net revenue growth on a taxable-stock was exchanged for 1.265 shares of the Company's
equivalent basis, excluding merger-related gains, ofcommon stock. The new Company retained the U.S.
6.7 percent, oÅset by growth in noninterest expenses,Bancorp name.
excluding merger and restructuring-related charges, of
5.4 percent. On an operating basis, the eÇciency ratio wasEarnings Summary The Company reported net income of
49.5 percent in 2001, compared with 48.8 percent in 2000.$1.7 billion in 2001, or $.88 per diluted share, compared
The banking eÇciency ratio (the ratio of expenses towith $2.9 billion, or $1.50 per diluted share, in 2000.
revenues without the impact of investment banking andReturn on average assets and return on average common
brokerage activity) before merger and restructuring-relatedequity were 1.03 percent and 10.5 percent in 2001,
charges was 45.2 percent in 2001, compared withcompared with returns of 1.81 percent and 20.0 percent in
43.5 percent in 2000. The increase in the banking eÇciency2000. The year-over-year decline in earnings per diluted
ratio was primarily due to the impact of recent acquisitionsshare and return on average assets was primarily due to a
including NOVA.decline in capital markets activities, merger and
Net income and operating earnings for 2001 included arestructuring-related items and a higher provision for credit
number of signiÑcant items. During 2001, the provision forlosses which reÖected deterioration in economic conditions
credit losses was $2.5 billion, an increase of $1.7 billionand credit quality relative to a year ago. The reduction in
from a year ago. The change was due to an increased levelthe Company's return on average common equity also
of nonperforming assets and charge-oÅs, deterioration inreÖected the impact of recent acquisitions, which were
speciÑc credit portfolios, merger-related portfolioaccounted for using the purchase method. Net income
restructurings and speciÑc actions taken by management toincluded after-tax merger and restructuring-related items of
accelerate the Company's workout strategy for$844.3 million ($1.3 billion on a pre-tax basis) in 2001
nonperforming assets. Results for 2001 also reÖect thecompared with $231.3 million ($348.7 million on a pre-tax
impairment of retail leasing residuals due to sluggishbasis) in 2000. Merger and restructuring-related items, on a
pre-owned car markets, recognition of mortgage servicingpre-tax basis, included a $62.2 million gain on the sale of
rights (""MSR'') impairment during the declining ratebranches, $847.2 million of noninterest expenses and
environment and asset write-downs of commercial leasing$382.2 million of provision for credit losses associated with
partnerships and repossessed tractor/trailer property. Thesethe merger of Firstar and USBM. Merger and restructuring-
asset impairments were partially oÅset by gains related torelated items also included $50.7 million of expense for
sales of buildings and investment securities.restructuring operations of U.S. Bancorp Piper JaÅray, and
The Company analyzes its performance on a net$48.5 million related to the acquisition of NOVA
income basis determined in accordance with accountingCorporation (""NOVA'') and other recent acquisitions. The
principles generally accepted in the United States, as well aseÇciency ratio (the ratio of expenses to revenues) increased
on an operating basis before merger-related charges referredto 57.5 percent in 2001 compared with 51.9 percent in
to in this analysis as ""operating earnings''. Operating2000 primarily due to the impact of merger and
earnings and related discussions are presented asrestructuring-related items. Refer to page 22 for further
supplementary information in this analysis to enhance thediscussion of merger and restructuring-related items.
readers' understanding of, and highlight trends in, theThe Company had operating earnings (net income
Company's core Ñnancial results excluding the non-recurringexcluding merger and restructuring-related items) of
U.S. Bancorp16

Selected Financial Data
Year Ended December 31(Dollars and Shares in Millions, Except Per Share Data) 2001 2000 1999 1998 1997
Condensed Income StatementInterest income (taxable-equivalent basis) ÏÏÏÏÏÏÏÏÏÏÏÏÏÏÏÏÏÏ $11,139.5 $12,157.9 $10,723.0 $10,535.9 $ 9,921.8Interest expense ÏÏÏÏÏÏÏÏÏÏÏÏÏÏÏÏÏÏÏÏÏÏÏÏÏÏÏÏÏÏÏÏÏÏÏÏÏÏÏÏÏÏ 4,674.8 6,022.9 4,790.3 4,859.7 4,389.8
Net interest income ÏÏÏÏÏÏÏÏÏÏÏÏÏÏÏÏÏÏÏÏÏÏÏÏÏÏÏÏÏÏÏÏÏÏÏÏ 6,464.7 6,135.0 5,932.7 5,676.2 5,532.0Securities gains, net ÏÏÏÏÏÏÏÏÏÏÏÏÏÏÏÏÏÏÏÏÏÏÏÏÏÏÏÏÏÏÏÏÏÏÏÏÏÏÏ 329.1 8.1 13.2 29.1 7.3Noninterest income(a) ÏÏÏÏÏÏÏÏÏÏÏÏÏÏÏÏÏÏÏÏÏÏÏÏÏÏÏÏÏÏÏÏÏÏÏÏ 4,968.1 4,875.1 4,231.7 3,572.8 2,711.3
Total net revenue ÏÏÏÏÏÏÏÏÏÏÏÏÏÏÏÏÏÏÏÏÏÏÏÏÏÏÏÏÏÏÏÏÏÏÏÏÏÏ 11,761.9 11,018.2 10,177.6 9,278.1 8,250.6Noninterest expense(a) ÏÏÏÏÏÏÏÏÏÏÏÏÏÏÏÏÏÏÏÏÏÏÏÏÏÏÏÏÏÏÏÏÏÏÏ 5,658.8 5,368.3 5,128.5 4,829.6 4,306.7Provision for credit losses(a) ÏÏÏÏÏÏÏÏÏÏÏÏÏÏÏÏÏÏÏÏÏÏÏÏÏÏÏÏÏÏ 2,146.6 828.0 638.5 453.4 619.6
Income before taxes and merger and restructuring-relateditemsÏÏÏÏÏÏÏÏÏÏÏÏÏÏÏÏÏÏÏÏÏÏÏÏÏÏÏÏÏÏÏÏÏÏÏÏÏÏÏÏÏÏÏÏÏÏÏÏÏÏ 3,956.5 4,821.9 4,410.6 3,995.1 3,324.3
Taxable-equivalent adjustment ÏÏÏÏÏÏÏÏÏÏÏÏÏÏÏÏÏÏÏÏÏÏÏÏÏÏÏÏÏ 55.9 85.4 96.3 111.2 121.1Income taxes ÏÏÏÏÏÏÏÏÏÏÏÏÏÏÏÏÏÏÏÏÏÏÏÏÏÏÏÏÏÏÏÏÏÏÏÏÏÏÏÏÏÏÏÏÏ 1,349.8 1,629.6 1,515.3 1,364.6 1,079.3
Operating earnings(a)ÏÏÏÏÏÏÏÏÏÏÏÏÏÏÏÏÏÏÏÏÏÏÏÏÏÏÏÏÏÏÏÏÏÏÏÏÏ 2,550.8 3,106.9 2,799.0 2,519.3 2,123.9Merger and restructuring-related items (after-tax) ÏÏÏÏÏÏÏÏÏÏÏ (844.3) (231.3) (417.2) (386.4) (524.6)
Net income in accordance with GAAPÏÏÏÏÏÏÏÏÏÏÏÏÏÏÏÏÏÏÏÏ $ 1,706.5 $ 2,875.6 $ 2,381.8 $ 2,132.9 $ 1,599.3
Per Common ShareEarnings per share ÏÏÏÏÏÏÏÏÏÏÏÏÏÏÏÏÏÏÏÏÏÏÏÏÏÏÏÏÏÏÏÏÏÏÏÏÏÏÏÏ $ .89 $ 1.51 $ 1.25 $ 1.12 $ .86Diluted earnings per share ÏÏÏÏÏÏÏÏÏÏÏÏÏÏÏÏÏÏÏÏÏÏÏÏÏÏÏÏÏÏÏÏÏ .88 1.50 1.23 1.10 .85Dividends declared per share(b) ÏÏÏÏÏÏÏÏÏÏÏÏÏÏÏÏÏÏÏÏÏÏÏÏÏÏÏ .75 .65 .46 .33 .27Average shares outstandingÏÏÏÏÏÏÏÏÏÏÏÏÏÏÏÏÏÏÏÏÏÏÏÏÏÏÏÏÏÏÏÏ 1,927.9 1,906.0 1,907.8 1,898.8 1,841.0Average diluted shares outstanding ÏÏÏÏÏÏÏÏÏÏÏÏÏÏÏÏÏÏÏÏÏÏÏÏÏ 1,939.5 1,918.5 1,930.0 1,930.5 1,872.2
Financial RatiosReturn on average assetsÏÏÏÏÏÏÏÏÏÏÏÏÏÏÏÏÏÏÏÏÏÏÏÏÏÏÏÏÏÏÏÏÏÏ 1.03% 1.81% 1.59% 1.49% 1.24%Return on average equity ÏÏÏÏÏÏÏÏÏÏÏÏÏÏÏÏÏÏÏÏÏÏÏÏÏÏÏÏÏÏÏÏÏÏ 10.5 20.0 18.0 17.2 14.7Net interest margin (taxable-equivalent basis)ÏÏÏÏÏÏÏÏÏÏÏÏÏÏÏ 4.45 4.36 4.44 4.44 4.72EÇciency ratio ÏÏÏÏÏÏÏÏÏÏÏÏÏÏÏÏÏÏÏÏÏÏÏÏÏÏÏÏÏÏÏÏÏÏÏÏÏÏÏÏÏÏÏÏ 57.5 51.9 55.7 58.3 59.9
Financial Ratios Excluding Merger and
Restructuring-Related Items(a)Return on average assetsÏÏÏÏÏÏÏÏÏÏÏÏÏÏÏÏÏÏÏÏÏÏÏÏÏÏÏÏÏÏÏÏÏÏ 1.54% 1.96% 1.86% 1.76% 1.64%Return on average equity ÏÏÏÏÏÏÏÏÏÏÏÏÏÏÏÏÏÏÏÏÏÏÏÏÏÏÏÏÏÏÏÏÏÏ 15.7 21.6 21.2 20.3 19.5EÇciency ratio ÏÏÏÏÏÏÏÏÏÏÏÏÏÏÏÏÏÏÏÏÏÏÏÏÏÏÏÏÏÏÏÏÏÏÏÏÏÏÏÏÏÏÏÏ 49.5 48.8 50.5 52.2 52.2Banking eÇciency ratio(c) ÏÏÏÏÏÏÏÏÏÏÏÏÏÏÏÏÏÏÏÏÏÏÏÏÏÏÏÏÏÏÏÏÏ 45.2 43.5 46.3 49.7 51.7
Average Balance SheetLoans ÏÏÏÏÏÏÏÏÏÏÏÏÏÏÏÏÏÏÏÏÏÏÏÏÏÏÏÏÏÏÏÏÏÏÏÏÏÏÏÏÏÏÏÏÏÏÏÏÏÏÏÏ $ 118,177 $ 118,317 $ 109,638 $ 102,451 $ 95,149Loans held for saleÏÏÏÏÏÏÏÏÏÏÏÏÏÏÏÏÏÏÏÏÏÏÏÏÏÏÏÏÏÏÏÏÏÏÏÏÏÏÏÏ 1,911 1,303 1,450 1,264 549Investment securities ÏÏÏÏÏÏÏÏÏÏÏÏÏÏÏÏÏÏÏÏÏÏÏÏÏÏÏÏÏÏÏÏÏÏÏÏÏÏ 21,916 17,311 19,271 21,114 19,123Earning assets ÏÏÏÏÏÏÏÏÏÏÏÏÏÏÏÏÏÏÏÏÏÏÏÏÏÏÏÏÏÏÏÏÏÏÏÏÏÏÏÏÏÏÏÏ 145,165 140,606 133,757 127,738 117,173Assets ÏÏÏÏÏÏÏÏÏÏÏÏÏÏÏÏÏÏÏÏÏÏÏÏÏÏÏÏÏÏÏÏÏÏÏÏÏÏÏÏÏÏÏÏÏÏÏÏÏÏÏ 165,944 158,481 150,167 142,887 129,493Noninterest-bearing deposits ÏÏÏÏÏÏÏÏÏÏÏÏÏÏÏÏÏÏÏÏÏÏÏÏÏÏÏÏÏÏÏ 25,109 23,820 23,556 23,011 20,984DepositsÏÏÏÏÏÏÏÏÏÏÏÏÏÏÏÏÏÏÏÏÏÏÏÏÏÏÏÏÏÏÏÏÏÏÏÏÏÏÏÏÏÏÏÏÏÏÏÏÏÏ 104,956 103,426 99,920 98,940 93,322Short-term borrowingsÏÏÏÏÏÏÏÏÏÏÏÏÏÏÏÏÏÏÏÏÏÏÏÏÏÏÏÏÏÏÏÏÏÏÏÏÏ 12,980 12,586 11,707 11,102 11,791Long-term debt ÏÏÏÏÏÏÏÏÏÏÏÏÏÏÏÏÏÏÏÏÏÏÏÏÏÏÏÏÏÏÏÏÏÏÏÏÏÏÏÏÏÏÏ 24,608 22,410 20,248 15,732 9,481Total shareholders' equityÏÏÏÏÏÏÏÏÏÏÏÏÏÏÏÏÏÏÏÏÏÏÏÏÏÏÏÏÏÏÏÏÏÏ 16,201 14,365 13,221 12,383 10,882
Year-end Balance SheetLoans ÏÏÏÏÏÏÏÏÏÏÏÏÏÏÏÏÏÏÏÏÏÏÏÏÏÏÏÏÏÏÏÏÏÏÏÏÏÏÏÏÏÏÏÏÏÏÏÏÏÏÏÏ $ 114,405 $ 122,365 $ 113,229 $ 106,958 $ 99,029Investment securities ÏÏÏÏÏÏÏÏÏÏÏÏÏÏÏÏÏÏÏÏÏÏÏÏÏÏÏÏÏÏÏÏÏÏÏÏÏÏ 26,608 17,642 17,449 20,965 20,442Assets ÏÏÏÏÏÏÏÏÏÏÏÏÏÏÏÏÏÏÏÏÏÏÏÏÏÏÏÏÏÏÏÏÏÏÏÏÏÏÏÏÏÏÏÏÏÏÏÏÏÏÏ 171,390 164,921 154,318 150,714 137,488DepositsÏÏÏÏÏÏÏÏÏÏÏÏÏÏÏÏÏÏÏÏÏÏÏÏÏÏÏÏÏÏÏÏÏÏÏÏÏÏÏÏÏÏÏÏÏÏÏÏÏÏ 105,219 109,535 103,417 104,346 98,323Long-term debt ÏÏÏÏÏÏÏÏÏÏÏÏÏÏÏÏÏÏÏÏÏÏÏÏÏÏÏÏÏÏÏÏÏÏÏÏÏÏÏÏÏÏÏ 25,716 21,876 21,027 18,679 13,181Total shareholders' equityÏÏÏÏÏÏÏÏÏÏÏÏÏÏÏÏÏÏÏÏÏÏÏÏÏÏÏÏÏÏÏÏÏÏ 16,461 15,168 13,947 12,574 11,402
(a) The Company analyzes its performance on a net income basis in accordance with accounting principles generally accepted in the United States, as well as on an operating basis
before merger and restructuring-related items referred to as ""operating earnings.'' Operating earnings are presented as supplemental information to enhance the readers'
understanding of, and highlight trends in, the Company's Ñnancial results excluding the impact of merger and restructuring-related items of speciÑc business acquisitions and
restructuring activities. Operating earnings should not be viewed as a substitute for net income and earnings per share as determined in accordance with accounting principles
generally accepted in the United States. Merger and restructuring-related items excluded from net income to derive operating earnings may be signiÑcant and may not be
comparable to other companies.
(b) Dividends per share have not been restated for the 2001 merger of Firstar and USBM.
(c) Without investment banking and brokerage activity.
eÅects of discrete business acquisitions and restructuring generally accepted in the United States. Merger and
activities. Operating earnings should not be viewed as a restructuring-related items excluded from net income to
substitute for net income and earnings per share as derive operating earnings may be signiÑcant and may not be
determined in accordance with accounting principles comparable to other companies.
U.S. Bancorp
Table 1
17

Reconciliation of Operating Earnings(a) to Net Income in Accordance with GAAP
Year Ended December 31 (Dollars in Millions) 2001 2000 1999 1998 1997
Operating earnings ÏÏÏÏÏÏÏÏÏÏÏÏÏÏÏÏÏÏÏÏÏÏÏÏÏÏÏÏÏÏÏÏÏÏÏÏÏÏÏÏ $ 2,550.8 $3,106.9 $2,799.0 $2,519.3 $2,123.9
Merger and restructuring-related items
Gains on the sale of branches ÏÏÏÏÏÏÏÏÏÏÏÏÏÏÏÏÏÏÏÏÏÏÏÏÏÏ 62.2 Ì Ì 48.1 Ì
Integration, conversion and other chargesÏÏÏÏÏÏÏÏÏÏÏÏÏÏÏÏ (946.4) (348.7) (355.1) (593.8) (633.0)
Securities losses to restructure portfolio ÏÏÏÏÏÏÏÏÏÏÏÏÏÏÏÏÏ Ì Ì (177.7) Ì Ì
Provision for credit losses(b) ÏÏÏÏÏÏÏÏÏÏÏÏÏÏÏÏÏÏÏÏÏÏÏÏÏÏÏ (382.2) Ì (7.5) (37.9) (20.3)
Pretax impactÏÏÏÏÏÏÏÏÏÏÏÏÏÏÏÏÏÏÏÏÏÏÏÏÏÏÏÏÏÏÏÏÏÏÏÏÏÏÏÏÏÏ (1,266.4) (348.7) (540.3) (583.6) (653.3)
Applicable tax beneÑtÏÏÏÏÏÏÏÏÏÏÏÏÏÏÏÏÏÏÏÏÏÏÏÏÏÏÏÏÏÏÏÏÏÏÏ 422.1 117.4 123.1 197.2 128.7
Net income in accordance with GAAPÏÏÏÏÏÏÏÏÏÏÏÏÏÏÏÏÏÏÏÏÏÏÏ $ 1,706.5 $2,875.6 $2,381.8 $2,132.9 $1,599.3
(a) The Company analyzes its performance on a net income basis in accordance with accounting principles generally accepted in the United States, as well as on an operating basis
before merger and restructuring-related items referred to as ""operating earnings.'' Operating earnings are presented as supplemental information to enhance the readers'
understanding of, and highlight trends in, the Company's Ñnancial results excluding the impact of merger and restructuring-related items of speciÑc business acquisitions and
restructuring activities. Operating earnings should not be viewed as a substitute for net income and earnings per share as determined in accordance with accounting principles
generally accepted in the United States. Merger and restructuring-related items excluded from net income to derive operating earnings may be signiÑcant and may not be
comparable to other companies.
(b) Provision for credit losses in 2001 includes losses of $201.3 million on the disposition of an unsecured small business credit line portfolio, losses of $76.6 million on the sales of
high loan-to-value home equity and indirect automobile loan portfolios, $90.0 million of charges to align credit policies and risk management practices, and $14.3 million to
restructure a co-branding credit card relationship.
Acquisition and Divestiture Activity In addition to stock was exchanged for 2.091 shares of Firstar common
restating all prior periods to reÖect the merger of Firstar stock. Refer to Note 3 and Note 4 of the Notes to
and USBM, operating results for 2001 reÖect the following Consolidated Financial Statements for additional
transactions accounted for as purchases from the date of information regarding business combinations.
completion. On July 24, 2001, the Company acquired On January 18, 2002, the Company announced a
NOVA, the nation's third largest merchant processing deÑnitive agreement to acquire The Leader Mortgage
service provider, in a stock and cash transaction valued at Company, LLC (""Leader''), a wholly owned subsidiary of
approximately $2.1 billion. On September 7, 2001, the First DeÑance Financial Corporation, in a cash transaction.
Company acquired PaciÑc Century Bank in a cash Leader specializes in acquiring servicing of loans originated
transaction. The acquisition included 20 branches located in for state and local housing authorities. Leader had
Southern California with approximately $712 million in $506 million in assets at December 31, 2001. In 2001, it
deposits and $570 million in loans. On October 13, 2000, had $2.1 billion in mortgage production and an $8.6 billion
the Company acquired Scripps Financial Corporation of San servicing portfolio at December 31, 2001. The transaction is
Diego, which had 10 branches in San Diego County and expected to close in the second quarter of 2002.
total assets of $650 million. On September 28, 2000, theSTATEMENT OF INCOME ANALYSIS
Company acquired Lyon Financial Services, Inc., a wholly
owned subsidiary of the privately held Schwan's Sales Net Interest Income Net interest income on a taxable-
Enterprises Inc. in Marshall, Minnesota. Lyon Financial equivalent basis was $6.5 billion in 2001, compared with
specializes in small-ticket lease transactions and had $6.1 billion in 2000 and $5.9 billion in 1999. The
$1.3 billion in assets. On April 7, 2000, the Company 5.4 percent increase in 2001 as compared with 2000 was
acquired Oliver-Allen Corporation, Inc., a privately held due to improving net interest margin and growth in average
information technology equipment leasing company with earning assets. The net interest margin in 2001 was
total assets of $280 million. On January 14, 2000, the 4.45 percent, compared with 4.36 percent in 2000. The
Company acquired Peninsula Bank of San Diego, which had improvement in the net interest margin was due to the
11 branches in San Diego County and total assets of funding beneÑt of the declining rate environment and
$491 million. In addition to these business combinations, improved spreads due to product re-pricing dynamics and
the Company purchased 41 branches in Tennessee from loan conduit activities. This was oÅset somewhat by the
First Union National Bank on December 8, 2000, Ñrst quarter 2001 sales of the high loan-to-value (""LTV'')
representing approximately $450 million in assets and home equity portfolios and lower yields on the investment
$1.8 billion in deposits. portfolio. Average earning assets for 2001 increased
On September 20, 1999, Firstar and Mercantile $4.6 billion (3.2 percent) over 2000. The increase was
Bancorporation, Inc. (""Mercantile'') merged in a pooling- primarily driven by increases in the investment portfolio,
of-interests transaction and accordingly all Ñnancial core retail loan growth and the impact of acquisitions. This
information has been restated to include the historical growth was partially oÅset by a $2.7 billion decline in
information of both companies. Each share of Mercantile lower margin residential mortgages and a $2.2 billion
U.S. Bancorp
Table 2
18

Analysis of Net Interest Income
2001 2000(Dollars in Millions) 2001 2000 1999 v 2000 v 1999
Components of net interest income
Income on earning assets ÏÏÏÏÏÏÏÏÏÏÏÏÏÏÏÏÏÏÏÏÏÏÏÏÏÏÏ $11,139.5 $12,157.9 $10,723.0 $(1,018.4) $1,434.9
Expenses on interest bearing liabilitiesÏÏÏÏÏÏÏÏÏÏÏÏÏÏÏÏ 4,674.8 6,022.9 4,790.3 (1,348.1) 1,232.6
Net interest income (taxable-equivalent basis) ÏÏÏÏÏÏÏÏÏÏÏ $ 6,464.7 $ 6,135.0 $ 5,932.7 $ 329.7 $ 202.3
Net interest income, as reported ÏÏÏÏÏÏÏÏÏÏÏÏÏÏÏÏÏÏÏÏÏÏÏÏ $ 6,408.8 $ 6,049.6 $ 5,836.4 $ 359.2 $ 213.2
Average yields and rates paid (taxable-equivalent basis)
Earning assets yieldÏÏÏÏÏÏÏÏÏÏÏÏÏÏÏÏÏÏÏÏÏÏÏÏÏÏÏÏÏÏÏÏÏ 7.67% 8.65% 8.02% (.98)% .63%
Rate paid on interest-bearing liabilitiesÏÏÏÏÏÏÏÏÏÏÏÏÏÏÏÏ 3.92 5.19 4.37 (1.27) .82
Gross interest margin ÏÏÏÏÏÏÏÏÏÏÏÏÏÏÏÏÏÏÏÏÏÏÏÏÏÏÏÏÏÏÏÏÏÏ 3.75% 3.46% 3.65% .29% (.19)%
Net interest marginÏÏÏÏÏÏÏÏÏÏÏÏÏÏÏÏÏÏÏÏÏÏÏÏÏÏÏÏÏÏÏÏÏÏÏÏÏ 4.45% 4.36% 4.44% .09% (.08)%
Average balances
Investment securitiesÏÏÏÏÏÏÏÏÏÏÏÏÏÏÏÏÏÏÏÏÏÏÏÏÏÏÏÏÏÏÏÏ $ 21,916 $ 17,311 $ 19,271 $ 4,605 $ (1,960)
LoansÏÏÏÏÏÏÏÏÏÏÏÏÏÏÏÏÏÏÏÏÏÏÏÏÏÏÏÏÏÏÏÏÏÏÏÏÏÏÏÏÏÏÏÏÏÏ 118,177 118,317 109,638 (140) 8,679
Earning assetsÏÏÏÏÏÏÏÏÏÏÏÏÏÏÏÏÏÏÏÏÏÏÏÏÏÏÏÏÏÏÏÏÏÏÏÏÏÏ 145,165 140,606 133,757 4,559 6,849
Interest-bearing liabilities ÏÏÏÏÏÏÏÏÏÏÏÏÏÏÏÏÏÏÏÏÏÏÏÏÏÏÏÏ 119,390 116,002 109,719 3,388 6,283
Net free funds(a)ÏÏÏÏÏÏÏÏÏÏÏÏÏÏÏÏÏÏÏÏÏÏÏÏÏÏÏÏÏÏÏÏÏÏÏ 25,775 24,604 24,038 1,171 566
(a) Represents noninterest-bearing deposits, allowance for credit losses, non-earning assets, other liabilities and equity.
reduction related to transfers of short-term, high credit increase in interest-bearing deposits was primarily due to a
quality, low margin commercial loans to Stellar Funding $4.2 billion increase (48.8 percent) in time deposits greater
Group, Inc. (""loan conduit''). than $100,000 reÖecting the rising interest rate environment
Average investment securities were $4.6 billion during 2000. Average net free funds increased $566 million
(26.6 percent) higher in 2001 compared with 2000, in 2000 including an increase in noninterest-bearing deposits
reÖecting net purchases of securities. of $264 million (1.1 percent) compared with 1999. The net
Average interest-bearing deposits increased $241 million interest margin declined from 4.44 percent in 1999 to
(.3 percent) from 2000. Growth in average interest 4.36 percent in 2000, as lagging deposit growth in 2000
checking and money market deposits was more than oÅset relative to total earning assets increased the Company's
by reductions in the average balances of higher cost time incremental cost of funding. Refer to the Consolidated
certiÑcates of deposit less than $100,000. The decline in Daily Average Balance Sheet and Related Yields and Rates
time certiÑcates of deposit less than $100,000 reÖects on pages 86 and 87 for further interest margin detail.
funding decisions toward more favorably priced wholesaleProvision for Credit Losses The provision for credit
funding sources given the interest rate environment duringlosses is recorded to bring the allowance for credit losses to
2001.a level deemed appropriate by management based on
Average net free funds increased $1.2 billion from afactors discussed in ""Analysis and Determination of
year ago including an increase in noninterest-bearingAllowance for Credit Losses'' on pages 34 through 36.
deposits of $1.3 billion (5.4 percent) compared with 2000.During 2001, the provision for credit losses was
Net interest income on a taxable-equivalent basis$2,528.8 million, compared with $828.0 million in 2000 and
increased $202.3 million (3.4 percent) in 2000 compared$646.0 million in 1999.
with 1999. The increase was primarily due to growth inIncluded in the provision for credit losses for 2001 was
earning assets oÅset somewhat by a declining net interesta merger and restructuring-related provision of
margin. Average earning assets increased $6.8 billion$382.2 million. The merger and restructuring-related
(5.1 percent) in 2000, primarily due to strong core loanprovision consisted of: a $201.3 million provision for losses
growth and acquisitions partially oÅset by reductions inrelated to the disposition of an unsecured small business
residential mortgages and securities. Average loans for 2000product; a $90.0 million charge to align risk management
were up $8.7 billion (7.9 percent) from 1999, reÖectingpractices, align charge-oÅ policies and expedite the
growth in commercial loans, retail loans, and acquisitions,transition out of a speciÑc segment of the healthcare
oÅset by reductions in residential mortgage loans. Averageindustry not meeting the risk appetite of the Company; a
investment securities were $2.0 billion (10.2 percent) lower$76.6 million provision for losses related to the sales of
in 2000 compared with 1999, reÖecting both maturities andhigh LTV home equity loans and the indirect automobile
sales of securities. Average interest-bearing depositsloan portfolio of USBM; and a $14.3 million charge related
increased $3.2 billion (4.2 percent) from 1999. This
U.S. Bancorp
Table 3
19
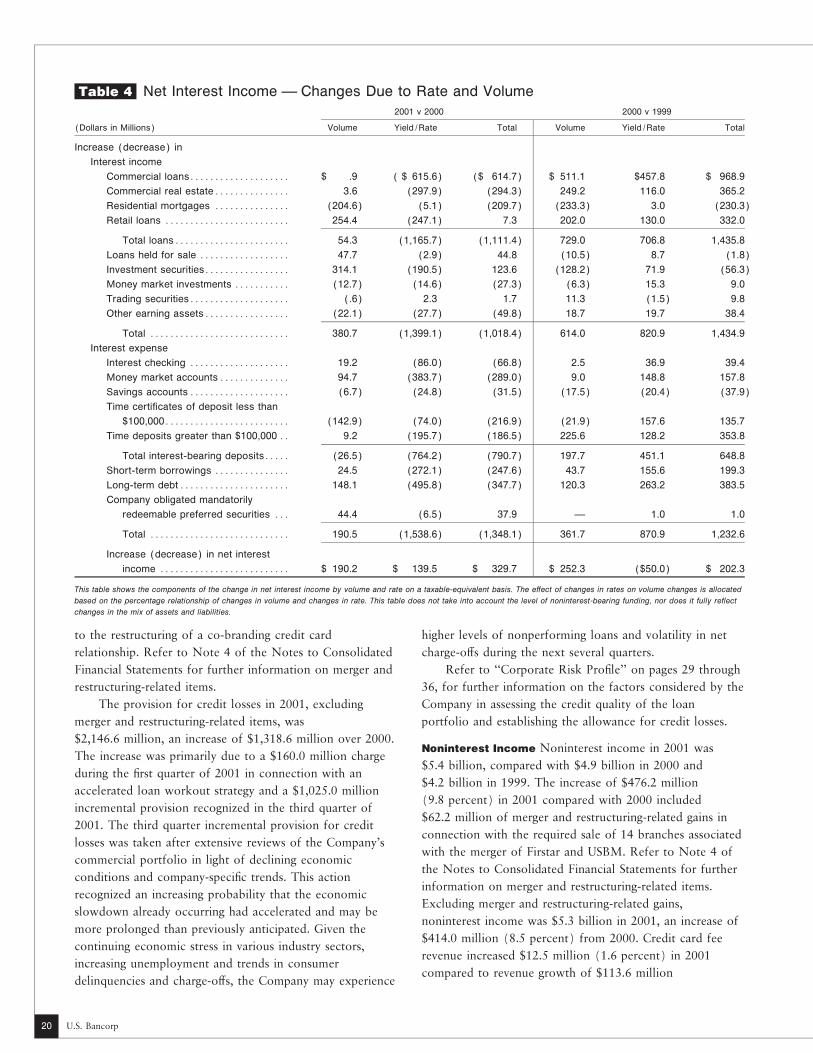
Net Interest Income Ì Changes Due to Rate and Volume
2001 v 2000 2000 v 1999
(Dollars in Millions) Volume Yield/Rate Total Volume Yield/Rate Total
Increase (decrease) in
Interest income
Commercial loansÏÏÏÏÏÏÏÏÏÏÏÏÏÏÏÏÏÏÏÏ $ .9 ( $ 615.6) ($ 614.7) $ 511.1 $457.8 $ 968.9
Commercial real estateÏÏÏÏÏÏÏÏÏÏÏÏÏÏÏ 3.6 (297.9) (294.3) 249.2 116.0 365.2
Residential mortgages ÏÏÏÏÏÏÏÏÏÏÏÏÏÏÏ (204.6) (5.1) (209.7) (233.3) 3.0 (230.3)
Retail loans ÏÏÏÏÏÏÏÏÏÏÏÏÏÏÏÏÏÏÏÏÏÏÏÏÏ 254.4 (247.1) 7.3 202.0 130.0 332.0
Total loansÏÏÏÏÏÏÏÏÏÏÏÏÏÏÏÏÏÏÏÏÏÏÏ 54.3 (1,165.7) (1,111.4) 729.0 706.8 1,435.8
Loans held for sale ÏÏÏÏÏÏÏÏÏÏÏÏÏÏÏÏÏÏ 47.7 (2.9) 44.8 (10.5) 8.7 (1.8)
Investment securitiesÏÏÏÏÏÏÏÏÏÏÏÏÏÏÏÏÏ 314.1 (190.5) 123.6 (128.2) 71.9 (56.3)
Money market investments ÏÏÏÏÏÏÏÏÏÏÏ (12.7) (14.6) (27.3) (6.3) 15.3 9.0
Trading securitiesÏÏÏÏÏÏÏÏÏÏÏÏÏÏÏÏÏÏÏÏ (.6) 2.3 1.7 11.3 (1.5) 9.8
Other earning assetsÏÏÏÏÏÏÏÏÏÏÏÏÏÏÏÏÏ (22.1) (27.7) (49.8) 18.7 19.7 38.4
Total ÏÏÏÏÏÏÏÏÏÏÏÏÏÏÏÏÏÏÏÏÏÏÏÏÏÏÏÏ 380.7 (1,399.1) (1,018.4) 614.0 820.9 1,434.9
Interest expense
Interest checking ÏÏÏÏÏÏÏÏÏÏÏÏÏÏÏÏÏÏÏÏ 19.2 (86.0) (66.8) 2.5 36.9 39.4
Money market accountsÏÏÏÏÏÏÏÏÏÏÏÏÏÏ 94.7 (383.7) (289.0) 9.0 148.8 157.8
Savings accounts ÏÏÏÏÏÏÏÏÏÏÏÏÏÏÏÏÏÏÏÏ (6.7) (24.8) (31.5) (17.5) (20.4) (37.9)
Time certiÑcates of deposit less than
$100,000ÏÏÏÏÏÏÏÏÏÏÏÏÏÏÏÏÏÏÏÏÏÏÏÏÏ (142.9) (74.0) (216.9) (21.9) 157.6 135.7
Time deposits greater than $100,000 ÏÏ 9.2 (195.7) (186.5) 225.6 128.2 353.8
Total interest-bearing depositsÏÏÏÏÏ (26.5) (764.2) (790.7) 197.7 451.1 648.8
Short-term borrowings ÏÏÏÏÏÏÏÏÏÏÏÏÏÏÏ 24.5 (272.1) (247.6) 43.7 155.6 199.3
Long-term debtÏÏÏÏÏÏÏÏÏÏÏÏÏÏÏÏÏÏÏÏÏÏ 148.1 (495.8) (347.7) 120.3 263.2 383.5
Company obligated mandatorily
redeemable preferred securities ÏÏÏ 44.4 (6.5) 37.9 Ì 1.0 1.0
Total ÏÏÏÏÏÏÏÏÏÏÏÏÏÏÏÏÏÏÏÏÏÏÏÏÏÏÏÏ 190.5 (1,538.6) (1,348.1) 361.7 870.9 1,232.6
Increase (decrease) in net interest
income ÏÏÏÏÏÏÏÏÏÏÏÏÏÏÏÏÏÏÏÏÏÏÏÏÏÏ $ 190.2 $ 139.5 $ 329.7 $ 252.3 ($50.0) $ 202.3
This table shows the components of the change in net interest income by volume and rate on a taxable-equivalent basis. The eÅect of changes in rates on volume changes is allocated
based on the percentage relationship of changes in volume and changes in rate. This table does not take into account the level of noninterest-bearing funding, nor does it fully reÖect
changes in the mix of assets and liabilities.
to the restructuring of a co-branding credit card higher levels of nonperforming loans and volatility in net
relationship. Refer to Note 4 of the Notes to Consolidated charge-oÅs during the next several quarters.
Financial Statements for further information on merger and Refer to ""Corporate Risk ProÑle'' on pages 29 through
restructuring-related items. 36, for further information on the factors considered by the
The provision for credit losses in 2001, excluding Company in assessing the credit quality of the loan
merger and restructuring-related items, was portfolio and establishing the allowance for credit losses.
$2,146.6 million, an increase of $1,318.6 million over 2000.Noninterest Income Noninterest income in 2001 was
The increase was primarily due to a $160.0 million charge$5.4 billion, compared with $4.9 billion in 2000 and
during the Ñrst quarter of 2001 in connection with an$4.2 billion in 1999. The increase of $476.2 million
accelerated loan workout strategy and a $1,025.0 million(9.8 percent) in 2001 compared with 2000 included
incremental provision recognized in the third quarter of$62.2 million of merger and restructuring-related gains in
2001. The third quarter incremental provision for creditconnection with the required sale of 14 branches associated
losses was taken after extensive reviews of the Company'swith the merger of Firstar and USBM. Refer to Note 4 of
commercial portfolio in light of declining economicthe Notes to Consolidated Financial Statements for further
conditions and company-speciÑc trends. This actioninformation on merger and restructuring-related items.
recognized an increasing probability that the economicExcluding merger and restructuring-related gains,
slowdown already occurring had accelerated and may benoninterest income was $5.3 billion in 2001, an increase of
more prolonged than previously anticipated. Given the$414.0 million (8.5 percent) from 2000. Credit card fee
continuing economic stress in various industry sectors,revenue increased $12.5 million (1.6 percent) in 2001
increasing unemployment and trends in consumercompared to revenue growth of $113.6 million
delinquencies and charge-oÅs, the Company may experience
U.S. Bancorp
Table 4
20
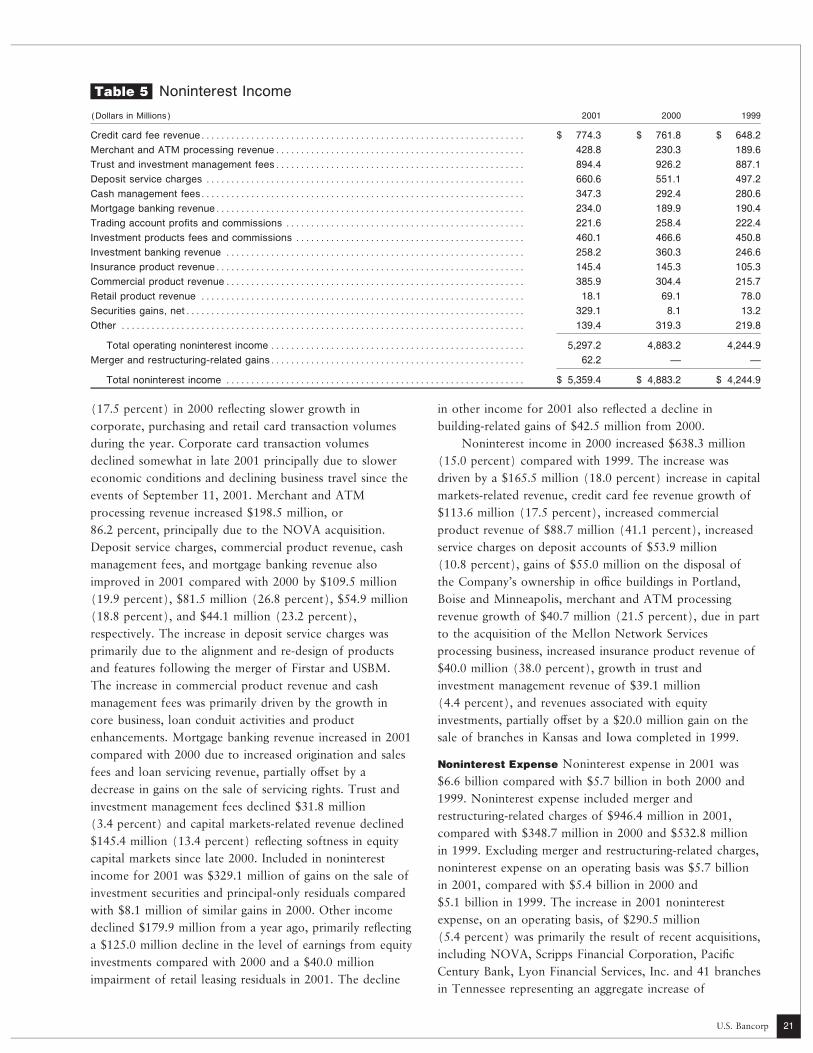
Noninterest Income
(Dollars in Millions) 2001 2000 1999
Credit card fee revenueÏÏÏÏÏÏÏÏÏÏÏÏÏÏÏÏÏÏÏÏÏÏÏÏÏÏÏÏÏÏÏÏÏÏÏÏÏÏÏÏÏÏÏÏÏÏÏÏÏÏÏÏÏÏÏÏÏÏÏÏÏÏÏÏÏ $ 774.3 $ 761.8 $ 648.2
Merchant and ATM processing revenueÏÏÏÏÏÏÏÏÏÏÏÏÏÏÏÏÏÏÏÏÏÏÏÏÏÏÏÏÏÏÏÏÏÏÏÏÏÏÏÏÏÏÏÏÏÏÏÏÏÏ 428.8 230.3 189.6
Trust and investment management feesÏÏÏÏÏÏÏÏÏÏÏÏÏÏÏÏÏÏÏÏÏÏÏÏÏÏÏÏÏÏÏÏÏÏÏÏÏÏÏÏÏÏÏÏÏÏÏÏÏÏ 894.4 926.2 887.1
Deposit service charges ÏÏÏÏÏÏÏÏÏÏÏÏÏÏÏÏÏÏÏÏÏÏÏÏÏÏÏÏÏÏÏÏÏÏÏÏÏÏÏÏÏÏÏÏÏÏÏÏÏÏÏÏÏÏÏÏÏÏÏÏÏÏÏÏ 660.6 551.1 497.2
Cash management feesÏÏÏÏÏÏÏÏÏÏÏÏÏÏÏÏÏÏÏÏÏÏÏÏÏÏÏÏÏÏÏÏÏÏÏÏÏÏÏÏÏÏÏÏÏÏÏÏÏÏÏÏÏÏÏÏÏÏÏÏÏÏÏÏÏ 347.3 292.4 280.6
Mortgage banking revenueÏÏÏÏÏÏÏÏÏÏÏÏÏÏÏÏÏÏÏÏÏÏÏÏÏÏÏÏÏÏÏÏÏÏÏÏÏÏÏÏÏÏÏÏÏÏÏÏÏÏÏÏÏÏÏÏÏÏÏÏÏÏ 234.0 189.9 190.4
Trading account proÑts and commissions ÏÏÏÏÏÏÏÏÏÏÏÏÏÏÏÏÏÏÏÏÏÏÏÏÏÏÏÏÏÏÏÏÏÏÏÏÏÏÏÏÏÏÏÏÏÏÏÏ 221.6 258.4 222.4
Investment products fees and commissions ÏÏÏÏÏÏÏÏÏÏÏÏÏÏÏÏÏÏÏÏÏÏÏÏÏÏÏÏÏÏÏÏÏÏÏÏÏÏÏÏÏÏÏÏÏÏ 460.1 466.6 450.8
Investment banking revenue ÏÏÏÏÏÏÏÏÏÏÏÏÏÏÏÏÏÏÏÏÏÏÏÏÏÏÏÏÏÏÏÏÏÏÏÏÏÏÏÏÏÏÏÏÏÏÏÏÏÏÏÏÏÏÏÏÏÏÏÏ 258.2 360.3 246.6
Insurance product revenueÏÏÏÏÏÏÏÏÏÏÏÏÏÏÏÏÏÏÏÏÏÏÏÏÏÏÏÏÏÏÏÏÏÏÏÏÏÏÏÏÏÏÏÏÏÏÏÏÏÏÏÏÏÏÏÏÏÏÏÏÏÏ 145.4 145.3 105.3
Commercial product revenueÏÏÏÏÏÏÏÏÏÏÏÏÏÏÏÏÏÏÏÏÏÏÏÏÏÏÏÏÏÏÏÏÏÏÏÏÏÏÏÏÏÏÏÏÏÏÏÏÏÏÏÏÏÏÏÏÏÏÏÏ 385.9 304.4 215.7
Retail product revenue ÏÏÏÏÏÏÏÏÏÏÏÏÏÏÏÏÏÏÏÏÏÏÏÏÏÏÏÏÏÏÏÏÏÏÏÏÏÏÏÏÏÏÏÏÏÏÏÏÏÏÏÏÏÏÏÏÏÏÏÏÏÏÏÏÏ 18.1 69.1 78.0
Securities gains, netÏÏÏÏÏÏÏÏÏÏÏÏÏÏÏÏÏÏÏÏÏÏÏÏÏÏÏÏÏÏÏÏÏÏÏÏÏÏÏÏÏÏÏÏÏÏÏÏÏÏÏÏÏÏÏÏÏÏÏÏÏÏÏÏÏÏÏÏ 329.1 8.1 13.2
Other ÏÏÏÏÏÏÏÏÏÏÏÏÏÏÏÏÏÏÏÏÏÏÏÏÏÏÏÏÏÏÏÏÏÏÏÏÏÏÏÏÏÏÏÏÏÏÏÏÏÏÏÏÏÏÏÏÏÏÏÏÏÏÏÏÏÏÏÏÏÏÏÏÏÏÏÏÏÏÏÏÏ 139.4 319.3 219.8
Total operating noninterest income ÏÏÏÏÏÏÏÏÏÏÏÏÏÏÏÏÏÏÏÏÏÏÏÏÏÏÏÏÏÏÏÏÏÏÏÏÏÏÏÏÏÏÏÏÏÏÏÏÏÏÏ 5,297.2 4,883.2 4,244.9
Merger and restructuring-related gainsÏÏÏÏÏÏÏÏÏÏÏÏÏÏÏÏÏÏÏÏÏÏÏÏÏÏÏÏÏÏÏÏÏÏÏÏÏÏÏÏÏÏÏÏÏÏÏÏÏÏÏ 62.2 Ì Ì
Total noninterest income ÏÏÏÏÏÏÏÏÏÏÏÏÏÏÏÏÏÏÏÏÏÏÏÏÏÏÏÏÏÏÏÏÏÏÏÏÏÏÏÏÏÏÏÏÏÏÏÏÏÏÏÏÏÏÏÏÏÏÏÏ $ 5,359.4 $ 4,883.2 $ 4,244.9
(17.5 percent) in 2000 reÖecting slower growth in in other income for 2001 also reÖected a decline in
corporate, purchasing and retail card transaction volumes building-related gains of $42.5 million from 2000.
during the year. Corporate card transaction volumes Noninterest income in 2000 increased $638.3 million
declined somewhat in late 2001 principally due to slower (15.0 percent) compared with 1999. The increase was
economic conditions and declining business travel since the driven by a $165.5 million (18.0 percent) increase in capital
events of September 11, 2001. Merchant and ATM markets-related revenue, credit card fee revenue growth of
processing revenue increased $198.5 million, or $113.6 million (17.5 percent), increased commercial
86.2 percent, principally due to the NOVA acquisition. product revenue of $88.7 million (41.1 percent), increased
Deposit service charges, commercial product revenue, cash service charges on deposit accounts of $53.9 million
management fees, and mortgage banking revenue also (10.8 percent), gains of $55.0 million on the disposal of
improved in 2001 compared with 2000 by $109.5 million the Company's ownership in oÇce buildings in Portland,
(19.9 percent), $81.5 million (26.8 percent), $54.9 million Boise and Minneapolis, merchant and ATM processing
(18.8 percent), and $44.1 million (23.2 percent), revenue growth of $40.7 million (21.5 percent), due in part
respectively. The increase in deposit service charges was to the acquisition of the Mellon Network Services
primarily due to the alignment and re-design of products processing business, increased insurance product revenue of
and features following the merger of Firstar and USBM. $40.0 million (38.0 percent), growth in trust and
The increase in commercial product revenue and cash investment management revenue of $39.1 million
management fees was primarily driven by the growth in (4.4 percent), and revenues associated with equity
core business, loan conduit activities and product investments, partially oÅset by a $20.0 million gain on the
enhancements. Mortgage banking revenue increased in 2001 sale of branches in Kansas and Iowa completed in 1999.
compared with 2000 due to increased origination and salesNoninterest Expense Noninterest expense in 2001 was
fees and loan servicing revenue, partially oÅset by a$6.6 billion compared with $5.7 billion in both 2000 and
decrease in gains on the sale of servicing rights. Trust and1999. Noninterest expense included merger and
investment management fees declined $31.8 millionrestructuring-related charges of $946.4 million in 2001,
(3.4 percent) and capital markets-related revenue declinedcompared with $348.7 million in 2000 and $532.8 million
$145.4 million (13.4 percent) reÖecting softness in equityin 1999. Excluding merger and restructuring-related charges,
capital markets since late 2000. Included in noninterestnoninterest expense on an operating basis was $5.7 billion
income for 2001 was $329.1 million of gains on the sale ofin 2001, compared with $5.4 billion in 2000 and
investment securities and principal-only residuals compared$5.1 billion in 1999. The increase in 2001 noninterest
with $8.1 million of similar gains in 2000. Other incomeexpense, on an operating basis, of $290.5 million
declined $179.9 million from a year ago, primarily reÖecting(5.4 percent) was primarily the result of recent acquisitions,
a $125.0 million decline in the level of earnings from equityincluding NOVA, Scripps Financial Corporation, PaciÑc
investments compared with 2000 and a $40.0 millionCentury Bank, Lyon Financial Services, Inc. and 41 branches
impairment of retail leasing residuals in 2001. The declinein Tennessee representing an aggregate increase of
U.S. Bancorp
Table 5
21

Noninterest Expense
(Dollars in Millions) 2001 2000 1999
Salaries ÏÏÏÏÏÏÏÏÏÏÏÏÏÏÏÏÏÏÏÏÏÏÏÏÏÏÏÏÏÏÏÏÏÏÏÏÏÏÏÏÏÏÏÏÏÏÏÏÏÏÏÏÏÏÏÏÏÏÏÏÏÏÏÏÏÏÏÏÏÏÏÏÏÏÏÏÏÏÏÏ $2,347.1 $2,427.1 $2,355.3
Employee beneÑtsÏÏÏÏÏÏÏÏÏÏÏÏÏÏÏÏÏÏÏÏÏÏÏÏÏÏÏÏÏÏÏÏÏÏÏÏÏÏÏÏÏÏÏÏÏÏÏÏÏÏÏÏÏÏÏÏÏÏÏÏÏÏÏÏÏÏÏÏÏÏÏ 366.2 399.8 410.1
Net occupancy ÏÏÏÏÏÏÏÏÏÏÏÏÏÏÏÏÏÏÏÏÏÏÏÏÏÏÏÏÏÏÏÏÏÏÏÏÏÏÏÏÏÏÏÏÏÏÏÏÏÏÏÏÏÏÏÏÏÏÏÏÏÏÏÏÏÏÏÏÏÏÏÏÏÏ 417.9 396.9 371.8
Furniture and equipment ÏÏÏÏÏÏÏÏÏÏÏÏÏÏÏÏÏÏÏÏÏÏÏÏÏÏÏÏÏÏÏÏÏÏÏÏÏÏÏÏÏÏÏÏÏÏÏÏÏÏÏÏÏÏÏÏÏÏÏÏÏÏÏÏÏ 305.5 308.2 307.9
Professional services ÏÏÏÏÏÏÏÏÏÏÏÏÏÏÏÏÏÏÏÏÏÏÏÏÏÏÏÏÏÏÏÏÏÏÏÏÏÏÏÏÏÏÏÏÏÏÏÏÏÏÏÏÏÏÏÏÏÏÏÏÏÏÏÏÏÏÏÏ 123.8 109.0 95.7
Advertising and marketing ÏÏÏÏÏÏÏÏÏÏÏÏÏÏÏÏÏÏÏÏÏÏÏÏÏÏÏÏÏÏÏÏÏÏÏÏÏÏÏÏÏÏÏÏÏÏÏÏÏÏÏÏÏÏÏÏÏÏÏÏÏÏÏ 121.6 122.1 124.1
Travel and entertainment ÏÏÏÏÏÏÏÏÏÏÏÏÏÏÏÏÏÏÏÏÏÏÏÏÏÏÏÏÏÏÏÏÏÏÏÏÏÏÏÏÏÏÏÏÏÏÏÏÏÏÏÏÏÏÏÏÏÏÏÏÏÏÏÏ 90.6 107.0 88.4
Software ÏÏÏÏÏÏÏÏÏÏÏÏÏÏÏÏÏÏÏÏÏÏÏÏÏÏÏÏÏÏÏÏÏÏÏÏÏÏÏÏÏÏÏÏÏÏÏÏÏÏÏÏÏÏÏÏÏÏÏÏÏÏÏÏÏÏÏÏÏÏÏÏÏÏÏÏÏÏÏ 136.1 111.9 72.2
Data processingÏÏÏÏÏÏÏÏÏÏÏÏÏÏÏÏÏÏÏÏÏÏÏÏÏÏÏÏÏÏÏÏÏÏÏÏÏÏÏÏÏÏÏÏÏÏÏÏÏÏÏÏÏÏÏÏÏÏÏÏÏÏÏÏÏÏÏÏÏÏÏÏÏ 80.0 149.7 133.7
Communication ÏÏÏÏÏÏÏÏÏÏÏÏÏÏÏÏÏÏÏÏÏÏÏÏÏÏÏÏÏÏÏÏÏÏÏÏÏÏÏÏÏÏÏÏÏÏÏÏÏÏÏÏÏÏÏÏÏÏÏÏÏÏÏÏÏÏÏÏÏÏÏÏÏ 181.4 138.8 123.4
Postage ÏÏÏÏÏÏÏÏÏÏÏÏÏÏÏÏÏÏÏÏÏÏÏÏÏÏÏÏÏÏÏÏÏÏÏÏÏÏÏÏÏÏÏÏÏÏÏÏÏÏÏÏÏÏÏÏÏÏÏÏÏÏÏÏÏÏÏÏÏÏÏÏÏÏÏÏÏÏÏÏ 179.8 174.5 170.7
PrintingÏÏÏÏÏÏÏÏÏÏÏÏÏÏÏÏÏÏÏÏÏÏÏÏÏÏÏÏÏÏÏÏÏÏÏÏÏÏÏÏÏÏÏÏÏÏÏÏÏÏÏÏÏÏÏÏÏÏÏÏÏÏÏÏÏÏÏÏÏÏÏÏÏÏÏÏÏÏÏÏÏ 77.9 86.5 90.7
GoodwillÏÏÏÏÏÏÏÏÏÏÏÏÏÏÏÏÏÏÏÏÏÏÏÏÏÏÏÏÏÏÏÏÏÏÏÏÏÏÏÏÏÏÏÏÏÏÏÏÏÏÏÏÏÏÏÏÏÏÏÏÏÏÏÏÏÏÏÏÏÏÏÏÏÏÏÏÏÏÏÏ 251.1 235.0 175.8
Other intangible assets ÏÏÏÏÏÏÏÏÏÏÏÏÏÏÏÏÏÏÏÏÏÏÏÏÏÏÏÏÏÏÏÏÏÏÏÏÏÏÏÏÏÏÏÏÏÏÏÏÏÏÏÏÏÏÏÏÏÏÏÏÏÏÏÏÏÏ 278.4 157.3 154.0
OtherÏÏÏÏÏÏÏÏÏÏÏÏÏÏÏÏÏÏÏÏÏÏÏÏÏÏÏÏÏÏÏÏÏÏÏÏÏÏÏÏÏÏÏÏÏÏÏÏÏÏÏÏÏÏÏÏÏÏÏÏÏÏÏÏÏÏÏÏÏÏÏÏÏÏÏÏÏÏÏÏÏÏÏ 701.4 444.5 454.7
Total operating noninterest expense ÏÏÏÏÏÏÏÏÏÏÏÏÏÏÏÏÏÏÏÏÏÏÏÏÏÏÏÏÏÏÏÏÏÏÏÏÏÏÏÏÏÏÏÏÏÏÏÏÏÏÏ 5,658.8 5,368.3 5,128.5
Merger and restructuring-related charges ÏÏÏÏÏÏÏÏÏÏÏÏÏÏÏÏÏÏÏÏÏÏÏÏÏÏÏÏÏÏÏÏÏÏÏÏÏÏÏÏÏÏÏÏÏÏÏÏÏ 946.4 348.7 532.8
Total noninterest expense ÏÏÏÏÏÏÏÏÏÏÏÏÏÏÏÏÏÏÏÏÏÏÏÏÏÏÏÏÏÏÏÏÏÏÏÏÏÏÏÏÏÏÏÏÏÏÏÏÏÏÏÏÏÏÏÏÏÏÏÏ $6,605.2 $5,717.0 $5,661.3
EÇciency ratio(a)ÏÏÏÏÏÏÏÏÏÏÏÏÏÏÏÏÏÏÏÏÏÏÏÏÏÏÏÏÏÏÏÏÏÏÏÏÏÏÏÏÏÏÏÏÏÏÏÏÏÏÏÏÏÏÏÏÏÏÏÏÏÏÏÏÏÏÏÏÏÏÏ 57.5% 51.9% 55.7%
EÇciency ratio, before merger and restructuring-related items ÏÏÏÏÏÏÏÏÏÏÏÏÏÏÏÏÏÏÏÏÏÏÏÏÏÏÏÏÏÏ 49.5 48.8 50.5
Banking eÇciency ratio, before merger and restructuring-related items(b)ÏÏÏÏÏÏÏÏÏÏÏÏÏÏÏÏÏÏÏ 45.2 43.5 46.3
(a) Computed as noninterest expense divided by the sum of net interest income on a taxable-equivalent basis and noninterest income excluding securities gains (losses), net
(b) Without investment banking and brokerage activity.
approximately $241.7 million. In addition to the impact of ratio in 2000 compared with 1999 reÖects the results of
acquisitions, noninterest expense increased over 2000 due to integrating acquired banking businesses.
recognition of mortgage servicing rights (""MSR'')Merger and Restructuring-Related Items The Company
impairments of $60.8 million related to increasing mortgageincurred merger and restructuring-related items in each of
prepayments during the declining rate environment, andthe last three years in conjunction with its acquisitions. In
asset write-downs of $52.6 million related to commercial2001, merger and restructuring-related items included in
leasing partnerships and repossessed tractor/trailer property.pretax earnings were $1,266.4 million, including
These increases were partially oÅset by a reduction in$382.2 million in the provision for credit losses, a
expenses related to capital markets activity of$62.2 million gain on the required sale of branches and
$108.0 million and cost savings related to merger and$946.4 million of noninterest expense. The total merger and
restructuring-related activities.restructuring-related items consisted of $1,167.2 million
The increase in 2000 noninterest expenses, on anrelated to the Firstar and USBM merger, $50.7 million of
operating basis, of $239.8 million (4.7 percent) wasrestructuring expenses for U.S. Bancorp Piper JaÅray and
primarily attributed to growth in expenses related to$48.5 million related to NOVA and other acquisitions.
investment banking and brokerage activity ofWith respect to the Firstar and USBM merger, the
$228.6 million, the impact of purchase acquisitions and$1,167.2 million of merger and restructuring-related items
divestitures of $175.9 million and planned spending onincluded $268.2 million for severance and employee-related
service-quality technology and other customer servicecosts and $477.6 million of charges to exit business lines
initiatives of USBM. These increases were somewhat oÅsetand products, sell credit portfolios or otherwise realign
by cost savings related to the integration of Mercantile.business practices in the new Company. The Company also
The eÇciency ratio before merger-related chargesincurred $208.1 million of systems conversion and business
increased slightly to 49.5 percent in 2001 compared withintegration costs, $48.7 million for lease cancellation and
48.8 percent in 2000 and 50.5 percent in 1999. The bankingother building-related costs, $226.8 million for transaction
eÇciency ratio before merger-related charges wascosts, funding a charitable foundation to reaÇrm a
45.2 percent for 2001, compared with 43.5 percent in 2000commitment to its markets and other costs, and a
and 46.3 percent in 1999. Both the eÇciency ratio and the$62.2 million gain related to the required sale of branches.
banking eÇciency ratio increased in 2001 primarily due toTotal merger and restructuring-related items associated with
the NOVA acquisition. The improved banking eÇciencythe Firstar and USBM merger are expected to reach
U.S. Bancorp
Table 6
22

Loan Portfolio Distribution
2001 2000 1999 1998 1997
Percent Percent Percent Percent PercentAt December 31 (Dollars in Millions) Amount of Total Amount of Total Amount of Total Amount of Total Amount of Total
Commercial
CommercialÏÏÏÏÏÏÏÏÏÏÏÏÏÏÏÏÏÏÏÏÏÏ $ 40,472 35.4% $ 47,041 38.5% $ 42,021 37.1% $ 37,777 35.3% $33,662 34.0%
Lease Ñnancing ÏÏÏÏÏÏÏÏÏÏÏÏÏÏÏÏÏÏ 5,858 5.1 5,776 4.7 3,835 3.4 3,291 3.1 2,667 2.7
Total commercial ÏÏÏÏÏÏÏÏÏÏ 46,330 40.5 52,817 43.2 45,856 40.5 41,068 38.4 36,329 36.7
Commercial real estate
Commercial mortgages ÏÏÏÏÏÏÏÏÏÏÏ 18,765 16.4 19,466 15.9 18,636 16.5 16,602 15.5 15,739 15.9
Construction and development ÏÏÏÏ 6,608 5.8 6,977 5.7 6,506 5.7 5,206 4.9 4,059 4.1
Total commercial real estateÏÏ 25,373 22.2 26,443 21.6 25,142 22.2 21,808 20.4 19,798 20.0
Residential mortgages ÏÏÏÏÏÏÏÏÏ 5,746 5.0 7,753 6.3 11,395 10.1 13,980 13.1 15,892 16.0
Retail
Credit card ÏÏÏÏÏÏÏÏÏÏÏÏÏÏÏÏÏÏÏÏÏÏ 5,889 5.1 6,012 4.9 5,004 4.4 4,856 4.5 4,993 5.1
Retail leasing ÏÏÏÏÏÏÏÏÏÏÏÏÏÏÏÏÏÏÏÏ 4,906 4.3 4,153 3.4 2,123 1.9 1,621 1.5 1,087 1.1
Other retail
Home equity and second
mortgage ÏÏÏÏÏÏÏÏÏÏÏÏÏÏÏÏÏ 14,318 12.5 13,600 11.1 * * * * * *
Revolving credit ÏÏÏÏÏÏÏÏÏÏÏÏÏÏ 2,673 2.3 2,750 2.2 * * * * * *
Installment ÏÏÏÏÏÏÏÏÏÏÏÏÏÏÏÏÏÏÏ 2,292 2.0 2,186 1.8 * * * * * *
Automobile ÏÏÏÏÏÏÏÏÏÏÏÏÏÏÏÏÏÏÏ 5,660 5.0 5,609 4.6 * * * * * *
Student ÏÏÏÏÏÏÏÏÏÏÏÏÏÏÏÏÏÏÏÏÏÏ 1,218 1.1 1,042 .9 * * * * * *
Total other retailÏÏÏÏÏÏÏÏ 26,161 22.9 25,187 20.6 23,709 20.9 23,625 22.1 20,930 21.1
Total retail ÏÏÏÏÏÏÏÏÏÏÏÏÏÏÏÏ 36,956 32.3 35,352 28.9 30,836 27.2 30,102 28.1 27,010 27.3
Total loansÏÏÏÏÏÏÏÏÏÏÏÏÏ $114,405 100.0% $122,365 100.0% $113,229 100.0% $106,958 100.0% $99,029 100.0%
*Information not available
$1.4 billion with integration activities substantively being and $27.4 million primarily related to other acquisitions by
completed in the third quarter of 2002. USBM. Included in merger and restructuring-related items
In response to signiÑcant changes in the securities were $149.6 for severance and employee-related costs,
markets during 2001, including increased volatility, changes $132.5 million for systems conversions, $177.7 million
in equity valuations and the increasingly competitive related to the restructuring of Mercantile's securities
environment for the industry, U.S. Bancorp Piper JaÅray portfolio, $6.2 million for lease cancellations and other
restructured it operations. The restructuring is expected to building-related costs and $66.8 million to fund charitable
improve the operating eÇciency of the business by foundations and other business integration costs.
removing excess capacity from its product distribution Refer to Note 3 and Note 4 of the Notes to
network and by implementing more eÅective business Consolidated Financial Statements for further information
processes. These restructuring activities were completed in on these acquired businesses and merger and restructuring-
2001. related items.
In 2000, merger and restructuring-related itemsIncome Tax Expense The provision for income taxes was
included noninterest expenses consisting of $227.0 million$927.7 million in 2001, compared with $1,512.2 million in
related to the merger of Firstar and Mercantile,2000 and $1,392.2 million in 1999. The Company's eÅective
$52.6 million related to the merger of Firstar and Star Banctax rate was 35.2 percent in 2001, compared with
and $69.1 million primarily related to other acquisitions of34.5 percent in 2000 and 36.9 percent in 1999. The
USBM. Included in merger and restructuring-related itemseÅective tax rate increased in 2001 compared with 2000
were $59.4 for severance and employee-related costs,primarily due to a decline in tax-exempt interest related to
$193.5 million for systems conversions, $47.3 million forsales of investment securities, the impact of unitary state tax
lease cancellations and other building-related costs andapportionment factors on the Company, non-deductible
$48.5 million of other business integration costs.merger-related costs and the acquisition of NOVA.
In 1999, merger and restructuring-related itemsAt December 31, 2001, the Company's net deferred tax
included noninterest expenses consisting of $417.0 millionliability was $573.2 million, compared with $512.8 million
related to the merger of Firstar and Mercantile,at December 31, 2000. For further information on income
$95.9 million related to the merger of Firstar and Star Banc
U.S. Bancorp
Table 7
23

taxes, refer to Note 19 of the Notes to Consolidated The Company's loan portfolio inherently has credit
Financial Statements. risk, which may ultimately result in loan charge-oÅs. The
Company manages this risk through stringent, centralizedBALANCE SHEET ANALYSIS
credit policies and review procedures, as well as
diversiÑcation along geographic and customer lines. Refer toAverage earning assets were $145.2 billion in 2001
""Corporate Risk ProÑle'' on pages 29 through 36, for acompared with $140.6 billion in 2000. The increase of
more detailed discussion of the management of credit risk$4.6 billion (3.2 percent) was primarily driven by increases
including the allowance for credit losses.in the investment portfolio, core retail loan growth, and the
impact of acquisitions. This growth was partially oÅset by aCommercial Commercial loans, including lease Ñnancing,
$2.7 billion decline in lower margin residential mortgagestotaled $46.3 billion at December 31, 2001, down
and a $2.2 billion reduction related to transfers of short-$6.5 billion (12.3 percent) from year-end 2000. The
term, high credit quality, low margin commercial loans todecline in commercial loans reÖected tighter credit
the loan conduit. The increase was funded with an increaseunderwriting throughout 2001, slower economic growth,
in average interest-bearing liabilities of $3.4 billionthe Company's transfer of approximately $3.7 billion of
consisting principally of more favorably priced long-termshort-term, high credit quality, low margin commercial
wholesale funds and an increase in net free funds ofloans into the loan conduit and the transfer of $680 million
$1.2 billion including an increase in average noninterest-in unsecured small business product to loans held for sale.
bearing deposits of $1.3 billion.This was oÅset somewhat by core growth in equipment
For average balance information, refer to Consolidatedlease Ñnancing and bank acquisitions. Average commercial
Daily Average Balance Sheet and Related Yields and Ratesloans in 2001 were Öat compared with 2000. On a core
on pages 86 and 87.basis (without loan conduit activities and transfers to loans
held for sale), average commercial loans increased by 2.1Loans The Company's loan portfolio decreased $8.0 billion
percent from a year ago.to $114.4 billion at December 31, 2001, from $122.4 billion
The Company oÅers a broad array of traditionalat December 31, 2000. The change in loans outstanding was
commercial lending products and specialized products suchimpacted by several management actions, including the sale
as asset-based lending, lease Ñnancing, agricultural creditof high LTV home equity and indirect automobile
and correspondent banking. The Company monitors andportfolios, the transfer of a discontinued unsecured small
manages the portfolio diversiÑcation by industry, customerbusiness product to loans held for sale, branch divestitures
and geography. The commercial portfolio reÖects therequired by the merger of Firstar and USBM, and transfers
Company's focus of serving small business customers,of short-term, high credit quality, low margin commercial
middle market and larger corporate businesses throughoutloans to the loan conduit. In addition, the Company
its 24 state banking region and national customers withincontinued its business strategy to reduce the lower margin
certain niche industry groups.residential mortgage portfolio. Average total loans
Table 9 provides a summary of the signiÑcant industrydecreased less than one percent to $118.2 billion in 2001
groups and geographic locations of commercial loanscompared with $118.3 billion in 2000. Excluding residential
outstanding at December 31, 2001 and 2000. Themortgages, average loans for 2001 were $2.6 billion
commercial loan portfolio is diversiÑed among various(2.4 percent) higher than 2000. Average loans on a core
industries with somewhat higher concentrations inbasis (excluding loan conduit activities, transfer of loans to
consumer products and services, capital goods (includingheld for sale and residential mortgages) increased by $4.6
manufacturing and commercial construction-relatedbillion (4.3 percent) relative to the prior year.
Selected Loan Maturity Distribution
Over OneOne Year Through Over Five
At December 31, 2001 (Dollars in Millions) or Less Five Years Years Total
CommercialÏÏÏÏÏÏÏÏÏÏÏÏÏÏÏÏÏÏÏÏÏÏÏÏÏÏÏÏÏÏÏÏÏÏÏÏÏÏÏÏÏÏÏÏÏÏÏÏÏÏÏÏÏÏÏÏÏÏÏÏ $25,761 $17,896 $ 2,673 $ 46,330
Commercial real estate ÏÏÏÏÏÏÏÏÏÏÏÏÏÏÏÏÏÏÏÏÏÏÏÏÏÏÏÏÏÏÏÏÏÏÏÏÏÏÏÏÏÏÏÏÏÏÏÏÏ 7,256 12,238 5,879 25,373
Residential mortgages ÏÏÏÏÏÏÏÏÏÏÏÏÏÏÏÏÏÏÏÏÏÏÏÏÏÏÏÏÏÏÏÏÏÏÏÏÏÏÏÏÏÏÏÏÏÏÏÏÏÏ 495 954 4,297 5,746
Retail ÏÏÏÏÏÏÏÏÏÏÏÏÏÏÏÏÏÏÏÏÏÏÏÏÏÏÏÏÏÏÏÏÏÏÏÏÏÏÏÏÏÏÏÏÏÏÏÏÏÏÏÏÏÏÏÏÏÏÏÏÏÏÏÏÏ 13,452 13,417 10,087 36,956
Total loans ÏÏÏÏÏÏÏÏÏÏÏÏÏÏÏÏÏÏÏÏÏÏÏÏÏÏÏÏÏÏÏÏÏÏÏÏÏÏÏÏÏÏÏÏÏÏÏÏÏÏÏÏÏÏ $46,964 $44,505 $22,936 $114,405
Total of loans due after one year with
Predetermined interest rates ÏÏÏÏÏÏÏÏÏÏÏÏÏÏÏÏÏÏÏÏÏÏÏÏÏÏÏÏÏÏÏÏÏÏÏÏÏÏÏÏÏÏ $ 37,420
Floating interest rates ÏÏÏÏÏÏÏÏÏÏÏÏÏÏÏÏÏÏÏÏÏÏÏÏÏÏÏÏÏÏÏÏÏÏÏÏÏÏÏÏÏÏÏÏÏÏÏÏ $ 30,021
U.S. Bancorp
Table 8
24

Commercial Loan Exposure by Industry Group and Geography
December 31, 2001 December 31, 2000
Industry Group(Dollars in Millions) Loans Percent Loans Percent
Consumer products and services ÏÏÏÏÏÏÏÏÏÏÏÏÏÏÏÏÏÏÏÏÏÏÏÏÏÏÏÏÏÏÏÏÏÏÏÏÏ $ 8,591 18.5% $ 9,791 18.4%
Capital goods ÏÏÏÏÏÏÏÏÏÏÏÏÏÏÏÏÏÏÏÏÏÏÏÏÏÏÏÏÏÏÏÏÏÏÏÏÏÏÏÏÏÏÏÏÏÏÏÏÏÏÏÏÏÏÏ 6,270 13.5 6,984 13.2
Consumer staples ÏÏÏÏÏÏÏÏÏÏÏÏÏÏÏÏÏÏÏÏÏÏÏÏÏÏÏÏÏÏÏÏÏÏÏÏÏÏÏÏÏÏÏÏÏÏÏÏÏÏÏ 4,638 10.0 5,427 10.3
Financials ÏÏÏÏÏÏÏÏÏÏÏÏÏÏÏÏÏÏÏÏÏÏÏÏÏÏÏÏÏÏÏÏÏÏÏÏÏÏÏÏÏÏÏÏÏÏÏÏÏÏÏÏÏÏÏÏÏÏÏ 4,291 9.3 5,438 10.3
Agriculture ÏÏÏÏÏÏÏÏÏÏÏÏÏÏÏÏÏÏÏÏÏÏÏÏÏÏÏÏÏÏÏÏÏÏÏÏÏÏÏÏÏÏÏÏÏÏÏÏÏÏÏÏÏÏÏÏÏÏ 3,340 7.2 4,177 7.9
TransportationÏÏÏÏÏÏÏÏÏÏÏÏÏÏÏÏÏÏÏÏÏÏÏÏÏÏÏÏÏÏÏÏÏÏÏÏÏÏÏÏÏÏÏÏÏÏÏÏÏÏÏÏÏÏÏ 2,544 5.5 2,775 5.3
Paper and forestry products, mining and basic materials ÏÏÏÏÏÏÏÏÏÏÏÏÏÏÏÏ 1,931 4.2 2,249 4.3
Private investorsÏÏÏÏÏÏÏÏÏÏÏÏÏÏÏÏÏÏÏÏÏÏÏÏÏÏÏÏÏÏÏÏÏÏÏÏÏÏÏÏÏÏÏÏÏÏÏÏÏÏÏÏÏ 1,803 3.9 2,405 4.6
Healthcare ÏÏÏÏÏÏÏÏÏÏÏÏÏÏÏÏÏÏÏÏÏÏÏÏÏÏÏÏÏÏÏÏÏÏÏÏÏÏÏÏÏÏÏÏÏÏÏÏÏÏÏÏÏÏÏÏÏÏ 1,424 3.1 1,631 3.1
Mortgage banking ÏÏÏÏÏÏÏÏÏÏÏÏÏÏÏÏÏÏÏÏÏÏÏÏÏÏÏÏÏÏÏÏÏÏÏÏÏÏÏÏÏÏÏÏÏÏÏÏÏÏÏ 1,400 3.0 961 1.8
TechnologyÏÏÏÏÏÏÏÏÏÏÏÏÏÏÏÏÏÏÏÏÏÏÏÏÏÏÏÏÏÏÏÏÏÏÏÏÏÏÏÏÏÏÏÏÏÏÏÏÏÏÏÏÏÏÏÏÏÏ 1,094 2.4 1,223 2.3
EnergyÏÏÏÏÏÏÏÏÏÏÏÏÏÏÏÏÏÏÏÏÏÏÏÏÏÏÏÏÏÏÏÏÏÏÏÏÏÏÏÏÏÏÏÏÏÏÏÏÏÏÏÏÏÏÏÏÏÏÏÏÏÏ 405 .9 742 1.4
Other ÏÏÏÏÏÏÏÏÏÏÏÏÏÏÏÏÏÏÏÏÏÏÏÏÏÏÏÏÏÏÏÏÏÏÏÏÏÏÏÏÏÏÏÏÏÏÏÏÏÏÏÏÏÏÏÏÏÏÏÏÏÏÏ 8,599 18.5 9,014 17.1
Total ÏÏÏÏÏÏÏÏÏÏÏÏÏÏÏÏÏÏÏÏÏÏÏÏÏÏÏÏÏÏÏÏÏÏÏÏÏÏÏÏÏÏÏÏÏÏÏÏÏÏÏÏÏÏÏÏÏÏÏÏ $46,330 100.0% $52,817 100.0%
Geography
California ÏÏÏÏÏÏÏÏÏÏÏÏÏÏÏÏÏÏÏÏÏÏÏÏÏÏÏÏÏÏÏÏÏÏÏÏÏÏÏÏÏÏÏÏÏÏÏÏÏÏÏÏÏÏÏÏÏÏÏ $ 3,969 8.6% $ 3,174 6.0%
ColoradoÏÏÏÏÏÏÏÏÏÏÏÏÏÏÏÏÏÏÏÏÏÏÏÏÏÏÏÏÏÏÏÏÏÏÏÏÏÏÏÏÏÏÏÏÏÏÏÏÏÏÏÏÏÏÏÏÏÏÏÏ 2,008 4.3 2,661 5.0
Illinois ÏÏÏÏÏÏÏÏÏÏÏÏÏÏÏÏÏÏÏÏÏÏÏÏÏÏÏÏÏÏÏÏÏÏÏÏÏÏÏÏÏÏÏÏÏÏÏÏÏÏÏÏÏÏÏÏÏÏÏÏÏÏ 2,339 5.0 3,336 6.3
MinnesotaÏÏÏÏÏÏÏÏÏÏÏÏÏÏÏÏÏÏÏÏÏÏÏÏÏÏÏÏÏÏÏÏÏÏÏÏÏÏÏÏÏÏÏÏÏÏÏÏÏÏÏÏÏÏÏÏÏÏÏ 6,511 14.1 8,724 16.5
Missouri ÏÏÏÏÏÏÏÏÏÏÏÏÏÏÏÏÏÏÏÏÏÏÏÏÏÏÏÏÏÏÏÏÏÏÏÏÏÏÏÏÏÏÏÏÏÏÏÏÏÏÏÏÏÏÏÏÏÏÏÏ 2,104 4.5 2,163 4.1
Ohio ÏÏÏÏÏÏÏÏÏÏÏÏÏÏÏÏÏÏÏÏÏÏÏÏÏÏÏÏÏÏÏÏÏÏÏÏÏÏÏÏÏÏÏÏÏÏÏÏÏÏÏÏÏÏÏÏÏÏÏÏÏÏÏÏ 2,896 6.3 2,269 4.3
Oregon ÏÏÏÏÏÏÏÏÏÏÏÏÏÏÏÏÏÏÏÏÏÏÏÏÏÏÏÏÏÏÏÏÏÏÏÏÏÏÏÏÏÏÏÏÏÏÏÏÏÏÏÏÏÏÏÏÏÏÏÏÏ 2,014 4.3 2,769 5.2
Washington ÏÏÏÏÏÏÏÏÏÏÏÏÏÏÏÏÏÏÏÏÏÏÏÏÏÏÏÏÏÏÏÏÏÏÏÏÏÏÏÏÏÏÏÏÏÏÏÏÏÏÏÏÏÏÏÏÏ 3,882 8.4 4,860 9.2
Wisconsin ÏÏÏÏÏÏÏÏÏÏÏÏÏÏÏÏÏÏÏÏÏÏÏÏÏÏÏÏÏÏÏÏÏÏÏÏÏÏÏÏÏÏÏÏÏÏÏÏÏÏÏÏÏÏÏÏÏÏÏ 3,115 6.7 3,153 6.0
Iowa, Kansas, Nebraska, North Dakota, South Dakota ÏÏÏÏÏÏÏÏÏÏÏÏÏÏÏÏÏÏ 5,059 10.9 4,547 8.6
Arkansas, Indiana, Kentucky, Tennessee ÏÏÏÏÏÏÏÏÏÏÏÏÏÏÏÏÏÏÏÏÏÏÏÏÏÏÏÏÏÏ 1,897 4.1 2,230 4.2
Idaho, Montana, Wyoming ÏÏÏÏÏÏÏÏÏÏÏÏÏÏÏÏÏÏÏÏÏÏÏÏÏÏÏÏÏÏÏÏÏÏÏÏÏÏÏÏÏÏÏÏ 1,014 2.2 1,316 2.5
Arizona, Nevada, Utah ÏÏÏÏÏÏÏÏÏÏÏÏÏÏÏÏÏÏÏÏÏÏÏÏÏÏÏÏÏÏÏÏÏÏÏÏÏÏÏÏÏÏÏÏÏÏÏ 1,057 2.3 1,460 2.8
Total banking regionÏÏÏÏÏÏÏÏÏÏÏÏÏÏÏÏÏÏÏÏÏÏÏÏÏÏÏÏÏÏÏÏÏÏÏÏÏÏÏÏÏÏÏ 37,865 81.7 42,662 80.8
Outside the Company's banking region ÏÏÏÏÏÏÏÏÏÏÏÏÏÏÏÏÏÏÏÏÏÏÏÏÏÏÏÏÏÏÏÏ 8,465 18.3 10,155 19.2
Total ÏÏÏÏÏÏÏÏÏÏÏÏÏÏÏÏÏÏÏÏÏÏÏÏÏÏÏÏÏÏÏÏÏÏÏÏÏÏÏÏÏÏÏÏÏÏÏÏÏÏÏÏÏÏÏÏÏÏÏÏ $46,330 100.0% $52,817 100.0%
businesses), and consumer staples industries. Additionally, workout strategies during 2001. During a business cycle
the commercial portfolio is diversiÑed across the Company's with slower economic growth, businesses with leveraged
geographical markets with 81.7 percent of total commercial capital structures may experience insuÇcient cash Öows to
loans within the 24 state banking region. Credit service their debt. The Company manages its exposure to
relationships outside of the Company's banking region are leveraged Ñnancings by maintaining strong underwriting
typically niche businesses including the mortgage banking standards, portfolio diversiÑcation and eÅectively managing
and the leasing businesses. The mortgage banking sector the relationship with the customer either directly or
represented approximately 3.0 percent of commercial loans through reputable Ñnancial intermediaries. At inception of
at December 31, 2001, compared with 1.8 percent at the credit relationship, the Company's underwriting
December 31, 2000. Loans to mortgage banking customers standards require the businesses to have acceptable capital
are primarily warehouse lines which are collateralized with levels and demonstrated suÇcient cash Öows to support
the underlying mortgages. The Company regularly monitors debt service of the loans. The Company's portfolio of
its mortgage collateral position to manage its risk exposure. leveraged Ñnancings is included in Table 9 and is diversiÑed
The Company provides Ñnancing to enable customers among industry groups similar to the total commercial loan
to grow their businesses through acquisitions of existing portfolio.
businesses, buyouts or other recapitalizations. SuchCommercial Real Estate The Company's portfolio of
leveraged Ñnancings approximated $3.9 billion in loanscommercial real estate mortgages and construction loans
outstanding at December 31, 2001, compared withdeclined to $25.4 billion at December 31, 2001, compared
approximately $4.9 billion outstanding at December 31,with $26.4 billion at December 31, 2000. Commercial
2000. The decline was primarily due to tighter creditmortgages outstanding decreased to $18.8 billion at
underwriting, payoÅs and the Company's aggressive
U.S. Bancorp
Table 9
25
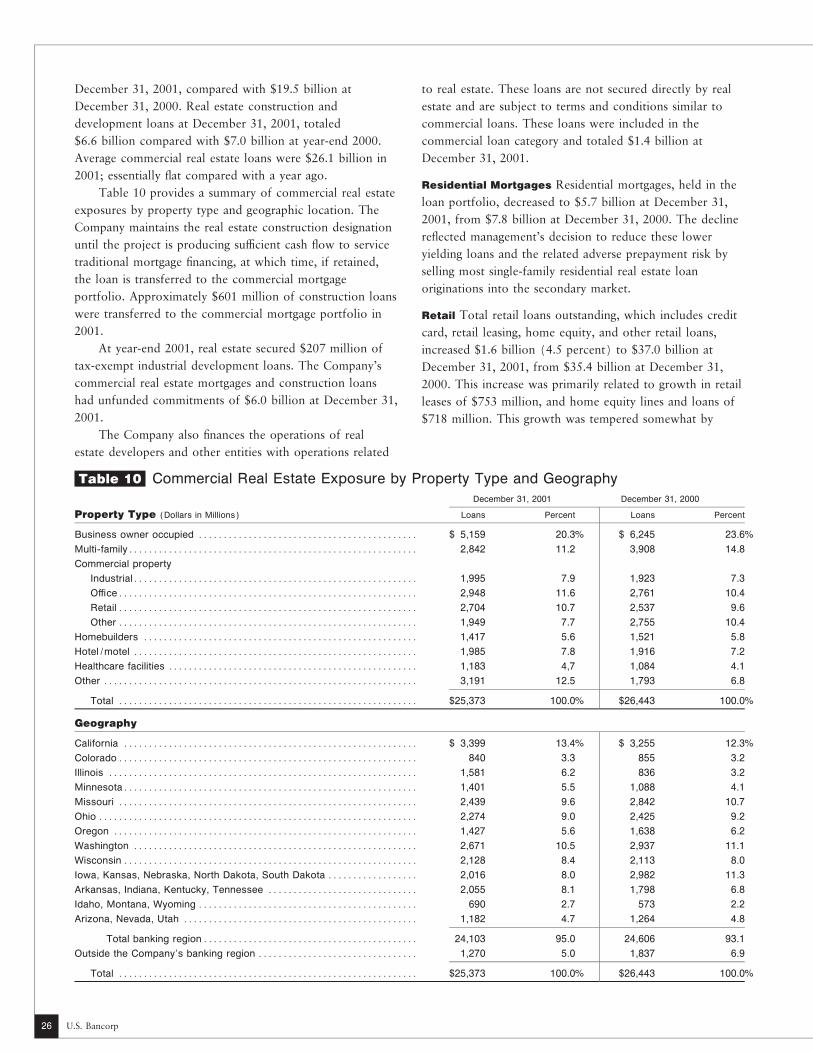
December 31, 2001, compared with $19.5 billion at to real estate. These loans are not secured directly by real
December 31, 2000. Real estate construction and estate and are subject to terms and conditions similar to
development loans at December 31, 2001, totaled commercial loans. These loans were included in the
$6.6 billion compared with $7.0 billion at year-end 2000. commercial loan category and totaled $1.4 billion at
Average commercial real estate loans were $26.1 billion in December 31, 2001.
2001; essentially Öat compared with a year ago.Residential Mortgages Residential mortgages, held in the
Table 10 provides a summary of commercial real estateloan portfolio, decreased to $5.7 billion at December 31,
exposures by property type and geographic location. The2001, from $7.8 billion at December 31, 2000. The decline
Company maintains the real estate construction designationreÖected management's decision to reduce these lower
until the project is producing suÇcient cash Öow to serviceyielding loans and the related adverse prepayment risk by
traditional mortgage Ñnancing, at which time, if retained,selling most single-family residential real estate loan
the loan is transferred to the commercial mortgageoriginations into the secondary market.
portfolio. Approximately $601 million of construction loans
were transferred to the commercial mortgage portfolio in Retail Total retail loans outstanding, which includes credit
2001. card, retail leasing, home equity, and other retail loans,
At year-end 2001, real estate secured $207 million of increased $1.6 billion (4.5 percent) to $37.0 billion at
tax-exempt industrial development loans. The Company's December 31, 2001, from $35.4 billion at December 31,
commercial real estate mortgages and construction loans 2000. This increase was primarily related to growth in retail
had unfunded commitments of $6.0 billion at December 31, leases of $753 million, and home equity lines and loans of
2001. $718 million. This growth was tempered somewhat by
The Company also Ñnances the operations of real
estate developers and other entities with operations related
Commercial Real Estate Exposure by Property Type and Geography
December 31, 2001 December 31, 2000
Property Type (Dollars in Millions) Loans Percent Loans Percent
Business owner occupied ÏÏÏÏÏÏÏÏÏÏÏÏÏÏÏÏÏÏÏÏÏÏÏÏÏÏÏÏÏÏÏÏÏÏÏÏÏÏÏÏÏÏÏÏ $ 5,159 20.3% $ 6,245 23.6%
Multi-familyÏÏÏÏÏÏÏÏÏÏÏÏÏÏÏÏÏÏÏÏÏÏÏÏÏÏÏÏÏÏÏÏÏÏÏÏÏÏÏÏÏÏÏÏÏÏÏÏÏÏÏÏÏÏÏÏÏÏ 2,842 11.2 3,908 14.8
Commercial property
IndustrialÏÏÏÏÏÏÏÏÏÏÏÏÏÏÏÏÏÏÏÏÏÏÏÏÏÏÏÏÏÏÏÏÏÏÏÏÏÏÏÏÏÏÏÏÏÏÏÏÏÏÏÏÏÏÏÏÏ 1,995 7.9 1,923 7.3
OÇceÏÏÏÏÏÏÏÏÏÏÏÏÏÏÏÏÏÏÏÏÏÏÏÏÏÏÏÏÏÏÏÏÏÏÏÏÏÏÏÏÏÏÏÏÏÏÏÏÏÏÏÏÏÏÏÏÏÏÏÏ 2,948 11.6 2,761 10.4
Retail ÏÏÏÏÏÏÏÏÏÏÏÏÏÏÏÏÏÏÏÏÏÏÏÏÏÏÏÏÏÏÏÏÏÏÏÏÏÏÏÏÏÏÏÏÏÏÏÏÏÏÏÏÏÏÏÏÏÏÏÏ 2,704 10.7 2,537 9.6
Other ÏÏÏÏÏÏÏÏÏÏÏÏÏÏÏÏÏÏÏÏÏÏÏÏÏÏÏÏÏÏÏÏÏÏÏÏÏÏÏÏÏÏÏÏÏÏÏÏÏÏÏÏÏÏÏÏÏÏÏÏ 1,949 7.7 2,755 10.4
Homebuilders ÏÏÏÏÏÏÏÏÏÏÏÏÏÏÏÏÏÏÏÏÏÏÏÏÏÏÏÏÏÏÏÏÏÏÏÏÏÏÏÏÏÏÏÏÏÏÏÏÏÏÏÏÏÏÏ 1,417 5.6 1,521 5.8
Hotel/motel ÏÏÏÏÏÏÏÏÏÏÏÏÏÏÏÏÏÏÏÏÏÏÏÏÏÏÏÏÏÏÏÏÏÏÏÏÏÏÏÏÏÏÏÏÏÏÏÏÏÏÏÏÏÏÏÏÏ 1,985 7.8 1,916 7.2
Healthcare facilities ÏÏÏÏÏÏÏÏÏÏÏÏÏÏÏÏÏÏÏÏÏÏÏÏÏÏÏÏÏÏÏÏÏÏÏÏÏÏÏÏÏÏÏÏÏÏÏÏÏÏ 1,183 4,7 1,084 4.1
Other ÏÏÏÏÏÏÏÏÏÏÏÏÏÏÏÏÏÏÏÏÏÏÏÏÏÏÏÏÏÏÏÏÏÏÏÏÏÏÏÏÏÏÏÏÏÏÏÏÏÏÏÏÏÏÏÏÏÏÏÏÏÏÏ 3,191 12.5 1,793 6.8
Total ÏÏÏÏÏÏÏÏÏÏÏÏÏÏÏÏÏÏÏÏÏÏÏÏÏÏÏÏÏÏÏÏÏÏÏÏÏÏÏÏÏÏÏÏÏÏÏÏÏÏÏÏÏÏÏÏÏÏÏÏ $25,373 100.0% $26,443 100.0%
Geography
California ÏÏÏÏÏÏÏÏÏÏÏÏÏÏÏÏÏÏÏÏÏÏÏÏÏÏÏÏÏÏÏÏÏÏÏÏÏÏÏÏÏÏÏÏÏÏÏÏÏÏÏÏÏÏÏÏÏÏÏ $ 3,399 13.4% $ 3,255 12.3%
ColoradoÏÏÏÏÏÏÏÏÏÏÏÏÏÏÏÏÏÏÏÏÏÏÏÏÏÏÏÏÏÏÏÏÏÏÏÏÏÏÏÏÏÏÏÏÏÏÏÏÏÏÏÏÏÏÏÏÏÏÏÏ 840 3.3 855 3.2
Illinois ÏÏÏÏÏÏÏÏÏÏÏÏÏÏÏÏÏÏÏÏÏÏÏÏÏÏÏÏÏÏÏÏÏÏÏÏÏÏÏÏÏÏÏÏÏÏÏÏÏÏÏÏÏÏÏÏÏÏÏÏÏÏ 1,581 6.2 836 3.2
MinnesotaÏÏÏÏÏÏÏÏÏÏÏÏÏÏÏÏÏÏÏÏÏÏÏÏÏÏÏÏÏÏÏÏÏÏÏÏÏÏÏÏÏÏÏÏÏÏÏÏÏÏÏÏÏÏÏÏÏÏÏ 1,401 5.5 1,088 4.1
Missouri ÏÏÏÏÏÏÏÏÏÏÏÏÏÏÏÏÏÏÏÏÏÏÏÏÏÏÏÏÏÏÏÏÏÏÏÏÏÏÏÏÏÏÏÏÏÏÏÏÏÏÏÏÏÏÏÏÏÏÏÏ 2,439 9.6 2,842 10.7
Ohio ÏÏÏÏÏÏÏÏÏÏÏÏÏÏÏÏÏÏÏÏÏÏÏÏÏÏÏÏÏÏÏÏÏÏÏÏÏÏÏÏÏÏÏÏÏÏÏÏÏÏÏÏÏÏÏÏÏÏÏÏÏÏÏÏ 2,274 9.0 2,425 9.2
Oregon ÏÏÏÏÏÏÏÏÏÏÏÏÏÏÏÏÏÏÏÏÏÏÏÏÏÏÏÏÏÏÏÏÏÏÏÏÏÏÏÏÏÏÏÏÏÏÏÏÏÏÏÏÏÏÏÏÏÏÏÏÏ 1,427 5.6 1,638 6.2
Washington ÏÏÏÏÏÏÏÏÏÏÏÏÏÏÏÏÏÏÏÏÏÏÏÏÏÏÏÏÏÏÏÏÏÏÏÏÏÏÏÏÏÏÏÏÏÏÏÏÏÏÏÏÏÏÏÏÏ 2,671 10.5 2,937 11.1
Wisconsin ÏÏÏÏÏÏÏÏÏÏÏÏÏÏÏÏÏÏÏÏÏÏÏÏÏÏÏÏÏÏÏÏÏÏÏÏÏÏÏÏÏÏÏÏÏÏÏÏÏÏÏÏÏÏÏÏÏÏÏ 2,128 8.4 2,113 8.0
Iowa, Kansas, Nebraska, North Dakota, South Dakota ÏÏÏÏÏÏÏÏÏÏÏÏÏÏÏÏÏÏ 2,016 8.0 2,982 11.3
Arkansas, Indiana, Kentucky, Tennessee ÏÏÏÏÏÏÏÏÏÏÏÏÏÏÏÏÏÏÏÏÏÏÏÏÏÏÏÏÏÏ 2,055 8.1 1,798 6.8
Idaho, Montana, Wyoming ÏÏÏÏÏÏÏÏÏÏÏÏÏÏÏÏÏÏÏÏÏÏÏÏÏÏÏÏÏÏÏÏÏÏÏÏÏÏÏÏÏÏÏÏ 690 2.7 573 2.2
Arizona, Nevada, Utah ÏÏÏÏÏÏÏÏÏÏÏÏÏÏÏÏÏÏÏÏÏÏÏÏÏÏÏÏÏÏÏÏÏÏÏÏÏÏÏÏÏÏÏÏÏÏÏ 1,182 4.7 1,264 4.8
Total banking regionÏÏÏÏÏÏÏÏÏÏÏÏÏÏÏÏÏÏÏÏÏÏÏÏÏÏÏÏÏÏÏÏÏÏÏÏÏÏÏÏÏÏÏ 24,103 95.0 24,606 93.1
Outside the Company's banking region ÏÏÏÏÏÏÏÏÏÏÏÏÏÏÏÏÏÏÏÏÏÏÏÏÏÏÏÏÏÏÏÏ 1,270 5.0 1,837 6.9
Total ÏÏÏÏÏÏÏÏÏÏÏÏÏÏÏÏÏÏÏÏÏÏÏÏÏÏÏÏÏÏÏÏÏÏÏÏÏÏÏÏÏÏÏÏÏÏÏÏÏÏÏÏÏÏÏÏÏÏÏÏ $25,373 100.0% $26,443 100.0%
U.S. Bancorp
Table 10
26

portfolio sales of $1.3 billion related to the high LTV interest rates. Residential mortgage production increased to
home equity portfolio and indirect automobile loans $15.6 billion in 2001 compared with $6.7 billion in 2000.
completed in the Ñrst quarter of 2001. Average retail loansSecurities The Company uses its investment securities
increased $2.5 billion (7.7 percent) to $35.2 billion inportfolio for several purposes. It serves as a vehicle to
2001. On a core basis, average retail loans increasedmanage interest rate and prepayment risk, generates interest
12.2 percent from a year ago with growth in most retailand dividend income from the investment of excess funds
loan categories. Of the total retail loans and residentialdepending on loan demand, provides liquidity to meet
mortgages outstanding, approximately 93 percent are toliquidity requirements and is used as collateral for public
customers located in the Company's banking region.deposits and wholesale funding sources.
At December 31, 2001, investment securities ofLoans Held for Sale At December 31, 2001, loans held for$26.6 billion consisted of securities available-for-salesale (""LHFS''), which consisted primarily of residential($26.3 billion) and held-to-maturity ($.3 billion),mortgage loans to be sold in the secondary markets, werecompared with total investment securities of $17.6 billion at$2.8 billion compared with $764 million at December 31,December 31, 2000. During the year, management realigned2000. The increase reÖected the surge in residentialthe portfolio to hedge against interest rate changes and themortgage production volume in 2001 due to declining
Investment SecuritiesAvailable-for-Sale Held-to-Maturity
Weighted WeightedAverage Weighted Average Weighted
Amortized Fair Maturity in Average Amortized Fair Maturity in AverageDecember 31, 2001 (Dollars in Millions) Cost Value Years Yield Cost Value Years Yield
U.S. Treasuries and agenciesMaturing in one year or lessÏÏÏÏÏÏÏÏÏÏÏ $ 105 $ 106 .37 4.29% $ Ì $ Ì Ì Ì%Maturing after one year through
Ñve yearsÏÏÏÏÏÏÏÏÏÏÏÏÏÏÏÏÏÏÏÏÏÏÏÏÏ 290 298 2.35 4.74 Ì Ì Ì ÌMaturing after five years through
ten years ÏÏÏÏÏÏÏÏÏÏÏÏÏÏÏÏÏÏÏÏÏÏÏÏÏ 44 45 5.83 4.86 Ì Ì Ì ÌMaturing after ten yearsÏÏÏÏÏÏÏÏÏÏÏÏÏÏÏ Ì Ì Ì Ì Ì Ì Ì Ì
TotalÏÏÏÏÏÏÏÏÏÏÏÏÏÏÏÏÏÏÏÏÏÏÏÏÏÏ $ 439 $ 449 2.22 4.64 $ Ì $ Ì Ì Ì
Mortgage and asset-backed securitiesMaturing in one year or lessÏÏÏÏÏÏÏÏÏÏÏ $ 40 $ 40 .61 5.59 $ Ì $ Ì Ì ÌMaturing after one year through
Ñve yearsÏÏÏÏÏÏÏÏÏÏÏÏÏÏÏÏÏÏÏÏÏÏÏÏÏ 13,626 13,704 3.90 5.91 28 28 4.05 7.67Maturing after five years through
ten years ÏÏÏÏÏÏÏÏÏÏÏÏÏÏÏÏÏÏÏÏÏÏÏÏÏ 8,786 8,718 5.84 5.44 Ì Ì Ì ÌMaturing after ten yearsÏÏÏÏÏÏÏÏÏÏÏÏÏÏÏ 1,576 1,566 14.57 3.37 Ì Ì Ì Ì
TotalÏÏÏÏÏÏÏÏÏÏÏÏÏÏÏÏÏÏÏÏÏÏÏÏÏÏ $24,028 $24,028 5.30 5.57 $ 28 $ 28 4.05 7.67
Obligations of states and political subdivisionsMaturing in one year or lessÏÏÏÏÏÏÏÏÏÏÏ $ 185 $ 187 .46 7.26 $ 83 $ 84 .54 4.30Maturing after one year through
Ñve yearsÏÏÏÏÏÏÏÏÏÏÏÏÏÏÏÏÏÏÏÏÏÏÏÏÏ 384 393 2.79 7.33 67 69 3.11 6.31Maturing after five years through
ten years ÏÏÏÏÏÏÏÏÏÏÏÏÏÏÏÏÏÏÏÏÏÏÏÏÏ 228 231 7.00 7.01 64 67 7.74 6.58Maturing after ten yearsÏÏÏÏÏÏÏÏÏÏÏÏÏÏÏ 80 80 16.05 8.68 57 58 15.04 6.87
TotalÏÏÏÏÏÏÏÏÏÏÏÏÏÏÏÏÏÏÏÏÏÏÏÏÏÏ $ 877 $ 891 4.60 7.35 $271 $278 5.91 5.87
Other debt securitiesMaturing in one year or lessÏÏÏÏÏÏÏÏÏÏÏ $ 137 $ 138 .53 2.84 $ Ì $ Ì Ì ÌMaturing after one year through
Ñve yearsÏÏÏÏÏÏÏÏÏÏÏÏÏÏÏÏÏÏÏÏÏÏÏÏÏ 69 70 1.93 6.11 Ì Ì Ì ÌMaturing after five years through
ten years ÏÏÏÏÏÏÏÏÏÏÏÏÏÏÏÏÏÏÏÏÏÏÏÏÏ 7 6 6.46 8.03 Ì Ì Ì ÌMaturing after ten yearsÏÏÏÏÏÏÏÏÏÏÏÏÏÏÏ 262 235 25.35 3.03 Ì Ì Ì Ì
TotalÏÏÏÏÏÏÏÏÏÏÏÏÏÏÏÏÏÏÏÏÏÏÏÏÏÏ $ 475 $ 449 14.51 3.49 $ Ì $ Ì Ì Ì
Other investmentsÏÏÏÏÏÏÏÏÏÏÏÏÏÏÏÏÏÏÏÏÏÏÏÏ $ 475 $ 492 Ì Ì $ Ì $ Ì Ì Ì
Total investment securitiesÏÏÏÏÏÏÏÏÏÏÏÏÏÏÏÏ $26,294 $26,309 5.40 5.58% $299 $306 5.74 6.04%
Note: Information related to asset-backed securities included above is presented based upon weighted average maturities anticipating future prepayments. Average yields are
presented on a fully-taxable equivalent basis. Yields on available-for-sale securities are computed based on historical cost balances.
2001 2000
Amortized Percent Amortized PercentAt December 31 (Dollars in Millions) Cost of Total Cost of Total
U.S. Treasuries and agencies ÏÏÏÏÏÏÏÏÏÏÏÏÏÏÏÏÏÏÏÏÏÏÏÏÏÏÏÏÏÏÏÏÏÏÏÏÏÏÏÏÏÏÏÏÏÏÏÏÏÏÏÏÏÏÏÏÏÏ $ 439 1.7% $ 1,600 9.1%Asset-backed securities
Collateralized mortgage obligations ÏÏÏÏÏÏÏÏÏÏÏÏÏÏÏÏÏÏÏÏÏÏÏÏÏÏÏÏÏÏÏÏÏÏÏÏÏÏÏÏÏÏÏÏÏÏÏÏÏ 15,178 57.1 6,264 35.8Mortgage-backed securities ÏÏÏÏÏÏÏÏÏÏÏÏÏÏÏÏÏÏÏÏÏÏÏÏÏÏÏÏÏÏÏÏÏÏÏÏÏÏÏÏÏÏÏÏÏÏÏÏÏÏÏÏÏÏÏÏ 8,878 33.4 5,572 31.9
Total asset-backed securities ÏÏÏÏÏÏÏÏÏÏÏÏÏÏÏÏÏÏÏÏÏÏÏÏÏÏÏÏÏÏÏÏÏÏÏÏÏÏÏÏÏÏÏÏÏÏÏÏÏÏÏ 24,056 90.5 11,836 67.7Obligations of states and political subdivisions ÏÏÏÏÏÏÏÏÏÏÏÏÏÏÏÏÏÏÏÏÏÏÏÏÏÏÏÏÏÏÏÏÏÏÏÏÏÏÏÏÏÏ 1,148 4.3 2,586 14.8Other securities and investments ÏÏÏÏÏÏÏÏÏÏÏÏÏÏÏÏÏÏÏÏÏÏÏÏÏÏÏÏÏÏÏÏÏÏÏÏÏÏÏÏÏÏÏÏÏÏÏÏÏÏÏÏÏÏÏ 950 3.5 1,472 8.4
Total investment securities ÏÏÏÏÏÏÏÏÏÏÏÏÏÏÏÏÏÏÏÏÏÏÏÏÏÏÏÏÏÏÏÏÏÏÏÏÏÏÏÏÏÏÏÏÏÏÏÏÏÏÏÏÏÏÏÏÏ $26,593 100.0% $17,494 100.0%
U.S. Bancorp
Table 11
27

Deposits
The composition of deposits was as follows:
December 31 (Dollars in Millions) 2001 2000 1999 1998 1997
Noninterest-bearing deposits ÏÏÏÏÏÏÏÏÏÏÏÏÏÏÏÏÏÏÏÏÏÏÏÏÏÏÏÏ $ 31,212 $ 26,633 $ 26,350 $ 27,479 $ 24,062
Interest-bearing deposits
Savings accountsÏÏÏÏÏÏÏÏÏÏÏÏÏÏÏÏÏÏÏÏÏÏÏÏÏÏÏÏÏÏÏÏÏÏÏÏ 4,637 4,516 5,445 6,352 6,414
Interest checking ÏÏÏÏÏÏÏÏÏÏÏÏÏÏÏÏÏÏÏÏÏÏÏÏÏÏÏÏÏÏÏÏÏÏÏÏ 15,251 13,982 13,141 13,385 12,212
Money market accountsÏÏÏÏÏÏÏÏÏÏÏÏÏÏÏÏÏÏÏÏÏÏÏÏÏÏÏÏÏÏ 24,835 23,899 22,751 22,086 18,672
Subtotal ÏÏÏÏÏÏÏÏÏÏÏÏÏÏÏÏÏÏÏÏÏÏÏÏÏÏÏÏÏÏÏÏÏÏÏÏÏÏÏÏÏ 44,723 42,397 41,337 41,823 37,298
Time certiÑcates of deposit less than $100,000ÏÏÏÏÏÏÏÏÏÏÏÏ 20,724 25,780 25,394 27,935 29,548
Time deposits greater than $100,000
Domestic ÏÏÏÏÏÏÏÏÏÏÏÏÏÏÏÏÏÏÏÏÏÏÏÏÏÏÏÏÏÏÏÏÏÏÏÏÏÏÏÏÏÏÏ 7,286 11,221 9,348 6,261 6,622
Foreign ÏÏÏÏÏÏÏÏÏÏÏÏÏÏÏÏÏÏÏÏÏÏÏÏÏÏÏÏÏÏÏÏÏÏÏÏÏÏÏÏÏÏÏÏÏ 1,274 3,504 988 848 793
Total depositsÏÏÏÏÏÏÏÏÏÏÏÏÏÏÏÏÏÏÏÏÏÏÏÏÏÏÏÏÏÏÏÏÏÏÏÏ $105,219 $109,535 $103,417 $104,346 $ 98,323
Percent of total deposits 2001 2000 1999 1998 1997
Noninterest-bearing deposits ÏÏÏÏÏÏÏÏÏÏÏÏÏÏÏÏÏÏÏÏÏÏÏÏÏÏÏÏ 29.7% 24.3% 25.5% 26.3% 24.5%
Interest-bearing deposits
Savings accountsÏÏÏÏÏÏÏÏÏÏÏÏÏÏÏÏÏÏÏÏÏÏÏÏÏÏÏÏÏÏÏÏÏÏÏÏ 4.4 4.1 5.3 6.1 6.5
Interest checking ÏÏÏÏÏÏÏÏÏÏÏÏÏÏÏÏÏÏÏÏÏÏÏÏÏÏÏÏÏÏÏÏÏÏÏÏ 14.5 12.8 12.7 12.8 12.4
Money market accountsÏÏÏÏÏÏÏÏÏÏÏÏÏÏÏÏÏÏÏÏÏÏÏÏÏÏÏÏÏÏ 23.6 21.8 22.0 21.2 19.0
Subtotal ÏÏÏÏÏÏÏÏÏÏÏÏÏÏÏÏÏÏÏÏÏÏÏÏÏÏÏÏÏÏÏÏÏÏÏÏÏÏÏÏÏ 42.5 38.7 40.0 40.1 37.9
Time certiÑcates of deposit less than $100,000ÏÏÏÏÏÏÏÏÏÏÏÏ 19.7 23.5 24.5 26.8 30.1
Time deposits greater than $100,000
Domestic ÏÏÏÏÏÏÏÏÏÏÏÏÏÏÏÏÏÏÏÏÏÏÏÏÏÏÏÏÏÏÏÏÏÏÏÏÏÏÏÏÏÏÏ 6.9 10.3 9.0 6.0 6.7
Foreign ÏÏÏÏÏÏÏÏÏÏÏÏÏÏÏÏÏÏÏÏÏÏÏÏÏÏÏÏÏÏÏÏÏÏÏÏÏÏÏÏÏÏÏÏÏ 1.2 3.2 1.0 .8 .8
Total depositsÏÏÏÏÏÏÏÏÏÏÏÏÏÏÏÏÏÏÏÏÏÏÏÏÏÏÏÏÏÏÏÏÏÏÏÏ 100.0% 100.0% 100.0% 100.0% 100.0%
The maturity of time deposits greater than $100,000 was as follows:
December 31 (Dollars in Millions) 2001
Three months or less ÏÏÏÏÏÏÏÏÏÏÏÏÏÏÏÏÏÏÏÏÏÏÏÏÏÏÏÏÏÏÏÏÏÏÏÏÏÏÏÏÏÏÏÏÏÏÏÏÏÏÏÏÏÏÏÏÏÏÏÏÏÏÏÏÏÏÏÏÏÏÏÏÏÏÏÏÏÏÏÏÏÏÏÏÏÏÏÏÏÏÏÏÏÏÏÏÏÏÏÏÏ $4,060
Over three months through six months ÏÏÏÏÏÏÏÏÏÏÏÏÏÏÏÏÏÏÏÏÏÏÏÏÏÏÏÏÏÏÏÏÏÏÏÏÏÏÏÏÏÏÏÏÏÏÏÏÏÏÏÏÏÏÏÏÏÏÏÏÏÏÏÏÏÏÏÏÏÏÏÏÏÏÏÏÏÏÏÏÏÏÏÏÏ 1,903
Over six months through twelve months ÏÏÏÏÏÏÏÏÏÏÏÏÏÏÏÏÏÏÏÏÏÏÏÏÏÏÏÏÏÏÏÏÏÏÏÏÏÏÏÏÏÏÏÏÏÏÏÏÏÏÏÏÏÏÏÏÏÏÏÏÏÏÏÏÏÏÏÏÏÏÏÏÏÏÏÏÏÏÏÏÏÏÏÏ 1,200
Over twelve monthsÏÏÏÏÏÏÏÏÏÏÏÏÏÏÏÏÏÏÏÏÏÏÏÏÏÏÏÏÏÏÏÏÏÏÏÏÏÏÏÏÏÏÏÏÏÏÏÏÏÏÏÏÏÏÏÏÏÏÏÏÏÏÏÏÏÏÏÏÏÏÏÏÏÏÏÏÏÏÏÏÏÏÏÏÏÏÏÏÏÏÏÏÏÏÏÏÏÏÏÏÏÏÏ 1,397
TotalÏÏÏÏÏÏÏÏÏÏÏÏÏÏÏÏÏÏÏÏÏÏÏÏÏÏÏÏÏÏÏÏÏÏÏÏÏÏÏÏÏÏÏÏÏÏÏÏÏÏÏÏÏÏÏÏÏÏÏÏÏÏÏÏÏÏÏÏÏÏÏÏÏÏÏÏÏÏÏÏÏÏÏÏÏÏÏÏÏÏÏÏÏÏÏÏÏÏÏÏÏÏÏÏÏÏÏÏÏÏÏÏÏÏ $8,560
impact of prepayments in the mortgage servicing rights Deposits Total deposits were $105.2 billion at
portfolio. The Company purchased $32.3 billion and sold December 31, 2001, down $4.3 billion (3.9 percent) from
$19.2 billion of investment securities during the realignment $109.5 billion at year-end 2000. The decline since
process and generated $329.1 million in securities gains in December 31, 2000, was primarily due to the required sale
the declining interest rate environment. of 14 branches related to the merger of Firstar and USBM
The weighted-average yield of the available-for-sale as well as management's funding decisions to reduce higher
portfolio was 5.58 percent at December 31, 2001, compared cost time deposits greater than $100,000.
with 7.23 percent at December 31, 2000. The average Noninterest-bearing deposits were $31.2 billion at
maturity of the available-for-sale portfolio dropped to December 31, 2001, compared with $26.6 billion at
5.4 years at December 31, 2001, down from 9.5 years at December 31, 2000. Average noninterest-bearing deposits
December 31, 2000. The relative mix of the type of increased to $25.1 billion in 2001 compared with
investment securities maintained in the portfolio is provided $23.8 billion in 2000. The increase in noninterest-bearing
in Table 11. The change in investment portfolio mix deposits was primarily attributable to business demand
reÖected sales of tax-exempt municipal securities which accounts that maintain compensating balances with the
were replaced by collateralized mortgage obligations. At Company and to bank acquisitions. Core interest-bearing
December 31, 2001, the investment portfolio included a deposits, including savings accounts, interest checking and
$15 million net unrealized gain, compared with a net money market accounts, increased $2.3 billion
unrealized gain of $148 million at December 31, 2000. (5.5 percent) from a year ago. Average core interest-
bearing deposits increased $2.6 billion (6.4 percent) during
U.S. Bancorp
Table 12
28

2001. The downturn in equity capital markets in 2001 and residual valuations and ongoing operational activities. Credit
the current interest rate environment have prompted many risk is the risk of not collecting interest and/or the
customers to increase their liquidity in accessible deposits. principal balance of a loan or investment when it is due.
Time certiÑcates of deposit less than $100,000 declined Interest rate risk is the potential reduction of net interest
$5.1 billion (19.6 percent) during the year. Large income as a result of changes in interest rates. Rate
denomination deposits, both domestic and foreign, movements can aÅect the repricing of assets and liabilities
decreased $6.2 billion (41.9 percent). These deposits are diÅerently, as well as their market value. Market risk arises
largely viewed as purchased funds and are managed to from Öuctuations in interest rates, foreign exchange rates,
levels deemed appropriate given alternative funding sources. and equity prices that may result in changes in the values of
Average time certiÑcates of deposit less than $100,000 Ñnancial instruments, such as trading account and available-
declined $2.5 billion (9.8 percent) and average large for-sale securities that are accounted for on a mark-to-
denomination deposits were essentially Öat compared with market basis. Liquidity risk is the possible inability to fund
2000. The decline in average time certiÑcates of deposit less obligations to depositors, investors and borrowers. Residual
than $100,000 reÖected the net impact of bank acquisitions risk is the potential reduction in the ""end-of-term'' value of
and branch divestitures and management's pricing decisions leased assets or the residual cash Öows related to asset
to change the mix of funding toward lower rate wholesale securitization and other oÅ-balance sheet structures.
funding sources. Operational risk represents the possibility that transactions
Table 12 provides a summary of total deposits by type are processed erroneously and that material errors are not
of deposit. detected by the systems of internal accounting controls.
Borrowings The Company utilizes both short-term and Credit Risk Management The Company's strategy for
long-term borrowings to fund growth of earning assets in credit risk management includes stringent, centralized credit
excess of deposit growth. Short-term borrowings, which policies and uniform underwriting criteria for all loans,
include federal funds purchased, securities sold under including specialized lending categories such as mortgage
agreements to repurchase and other short-term borrowings, banking, energy, commercial real estate and real estate
were $14.7 billion at December 31, 2001, up $2.8 billion construction, leveraged Ñnancing and consumer credit. The
(24.0 percent) from $11.8 billion at year-end 2000. Short- strategy also emphasizes diversiÑcation on a geographic,
term funding is managed to levels deemed appropriate given industry and customer level, regular credit examinations,
alternative funding sources. and quarterly management reviews of large loans and loans
Long-term debt was $25.7 billion at December 31, experiencing deterioration of credit quality. The Company
2001, up from $21.9 billion at December 31, 2000. The strives to identify potential problem loans early, take any
increase in long-term funding reÖects favorable funding necessary charge-oÅs promptly, and maintain adequate
costs during the declining rate environment relative to rate reserve levels. Commercial banking operations rely on a
reductions for shorter-term borrowings or large strong credit culture that combines prudent credit policies
denomination deposits. During 2001, the Company issued and individual lender accountability. In addition, the
$1.1 billion of senior contingent convertible debt as well as commercial lenders generally focus on middle market
$1.5 billion of ""Company-obligated Mandatorily companies within their regions or niche national markets.
Redeemable Preferred Securities of Subsidiary Trusts The Company utilizes a credit risk rating system in order to
Holding Solely the Junior Subordinated Debentures of the measure the credit quality of individual commercial loan
Parent Company'' commonly referred to as ""Trust Preferred transactions and regularly forecasts potential changes in risk
Securities''. The Company's subsidiary U.S. Bank National ratings and nonperforming status. The risk rating system is
Association issued $1.5 billion of Ñxed-rate subordinated intended to identify and measure the credit quality of
notes. In addition, the Company's bank subsidiaries lending relationships. In the Company's retail banking
obtained $5.3 billion of long-term Federal Home Loan operations, standard credit scoring systems are used to
Bank advances in 2001. Refer to ""Liquidity Risk assess consumer credit risks and to price consumer products
Management'' on pages 38 through 40 for discussion of accordingly. The Company also engages in non-lending
liquidity management of the Company. activities that may give rise to credit risk, including interest
rate swap contracts for customers or balance sheet hedgingCORPORATE RISK PROFILE
purposes, foreign exchange transactions, and the processing
of credit card transactions for merchants. These activitiesOverview Managing risks is an essential part of successfully
are subject to the similar credit review, analysis andoperating a Ñnancial services company. The most prominent
approval processes as those applied to commercial loans.risk exposures are credit, interest rate, market and liquidity.
The Company also has exposure related to changes in
U.S. Bancorp 29

In evaluating its credit risk, the Company considers portfolios and recognized the need to address the impact
changes, if any, in underwriting activities, the loan portfolio that these events are expected to have on its credit
composition (including product mix and geographic, portfolios. In response to this evaluation, the Company
industry or customer-speciÑc concentrations), trends in loan increased the provision for credit losses approximately
performance, and macroeconomic factors. Generally, the $1,025.0 million in the third quarter of 2001 beyond
domestic economy has experienced slower growth since late expected levels.
2000. Accordingly, the Company began to re-evaluateCredit DiversiÑcation Tables 7, 9 and 10 provide
underwriting activities to tighten credit availability to certaininformation with respect to the overall diversiÑcation of the
types of lending, industries and customers. Additionally, incredit portfolio and changes in mix during 2001. Certain
connection with the merger of Firstar and USBM, theindustry segments, including transportation, manufacturing,
Company has continued to integrate underwriting standardsand technology sectors have experienced economic stress in
throughout the organization. Core loan growth for the2001. At December 31, 2001, the transportation sector
Company was 4.3 percent in 2001 with the majority of thisrepresented 5.5 percent of the total commercial loan
growth in retail lending.portfolio. It has been impacted by reduced airline travel,
During 2001, corporate earnings growth rates continuedslower economic activity and higher fuel costs that
to weaken and credit quality indicators among certainadversely impacted trucking businesses. At year-end 2001,
industry sectors have continued to deteriorate. Largethe Company's transportation portfolio consisted of airline
corporate and middle market commercial businessesand airfreight businesses (28.8 percent of the sector),
announced or continued to implement restructuringtrucking businesses (53.2 percent) and railroad and
activities in an eÅort to improve operating margins. Theshipping. Capital goods represented 13.5 percent of the
stagnant economic growth is evidenced by the Federaltotal commercial portfolio at December 31, 2001. Included
Reserve Board's (""FRB'') recent actions during late 2000in this sector were approximately 29.2 percent of loans to
and 2001 to stimulate economic growth through a series ofdiversiÑed manufacturing businesses while engineering and
interest rate reductions. In response to declining economicconstruction equipment and machinery businesses were
conditions, company-speciÑc portfolio trends, and the30.7 percent and 22.8 percent, respectively, of the capital
Firstar/USBM merger, the Company undertook an extensivegoods portfolio. Manufacturing production levels and
review of its commercial and consumer loan portfolios ininventory reductions caused some deterioration in these
early 2001. As a result of this review, the Company initiatedportfolios during late 2000 and 2001. During 2001, the
several actions during the Ñrst six months of 2001 includingtechnology sector was adversely impacted by lower capital
aligning the risk management practices and charge-oÅinvestments by businesses over the past twelve to eighteen
policies of the companies and restructuring and disposing ofmonths. At December 31, 2001, the technology industry
certain portfolios that did not align with the credit riskrepresented only 2.4 percent of the commercial loan
proÑle of the combined company. Credit portfolioportfolio.
restructuring activities included a speciÑc segment of theSince mid-2000, the agriculture and paper and forestry
Company's healthcare portfolio, selling certain consumerproducts sectors have been stressed. However, these sectors
loan portfolios of USBM, renegotiating a credit card co-have improved relative to a year ago. At December 31,
branding relationship and discontinuing an unsecured small2001, the Company's agricultural portfolio was diversiÑed
business product that did not align with the productwith 36.9 percent of agricultural loans to livestock
oÅerings of the combined company. The Company alsoproducers, 27.3 percent to crop producers, 20.3 percent to
implemented accelerated loan workout strategies for certainfood processors and 15.5 percent to wholesalers of
commercial credits. By the end of the second quarter ofagricultural products. Volatility in crop prices continues to
2001, economic stimulus by the FRB as well asadversely aÅect the cash Öows of crop producers. Food
management's actions appeared to have reduced the rate ofprocessors and wholesalers have been less negatively
credit quality deterioration. However, world events duringaÅected by commodity pricing and a rebound in livestock
the third quarter of 2001 had a profound impact onprices in 2001 has improved the credit exposure within this
consumer conÑdence and related spending, governmentalsector. At December 31, 2001, loans to paper and forestry
priorities and business activities. As a result of these events,products businesses represented 2.2 percent of the
the Company expected the economic slowdown tocommercial loan portfolio. The industry continues to be
accelerate or be more prolonged than originally estimatedadversely impacted by foreign supplies and over-capacity
by management. Since September 11, 2001, the FRB haswithin the industry; however, workout strategies continue
reduced the discount rate four times in an eÅort to stabilizeto reduce the credit exposure to this industry.
the Ñnancial markets and economic growth. Accordingly,
the Company conducted an additional review of its credit
U.S. Bancorp30

Analysis of Net Charge-OÅs Net charge-oÅs increased the economy, further deterioration in the manufacturing,
$721.1 million to $1,546.5 million in 2001, compared with communications and technology sectors and speciÑc
$825.4 million in 2000 and $672.6 million in 1999. The management decisions to accelerate its workout strategy for
ratio of total net charge-oÅs to average loans was certain borrowers. Commercial and commercial real estate
1.31 percent in 2001, compared with .70 percent in 2000 net charge-oÅs for 2001 also included $255.0 million in
and .61 percent in 1999. The increase in 2001 net charge- merger and restructuring-related charge-oÅs and charge-oÅs
oÅs was due to deterioration in economic conditions associated with the accelerated loan workout strategy
aÅecting the commercial loan portfolio, actions taken by announced in the Ñrst quarter of 2001. The increase in
the Company during 2001, and an increase in credit card commercial loan net charge-oÅs in 2000 included higher
net charge-oÅs. Also included in 2001 net charge-oÅs were losses on a growing portfolio of small business products,
$90.0 million of write-oÅs to conform risk management growth in the corporate card portfolio, credit losses related
practices, align charge-oÅ policies and expedite the to acquired leasing businesses and lower levels of recoveries
transition out of a speciÑc segment of the healthcare compared with 1999.
portfolio not meeting the risk proÑle of the Company. Retail loan net charge-oÅs in 2001 were $649.3 million,
Commercial and commercial real estate loan net compared with $523.8 million in 2000 and $478.5 million
charge-oÅs for 2001 were $884.6 million, compared with in 1999. The ratio of retail loan net charge-oÅs to average
$289.2 million in 2000 and $179.3 million in 1999. loans in 2001 was 1.85 percent, up from 1.60 percent in
Approximately $313.2 million of the increase in charge-oÅs 2000 and 1.57 percent in 1999. The increase in retail loan
reÖected several factors including: a large cattle fraud, net charge-oÅs in 2001 was primarily due to higher
recent collateral deterioration speciÑc to transportation bankruptcies and consumer delinquencies reÖecting the
equipment caused by the impact of higher fuel prices and continuing downturn in economic conditions.
Net Charge-oÅs as a Percentage of Average Loans Outstanding
Year Ended December 31 2001 2000 1999 1998 1997
Commercial
Commercial ÏÏÏÏÏÏÏÏÏÏÏÏÏÏÏÏÏÏÏÏÏÏÏÏÏÏÏÏÏÏÏÏÏÏÏÏÏÏÏÏÏÏÏÏÏ 1.62% .56% .41% *% *%
Lease ÑnancingÏÏÏÏÏÏÏÏÏÏÏÏÏÏÏÏÏÏÏÏÏÏÏÏÏÏÏÏÏÏÏÏÏÏÏÏÏÏÏÏÏÏ 1.95 .46 .24 * *
Total commercial ÏÏÏÏÏÏÏÏÏÏÏÏÏÏÏÏÏÏÏÏÏÏÏÏÏÏÏÏÏÏÏÏÏÏÏÏÏ 1.66 .55 .40 .31 .50
Commercial real estate
Commercial mortgages ÏÏÏÏÏÏÏÏÏÏÏÏÏÏÏÏÏÏÏÏÏÏÏÏÏÏÏÏÏÏÏÏÏÏÏ .21 .03 .02 * *
Construction and development ÏÏÏÏÏÏÏÏÏÏÏÏÏÏÏÏÏÏÏÏÏÏÏÏÏÏÏÏ .17 .11 .03 * *
Total commercial real estate ÏÏÏÏÏÏÏÏÏÏÏÏÏÏÏÏÏÏÏÏÏÏÏÏÏÏÏ .20 .05 .02 (.04) (.05)
Residential mortgages ÏÏÏÏÏÏÏÏÏÏÏÏÏÏÏÏÏÏÏÏÏÏÏÏÏÏÏÏÏÏÏÏÏ .18 .13 .12 .08 .06
Retail
Credit card ÏÏÏÏÏÏÏÏÏÏÏÏÏÏÏÏÏÏÏÏÏÏÏÏÏÏÏÏÏÏÏÏÏÏÏÏÏÏÏÏÏÏÏÏÏÏ 4.80 4.18 4.00 4.02 4.57
Retail leasing ÏÏÏÏÏÏÏÏÏÏÏÏÏÏÏÏÏÏÏÏÏÏÏÏÏÏÏÏÏÏÏÏÏÏÏÏÏÏÏÏÏÏÏÏ .65 .41 .28 * *
Other retail ÏÏÏÏÏÏÏÏÏÏÏÏÏÏÏÏÏÏÏÏÏÏÏÏÏÏÏÏÏÏÏÏÏÏÏÏÏÏÏÏÏÏÏÏÏÏ 1.40 1.23 1.19 * *
Total retail ÏÏÏÏÏÏÏÏÏÏÏÏÏÏÏÏÏÏÏÏÏÏÏÏÏÏÏÏÏÏÏÏÏÏÏÏÏÏÏÏÏÏÏ 1.85 1.60 1.57 1.51 1.65
Total loansÏÏÏÏÏÏÏÏÏÏÏÏÏÏÏÏÏÏÏÏÏÏÏÏÏÏÏÏÏÏÏÏÏÏÏÏÏÏÏÏ 1.31% .70% .61% .53% .63%
*Information not available
Analysis of Nonperforming Assets Nonperforming assets retail loans. The increase in nonperforming commercial
include nonaccrual loans, restructured loans, other real loans was primarily due to: merger and restructuring-related
estate and other nonperforming assets owned by the and risk management actions taken during the year; loans
Company. Interest payments are typically applied against the being written down to secondary market valuations and
principal balance and not recorded as income. placed on nonperforming status; and continuing stress in
At December 31, 2001, nonperforming assets totaled sectors of the economy. The increase was partially oÅset by
$1,120.0 million, compared with $867.0 million at year-end the disposition of nonperforming loans identiÑed as part of
2000 and $588.5 million at year-end 1999. The the Company's accelerated workout programs and
$253.0 million increase in nonperforming assets from commercial charge-oÅs taken during 2001. Certain industry
December 31, 2000 reÖects an increase of $190.0 million of sectors, including agriculture, have stabilized or improved
nonperforming commercial and commercial real estate from a year ago. The increase in nonperforming residential
loans, a $22.2 million increase in nonperforming residential mortgages and retail loans generally reÖects changes in
mortgages and a $23.8 million increase in nonperforming portfolio delinquencies and the national trends in
U.S. Bancorp
Table 13
31

unemployment and personal bankruptcies during 2001. The Accruing loans 90 days or more past due totaled
ratio of nonperforming assets to loans plus other real estate $462.9 million at December 31, 2001, compared with
was .98 percent at December 31, 2001, compared with $385.2 million at December 31, 2000, and $248.6 million at
.71 percent at year-end 2000 and .52 percent at year-end December 31, 1999. These loans are not included in
1999. Given the continued economic stress in various nonperforming assets and continue to accrue interest
industry sectors, the Company may experience higher levels because they are secured by collateral and/or are in the
of nonperforming assets during the next several quarters. process of collection and are reasonably expected to result
Nonperforming Assets(a)At December 31,
(Dollars in Millions) 2001 2000 1999 1998 1997
CommercialCommercialÏÏÏÏÏÏÏÏÏÏÏÏÏÏÏÏÏÏÏÏÏÏÏÏÏÏÏÏÏ $ 526.6 $470.4 $219.0 $230.4 $263.9
Lease Ñnancing ÏÏÏÏÏÏÏÏÏÏÏÏÏÏÏÏÏÏÏÏÏÏÏÏÏ 180.8 70.5 31.5 17.7 9.8
Total commercialÏÏÏÏÏÏÏÏÏÏÏÏÏÏÏÏÏÏÏÏÏ 707.4 540.9 250.5 248.1 273.7
Commercial real estateCommercial mortgages ÏÏÏÏÏÏÏÏÏÏÏÏÏÏÏÏÏÏ 131.3 105.5 138.2 86.9 94.9
Construction and development ÏÏÏÏÏÏÏÏÏÏÏ 35.9 38.2 31.6 28.4 19.5
Total commercial real estate ÏÏÏÏÏÏÏÏÏÏ 167.2 143.7 169.8 115.3 114.4
Residential mortgagesÏÏÏÏÏÏÏÏÏÏÏÏÏÏÏÏÏ 79.1 56.9 72.8 98.7 95.0
RetailCredit card ÏÏÏÏÏÏÏÏÏÏÏÏÏÏÏÏÏÏÏÏÏÏÏÏÏÏÏÏÏ Ì 8.8 5.0 2.6 *
Retail leasing ÏÏÏÏÏÏÏÏÏÏÏÏÏÏÏÏÏÏÏÏÏÏÏÏÏÏÏ 6.5 Ì .4 .5 .5
Other retail ÏÏÏÏÏÏÏÏÏÏÏÏÏÏÏÏÏÏÏÏÏÏÏÏÏÏÏÏÏ 41.1 15.0 21.1 30.4 17.1
Total retailÏÏÏÏÏÏÏÏÏÏÏÏÏÏÏÏÏÏÏÏÏÏÏÏÏÏÏ 47.6 23.8 26.5 33.5 17.6
Total nonperforming loansÏÏÏÏÏÏÏÏÏ 1,001.3 765.3 519.6 495.6 500.7
Other real estate ÏÏÏÏÏÏÏÏÏÏÏÏÏÏÏÏÏÏÏÏÏÏÏ 43.8 61.1 40.0 35.1 57.0
Other assets ÏÏÏÏÏÏÏÏÏÏÏÏÏÏÏÏÏÏÏÏÏÏÏÏÏÏÏÏ 74.9 40.6 28.9 16.9 17.4
Total nonperforming assetsÏÏÏÏÏÏÏÏ $1,120.0 $867.0 $588.5 $547.6 $575.1
Accruing loans 90 days or more past due(b)ÏÏ $ 462.9 $385.2 $248.6 $252.9 $213.7
Nonperforming loans to total loansÏÏÏÏÏÏÏÏÏÏÏ .88% .63% .46% .46% .51%
Nonperforming assets to total loans plus
other real estate ÏÏÏÏÏÏÏÏÏÏÏÏÏÏÏÏÏÏÏÏÏÏÏÏ .98 .71 .52 .51 .58
Net interest lost on nonperforming loans ÏÏÏÏÏ $ 63.0 $ 50.8 $ 29.5 $ 21.3 $ 32.1
Delinquent Loan Ratios(c)At December 31,
90 days or more past due 2001 2000 1999 1998 1997
CommercialCommercialÏÏÏÏÏÏÏÏÏÏÏÏÏÏÏÏÏÏÏÏÏÏÏÏÏÏÏÏÏ 1.44% 1.11% .57% .69% *%
Lease Ñnancing ÏÏÏÏÏÏÏÏÏÏÏÏÏÏÏÏÏÏÏÏÏÏÏÏÏ 3.53 1.24 .82 .57 *
Total commercialÏÏÏÏÏÏÏÏÏÏÏÏÏÏÏÏÏÏÏÏÏ 1.71 1.13 .59 .68 .84
Commercial real estateCommercial mortgages ÏÏÏÏÏÏÏÏÏÏÏÏÏÏÏÏÏÏ .73 .61 .82 .59 *
Construction and development ÏÏÏÏÏÏÏÏÏÏÏ .56 .57 .53 .60 *
Total commercial real estate ÏÏÏÏÏÏÏÏÏÏ .68 .60 .74 .59 .67
Residential mortgagesÏÏÏÏÏÏÏÏÏÏÏÏÏÏÏÏÏ 2.44 1.49 1.11 1.26 .89
RetailCredit card ÏÏÏÏÏÏÏÏÏÏÏÏÏÏÏÏÏÏÏÏÏÏÏÏÏÏÏÏÏ 2.18 1.85 1.33 1.07 *
Retail leasing ÏÏÏÏÏÏÏÏÏÏÏÏÏÏÏÏÏÏÏÏÏÏÏÏÏÏÏ .24 .20 .14 .13 *
Other retail ÏÏÏÏÏÏÏÏÏÏÏÏÏÏÏÏÏÏÏÏÏÏÏÏÏÏÏÏÏ .84 .64 .47 .47 *
Total retailÏÏÏÏÏÏÏÏÏÏÏÏÏÏÏÏÏÏÏÏÏÏÏÏÏÏÏ .98 .79 .59 .55 .50
TotalÏÏÏÏÏÏÏÏÏÏÏÏÏÏÏÏÏÏÏÏÏÏÏÏÏÏÏÏÏ 1.28% .94% .68% .70% .72%
(a) Throughout this document, nonperforming assets and related ratios do not include accruing loans 90 days or more past due.
(b) These loans are not included in nonperforming assets and continue to accrue interest because they are secured by collateral and/or are in the process of collection and are
reasonably expected to result in repayment or restoration to current status.
(c) Ratios include nonperforming loans and are expressed as a percentage of ending loan balances.
* Information not available
U.S. Bancorp
Table 14
32

Summary of Allowance for Credit Losses
(Dollars in Millions) 2001 2000 1999 1998 1997
Balance at beginning of year ÏÏÏÏÏÏÏÏÏÏÏÏÏÏÏÏÏÏÏÏÏÏÏÏÏÏÏÏÏ $1,786.9 $1,710.3 $1,705.7 $1,665.8 $1,600.1
Charge-oÅsCommercial
Commercial ÏÏÏÏÏÏÏÏÏÏÏÏÏÏÏÏÏÏÏÏÏÏÏÏÏÏÏÏÏÏÏÏÏÏÏÏÏÏ 779.0 319.8 250.1 * *
Lease ÑnancingÏÏÏÏÏÏÏÏÏÏÏÏÏÏÏÏÏÏÏÏÏÏÏÏÏÏÏÏÏÏÏÏÏÏÏ 144.4 27.9 12.4 * *
Total commercial ÏÏÏÏÏÏÏÏÏÏÏÏÏÏÏÏÏÏÏÏÏÏÏÏÏÏÏÏÏÏ 923.4 347.7 262.5 202.3 232.8
Commercial real estate
Commercial mortgagesÏÏÏÏÏÏÏÏÏÏÏÏÏÏÏÏÏÏÏÏÏÏÏÏÏÏÏÏ 49.5 15.8 19.1 * *
Construction and development ÏÏÏÏÏÏÏÏÏÏÏÏÏÏÏÏÏÏÏÏÏ 12.6 10.3 2.6 * *
Total commercial real estateÏÏÏÏÏÏÏÏÏÏÏÏÏÏÏÏÏÏÏÏ 62.1 26.1 21.7 23.6 27.3
Residential mortgagesÏÏÏÏÏÏÏÏÏÏÏÏÏÏÏÏÏÏÏÏÏÏÏÏÏÏÏÏÏÏÏÏ 15.8 13.7 16.2 14.4 11.1
Retail
Credit card ÏÏÏÏÏÏÏÏÏÏÏÏÏÏÏÏÏÏÏÏÏÏÏÏÏÏÏÏÏÏÏÏÏÏÏÏÏÏÏ 294.1 235.8 220.2 223.9 258.3
Retail leasingÏÏÏÏÏÏÏÏÏÏÏÏÏÏÏÏÏÏÏÏÏÏÏÏÏÏÏÏÏÏÏÏÏÏÏÏÏ 34.2 14.8 6.2 * *
Other retail ÏÏÏÏÏÏÏÏÏÏÏÏÏÏÏÏÏÏÏÏÏÏÏÏÏÏÏÏÏÏÏÏÏÏÏÏÏÏÏ 441.8 379.5 376.0 * *
Total retail ÏÏÏÏÏÏÏÏÏÏÏÏÏÏÏÏÏÏÏÏÏÏÏÏÏÏÏÏÏÏÏÏÏÏÏÏ 770.1 630.1 602.4 533.4 522.4
Total charge-oÅs ÏÏÏÏÏÏÏÏÏÏÏÏÏÏÏÏÏÏÏÏÏÏÏÏÏÏÏ 1,771.4 1,017.6 902.8 773.7 793.6
RecoveriesCommercial
Commercial ÏÏÏÏÏÏÏÏÏÏÏÏÏÏÏÏÏÏÏÏÏÏÏÏÏÏÏÏÏÏÏÏÏÏÏÏÏÏ 60.6 64.0 84.8 * *
Lease ÑnancingÏÏÏÏÏÏÏÏÏÏÏÏÏÏÏÏÏÏÏÏÏÏÏÏÏÏÏÏÏÏÏÏÏÏÏ 30.4 7.2 4.0 * *
Total commercial ÏÏÏÏÏÏÏÏÏÏÏÏÏÏÏÏÏÏÏÏÏÏÏÏÏÏÏÏÏÏ 91.0 71.2 88.8 81.9 59.3
Commercial real estate
Commercial mortgagesÏÏÏÏÏÏÏÏÏÏÏÏÏÏÏÏÏÏÏÏÏÏÏÏÏÏÏÏ 9.1 10.8 15.1 * *
Construction and development ÏÏÏÏÏÏÏÏÏÏÏÏÏÏÏÏÏÏÏÏÏ .8 2.6 1.0 * *
Total commercial real estateÏÏÏÏÏÏÏÏÏÏÏÏÏÏÏÏÏÏÏÏ 9.9 13.4 16.1 31.0 37.7
Residential mortgagesÏÏÏÏÏÏÏÏÏÏÏÏÏÏÏÏÏÏÏÏÏÏÏÏÏÏÏÏÏÏÏÏ 3.2 1.3 1.4 3.0 2.5
Retail
Credit card ÏÏÏÏÏÏÏÏÏÏÏÏÏÏÏÏÏÏÏÏÏÏÏÏÏÏÏÏÏÏÏÏÏÏÏÏÏÏÏ 23.4 27.5 34.6 36.9 38.3
Retail leasingÏÏÏÏÏÏÏÏÏÏÏÏÏÏÏÏÏÏÏÏÏÏÏÏÏÏÏÏÏÏÏÏÏÏÏÏÏ 4.5 2.0 1.1 * *
Other retail ÏÏÏÏÏÏÏÏÏÏÏÏÏÏÏÏÏÏÏÏÏÏÏÏÏÏÏÏÏÏÏÏÏÏÏÏÏÏÏ 92.9 76.8 88.2 * *
Total retail ÏÏÏÏÏÏÏÏÏÏÏÏÏÏÏÏÏÏÏÏÏÏÏÏÏÏÏÏÏÏÏÏÏÏÏÏ 120.8 106.3 123.9 112.6 93.1
Total recoveries ÏÏÏÏÏÏÏÏÏÏÏÏÏÏÏÏÏÏÏÏÏÏÏÏÏÏÏÏ 224.9 192.2 230.2 228.5 192.6
Net Charge-oÅsCommercial
Commercial ÏÏÏÏÏÏÏÏÏÏÏÏÏÏÏÏÏÏÏÏÏÏÏÏÏÏÏÏÏÏÏÏÏÏÏÏÏÏ 718.4 255.8 165.3 * *
Lease ÑnancingÏÏÏÏÏÏÏÏÏÏÏÏÏÏÏÏÏÏÏÏÏÏÏÏÏÏÏÏÏÏÏÏÏÏÏ 114.0 20.7 8.4 * *
Total commercial ÏÏÏÏÏÏÏÏÏÏÏÏÏÏÏÏÏÏÏÏÏÏÏÏÏÏÏÏÏÏ 832.4 276.5 173.7 120.4 173.5
Commercial real estate
Commercial mortgagesÏÏÏÏÏÏÏÏÏÏÏÏÏÏÏÏÏÏÏÏÏÏÏÏÏÏÏÏ 40.4 5.0 4.0 * *
Construction and development ÏÏÏÏÏÏÏÏÏÏÏÏÏÏÏÏÏÏÏÏÏ 11.8 7.7 1.6 * *
Total commercial real estateÏÏÏÏÏÏÏÏÏÏÏÏÏÏÏÏÏÏÏÏ 52.2 12.7 5.6 (7.4) (10.4)
Residential mortgagesÏÏÏÏÏÏÏÏÏÏÏÏÏÏÏÏÏÏÏÏÏÏÏÏÏÏÏÏÏÏÏÏ 12.6 12.4 14.8 11.4 8.6
Retail
Credit card ÏÏÏÏÏÏÏÏÏÏÏÏÏÏÏÏÏÏÏÏÏÏÏÏÏÏÏÏÏÏÏÏÏÏÏÏÏÏÏ 270.7 208.3 185.6 187.0 220.0
Retail leasingÏÏÏÏÏÏÏÏÏÏÏÏÏÏÏÏÏÏÏÏÏÏÏÏÏÏÏÏÏÏÏÏÏÏÏÏÏ 29.7 12.8 5.1 * *
Other retail ÏÏÏÏÏÏÏÏÏÏÏÏÏÏÏÏÏÏÏÏÏÏÏÏÏÏÏÏÏÏÏÏÏÏÏÏÏÏÏ 348.9 302.7 287.8 * *
Total retail ÏÏÏÏÏÏÏÏÏÏÏÏÏÏÏÏÏÏÏÏÏÏÏÏÏÏÏÏÏÏÏÏÏÏÏÏ 649.3 523.8 478.5 420.8 429.3
Total net charge-oÅs ÏÏÏÏÏÏÏÏÏÏÏÏÏÏÏÏÏÏÏÏÏÏÏ 1,546.5 825.4 672.6 545.2 601.0
Provision for credit losses ÏÏÏÏÏÏÏÏÏÏÏÏÏÏÏÏÏÏÏÏÏÏÏÏÏÏÏÏÏÏÏ 2,528.8 828.0 646.0 491.3 639.9
Losses from loan sales/transfersÏÏÏÏÏÏÏÏÏÏÏÏÏÏÏÏÏÏÏÏÏÏÏÏÏ (329.3) Ì Ì Ì Ì
Acquisitions and other changes ÏÏÏÏÏÏÏÏÏÏÏÏÏÏÏÏÏÏÏÏÏÏÏÏÏÏ 17.4 74.0 31.2 93.8 26.8
Balance at end of year ÏÏÏÏÏÏÏÏÏÏÏÏÏÏÏÏÏÏÏÏÏÏÏÏÏÏÏÏÏÏÏÏÏÏ $2,457.3 $1,786.9 $1,710.3 $1,705.7 $1,665.8
Allowance as a percentage of:
Period-end loansÏÏÏÏÏÏÏÏÏÏÏÏÏÏÏÏÏÏÏÏÏÏÏÏÏÏÏÏÏÏÏÏÏÏÏÏÏ 2.15% 1.46% 1.51% 1.59% 1.68%
Nonperforming loans ÏÏÏÏÏÏÏÏÏÏÏÏÏÏÏÏÏÏÏÏÏÏÏÏÏÏÏÏÏÏÏÏÏ 245 233 329 344 333
Nonperforming assets ÏÏÏÏÏÏÏÏÏÏÏÏÏÏÏÏÏÏÏÏÏÏÏÏÏÏÏÏÏÏÏÏ 219 206 291 312 290
Net charge-oÅs ÏÏÏÏÏÏÏÏÏÏÏÏÏÏÏÏÏÏÏÏÏÏÏÏÏÏÏÏÏÏÏÏÏÏÏÏÏÏ 159 216 254 313 277
*Information not available
U.S. Bancorp
Table 15
33

in repayment or restoration to current status. Retail loans result of world events occurring in the third quarter of
30 days to 89 days or more past due were 3.11 percent of 2001.
the total retail portfolio at December 31, 2001, compared Management determines the amount of allowance that
with 2.82 percent of the total retail portfolio at is required for certain loan categories based on relative risk
December 31, 2000. Retail loans 90 days or more past due characteristics of the loan portfolio. Table 16 shows the
totaled .98 percent of the total retail loan portfolio at amount of the allowance for credit losses by loan category.
December 31, 2001, compared with .79 percent of the total During 2001, the Company, in connection with the merger
retail loan portfolio at December 31, 2000, and .59 percent of Firstar and USBM, conformed its methodology for
at December 31, 1999. The increase in retail loan determining speciÑc allowances for the elements of the loan
delinquencies was primarily related to the credit card, home portfolio. While both predecessor companies utilized credit
equity and revolving credit line portfolios and reÖects the risk rating processes, migration analysis and historical loss
economic slowdown and unemployment trends during 2001. experience to determine each element of its allowance for
credit losses, Firstar speciÑcally determined its commercialAnalysis and Determination of Allowance for Credit Losses
allowance based on its net loss experience, while USBMThe allowance for credit losses provides coverage for
utilized its gross loss experience. Although diversity exists inprobable losses inherent in the Company's loan portfolio.
practice, the Company has adopted a net loss experienceManagement evaluates the allowance each quarter to
methodology in determining the allowance for commercialdetermine that it is adequate to cover inherent losses. The
credit losses. Adopting the net loss experience methodologyevaluation of each element and the overall allowance is
is based, in part, on regulatory guidelines promulgated withbased on a continuing assessment of problem loans and
respect to evaluating the allowance for credit losses. Inrelated oÅ-balance sheet items, recent loss experience, and
addition to adopting a net loss experience method, theother factors, including regulatory guidance and economic
Company enhanced its commercial migration methods forconditions. Management has determined that the allowance
higher quality commercial loan categories to betterfor credit losses is adequate.
diÅerentiate historical loss factors within those categories.At December 31, 2001, the allowance was $2.5 billion
Also, given the current business cycle, historical loss factors(2.15 percent of loans). This compares with an allowance
utilized in determining the allowance for commercial loansof $1.8 billion (1.46 percent of loans), at year-end 2000,
were weighted to reÖect the adverse impact of recent losses.and $1.7 billion (1.51 percent of loans), at December 31,
Table 16 shows the determination of each element of the1999. The ratio of the allowance for credit losses to
allowance for credit losses on a consistent basis for 2001nonperforming loans was 245 percent at December 31,
and 2000. Due to the Company's inability to gather2001, compared with 233 percent at year-end 2000 and
historical loss data on a combined basis for 1997 through329 percent at year-end 1999. The ratio of the allowance
1999, the methodologies and amounts assigned to eachfor credit losses to net charge-oÅs was 159 percent at
element of the loan portfolio for these years have not beenDecember 31, 2001, compared with 216 percent at year-end
conformed.2000 and 254 percent at year-end 1999. The Company
The allowance recorded for commercial loans is basedconsiders historical charge-oÅ levels in addition to existing
on a quarterly review of individual credit relationships. Theconditions, among other factors, when establishing the
Company's regular risk rating process is an integralallowance for credit losses.
component of the methodology utilized in determining theSeveral factors impacted the allowance for credit losses
allowance for credit losses. An analysis of the migration ofduring 2001, including merger and restructuring-related
commercial and commercial real estate loans and actual losscredit actions and management's extensive review of the
experience throughout the business cycle is also conductedcommercial loan portfolio in light of current economic
quarterly to assess reserves established for credits withconditions. The level of the allowance was also impacted
similar risk characteristics. An allowance is established forby risk rating changes by regulators of shared national
pools of commercial and commercial real estate loans basedcredits agented by other banks, Company-speciÑc portfolio
on the risk ratings assigned. The amount is supported bytrends discussed previously, and the transfer of the
the results of the migration analysis that considers historicalunsecured small business product portfolio to loans held
loss experience by risk rating, as well as current andfor sale. The increase in the allowance for credit losses
historical economic conditions and industry risk factors.reÖects the impact of changes in the economy since
The Company separately analyzes the carrying value ofDecember 31, 2000, and related deterioration in certain
impaired loans to determine whether the carrying value issectors of the Company's credit portfolio. It also reÖects
less than or equal to the appraised collateral value or themanagement's recognition that the current economic
present value of expected cash Öows. Based on this analysis,slowdown has accelerated and may be more prolonged as a
an allowance for credit losses may be speciÑcally established
U.S. Bancorp34

Elements of the Allowance for Credit Losses(a)
Allowance Amount Allowance as a Percent of Total Loans
December 31 (Dollars in Millions) 2001 2000 1999 1998 1997 2001 2000 1999 1998 1997
Commercial
Commercial ÏÏÏÏÏÏÏÏÏÏÏÏÏÏÏÏÏÏ $1,068.1 $ 418.8 $ 408.3 $ 343.7 $ 370.5 2.64% .90% .97% .91% 1.10%
Lease ÑnancingÏÏÏÏÏÏÏÏÏÏÏÏÏÏÏ 107.5 17.7 20.2 21.5 16.4 1.84 .29 .53 .65 .61
Total commercial ÏÏÏÏÏÏÏÏÏÏ 1,175.6 436.5 428.5 365.2 386.9 2.54 .83 .93 .89 1.06
Commercial real estate
Commercial mortgages ÏÏÏÏÏÏÏÏ 176.6 42.7 110.4 105.2 105.6 .94 .22 .59 .63 .67
Construction and development ÏÏ 76.4 17.7 22.5 25.9 27.7 1.16 .25 .35 .50 .68
Total commercial real estateÏÏ 253.0 60.4 132.9 131.1 133.3 1.00 .23 .53 .60 .67
Residential mortgages ÏÏÏÏÏÏ 16.1 9.6 18.6 27.2 36.9 .28 .12 .16 .19 .23
Retail
Credit card ÏÏÏÏÏÏÏÏÏÏÏÏÏÏÏÏÏÏÏ 295.2 265.6 320.8 304.3 217.4 5.01 3.95 6.41 6.27 4.35
Retail leasing ÏÏÏÏÏÏÏÏÏÏÏÏÏÏÏÏÏ 38.7 27.2 18.6 6.5 4.9 .79 .65 .88 .40 .45
Other retail ÏÏÏÏÏÏÏÏÏÏÏÏÏÏÏÏÏÏÏ 377.2 360.0 389.2 365.6 257.9 1.44 1.47 1.64 1.55 1.23
Total retail ÏÏÏÏÏÏÏÏÏÏÏÏÏÏÏÏ 711.1 652.8 728.6 676.4 480.2 1.92 1.85 2.36 2.25 1.78
Total allocated allowanceÏÏÏ 2,155.8 1,159.3 1,308.6 1,199.9 1,037.3 1.89 .95 1.16 1.12 1.05
Unallocated portion ÏÏÏÏÏÏÏÏ 301.5 627.6 401.7 505.8 628.5 .26 .51 .35 .47 .63
Total allowance ÏÏÏÏÏÏÏÏÏÏÏÏÏÏÏÏÏÏ $2,457.3 $1,786.9 $1,710.3 $1,705.7 $1,665.8 2.15% 1.46% 1.51% 1.59% 1.68%
(a) During 2001, the Company changed its methodology for determining the speciÑc allowance for elements of the loan portfolio. Table 16 has been restated for 2000. Due to the
Company's inability to gather historical loss data on a combined basis for 1997 through 1999, the methodologies and amounts assigned to each element of the loan portfolio for
these years have not been conformed. Utilizing the prior methods the total assigned allowance for 2000 was $1,397.3 million and the unallocated portion was $389.6 million. Refer
to paragraph four in the section captioned ""Analysis and Determination of Allowance for Credit Losses'' on page 34.
for impaired loans. The allowance established for customer-speciÑc conditions aÅecting the identiÑcation and
commercial and commercial real estate loan portfolios, estimation of losses for larger non-homogeneous credits and
including impaired commercial and commercial real estate the sensitivity of assumptions utilized to establish
loans, increased $931.7 million to $1,428.6 million in 2001. allowances for homogenous groups of loans are among
The change reÖected higher levels of nonperforming loans, other factors. For each of these factors, the estimated
increased loss severity reÖected in the historical migration, inherent loss is recorded as an unallocated allowance. The
increasing sector risk in certain industries and deterioration Company estimates a range of inherent losses related to the
in credit risk ratings from a year ago. existence of these exposures and for the risk in
The allowance recorded for retail portfolios is based concentrations to speciÑc borrowers, Ñnancings of highly
on an analysis of product mix, credit scoring and risk leveraged transactions, products or industries. The estimates
composition of the portfolio, loss and bankruptcy are based upon the Company's evaluation of imprecision
experiences, economic conditions and historical and risk associated with the commercial and retail allowance
expected delinquency and charge-oÅ statistics for each levels and the estimated impact of the current economic
homogenous category or group of loans. Based on this environment on portfolio segments or concentrations. The
information and analysis, an allowance is established unallocated allowance decreased to $301.5 million at
approximating a rolling twelve-month estimate of net December 31, 2001, from $627.6 million at December 31,
charge-oÅs. The allowance for retail loans increased 2000. The change in unallocated allowance reÖects
$58.3 million to $711.1 million in 2001. The increase deterioration in credit quality during 2001. Although the
primarily reÖected the continuing downturn in economic Company determines the amount of each element of the
conditions. allowance separately and this process is an important credit
Regardless of the extent of the Company's analysis of management tool, the entire allowance for credit losses is
customer performance, portfolio trends or risk management available for the entire loan portfolio. The actual amount
processes, certain inherent but undetected losses are of losses incurred can vary signiÑcantly from the recorded
probable within the loan portfolio. This is due to several amounts. The Company's methodology includes several
factors including inherent delays in obtaining information factors intended to minimize the diÅerences in recorded and
regarding a customer's Ñnancial condition or changes in actual losses. These factors allow the Company to adjust its
their unique business conditions, the judgmental nature of estimate of losses based on the most recent information
individual loan evaluations, collateral assessments and the available. Refer to Note 1 of the Notes to Consolidated
interpretation of economic trends. Volatility of economic or
U.S. Bancorp
Table 16
35

Financial Statements for accounting policies related to the timing and degree of changes in residual values that may
allowance for credit losses. impact Ñnancial results over the next several quarters.
At December 31, 2001, the commercial leasingResidual Risk Management The Company manages its
portfolio had $984.6 million of residuals. At year-end 2001,risk to changes in the value of lease residual assets through
lease residuals related to railcars were 16.2 percent. Trucksdisciplined residual setting and valuation at the inception of
and other transportation equipment representeda lease, diversiÑcation of its vehicles, a focus on longer term
30.2 percent of the aggregate portfolio while aircraft andvehicle leases, eÅective end-of-term marketing of oÅ-leased
manufacturing were 14.9 percent and 12.7 percent,vehicles, regular asset valuation reviews and monitoring of
respectively. No other signiÑcant concentrations of moreresidual value gains or losses upon the disposition of assets.
than 10 percent existed at December 31, 2001. DuringTo reduce the Ñnancial impact of potential changes in
2001, reduced airline travel and higher fuel costs adverselyvehicle residuals, the Company maintains residual value risk
impacted aircraft and transportation equipment leaseinsurance. Also, equipment lease originations are subject to
residual values. Although impairment of equipment leasethe same stringent underwriting standards referred to in the
residuals was not signiÑcant in 2001, continuing economicsegment captioned ""Credit Risk Management''.
stress in certain industries may further impact usedIncluded in the retail leasing portfolio was
equipment values into next year.approximately $2.8 billion of retail leasing residuals at
December 31, 2001, compared with $2.4 billion at Interest Rate Risk Management In the banking industry,
December 31, 2000. The Company monitors concentrations a major risk exposure is changing interest rates. To
of leases by manufacturer, vehicle ""make'' and vehicle type. minimize the volatility of net interest income and exposure
At year-end 2001, no vehicle-type concentration exceeded to economic losses, the Company manages its exposure to
Ñve percent of the aggregate portfolio. Because retail changes in interest rates through asset and liability
residual valuations tend to be less volatile for longer-term management activities within guidelines established by its
leases, relative to the estimated residual at inception of the Asset Liability Policy Committee (""ALPC'') and approved
lease, management actively manages lease origination by the Board of Directors. ALPC has the responsibility for
production to achieve a longer-term portfolio. At approving and ensuring compliance with asset/liability
December 31, 2001, the weighted-average term of the management policies, including interest rate risk exposure,
portfolio was 51 months. Since 1998, the used vehicle oÅ-balance sheet activity and the investment portfolio. The
market has experienced a decline in used car prices. Several Company uses three methods for measuring and analyzing
factors have contributed to this deÖationary cycle. consolidated interest rate risk: Net Interest Income
Aggressive leasing programs by automobile manufacturers Simulation Analysis, Market Value of Equity Modeling and
and competitors within the banking industry included a Repricing Mismatch Analysis.
marketing focus on monthly lease payments, enhancedNet Interest Income Simulation Analysis One of the
residuals at lease inception, shorter-term leases and lowprimary tools used to measure interest rate risk and the
mileage leases. These practices have created a cyclicaleÅect of interest rate changes on net interest income and
oversupply of certain oÅ-lease vehicles. Recently,net interest margin is simulation analysis. The monthly
automobile manufacturers and others have retreated fromanalysis incorporates substantially all of the Company's
these marketing programs or begun to exit the leasingassets and liabilities and oÅ-balance sheet instruments,
business. Another factor impacting the used vehicle markettogether with forecasted changes in the balance sheet and
has been the trend in new vehicle prices that decreased inassumptions that reÖect the current interest rate
the late 1990's. This trend has been driven by surplusenvironment. Through these simulations, management
automobile manufacturing capacity and related productionestimates the impact on net interest income of a 300 basis
and highly competitive Internet sales programs.point upward or downward gradual change of market
Recessionary factors are expected to moderate new carinterest rates over a one year period. The simulations also
production during the next several quarters. Also, manyestimate the eÅect of immediate and sustained parallel shifts
Internet marketers failed or transformed into distributionin the yield curve of 50 basis points as well as the eÅect of
channels of dealers rather than direct competitors. Theseimmediate and sustained Öattening or steepening of the
recent trends are expected to abate the deÖationary pricingyield curve. These simulations include assumptions about
pressures of the past few years. In response to factorshow the balance sheet is likely to change with changes in
impacting used vehicle prices, the Company recognized aloan and deposit growth. Assumptions are made to project
retail lease impairment of $40.0 million in 2001. Given therates for new loans and deposits based on historical
current economic environment, it is diÇcult to assess theanalysis, management's outlook and repricing strategies.
Loan prepayment and other options risks are developed
U.S. Bancorp36

Derivative Positions
Asset and Liability Management PositionsWeighted-
AverageMaturing
RemainingDecember 31, 2001 Fair Maturity(Dollars in Millions) 2002 2003 2004 2005 2006 Thereafter Total Value in Years
Receive Ñxed/pay Öoating swaps
Notional amount ÏÏÏÏÏÏÏÏÏÏÏÏÏÏÏÏÏÏÏÏÏÏÏÏÏ $3,295 $1,625 $3,223 $1,861 $875 $5,240 $16,119 $329.6 6.30
Weighted-average
Receive rate ÏÏÏÏÏÏÏÏÏÏÏÏÏÏÏÏÏÏÏÏÏÏÏÏÏ 4.57% 6.04% 5.06% 6.05% 5.73% 6.68% 5.74%
Pay rate ÏÏÏÏÏÏÏÏÏÏÏÏÏÏÏÏÏÏÏÏÏÏÏÏÏÏÏÏÏ 2.00 1.97 2.10 2.14 2.11 2.07 2.06
Pay Ñxed/receive Öoating swaps
Notional amount ÏÏÏÏÏÏÏÏÏÏÏÏÏÏÏÏÏÏÏÏÏÏÏÏÏ $ 500 $ 962 $ 500 $ Ì $ Ì $ Ì $ 1,962 $ (2.1) 1.74
Weighted-average
Receive rate ÏÏÏÏÏÏÏÏÏÏÏÏÏÏÏÏÏÏÏÏÏÏÏÏÏ 1.79% 1.90% 1.87% Ì% Ì% Ì% 1.86%
Pay rate ÏÏÏÏÏÏÏÏÏÏÏÏÏÏÏÏÏÏÏÏÏÏÏÏÏÏÏÏÏ 2.08 4.24 3.98 Ì Ì Ì 3.62
Basis swaps ÏÏÏÏÏÏÏÏÏÏÏÏÏÏÏÏÏÏÏÏÏÏÏÏÏÏÏÏÏÏÏ $1,000 $ Ì $ Ì $ Ì $ Ì $ Ì $ 1,000 $ .2 0.69
Future and forwards ÏÏÏÏÏÏÏÏÏÏÏÏÏÏÏÏÏÏÏÏÏÏÏÏ 4,087 Ì Ì Ì Ì Ì 4,087 71.7 Ì
Options ÏÏÏÏÏÏÏÏÏÏÏÏÏÏÏÏÏÏÏÏÏÏÏÏÏÏÏÏÏÏÏÏÏÏÏÏ Ì Ì Ì Ì 45 Ì 45 Ì 4.9
Customer Intermediated PositionsWeighted-
AverageMaturing
RemainingDecember 31, 2001 Fair Maturity(Dollars in Millions) 2002 2003 2004 2005 2006 Thereafter Total Value In Years
Receive Ñxed/pay Öoating swaps
Notional amount ÏÏÏÏÏÏÏÏÏÏÏÏÏÏÏÏÏÏÏÏÏÏÏÏÏ $ 218 $ 408 $ 386 $ 276 $424 $ 425 $ 2,137 $ 63.5 3.83
Pay Ñxed/receive Öoating swaps
Notional amount ÏÏÏÏÏÏÏÏÏÏÏÏÏÏÏÏÏÏÏÏÏÏÏÏÏ 217 409 386 276 424 425 2,137 (53.4) 3.83
Basis swaps ÏÏÏÏÏÏÏÏÏÏÏÏÏÏÏÏÏÏÏÏÏÏÏÏÏÏÏÏÏÏÏ Ì Ì 2 Ì Ì Ì 2 Ì 2.67
Options ÏÏÏÏÏÏÏÏÏÏÏÏÏÏÏÏÏÏÏÏÏÏÏÏÏÏÏÏÏÏÏÏÏÏÏÏ 514 615 78 Ì Ì 4 1,211 Ì 1.29
Foreign exchange contracts
Purchase ÏÏÏÏÏÏÏÏÏÏÏÏÏÏÏÏÏÏÏÏÏÏÏÏÏÏÏÏÏÏÏ 1,810 26 Ì Ì Ì Ì 1,836 60.0 .25
SellÏÏÏÏÏÏÏÏÏÏÏÏÏÏÏÏÏÏÏÏÏÏÏÏÏÏÏÏÏÏÏÏÏÏÏÏÏ 1,801 26 Ì Ì Ì Ì 1,827 (58.0) .25
from industry estimates of prepayment speeds. Because the in a 200 basis point parallel rate shock to 15 percent of the
results of these simulations can be signiÑcantly inÖuenced base case. Given the low level of rates currently the down
by assumptions utilized, management evaluates the 200 basis point scenario cannot be computed. ALPC
sensitivity of the simulation's results to changes in key reviews other down rate scenarios to evaluate the impact of
assumptions. falling rates.
The results from the simulation are reviewed by ALPC The valuation analysis is dependent upon certain key
monthly and are used to guide hedging strategies. ALPC assumptions about the nature of indeterminate maturity of
policy guidelines limit the estimated change in net interest assets and liabilities. Management estimates the average life
income to 5.0 percent of forecasted net interest income and rate characteristics of asset and liability accounts based
over the succeeding 12 months. In simulations as of upon historical analysis and management's expectation of
December 31, 2001, the interest rate risk position of the rate behavior. The results of the valuation analysis as of
Company was relatively neutral as the impact of a December 31, 2001, were well within policy guidelines.
downward movement in rates or an upward movement inRepricing Mismatch Analysis The Company also evaluates
rates of 300 basis points over a twelve month periodits interest rate sensitivity position to maintain a balance
resulted in less than 1.0 percent change in net interestbetween the amounts of interest-bearing assets and
income. At December 31, 2001, the Company was wellinterest-bearing liabilities which are expected to mature or
within policy guidelines.reprice at any point in time. While a traditional repricing
Market Value of Equity Modeling The Company also mismatch analysis (""gap analysis'') provides a snapshot of
utilizes the market value of equity as a measurement tool in interest rate risk, it does not take into consideration that
managing interest rate sensitivity. The market value of assets and liabilities with similar repricing characteristics
equity measures the degree to which the market values of may not reprice at the same time or to the same degree.
the Company's assets and liabilities and oÅ-balance sheet Also, it does not necessarily predict the impact of changes
instruments will change given a change in interest rates. in general levels of interest rates on net interest income.
ALPC guidelines limit the change in market value of equity
U.S. Bancorp
Table 17
37
Use of Derivatives to Manage Market and Interest Rate enters into legally enforceable master netting agreements,
Risk In the ordinary course of business, the Company which permit the close out and netting of transactions with
enters into derivative transactions to manage its market and the same counterparty upon the occurrence of certain
prepayment risks and to accommodate the business events. Also, a portion of the derivative activity involves
requirements of its customers. By their nature, derivative exchange-traded instruments. Because exchange-traded
instruments are subject to market risk. The Company does instruments conform to standard terms and are subject to
not utilize derivative instruments for speculative purposes. policies set by the exchange involved, including
To manage its interest rate risk, the Company may enter counterparty approval, margin requirements and security
into interest rate swap agreements and, to a lesser degree, deposit requirements, the credit risk is substantively
basis swaps, and interest rate options such as caps and reduced.
Öoors. Interest rate swaps involve the exchange of Ñxed- Table 17 summarizes information on derivative
and variable-rate payments without the exchange of the positions as of December 31, 2001.
underlying notional amount on which the interest paymentsMarket Risk Management In addition to interest rate risk
are calculated. Interest rate caps protect against risingand market risk associated with derivatives, the Company is
interest rates while interest rate Öoors protect against fallingexposed to other forms of market risk as a consequence of
interest rates. In connection with its mortgage bankingconducting normal business activities. Business activities that
business, the Company may enter into forwardcontribute to market risk include, among other things,
commitments, futures and options to hedge interest ratemarket making, underwriting, proprietary trading and
risk of Ñxed-rate mortgage loans held for sale and unfundedforeign exchange positions. Value at Risk (""VaR'') is a key
commitments. All interest rate derivatives that qualify formeasure of market risk for the Company. VaR represents
hedge accounting are recorded at fair value as other assetsthe maximum amount that the Company has placed at risk
or liabilities on the balance sheet and designated as eitherof loss, with a ninety-nine percent degree of conÑdence, in
""fair value'' or ""cash Öow'' hedges. The Company performsthe course of its risk taking activities. Its purpose is to
an assessment, both at the inception of the hedge anddescribe the amount of earnings at risk due to potential
quarterly thereafter, to determine whether these derivativeslosses from adverse market movements.
are highly eÅective in oÅsetting changes in the value of theVaR modeling on trading activities is subject to certain
hedged items. Hedge ineÅectiveness for both cash Öow andlimitations. Additionally, it should be recognized that there
fair value hedges is immediately recorded in noninterestare assumptions and estimates associated with VaR
income.modeling and actual results could diÅer from these
The Company also enters into derivative contracts toassumptions and estimates. The Company mitigates these
accommodate the business requirements of its customers.uncertainties through regular monitoring of trading activities
Customer intermediated transactions may include interestby management and other risk management practices
rate derivatives and foreign exchange forward contracts andincluding stop-loss limits and position limits. A stress-test
options. Foreign exchange-based forward contracts providemodel is used to provide management with a perspective on
for the delayed delivery of a purchase or sale of foreignmarket events that a VaR model does not capture. In each
currency. Generally, the Company enters into oÅsettingcase, the historical worst performance of each asset class is
derivative positions to mitigate its market risk associatedobserved and applied to current trading positions.
with customer-based contracts. Intermediated interest rateALPC establishes market risk limits subject to approval
swaps, foreign exchange contracts and all other derivativeby the Company's Board of Directors. The Company's VaR
contracts that do not qualify for hedge accounting arelimit was $40.0 million at December 31, 2001. The market
recorded at fair value and resulting gains or losses arerisk inherent in the Company's customer-based derivative
recorded in trading account proÑts and commissions.trading, mortgage banking pipeline, broker-dealer activities,
Derivative instruments are subject to credit risk associatedincluding equities, Ñxed income, high yield securities and
with counterparties to the derivative contracts. Credit riskforeign exchange, as estimated by the VaR analysis, was
associated with derivatives is measured based on the$10.9 million at December 31, 2001.
replacement cost should the counterparties with contracts
in a gain position to the Company fail to perform under the Liquidity Risk Management ALPC establishes policies, as
terms of the contracts. The Company manages this risk well as analyzes and manages liquidity, to ensure that
through diversiÑcation of its derivative positions among adequate funds are available to meet normal operating
dealers, primarily commercial banks, broker-dealers and requirements in addition to unexpected customer demands
corporations, with established relationships and requiring for funds, such as high levels of deposit withdrawals or
collateral to support credit exposures in excess of loan demand, in a timely and cost-eÅective manner. The
established guidelines. To minimize the risk, the Company most important factor in the preservation of liquidity is
U.S. Bancorp38

maintaining public conÑdence that facilitates the retention Additionally, the Company previously created asset-backed
and growth of a large, stable supply of core deposits and securitizations to fund the noninterest-bearing corporate
wholesale funds. Ultimately, public conÑdence is generated card loan portfolio and indirect automobile loans. The
through proÑtable operations, sound credit quality and a corporate card securitization held $403 million in average
strong capital position. The Company's performance in assets in 2001 and is scheduled to be liquidated in
these areas has enabled it to develop a large and reliable February 2002. The indirect automobile securitization held
base of core funding within its market areas and in $655 million of average assets in 2001. The Company
domestic and global capital markets. Liquidity management provided credit enhancements in the form of subordination
is viewed from a long-term and short-term perspective, as and reserve accounts at the inception of the transactions.
well as from an asset and liability perspective. Management The Company's risk, primarily for losses in the underlying
monitors liquidity through a regular review of maturity assets, is considered in determining the fair value of the
proÑles, yield and rate behaviors, and loan and deposit Company's retained interests in these securitizations. The
forecasts to minimize funding risk. Company recognized income from residual interests and
The Company maintains strategic liquidity and servicing fees for these securitizations of $15.5 million in
contingency plans that are subject to the availability of asset 2001. Refer to Note 8 of the Notes to Consolidated
liquidity in the balance sheet. ALPC periodically reviews the Financial Statements for further information on these oÅ-
Company's ability to meet funding deÑciencies due to balance sheet structures.
adverse business events. These funding needs are then With respect to real estate and certain equipment, the
matched with speciÑc asset-based sources to ensure Company enters into capital or operating leases to meet its
suÇcient funds are available. Also, strategic liquidity policies business requirements. Certain operating lease arrangements
require diversiÑcation of wholesale funding sources to avoid involve third party lessors that acquire these business assets
concentrations in any one market source. Subsidiary banks through leveraged Ñnancing structures commonly referred to
are members of various Federal Home Loan Banks that as ""synthetic leases''. At December 31, 2001, synthetic lease
provide a source of funding through FHLB advances. The structures held real estate assets of $372.7 million and
Company maintains a Grand Cayman oÇce for issuing equipment of $41.6 million. The Company provides
eurodollar certiÑcates of deposit. The Company also guarantees to the lender in the event of default by the
establishes relationships with dealers to issue national leveraged Ñnancing structures or in the event that the
market retail and institutional savings certiÑcates and short- Company does not exercise its option to purchase the
and medium-term bank notes. Also, the Company's property at the end of the lease term and the fair value of
subsidiary banks have signiÑcant correspondent banking the assets is less than the purchase price. The Company's
networks and corporate accounts. Accordingly, it has access minimum lease obligations for capital and operating
to national fed funds, funding through repurchase arrangements, including those related to synthetic leases, are
agreements and sources of more stable regionally based disclosed in Note 22 of the Notes to Consolidated
certiÑcates of deposit. Financial Statements.
Asset securitization and conduits represent another Credit, liquidity, operational and legal structural risks
source of funding the Company's growth through oÅ- exist due to the nature and complexity of asset
balance sheet structures. The Company has two oÅ-balance securitizations and other oÅ-balance sheet structures. ALPC
sheet conduits that hold high-grade assets. The conduits, regularly monitors the performance of each oÅ-balance
which are funded by issuing commercial paper, held average sheet structure in an eÅort to minimize these risks and
assets of $14.8 billion including short-term participations in ensure compliance with the requirements of the structures.
commercial loans, commercial paper and investment The Company utilizes its credit risk management systems to
securities. The Company provides liquidity facilities to both evaluate credit quality of underlying assets and regularly
conduits and credit enhancement to the loan conduit that forecasts cash Öows to evaluate any potential impairment of
may be triggered by certain events. Based on the current retained interests. Also, regulatory guidelines require
performance of each structure the Company does not consideration of asset securitizations in the determination of
anticipate these triggers will occur in the foreseeable future. risk-based capital ratios.
Included in noninterest income was $132.7 million of The Company's ability to raise negotiated funding at
revenue related to these conduits in 2001 including fees for competitive prices is influenced by rating agencies' views of
servicing activities and liquidity facilities and credit the Company's credit quality, liquidity, capital and earnings.
enhancements. The debt ratings noted in Table 18 reflect the rating agencies'
In November 2001, the Company established a recognition of the strong, consistent financial performance of
$738 million securitization structure related to an unsecured the Company and quality of the balance sheet.
small business credit product that was being discontinued.
U.S. Bancorp 39
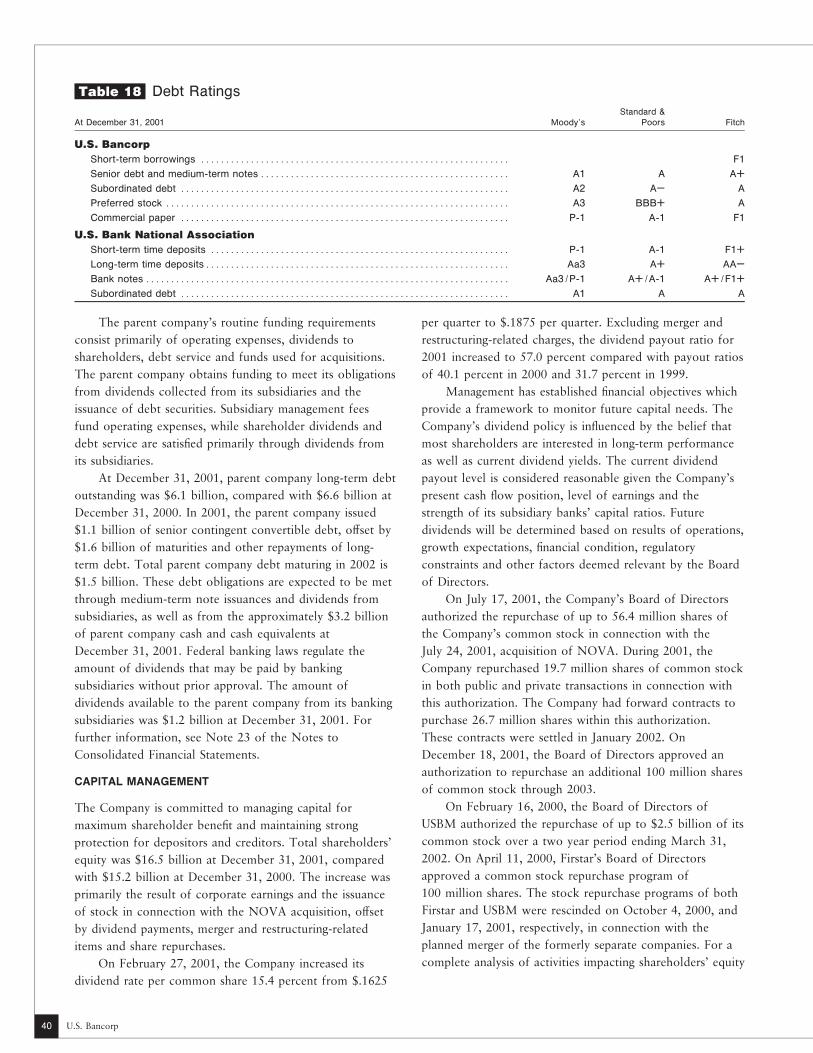
Debt Ratings
Standard &At December 31, 2001 Moody's Poors Fitch
U.S. Bancorp
Short-term borrowings ÏÏÏÏÏÏÏÏÏÏÏÏÏÏÏÏÏÏÏÏÏÏÏÏÏÏÏÏÏÏÏÏÏÏÏÏÏÏÏÏÏÏÏÏÏÏÏÏÏÏÏÏÏÏÏÏÏÏÏÏÏÏ F1
Senior debt and medium-term notes ÏÏÏÏÏÏÏÏÏÏÏÏÏÏÏÏÏÏÏÏÏÏÏÏÏÏÏÏÏÏÏÏÏÏÏÏÏÏÏÏÏÏÏÏÏÏÏÏÏÏ A1 A A°
Subordinated debt ÏÏÏÏÏÏÏÏÏÏÏÏÏÏÏÏÏÏÏÏÏÏÏÏÏÏÏÏÏÏÏÏÏÏÏÏÏÏÏÏÏÏÏÏÏÏÏÏÏÏÏÏÏÏÏÏÏÏÏÏÏÏÏÏÏÏ A2 A¿ A
Preferred stock ÏÏÏÏÏÏÏÏÏÏÏÏÏÏÏÏÏÏÏÏÏÏÏÏÏÏÏÏÏÏÏÏÏÏÏÏÏÏÏÏÏÏÏÏÏÏÏÏÏÏÏÏÏÏÏÏÏÏÏÏÏÏÏÏÏÏÏÏÏ A3 BBB° A
Commercial paper ÏÏÏÏÏÏÏÏÏÏÏÏÏÏÏÏÏÏÏÏÏÏÏÏÏÏÏÏÏÏÏÏÏÏÏÏÏÏÏÏÏÏÏÏÏÏÏÏÏÏÏÏÏÏÏÏÏÏÏÏÏÏÏÏÏÏ P-1 A-1 F1
U.S. Bank National Association
Short-term time deposits ÏÏÏÏÏÏÏÏÏÏÏÏÏÏÏÏÏÏÏÏÏÏÏÏÏÏÏÏÏÏÏÏÏÏÏÏÏÏÏÏÏÏÏÏÏÏÏÏÏÏÏÏÏÏÏÏÏÏÏÏ P-1 A-1 F1°
Long-term time depositsÏÏÏÏÏÏÏÏÏÏÏÏÏÏÏÏÏÏÏÏÏÏÏÏÏÏÏÏÏÏÏÏÏÏÏÏÏÏÏÏÏÏÏÏÏÏÏÏÏÏÏÏÏÏÏÏÏÏÏÏÏ Aa3 A° AA¿
Bank notes ÏÏÏÏÏÏÏÏÏÏÏÏÏÏÏÏÏÏÏÏÏÏÏÏÏÏÏÏÏÏÏÏÏÏÏÏÏÏÏÏÏÏÏÏÏÏÏÏÏÏÏÏÏÏÏÏÏÏÏÏÏÏÏÏÏÏÏÏÏÏÏÏÏ Aa3/P-1 A°/A-1 A°/F1°
Subordinated debt ÏÏÏÏÏÏÏÏÏÏÏÏÏÏÏÏÏÏÏÏÏÏÏÏÏÏÏÏÏÏÏÏÏÏÏÏÏÏÏÏÏÏÏÏÏÏÏÏÏÏÏÏÏÏÏÏÏÏÏÏÏÏÏÏÏÏ A1 A A
The parent company's routine funding requirements per quarter to $.1875 per quarter. Excluding merger and
consist primarily of operating expenses, dividends to restructuring-related charges, the dividend payout ratio for
shareholders, debt service and funds used for acquisitions. 2001 increased to 57.0 percent compared with payout ratios
The parent company obtains funding to meet its obligations of 40.1 percent in 2000 and 31.7 percent in 1999.
from dividends collected from its subsidiaries and the Management has established Ñnancial objectives which
issuance of debt securities. Subsidiary management fees provide a framework to monitor future capital needs. The
fund operating expenses, while shareholder dividends and Company's dividend policy is inÖuenced by the belief that
debt service are satisÑed primarily through dividends from most shareholders are interested in long-term performance
its subsidiaries. as well as current dividend yields. The current dividend
At December 31, 2001, parent company long-term debt payout level is considered reasonable given the Company's
outstanding was $6.1 billion, compared with $6.6 billion at present cash Öow position, level of earnings and the
December 31, 2000. In 2001, the parent company issued strength of its subsidiary banks' capital ratios. Future
$1.1 billion of senior contingent convertible debt, oÅset by dividends will be determined based on results of operations,
$1.6 billion of maturities and other repayments of long- growth expectations, Ñnancial condition, regulatory
term debt. Total parent company debt maturing in 2002 is constraints and other factors deemed relevant by the Board
$1.5 billion. These debt obligations are expected to be met of Directors.
through medium-term note issuances and dividends from On July 17, 2001, the Company's Board of Directors
subsidiaries, as well as from the approximately $3.2 billion authorized the repurchase of up to 56.4 million shares of
of parent company cash and cash equivalents at the Company's common stock in connection with the
December 31, 2001. Federal banking laws regulate the July 24, 2001, acquisition of NOVA. During 2001, the
amount of dividends that may be paid by banking Company repurchased 19.7 million shares of common stock
subsidiaries without prior approval. The amount of in both public and private transactions in connection with
dividends available to the parent company from its banking this authorization. The Company had forward contracts to
subsidiaries was $1.2 billion at December 31, 2001. For purchase 26.7 million shares within this authorization.
further information, see Note 23 of the Notes to These contracts were settled in January 2002. On
Consolidated Financial Statements. December 18, 2001, the Board of Directors approved an
authorization to repurchase an additional 100 million sharesCAPITAL MANAGEMENT
of common stock through 2003.
On February 16, 2000, the Board of Directors ofThe Company is committed to managing capital for
USBM authorized the repurchase of up to $2.5 billion of itsmaximum shareholder beneÑt and maintaining strong
common stock over a two year period ending March 31,protection for depositors and creditors. Total shareholders'
2002. On April 11, 2000, Firstar's Board of Directorsequity was $16.5 billion at December 31, 2001, compared
approved a common stock repurchase program ofwith $15.2 billion at December 31, 2000. The increase was
100 million shares. The stock repurchase programs of bothprimarily the result of corporate earnings and the issuance
Firstar and USBM were rescinded on October 4, 2000, andof stock in connection with the NOVA acquisition, oÅset
January 17, 2001, respectively, in connection with theby dividend payments, merger and restructuring-related
planned merger of the formerly separate companies. For aitems and share repurchases.
complete analysis of activities impacting shareholders' equityOn February 27, 2001, the Company increased its
dividend rate per common share 15.4 percent from $.1625
U.S. Bancorp
Table 18
40

Regulatory Capital Ratios
At December 31 (Dollars in Millions) 2001 2000
U.S. Bancorp
Tangible common equity ÏÏÏÏÏÏÏÏÏÏÏÏÏÏÏÏÏÏÏÏÏÏÏÏÏÏÏÏÏÏÏÏÏÏÏÏÏÏÏÏÏÏÏÏÏÏÏÏÏÏÏÏÏÏÏÏÏÏÏÏÏÏÏÏÏÏÏÏÏÏÏÏÏÏÏÏÏÏÏÏÏ $ 9,374 $10,045
As a percent of tangible assets ÏÏÏÏÏÏÏÏÏÏÏÏÏÏÏÏÏÏÏÏÏÏÏÏÏÏÏÏÏÏÏÏÏÏÏÏÏÏÏÏÏÏÏÏÏÏÏÏÏÏÏÏÏÏÏÏÏÏÏÏÏÏÏÏÏÏÏÏÏÏÏÏ 5.7% 6.3%
Tier 1 capital ÏÏÏÏÏÏÏÏÏÏÏÏÏÏÏÏÏÏÏÏÏÏÏÏÏÏÏÏÏÏÏÏÏÏÏÏÏÏÏÏÏÏÏÏÏÏÏÏÏÏÏÏÏÏÏÏÏÏÏÏÏÏÏÏÏÏÏÏÏÏÏÏÏÏÏÏÏÏÏÏÏÏÏÏÏÏÏÏÏÏÏÏ $12,488 $11,602
As a percent of risk-weighted assetsÏÏÏÏÏÏÏÏÏÏÏÏÏÏÏÏÏÏÏÏÏÏÏÏÏÏÏÏÏÏÏÏÏÏÏÏÏÏÏÏÏÏÏÏÏÏÏÏÏÏÏÏÏÏÏÏÏÏÏÏÏÏÏÏÏÏÏ 7.7% 7.2%
As a percent of adjusted quarterly average assets (leverage ratio)ÏÏÏÏÏÏÏÏÏÏÏÏÏÏÏÏÏÏÏÏÏÏÏÏÏÏÏÏÏÏÏÏÏÏÏÏÏÏÏ 7.7% 7.4%
Total risk-based capital ÏÏÏÏÏÏÏÏÏÏÏÏÏÏÏÏÏÏÏÏÏÏÏÏÏÏÏÏÏÏÏÏÏÏÏÏÏÏÏÏÏÏÏÏÏÏÏÏÏÏÏÏÏÏÏÏÏÏÏÏÏÏÏÏÏÏÏÏÏÏÏÏÏÏÏÏÏÏÏÏÏÏ $19,148 $17,038
As a percent of risk-weighted assetsÏÏÏÏÏÏÏÏÏÏÏÏÏÏÏÏÏÏÏÏÏÏÏÏÏÏÏÏÏÏÏÏÏÏÏÏÏÏÏÏÏÏÏÏÏÏÏÏÏÏÏÏÏÏÏÏÏÏÏÏÏÏÏÏÏÏÏ 11.7% 10.6%
Bank Subsidiaries(a)
U.S. Bank National Association
Tier 1 capitalÏÏÏÏÏÏÏÏÏÏÏÏÏÏÏÏÏÏÏÏÏÏÏÏÏÏÏÏÏÏÏÏÏÏÏÏÏÏÏÏÏÏÏÏÏÏÏÏÏÏÏÏÏÏÏÏÏÏÏÏÏÏÏÏÏÏÏÏÏÏÏÏÏÏÏÏÏÏÏÏÏÏÏÏÏÏ 7.5% 7.3%
Total risk-based capital ÏÏÏÏÏÏÏÏÏÏÏÏÏÏÏÏÏÏÏÏÏÏÏÏÏÏÏÏÏÏÏÏÏÏÏÏÏÏÏÏÏÏÏÏÏÏÏÏÏÏÏÏÏÏÏÏÏÏÏÏÏÏÏÏÏÏÏÏÏÏÏÏÏÏÏÏ 11.8 11.2
Leverage ÏÏÏÏÏÏÏÏÏÏÏÏÏÏÏÏÏÏÏÏÏÏÏÏÏÏÏÏÏÏÏÏÏÏÏÏÏÏÏÏÏÏÏÏÏÏÏÏÏÏÏÏÏÏÏÏÏÏÏÏÏÏÏÏÏÏÏÏÏÏÏÏÏÏÏÏÏÏÏÏÏÏÏÏÏÏÏÏÏ 7.7 7.9
U.S. Bank National Association ND
Tier 1 capitalÏÏÏÏÏÏÏÏÏÏÏÏÏÏÏÏÏÏÏÏÏÏÏÏÏÏÏÏÏÏÏÏÏÏÏÏÏÏÏÏÏÏÏÏÏÏÏÏÏÏÏÏÏÏÏÏÏÏÏÏÏÏÏÏÏÏÏÏÏÏÏÏÏÏÏÏÏÏÏÏÏÏÏÏÏÏ 18.1% 10.3%
Total risk-based capital ÏÏÏÏÏÏÏÏÏÏÏÏÏÏÏÏÏÏÏÏÏÏÏÏÏÏÏÏÏÏÏÏÏÏÏÏÏÏÏÏÏÏÏÏÏÏÏÏÏÏÏÏÏÏÏÏÏÏÏÏÏÏÏÏÏÏÏÏÏÏÏÏÏÏÏÏ 23.1 15.6
Leverage ÏÏÏÏÏÏÏÏÏÏÏÏÏÏÏÏÏÏÏÏÏÏÏÏÏÏÏÏÏÏÏÏÏÏÏÏÏÏÏÏÏÏÏÏÏÏÏÏÏÏÏÏÏÏÏÏÏÏÏÏÏÏÏÏÏÏÏÏÏÏÏÏÏÏÏÏÏÏÏÏÏÏÏÏÏÏÏÏÏ 17.9 10.2
U.S. Bank National Association MT
Tier 1 capitalÏÏÏÏÏÏÏÏÏÏÏÏÏÏÏÏÏÏÏÏÏÏÏÏÏÏÏÏÏÏÏÏÏÏÏÏÏÏÏÏÏÏÏÏÏÏÏÏÏÏÏÏÏÏÏÏÏÏÏÏÏÏÏÏÏÏÏÏÏÏÏÏÏÏÏÏÏÏÏÏÏÏÏÏÏÏ 19.4% 14.9%
Total risk-based capital ÏÏÏÏÏÏÏÏÏÏÏÏÏÏÏÏÏÏÏÏÏÏÏÏÏÏÏÏÏÏÏÏÏÏÏÏÏÏÏÏÏÏÏÏÏÏÏÏÏÏÏÏÏÏÏÏÏÏÏÏÏÏÏÏÏÏÏÏÏÏÏÏÏÏÏÏ 20.5 17.6
Leverage ÏÏÏÏÏÏÏÏÏÏÏÏÏÏÏÏÏÏÏÏÏÏÏÏÏÏÏÏÏÏÏÏÏÏÏÏÏÏÏÏÏÏÏÏÏÏÏÏÏÏÏÏÏÏÏÏÏÏÏÏÏÏÏÏÏÏÏÏÏÏÏÏÏÏÏÏÏÏÏÏÏÏÏÏÏÏÏÏÏ 14.0 12.0
Well-Bank Regulatory Capital Requirements Minimum Capitalized
Tier 1 capital ÏÏÏÏÏÏÏÏÏÏÏÏÏÏÏÏÏÏÏÏÏÏÏÏÏÏÏÏÏÏÏÏÏÏÏÏÏÏÏÏÏÏÏÏÏÏÏÏÏÏÏÏÏÏÏÏÏÏÏÏÏÏÏÏÏÏÏÏÏÏÏÏÏÏÏÏÏÏÏÏÏÏÏÏÏÏÏÏÏ 4.0% 6.0%
Total risk-based capital ÏÏÏÏÏÏÏÏÏÏÏÏÏÏÏÏÏÏÏÏÏÏÏÏÏÏÏÏÏÏÏÏÏÏÏÏÏÏÏÏÏÏÏÏÏÏÏÏÏÏÏÏÏÏÏÏÏÏÏÏÏÏÏÏÏÏÏÏÏÏÏÏÏÏÏÏÏÏÏ 8.0 10.0
Leverage ÏÏÏÏÏÏÏÏÏÏÏÏÏÏÏÏÏÏÏÏÏÏÏÏÏÏÏÏÏÏÏÏÏÏÏÏÏÏÏÏÏÏÏÏÏÏÏÏÏÏÏÏÏÏÏÏÏÏÏÏÏÏÏÏÏÏÏÏÏÏÏÏÏÏÏÏÏÏÏÏÏÏÏÏÏÏÏÏÏÏÏÏ 4.0 5.0
(a) These balances and ratios were prepared in accordance with regulatory accounting principles as disclosed in the subsidiaries' regulatory reports.
and capital management programs, refer to Note 15 of the 7.7 percent compared with 7.4 percent in the fourth quarter
Notes to Consolidated Financial Statements. of a year ago.
Banking regulators deÑne minimum capital With respect to each of its banking subsidiaries, the
requirements for banks and Ñnancial services holding Company intends to maintain suÇcient capital to be ""well
companies. Additionally, credit rating agencies evaluate capitalized'' as deÑned by the regulatory agencies. The ""well
capital adequacy including tangible common equity as a capitalized'' category requires tier 1 and total risk-based
percentage of tangible assets. The Company manages capital ratios of at least 6.0 percent and 10.0 percent,
various capital ratios to maintain appropriate capital levels respectively, and a minimum leverage ratio of 5.0 percent.
in accordance with Board-approved capital guidelines. At All banking subsidiaries are considered ""well capitalized'' at
December 31, 2001, tangible common equity was December 31, 2001.
$9.4 billion (5.7 percent of tangible assets), compared with Table 19 provides a summary of tier 1 and total risk-
6.3 percent at year-end 2000. The decline in the tangible based capital ratios as of December 31, 2001 and 2000, as
common equity ratio was primarily due to the acquisition deÑned by the regulatory agencies.
of NOVA during the third quarter of 2001. As ofFOURTH QUARTER SUMMARYDecember 31, 2001, tier 1 and total risk-based capital ratios
were 7.7 percent and 11.7 percent, respectively, well above In the fourth quarter of 2001, the Company had net incomethe minimum regulatory requirements of 4.0 percent for of $695.4 million ($.36 per diluted share), compared withtier 1 and 8.0 percent for total risk-based capital. This $768.7 million ($.40 per diluted share) in the fourthcompared to tier 1 and total risk-based capital ratios of quarter of 2000. The Company reported operating earnings7.2 percent and 10.6 percent at December 31, 2000. The (net income excluding merger and restructuring-relatedimprovement in the total risk-based capital ratio during items) of $785.2 million ($.40 per diluted share) in the2001 primarily reÖected changes in the mix of investment fourth quarter of 2001, compared with operating earningssecurities in addition to the issuance of Trust Preferred of $824.2 million ($.43 per diluted share) in the fourthSecurities. Regulatory authorities have also established a quarter of 2000. Fourth quarter net interest income on aminimum ""leverage'' ratio of 4.0 percent, which is deÑned taxable-equivalent basis increased $122.6 million toas tier 1 equity to average quarterly assets. For the fourth $1,684.8 million, compared with the fourth quarter ofquarter of 2001, the Company's leverage ratio improved to
U.S. Bancorp
Table 19
41

2000, primarily reÖecting increased earning assets driven by The provision for credit losses increased to
increases in the investment portfolio, core retail loan $265.8 million in the fourth quarter of 2001, compared
growth and acquisitions, partially oÅset by a $4.3 billion with $229.5 million in the fourth quarter of 2000. The
reduction in loans related to transfers of short-term, high increase was the result of higher charge-oÅs from a year ago
credit quality, low margin commercial loans to the loan due to deterioration in economic conditions and credit
conduit, a $2.8 billion decline in residential mortgage loans, quality in the loan portfolio.
and the sale of indirect automobile and high LTV home Noninterest income increased $58.7 million from the
equity loans in the Ñrst quarter of 2001. The net interest same quarter a year ago, to $1,323.6 million. Credit card
margin on a taxable-equivalent basis increased in the fourth fee revenue declined quarter over quarter by $18.6 million
quarter of 2001 to 4.60 percent, compared with (8.8 percent) reÖecting lower corporate card transaction
4.33 percent in the fourth quarter of 2000, reÖecting volumes. Merchant and ATM processing revenue increased
funding beneÑts during the declining rate environment, a $116.0 million principally due to the acquisition of NOVA.
more favorable funding mix and improving loan spreads, Deposit service charges, cash management fees, commercial
partially oÅset by lower yields on the investment portfolio. product revenue and mortgage banking revenue improved in
the fourth quarter of 2001 from a year ago. The
Fourth Quarter Summary
Three Months EndedDecember 31,
(Dollars in Millions, Except Per Share Data) 2001 2000
Condensed Income Statement
Interest income (taxable-equivalent basis) ÏÏÏÏÏÏÏÏÏÏÏÏÏÏÏÏÏÏÏÏÏÏÏÏÏÏÏÏÏÏÏÏÏÏÏÏÏÏÏÏÏÏÏÏÏÏÏÏÏÏÏÏÏÏÏÏÏÏÏÏÏÏÏÏ $2,529.3 $3,179.7
Interest expense ÏÏÏÏÏÏÏÏÏÏÏÏÏÏÏÏÏÏÏÏÏÏÏÏÏÏÏÏÏÏÏÏÏÏÏÏÏÏÏÏÏÏÏÏÏÏÏÏÏÏÏÏÏÏÏÏÏÏÏÏÏÏÏÏÏÏÏÏÏÏÏÏÏÏÏÏÏÏÏÏÏÏÏÏÏÏÏÏ 844.5 1,617.5
Net interest income ÏÏÏÏÏÏÏÏÏÏÏÏÏÏÏÏÏÏÏÏÏÏÏÏÏÏÏÏÏÏÏÏÏÏÏÏÏÏÏÏÏÏÏÏÏÏÏÏÏÏÏÏÏÏÏÏÏÏÏÏÏÏÏÏÏÏÏÏÏÏÏÏÏÏÏÏÏÏÏÏÏÏ 1,684.8 1,562.2
Securities gains, net ÏÏÏÏÏÏÏÏÏÏÏÏÏÏÏÏÏÏÏÏÏÏÏÏÏÏÏÏÏÏÏÏÏÏÏÏÏÏÏÏÏÏÏÏÏÏÏÏÏÏÏÏÏÏÏÏÏÏÏÏÏÏÏÏÏÏÏÏÏÏÏÏÏÏÏÏÏÏÏÏÏÏÏÏÏ 22.0 7.0
Noninterest incomeÏÏÏÏÏÏÏÏÏÏÏÏÏÏÏÏÏÏÏÏÏÏÏÏÏÏÏÏÏÏÏÏÏÏÏÏÏÏÏÏÏÏÏÏÏÏÏÏÏÏÏÏÏÏÏÏÏÏÏÏÏÏÏÏÏÏÏÏÏÏÏÏÏÏÏÏÏÏÏÏÏÏÏÏÏÏ 1,301.6 1,257.9
Total net revenue ÏÏÏÏÏÏÏÏÏÏÏÏÏÏÏÏÏÏÏÏÏÏÏÏÏÏÏÏÏÏÏÏÏÏÏÏÏÏÏÏÏÏÏÏÏÏÏÏÏÏÏÏÏÏÏÏÏÏÏÏÏÏÏÏÏÏÏÏÏÏÏÏÏÏÏÏÏÏÏÏÏÏÏÏ 3,008.4 2,827.1
Noninterest expense(a) ÏÏÏÏÏÏÏÏÏÏÏÏÏÏÏÏÏÏÏÏÏÏÏÏÏÏÏÏÏÏÏÏÏÏÏÏÏÏÏÏÏÏÏÏÏÏÏÏÏÏÏÏÏÏÏÏÏÏÏÏÏÏÏÏÏÏÏÏÏÏÏÏÏÏÏÏÏÏÏÏÏ 1,503.9 1,347.8
Provision for credit losses ÏÏÏÏÏÏÏÏÏÏÏÏÏÏÏÏÏÏÏÏÏÏÏÏÏÏÏÏÏÏÏÏÏÏÏÏÏÏÏÏÏÏÏÏÏÏÏÏÏÏÏÏÏÏÏÏÏÏÏÏÏÏÏÏÏÏÏÏÏÏÏÏÏÏÏÏÏÏÏ 265.8 229.5
Income before taxes and merger and restructuring-related itemsÏÏÏÏÏÏÏÏÏÏÏÏÏÏÏÏÏÏÏÏÏÏÏÏÏÏÏÏÏÏÏÏÏÏÏÏÏÏÏÏÏ 1,238.7 1,249.8
Taxable-equivalent adjustment ÏÏÏÏÏÏÏÏÏÏÏÏÏÏÏÏÏÏÏÏÏÏÏÏÏÏÏÏÏÏÏÏÏÏÏÏÏÏÏÏÏÏÏÏÏÏÏÏÏÏÏÏÏÏÏÏÏÏÏÏÏÏÏÏÏÏÏÏÏÏÏÏÏÏÏ 9.9 20.7
Income taxes ÏÏÏÏÏÏÏÏÏÏÏÏÏÏÏÏÏÏÏÏÏÏÏÏÏÏÏÏÏÏÏÏÏÏÏÏÏÏÏÏÏÏÏÏÏÏÏÏÏÏÏÏÏÏÏÏÏÏÏÏÏÏÏÏÏÏÏÏÏÏÏÏÏÏÏÏÏÏÏÏÏÏÏÏÏÏÏÏÏÏÏ 443.6 404.9
Operating earnings(a)ÏÏÏÏÏÏÏÏÏÏÏÏÏÏÏÏÏÏÏÏÏÏÏÏÏÏÏÏÏÏÏÏÏÏÏÏÏÏÏÏÏÏÏÏÏÏÏÏÏÏÏÏÏÏÏÏÏÏÏÏÏÏÏÏÏÏÏÏÏÏÏÏÏÏÏÏÏÏÏÏÏÏÏ 785.2 824.2
Merger and restructuring-related items (after-tax) ÏÏÏÏÏÏÏÏÏÏÏÏÏÏÏÏÏÏÏÏÏÏÏÏÏÏÏÏÏÏÏÏÏÏÏÏÏÏÏÏÏÏÏÏÏÏÏÏÏÏÏÏÏÏÏÏÏ (89.8) (55.5)
Net income in accordance with GAAPÏÏÏÏÏÏÏÏÏÏÏÏÏÏÏÏÏÏÏÏÏÏÏÏÏÏÏÏÏÏÏÏÏÏÏÏÏÏÏÏÏÏÏÏÏÏÏÏÏÏÏÏÏÏÏÏÏÏÏÏÏÏÏÏÏÏ $ 695.4 $ 768.7
Per Common Share
Earnings per share ÏÏÏÏÏÏÏÏÏÏÏÏÏÏÏÏÏÏÏÏÏÏÏÏÏÏÏÏÏÏÏÏÏÏÏÏÏÏÏÏÏÏÏÏÏÏÏÏÏÏÏÏÏÏÏÏÏÏÏÏÏÏÏÏÏÏÏÏÏÏÏÏÏÏÏÏÏÏÏÏÏÏÏÏÏÏ $ .36 $ .41
Diluted earnings per share ÏÏÏÏÏÏÏÏÏÏÏÏÏÏÏÏÏÏÏÏÏÏÏÏÏÏÏÏÏÏÏÏÏÏÏÏÏÏÏÏÏÏÏÏÏÏÏÏÏÏÏÏÏÏÏÏÏÏÏÏÏÏÏÏÏÏÏÏÏÏÏÏÏÏÏÏÏÏÏ .36 .40
Dividends declared per share(b) ÏÏÏÏÏÏÏÏÏÏÏÏÏÏÏÏÏÏÏÏÏÏÏÏÏÏÏÏÏÏÏÏÏÏÏÏÏÏÏÏÏÏÏÏÏÏÏÏÏÏÏÏÏÏÏÏÏÏÏÏÏÏÏÏÏÏÏÏÏÏÏÏÏ .1875 .1625
Financial Ratios
Return on average assetsÏÏÏÏÏÏÏÏÏÏÏÏÏÏÏÏÏÏÏÏÏÏÏÏÏÏÏÏÏÏÏÏÏÏÏÏÏÏÏÏÏÏÏÏÏÏÏÏÏÏÏÏÏÏÏÏÏÏÏÏÏÏÏÏÏÏÏÏÏÏÏÏÏÏÏÏÏÏÏÏ 1.64% 1.89%
Return on average equity ÏÏÏÏÏÏÏÏÏÏÏÏÏÏÏÏÏÏÏÏÏÏÏÏÏÏÏÏÏÏÏÏÏÏÏÏÏÏÏÏÏÏÏÏÏÏÏÏÏÏÏÏÏÏÏÏÏÏÏÏÏÏÏÏÏÏÏÏÏÏÏÏÏÏÏÏÏÏÏÏ 16.5 20.7
Net interest margin (taxable-equivalent basis)ÏÏÏÏÏÏÏÏÏÏÏÏÏÏÏÏÏÏÏÏÏÏÏÏÏÏÏÏÏÏÏÏÏÏÏÏÏÏÏÏÏÏÏÏÏÏÏÏÏÏÏÏÏÏÏÏÏÏÏÏÏ 4.60 4.33
EÇciency ratio ÏÏÏÏÏÏÏÏÏÏÏÏÏÏÏÏÏÏÏÏÏÏÏÏÏÏÏÏÏÏÏÏÏÏÏÏÏÏÏÏÏÏÏÏÏÏÏÏÏÏÏÏÏÏÏÏÏÏÏÏÏÏÏÏÏÏÏÏÏÏÏÏÏÏÏÏÏÏÏÏÏÏÏÏÏÏÏÏÏÏ 55.1 50.8
Financial Ratios Excluding Merger and Restructuring-Related Items(a)
Return on average assetsÏÏÏÏÏÏÏÏÏÏÏÏÏÏÏÏÏÏÏÏÏÏÏÏÏÏÏÏÏÏÏÏÏÏÏÏÏÏÏÏÏÏÏÏÏÏÏÏÏÏÏÏÏÏÏÏÏÏÏÏÏÏÏÏÏÏÏÏÏÏÏÏÏÏÏÏÏÏÏÏ 1.85% 2.02%
Return on average equity ÏÏÏÏÏÏÏÏÏÏÏÏÏÏÏÏÏÏÏÏÏÏÏÏÏÏÏÏÏÏÏÏÏÏÏÏÏÏÏÏÏÏÏÏÏÏÏÏÏÏÏÏÏÏÏÏÏÏÏÏÏÏÏÏÏÏÏÏÏÏÏÏÏÏÏÏÏÏÏÏ 18.6 22.2
EÇciency ratio ÏÏÏÏÏÏÏÏÏÏÏÏÏÏÏÏÏÏÏÏÏÏÏÏÏÏÏÏÏÏÏÏÏÏÏÏÏÏÏÏÏÏÏÏÏÏÏÏÏÏÏÏÏÏÏÏÏÏÏÏÏÏÏÏÏÏÏÏÏÏÏÏÏÏÏÏÏÏÏÏÏÏÏÏÏÏÏÏÏÏ 50.4 47.8
Banking eÇciency ratio(c)ÏÏÏÏÏÏÏÏÏÏÏÏÏÏÏÏÏÏÏÏÏÏÏÏÏÏÏÏÏÏÏÏÏÏÏÏÏÏÏÏÏÏÏÏÏÏÏÏÏÏÏÏÏÏÏÏÏÏÏÏÏÏÏÏÏÏÏÏÏÏÏÏÏÏÏÏÏÏÏ 46.6 41.9
(a) The Company analyzes its performance on a net income basis in accordance with accounting principles generally accepted in the United States, as well as on an operating basis
before merger and restructuring-related items referred to as ""operating earnings.'' Operating earnings are presented as supplemental information to enhance the readers'
understanding of, and highlight trends in, the Company's Ñnancial results excluding the impact of merger and restructuring-related items of speciÑc business acquisitions and
restructuring activities. Operating earnings should not be viewed as a substitute for net income and earnings per share as determined in accordance with accounting principles
generally accepted in the United States. Merger and restructuring-related items excluded from net income to derive operating earnings may be signiÑcant and may not be
comparable to other companies.
(b) Dividends per share have not been restated for the 2001 merger of Firstar and USBM.
(c) Without investment banking and brokerage activity.
U.S. Bancorp
Table 20
42

improvements reÖected core business growth, product tax-exempt products. The provision for credit losses
enhancements, loan conduit activities and strong mortgage recorded by each operating segment was primarily based on
originations. Capital markets-related revenue declined the net charge-oÅs of each line of business. The diÅerence
$31.6 million (12.0 percent) reÖecting softness in equity between the provision for credit losses determined in
capital markets since late 2000. Other income declined accordance with accounting principles generally accepted in
$99.6 million from the same quarter a year ago primarily the United States recognized by the Company on a
due to a $10.0 million retail lease residual impairment consolidated basis and the provision recorded by the
recognized in the fourth quarter of 2001 and a decline in business lines is recorded in Treasury and Corporate
the level of equity investment earnings. Support. Noninterest income and expenses directly managed
Fourth quarter noninterest expense totaled by each business line, including fees, service charges, salaries
$1,644.5 million in the fourth quarter of 2001 compared and beneÑts, and other direct expenses are accounted for
with $1,431.9 million in the fourth quarter of 2000. within each segment's Ñnancial results in a manner similar
Excluding merger-related charges, noninterest expense to the consolidated Ñnancial statements. Noninterest
totaled $1,503.9 million, an increase of $156.1 million expenses incurred by centrally managed operations or a
(11.6 percent) from the fourth quarter of 2000. business line that directly supports another business line's
Approximately $100 million of the increase was the result operations are not charged to the applicable business line.
of acquisitions. In addition to the impact of acquisitions, Income taxes are assessed to each line of business at a
noninterest expenses were higher due to recognizing a standard tax rate with the residual tax expense or beneÑt to
$27.3 million MSR impairment in the fourth quarter of arrive at the consolidated eÅective tax rate included in
2001 and increases due to core business growth, oÅset Treasury and Corporate Support. Merger and restructuring-
somewhat by a reduction in expenses related to capital related items are not identiÑed by or allocated to lines of
markets activities. business. Because capital levels are evaluated and managed
centrally, capital is not allocated to the business units.LINE OF BUSINESS FINANCIAL REVIEW
Designations, assignments and allocations may change from
time to time as management accounting systems areOperating segments are components of the Company about
enhanced or product lines change. During 2001, certainwhich Ñnancial information is available and is evaluated
organization and methodology changes were made to reÖectregularly in deciding how to allocate resources and assess
the merger. All results for 2001 and 2000 have beenperformance. Prior to the merger of Firstar and USBM, the
restated to present consistent methodologies for all businessCompany operated its business units separately in 2000 and
lines.1999 and the basis of Ñnancial presentation diÅered
signiÑcantly. Accordingly, the presentation of comparativeWholesale Banking oÅers lending, depository, treasury
business line results for 1999 is not practicable at this time.management and other Ñnancial services to middle market,
At the date of the merger of Firstar and USBM, thelarge corporate and public sector clients. Wholesale
Company reorganized into the following operatingBanking contributed $1,364.4 million of the Company's
segments: Wholesale Banking, Consumer Banking, Privatepre-tax income in 2001, compared with $1,667.3 million in
Client, Trust and Asset Management, Payment Services,2000, a decrease of $302.9 million (18.2 percent). The
Capital Markets, and Treasury and Corporate Support.decline was primarily driven by an increase in the provision
Units providing central support and other corporatefor credit losses and certain asset write-downs taken by the
activities are reported as part of Treasury and Corporatebusiness line. The line of business generated operating
Support and allocated as appropriate. For detailedincome of $1,956.8 million in 2001 and $1,827.8 million in
descriptions of these operating segments see ""BUSINESS2000, a 7.1 percent increase. Total net revenue grew by
SEGMENTS'' in Note 1 of the Notes to Consolidated$175.9 million (8.0 percent) in 2001. Net interest income
Financial Statements.on a taxable-equivalent basis increased 4.7 percent for the
year primarily due to core deposit growth, as well as theBasis of Financial Presentation Business line results are
impact of banking and equipment Ñnance leasingderived from the Company's business unit proÑtability
acquisitions. The increase is oÅset somewhat by the transferreporting system by speciÑcally attributing managed balance
of short-term, high credit quality, low margin commercialsheet assets, deposits and other liabilities and their related
loans to the loan conduit and the impact of declining ratesinterest income or expense. Funds transfer pricing
on the funding beneÑt of deposits. Noninterest incomemethodologies are utilized to allocate a cost for funds used
increased 19.4 percent in 2001 reÖecting revenue related toor credit for funds provided to all business line assets and
the leasing acquisitions, core growth in syndication and cashliabilities using a matched funding concept. Also, the
management-related fees and growth in securitization feebusiness unit is allocated the taxable-equivalent beneÑt of
U.S. Bancorp 43
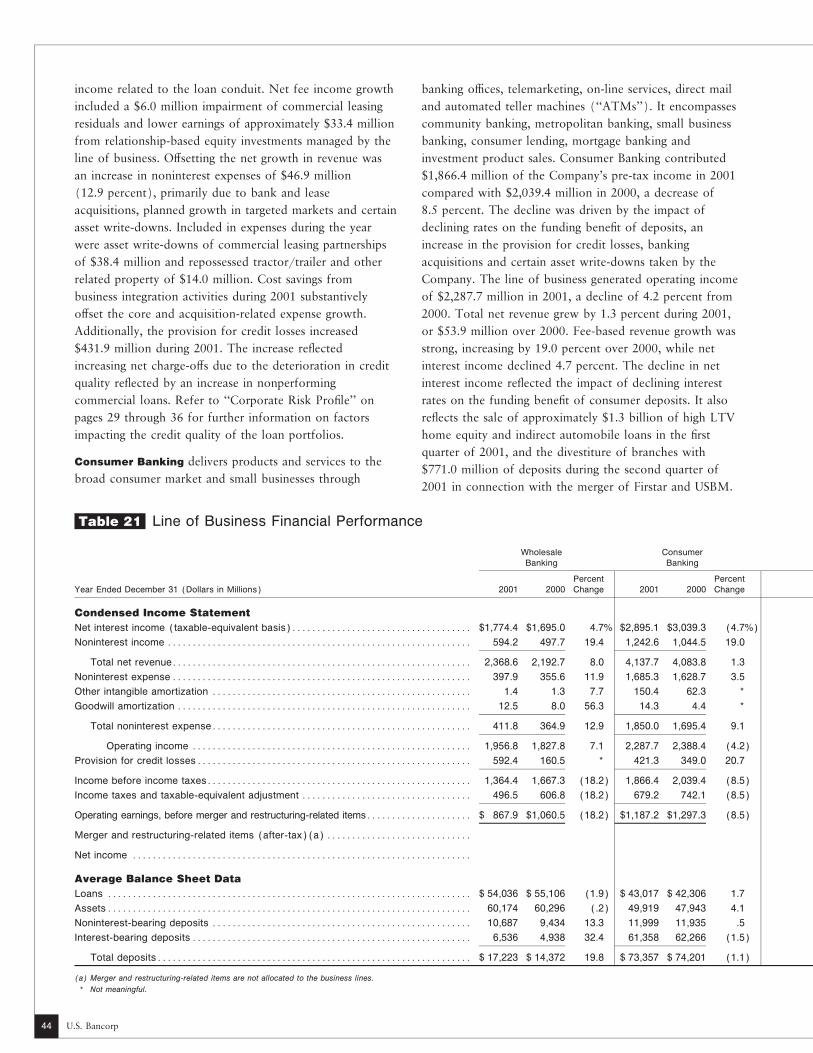
income related to the loan conduit. Net fee income growth banking oÇces, telemarketing, on-line services, direct mail
included a $6.0 million impairment of commercial leasing and automated teller machines (""ATMs''). It encompasses
residuals and lower earnings of approximately $33.4 million community banking, metropolitan banking, small business
from relationship-based equity investments managed by the banking, consumer lending, mortgage banking and
line of business. OÅsetting the net growth in revenue was investment product sales. Consumer Banking contributed
an increase in noninterest expenses of $46.9 million $1,866.4 million of the Company's pre-tax income in 2001
(12.9 percent), primarily due to bank and lease compared with $2,039.4 million in 2000, a decrease of
acquisitions, planned growth in targeted markets and certain 8.5 percent. The decline was driven by the impact of
asset write-downs. Included in expenses during the year declining rates on the funding beneÑt of deposits, an
were asset write-downs of commercial leasing partnerships increase in the provision for credit losses, banking
of $38.4 million and repossessed tractor/trailer and other acquisitions and certain asset write-downs taken by the
related property of $14.0 million. Cost savings from Company. The line of business generated operating income
business integration activities during 2001 substantively of $2,287.7 million in 2001, a decline of 4.2 percent from
oÅset the core and acquisition-related expense growth. 2000. Total net revenue grew by 1.3 percent during 2001,
Additionally, the provision for credit losses increased or $53.9 million over 2000. Fee-based revenue growth was
$431.9 million during 2001. The increase reÖected strong, increasing by 19.0 percent over 2000, while net
increasing net charge-oÅs due to the deterioration in credit interest income declined 4.7 percent. The decline in net
quality reÖected by an increase in nonperforming interest income reÖected the impact of declining interest
commercial loans. Refer to ""Corporate Risk ProÑle'' on rates on the funding beneÑt of consumer deposits. It also
pages 29 through 36 for further information on factors reÖects the sale of approximately $1.3 billion of high LTV
impacting the credit quality of the loan portfolios. home equity and indirect automobile loans in the Ñrst
quarter of 2001, and the divestiture of branches withConsumer Banking delivers products and services to the
$771.0 million of deposits during the second quarter ofbroad consumer market and small businesses through
2001 in connection with the merger of Firstar and USBM.
Line of Business Financial Performance
Wholesale ConsumerBanking Banking
Percent PercentYear Ended December 31 (Dollars in Millions) 2001 2000 Change 2001 2000 Change
Condensed Income Statement
Net interest income (taxable-equivalent basis)ÏÏÏÏÏÏÏÏÏÏÏÏÏÏÏÏÏÏÏÏÏÏÏÏÏÏÏÏÏÏÏÏÏÏÏÏ $1,774.4 $1,695.0 4.7% $2,895.1 $3,039.3 (4.7%)
Noninterest income ÏÏÏÏÏÏÏÏÏÏÏÏÏÏÏÏÏÏÏÏÏÏÏÏÏÏÏÏÏÏÏÏÏÏÏÏÏÏÏÏÏÏÏÏÏÏÏÏÏÏÏÏÏÏÏÏÏÏÏÏÏ 594.2 497.7 19.4 1,242.6 1,044.5 19.0
Total net revenueÏÏÏÏÏÏÏÏÏÏÏÏÏÏÏÏÏÏÏÏÏÏÏÏÏÏÏÏÏÏÏÏÏÏÏÏÏÏÏÏÏÏÏÏÏÏÏÏÏÏÏÏÏÏÏÏÏÏÏÏ 2,368.6 2,192.7 8.0 4,137.7 4,083.8 1.3
Noninterest expenseÏÏÏÏÏÏÏÏÏÏÏÏÏÏÏÏÏÏÏÏÏÏÏÏÏÏÏÏÏÏÏÏÏÏÏÏÏÏÏÏÏÏÏÏÏÏÏÏÏÏÏÏÏÏÏÏÏÏÏÏ 397.9 355.6 11.9 1,685.3 1,628.7 3.5
Other intangible amortization ÏÏÏÏÏÏÏÏÏÏÏÏÏÏÏÏÏÏÏÏÏÏÏÏÏÏÏÏÏÏÏÏÏÏÏÏÏÏÏÏÏÏÏÏÏÏÏÏÏÏÏÏ 1.4 1.3 7.7 150.4 62.3 *
Goodwill amortization ÏÏÏÏÏÏÏÏÏÏÏÏÏÏÏÏÏÏÏÏÏÏÏÏÏÏÏÏÏÏÏÏÏÏÏÏÏÏÏÏÏÏÏÏÏÏÏÏÏÏÏÏÏÏÏÏÏÏÏ 12.5 8.0 56.3 14.3 4.4 *
Total noninterest expenseÏÏÏÏÏÏÏÏÏÏÏÏÏÏÏÏÏÏÏÏÏÏÏÏÏÏÏÏÏÏÏÏÏÏÏÏÏÏÏÏÏÏÏÏÏÏÏÏÏÏÏÏ 411.8 364.9 12.9 1,850.0 1,695.4 9.1
Operating income ÏÏÏÏÏÏÏÏÏÏÏÏÏÏÏÏÏÏÏÏÏÏÏÏÏÏÏÏÏÏÏÏÏÏÏÏÏÏÏÏÏÏÏÏÏÏÏÏÏÏÏÏÏÏÏÏ 1,956.8 1,827.8 7.1 2,287.7 2,388.4 (4.2)
Provision for credit lossesÏÏÏÏÏÏÏÏÏÏÏÏÏÏÏÏÏÏÏÏÏÏÏÏÏÏÏÏÏÏÏÏÏÏÏÏÏÏÏÏÏÏÏÏÏÏÏÏÏÏÏÏÏÏÏ 592.4 160.5 * 421.3 349.0 20.7
Income before income taxesÏÏÏÏÏÏÏÏÏÏÏÏÏÏÏÏÏÏÏÏÏÏÏÏÏÏÏÏÏÏÏÏÏÏÏÏÏÏÏÏÏÏÏÏÏÏÏÏÏÏÏÏÏ 1,364.4 1,667.3 (18.2) 1,866.4 2,039.4 (8.5)
Income taxes and taxable-equivalent adjustment ÏÏÏÏÏÏÏÏÏÏÏÏÏÏÏÏÏÏÏÏÏÏÏÏÏÏÏÏÏÏÏÏÏÏ 496.5 606.8 (18.2) 679.2 742.1 (8.5)
Operating earnings, before merger and restructuring-related itemsÏÏÏÏÏÏÏÏÏÏÏÏÏÏÏÏÏÏÏÏÏ $ 867.9 $1,060.5 (18.2) $1,187.2 $1,297.3 (8.5)
Merger and restructuring-related items (after-tax)(a) ÏÏÏÏÏÏÏÏÏÏÏÏÏÏÏÏÏÏÏÏÏÏÏÏÏÏÏÏÏ
Net income ÏÏÏÏÏÏÏÏÏÏÏÏÏÏÏÏÏÏÏÏÏÏÏÏÏÏÏÏÏÏÏÏÏÏÏÏÏÏÏÏÏÏÏÏÏÏÏÏÏÏÏÏÏÏÏÏÏÏÏÏÏÏÏÏÏÏÏÏ
Average Balance Sheet Data
Loans ÏÏÏÏÏÏÏÏÏÏÏÏÏÏÏÏÏÏÏÏÏÏÏÏÏÏÏÏÏÏÏÏÏÏÏÏÏÏÏÏÏÏÏÏÏÏÏÏÏÏÏÏÏÏÏÏÏÏÏÏÏÏÏÏÏÏÏÏÏÏÏÏÏ $ 54,036 $ 55,106 (1.9) $ 43,017 $ 42,306 1.7
AssetsÏÏÏÏÏÏÏÏÏÏÏÏÏÏÏÏÏÏÏÏÏÏÏÏÏÏÏÏÏÏÏÏÏÏÏÏÏÏÏÏÏÏÏÏÏÏÏÏÏÏÏÏÏÏÏÏÏÏÏÏÏÏÏÏÏÏÏÏÏÏÏÏÏ 60,174 60,296 (.2) 49,919 47,943 4.1
Noninterest-bearing deposits ÏÏÏÏÏÏÏÏÏÏÏÏÏÏÏÏÏÏÏÏÏÏÏÏÏÏÏÏÏÏÏÏÏÏÏÏÏÏÏÏÏÏÏÏÏÏÏÏÏÏÏÏ 10,687 9,434 13.3 11,999 11,935 .5
Interest-bearing deposits ÏÏÏÏÏÏÏÏÏÏÏÏÏÏÏÏÏÏÏÏÏÏÏÏÏÏÏÏÏÏÏÏÏÏÏÏÏÏÏÏÏÏÏÏÏÏÏÏÏÏÏÏÏÏÏÏ 6,536 4,938 32.4 61,358 62,266 (1.5)
Total depositsÏÏÏÏÏÏÏÏÏÏÏÏÏÏÏÏÏÏÏÏÏÏÏÏÏÏÏÏÏÏÏÏÏÏÏÏÏÏÏÏÏÏÏÏÏÏÏÏÏÏÏÏÏÏÏÏÏÏÏÏÏÏÏ $ 17,223 $ 14,372 19.8 $ 73,357 $ 74,201 (1.1)
(a) Merger and restructuring-related items are not allocated to the business lines.
* Not meaningful.
U.S. Bancorp
Table 21
44
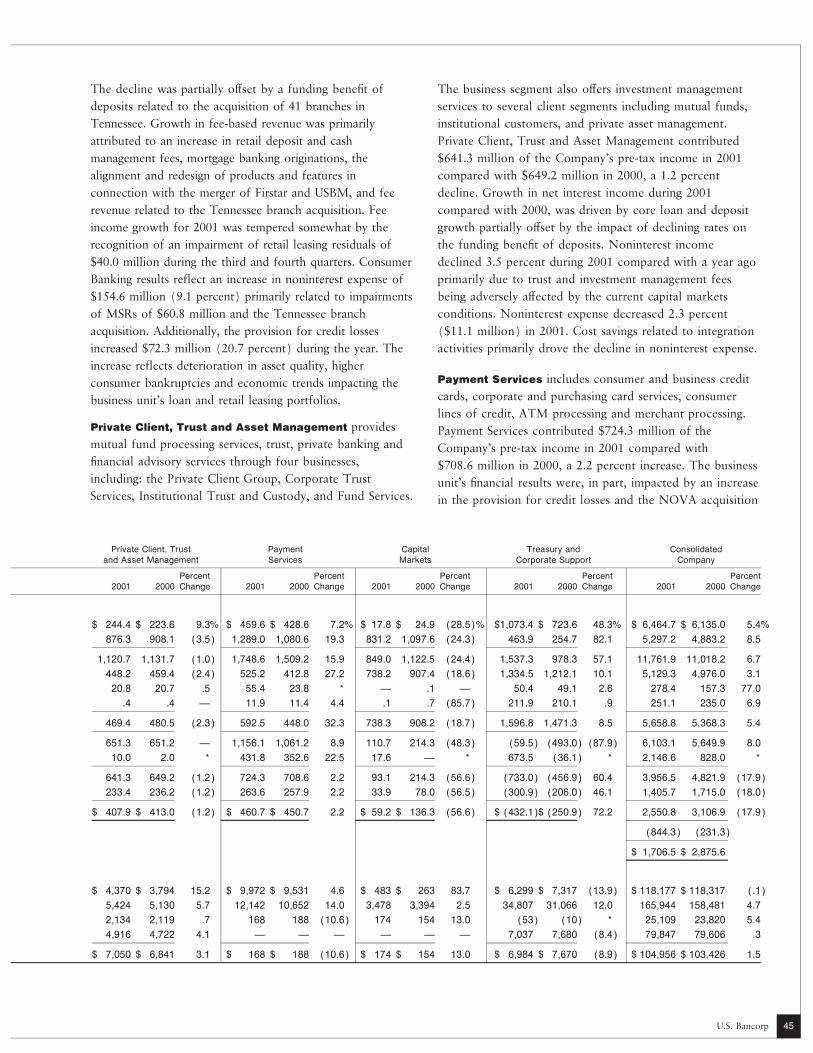
The decline was partially oÅset by a funding beneÑt of The business segment also oÅers investment management
deposits related to the acquisition of 41 branches in services to several client segments including mutual funds,
Tennessee. Growth in fee-based revenue was primarily institutional customers, and private asset management.
attributed to an increase in retail deposit and cash Private Client, Trust and Asset Management contributed
management fees, mortgage banking originations, the $641.3 million of the Company's pre-tax income in 2001
alignment and redesign of products and features in compared with $649.2 million in 2000, a 1.2 percent
connection with the merger of Firstar and USBM, and fee decline. Growth in net interest income during 2001
revenue related to the Tennessee branch acquisition. Fee compared with 2000, was driven by core loan and deposit
income growth for 2001 was tempered somewhat by the growth partially oÅset by the impact of declining rates on
recognition of an impairment of retail leasing residuals of the funding beneÑt of deposits. Noninterest income
$40.0 million during the third and fourth quarters. Consumer declined 3.5 percent during 2001 compared with a year ago
Banking results reflect an increase in noninterest expense of primarily due to trust and investment management fees
$154.6 million (9.1 percent) primarily related to impairments being adversely aÅected by the current capital markets
of MSRs of $60.8 million and the Tennessee branch conditions. Noninterest expense decreased 2.3 percent
acquisition. Additionally, the provision for credit losses ($11.1 million) in 2001. Cost savings related to integration
increased $72.3 million (20.7 percent) during the year. The activities primarily drove the decline in noninterest expense.
increase reflects deterioration in asset quality, higherPayment Services includes consumer and business creditconsumer bankruptcies and economic trends impacting thecards, corporate and purchasing card services, consumerbusiness unit's loan and retail leasing portfolios.lines of credit, ATM processing and merchant processing.
Private Client, Trust and Asset Management provides Payment Services contributed $724.3 million of themutual fund processing services, trust, private banking and Company's pre-tax income in 2001 compared withÑnancial advisory services through four businesses, $708.6 million in 2000, a 2.2 percent increase. The businessincluding: the Private Client Group, Corporate Trust unit's Ñnancial results were, in part, impacted by an increaseServices, Institutional Trust and Custody, and Fund Services. in the provision for credit losses and the NOVA acquisition
Private Client, Trust Payment Capital Treasury and Consolidatedand Asset Management Services Markets Corporate Support Company
Percent Percent Percent Percent Percent2001 2000 Change 2001 2000 Change 2001 2000 Change 2001 2000 Change 2001 2000 Change
$ 244.4 $ 223.6 9.3% $ 459.6 $ 428.6 7.2% $ 17.8 $ 24.9 (28.5)% $1,073.4 $ 723.6 48.3% $ 6,464.7 $ 6,135.0 5.4%
876.3 908.1 (3.5) 1,289.0 1,080.6 19.3 831.2 1,097.6 (24.3) 463.9 254.7 82.1 5,297.2 4,883.2 8.5
1,120.7 1,131.7 (1.0) 1,748.6 1,509.2 15.9 849.0 1,122.5 (24.4) 1,537.3 978.3 57.1 11,761.9 11,018.2 6.7
448.2 459.4 (2.4) 525.2 412.8 27.2 738.2 907.4 (18.6) 1,334.5 1,212.1 10.1 5,129.3 4,976.0 3.1
20.8 20.7 .5 55.4 23.8 * Ì .1 Ì 50.4 49.1 2.6 278.4 157.3 77.0
.4 .4 Ì 11.9 11.4 4.4 .1 .7 (85.7) 211.9 210.1 .9 251.1 235.0 6.9
469.4 480.5 (2.3) 592.5 448.0 32.3 738.3 908.2 (18.7) 1,596.8 1,471.3 8.5 5,658.8 5,368.3 5.4
651.3 651.2 Ì 1,156.1 1,061.2 8.9 110.7 214.3 (48.3) (59.5) (493.0) (87.9) 6,103.1 5,649.9 8.0
10.0 2.0 * 431.8 352.6 22.5 17.6 Ì * 673.5 (36.1) * 2,146.6 828.0 *
641.3 649.2 (1.2) 724.3 708.6 2.2 93.1 214.3 (56.6) (733.0) (456.9) 60.4 3,956.5 4,821.9 (17.9)
233.4 236.2 (1.2) 263.6 257.9 2.2 33.9 78.0 (56.5) (300.9) (206.0) 46.1 1,405.7 1,715.0 (18.0)
$ 407.9 $ 413.0 (1.2) $ 460.7 $ 450.7 2.2 $ 59.2 $ 136.3 (56.6) $ (432.1)$ (250.9) 72.2 2,550.8 3,106.9 (17.9)
(844.3) (231.3)
$ 1,706.5 $ 2,875.6
$ 4,370 $ 3,794 15.2 $ 9,972 $ 9,531 4.6 $ 483 $ 263 83.7 $ 6,299 $ 7,317 (13.9) $ 118,177 $ 118,317 (.1)
5,424 5,130 5.7 12,142 10,652 14.0 3,478 3,394 2.5 34,807 31,066 12.0 165,944 158,481 4.7
2,134 2,119 .7 168 188 (10.6) 174 154 13.0 (53) (10) * 25,109 23,820 5.4
4,916 4,722 4.1 Ì Ì Ì Ì Ì Ì 7,037 7,680 (8.4) 79,847 79,606 .3
$ 7,050 $ 6,841 3.1 $ 168 $ 188 (10.6) $ 174 $ 154 13.0 $ 6,984 $ 7,670 (8.9) $ 104,956 $ 103,426 1.5
U.S. Bancorp 45

completed during the third quarter of 2001. The line of Treasury and Corporate Support recorded a pre-tax loss of
business generated operating income of $1,156.1 million in $733.0 million in 2001, compared to a loss of
2001, an 8.9 percent increase compared with 2000. Total $456.9 million in 2000. The incremental loss was driven by
net revenue growth was 15.9 percent, or $239.4 million, an increase in the provision for credit losses, lower earnings
compared with 2000 including the impact of the NOVA from equity investments and non-recurring gains from the
acquisition of $134.3 million. Excluding the NOVA disposal of oÇce buildings in 2000. During 2001, total net
acquisitions, total net revenue growth was approximately revenue was $1,537.3 million compared with $978.3 million
7.0 percent. Total net revenue growth was partially oÅset a year ago. The $559.0 million increase was primarily due
by increased in noninterest expense of 32.3 percent, to an increase in average investment securities and the
primarily driven by the NOVA acquisition. Excluding the residual beneÑt of declining interest rates given the
impact of the NOVA acquisition, noninterest expenses for Company's interest rate risk management position. Also
the business line were essentially Öat relative to a year ago. included in 2001 were approximately $289.8 million of
Additionally, the provision for credit losses increased securities gains compared with $8.1 million in 2000, oÅset
$79.2 million (22.5 percent) in 2001. The increase in somewhat by lower earnings from equity investments of
provision reÖects deterioration in delinquencies, higher $78.0 million and gains from the disposal of oÇce buildings
bankruptcies and credit losses in the credit card portfolio in 2000. Noninterest expenses were $1,596.8 million in
and the economic slowdown impacting consumers. 2001 compared with $1,471.3 million for the same period
of 2000. The increase was primarily related to core businessCapital Markets engages in equity and fixed income trading operations and higher costs related to increased aÅordableactivities, offers investment banking and underwriting services housing projects. Provision for credit losses for this businessfor corporate and public sector customers and provides unit represents the residual aggregate of the credit lossesfinancial advisory services and securities, mutual funds, allocated to the reportable business units (based on netannuities and insurance products to consumers and regionally charge-oÅs for the accounting period) and the Company'sbased businesses through a network of brokerage offices. recorded provision determined in accordance with generallyCapital Markets contributed $93.1 million of the Company's accepted accounting principles in the United States.pre-tax income in 2001, compared with $214.3 million in Provision for credit losses for the year ended December 31,2000, a decrease of 56.6 percent. The unfavorable variance in 2001, was $673.5 million compared with a net recovery ofpre-tax income from 2000 was due to significant decreases in $36.1 million in 2000. The change in the provision reÖectsfees related to trading, investment product fees and the Company's decision in the third quarter of 2001 tocommissions and investment banking revenues reflecting the increase the allowance for credit losses in light of recentrecent adverse capital markets conditions. In response to events, declining economic conditions and deterioration insignificant changes in the securities markets including the credit quality of the loan portfolio from a year ago.increased volatility, changes in equity valuations, a slowdown Refer to ""Corporate Risk ProÑle'' for further informationin the market for new and secondary issuances of equity and on provision for credit losses, nonperforming assets andthe increasingly competitive environment for the industry, factors considered by the Company in assessing the creditU.S. Bancorp Piper Jaffray restructured its operations during quality of the loan portfolio and establishing the allowance2001. Additionally, in June 2001, the Company decided to for credit losses.discontinue its U.S. Bancorp Libra operations, a business unit
ACCOUNTING CHANGESthat specialized in underwriting and trading high-yield debt
and mezzanine securities. These restructuring activities are Accounting for Derivative Instruments and Hedgingexpected to improve operating efficiency of the business unit Activities Statement of Financial Accounting Standardsby removing excess capacity from the product distribution No. 133 (""SFAS 133''), ""Accounting for Derivativesystem and brokerage operations. Instruments and Hedging Activities,'' as amended, establishes
accounting and reporting standards for all derivativeTreasury and Corporate Support includes the Company's
instruments and criteria for designation and effectiveness ofinvestment and residential mortgage portfolios, funding,
hedging activities. SFAS 133 requires that an entity recognizecapital management and asset securitization activities,
all derivatives as either assets or liabilities on the balanceinterest rate risk management, the net eÅect of transfer
sheet and measure those instruments at fair value. Thepricing related to loan and deposit balances, and the change
changes in the fair value of the derivatives are recognizedin residual allocations associated with the provision for loan
currently in earnings unless specific hedge accounting criterialosses. It also includes business activities managed on a
are met. If the derivative qualifies as a hedge, the accountingcorporate basis, including income and expense of enterprise-
treatment varies based on the type of risk being hedged. Onwide operations and administrative support functions.
U.S. Bancorp46

January 1, 2001, the Company adopted SFAS 133. Transition principles'' in the income statement. The amortization
adjustments related to adoption resulted in an after-tax loss provisions of SFAS 142 apply to goodwill and intangible
of approximately $4.1 million recorded in net income and an assets acquired after June 30, 2001. With respect to
after-tax increase of $5.2 million to other comprehensive goodwill and intangible assets acquired prior to July 1,
income. The transition adjustments related to adoption were 2001, the amortization provisions of SFAS 142 are eÅective
not material to the Company's financial statements, and as upon adoption of SFAS 142.
such, were not separately reported in the consolidated The Company will apply the amortization provisions of
statement of income. SFAS 142 during the first quarter of 2002. Management
anticipates that applying the provisions of SFAS 141 to recentAccounting for Business Combinations and Goodwill acquisitions and the provisions of SFAS 142 to purchaseand Other Intangible Assets In June 2001, the Financial acquisitions completed prior to July 1, 2001, will increaseAccounting Standards Board issued Statement of Financial after-tax income for the year ending December 31, 2002, byAccounting Standards No. 141 (""SFAS 141''), ""Business approximately $200 to $210 million, or $.10 per diluted share.Combinations'' and Statement of Financial Accounting This considers the application of SFAS 142's definition of aStandard No. 142 (""SFAS 142''), ""Goodwill and Other business and the impact of reclassifying certain assets fromIntangible Assets''. SFAS 141 mandates the purchase goodwill to intangibles and changes in estimated useful lives ofmethod of accounting be used for all business combinations certain intangible assets. The Company has not yet fullyinitiated after June 30, 2001, and establishes speciÑc criteria determined the impact on earnings of impairments related tofor the recognition of intangible assets separately from goodwill and indefinite lived intangible assets under the newgoodwill. SFAS 142 addresses the accounting for goodwill guidelines required by SFAS 142. Any material impairmentand intangible assets subsequent to their acquisition. The charge resulting from these transitional accounting rules willCompany is required to adopt SFAS 142 on January 1, be reflected as a ""cumulative effect of a change in accounting2002. The most signiÑcant changes made by SFAS 142 are principles'' in the first quarter of 2002. Because bankingthat goodwill and indeÑnite lived intangible assets will no regulations exclude 100 percent of goodwill from thelonger be amortized and will be tested for impairment at determination of capital adequacy, the impact of anyleast annually, thereafter. Any impairment charges from the impairment on the Company's capital adequacy will not beinitial impairment test at the time of adoption would be significant.recognized as a ""cumulative eÅect of change in accounting
U.S. Bancorp 47

Responsibility for Financial Report of IndependentStatements of U.S. Bancorp Accountants
Responsibility for the Ñnancial statements and other To the Shareholders and Board of Directors of U.S. Bancorp:information presented throughout the Annual Report on
In our opinion, the accompanying consolidated balance sheetForm 10-K rests with the management of U.S. Bancorp. Theand the related consolidated statements of income,Company believes that the consolidated Ñnancial statementsshareholders' equity and cash Öows present fairly, in allhave been prepared in conformity with accounting principlesmaterial respects, the Ñnancial position of U.S. Bancorp andgenerally accepted in the United States and present fairly theits subsidiaries at December 31, 2001 and 2000, and thesubstance of transactions based on the circumstances andresults of their operations and their cash Öows for each of themanagement's best estimates and judgment. All Ñnancialthree years in the period ended December 31, 2001, ininformation throughout the Annual Report on Form 10-K isconformity with accounting principles generally accepted inconsistent with that in the Ñnancial statements.the United States of America. These Ñnancial statements are
In meeting its responsibilities for the reliability of the financial the responsibility of the Company's management; ourstatements, the Company depends on its system of internal responsibility is to express an opinion on these Ñnancialcontrols. The system is designed to provide reasonable assurance statements based on our audits. We conducted our audits ofthat assets are safeguarded and transactions are executed in these statements in accordance with auditing standardsaccordance with the appropriate corporate authorization and generally accepted in the United States of America, whichrecorded properly to permit the preparation of the financial require that we plan and perform the audit to obtainstatements. To test compliance, the Company carries out an reasonable assurance about whether the Ñnancial statementsextensive audit program. This program includes a review for are free of material misstatement. An audit includescompliance with written policies and procedures and a examining, on a test basis, evidence supporting the amountscomprehensive review of the adequacy and effectiveness of the and disclosures in the Ñnancial statements, assessing theinternal control systems. Although control procedures are accounting principles used and signiÑcant estimates made bydesigned and tested, it must be recognized that there are limits management, and evaluating the overall Ñnancial statementinherent in all systems of internal accounting control and, as presentation. We believe that our audits provide a reasonablesuch, errors and irregularities may nevertheless occur. Also, basis for our opinion.estimates and judgments are required to assess and balance therelative cost and expected benefits of the controls. TheCompany believes that its system of internal controls providesreasonable assurance that errors or irregularities that could bematerial to the financial statements are prevented or would bedetected within a timely period by employees in the normal
Minneapolis, Minnesotacourse of performing their assigned functions.January 15, 2002
The Board of Directors of the Company has an AuditCommittee composed of directors who are not oÇcers oremployees of U.S. Bancorp. The committee meets periodicallywith management, the internal auditors and the independentaccountants to consider audit results and to discuss internalaccounting control, auditing and Ñnancial reporting matters.
The Company's independent accountants,PricewaterhouseCoopers LLP, have been engaged to renderan independent professional opinion on the Ñnancialstatements and to assist in carrying out certain aspects of theaudit program described above. Their opinion on the Ñnancialstatements is based on procedures conducted in accordancewith auditing standards generally accepted in the United Statesand forms the basis for their report as to the fairpresentation, in the Ñnancial statements, of the Company'sÑnancial position, operating results and cash Öows.
Jerry A. Grundhofer David M. MoÅettPresident and Vice Chairman andChief Executive OÇcer Chief Financial OÇcer
U.S. Bancorp48

Consolidated Balance Sheet
At December 31 (Dollars in Millions) 2001 2000
Assets
Cash and due from banks ÏÏÏÏÏÏÏÏÏÏÏÏÏÏÏÏÏÏÏÏÏÏÏÏÏÏÏÏÏÏÏÏÏÏÏÏÏÏÏÏÏÏÏÏÏÏÏÏÏÏÏÏÏÏÏÏÏÏÏÏÏÏÏÏÏÏÏÏÏÏÏÏÏÏÏÏÏÏÏ $ 9,120 $ 8,475
Money market investments ÏÏÏÏÏÏÏÏÏÏÏÏÏÏÏÏÏÏÏÏÏÏÏÏÏÏÏÏÏÏÏÏÏÏÏÏÏÏÏÏÏÏÏÏÏÏÏÏÏÏÏÏÏÏÏÏÏÏÏÏÏÏÏÏÏÏÏÏÏÏÏÏÏÏÏÏÏÏ 625 657
Trading account securitiesÏÏÏÏÏÏÏÏÏÏÏÏÏÏÏÏÏÏÏÏÏÏÏÏÏÏÏÏÏÏÏÏÏÏÏÏÏÏÏÏÏÏÏÏÏÏÏÏÏÏÏÏÏÏÏÏÏÏÏÏÏÏÏÏÏÏÏÏÏÏÏÏÏÏÏÏÏÏÏ 982 753
Investment securities
Held-to-maturity (fair value $306 and $257, respectively)ÏÏÏÏÏÏÏÏÏÏÏÏÏÏÏÏÏÏÏÏÏÏÏÏÏÏÏÏÏÏÏÏÏÏÏÏÏÏÏÏÏÏÏÏÏÏÏ 299 252
Available-for-saleÏÏÏÏÏÏÏÏÏÏÏÏÏÏÏÏÏÏÏÏÏÏÏÏÏÏÏÏÏÏÏÏÏÏÏÏÏÏÏÏÏÏÏÏÏÏÏÏÏÏÏÏÏÏÏÏÏÏÏÏÏÏÏÏÏÏÏÏÏÏÏÏÏÏÏÏÏÏÏÏÏÏÏÏ 26,309 17,390
Loans held for sale ÏÏÏÏÏÏÏÏÏÏÏÏÏÏÏÏÏÏÏÏÏÏÏÏÏÏÏÏÏÏÏÏÏÏÏÏÏÏÏÏÏÏÏÏÏÏÏÏÏÏÏÏÏÏÏÏÏÏÏÏÏÏÏÏÏÏÏÏÏÏÏÏÏÏÏÏÏÏÏÏÏÏÏÏÏ 2,820 764
Loans
Commercial ÏÏÏÏÏÏÏÏÏÏÏÏÏÏÏÏÏÏÏÏÏÏÏÏÏÏÏÏÏÏÏÏÏÏÏÏÏÏÏÏÏÏÏÏÏÏÏÏÏÏÏÏÏÏÏÏÏÏÏÏÏÏÏÏÏÏÏÏÏÏÏÏÏÏÏÏÏÏÏÏÏÏÏÏÏÏÏÏÏ 46,330 52,817
Commercial real estate ÏÏÏÏÏÏÏÏÏÏÏÏÏÏÏÏÏÏÏÏÏÏÏÏÏÏÏÏÏÏÏÏÏÏÏÏÏÏÏÏÏÏÏÏÏÏÏÏÏÏÏÏÏÏÏÏÏÏÏÏÏÏÏÏÏÏÏÏÏÏÏÏÏÏÏÏÏÏ 25,373 26,443
Residential mortgages ÏÏÏÏÏÏÏÏÏÏÏÏÏÏÏÏÏÏÏÏÏÏÏÏÏÏÏÏÏÏÏÏÏÏÏÏÏÏÏÏÏÏÏÏÏÏÏÏÏÏÏÏÏÏÏÏÏÏÏÏÏÏÏÏÏÏÏÏÏÏÏÏÏÏÏÏÏÏÏ 5,746 7,753
RetailÏÏÏÏÏÏÏÏÏÏÏÏÏÏÏÏÏÏÏÏÏÏÏÏÏÏÏÏÏÏÏÏÏÏÏÏÏÏÏÏÏÏÏÏÏÏÏÏÏÏÏÏÏÏÏÏÏÏÏÏÏÏÏÏÏÏÏÏÏÏÏÏÏÏÏÏÏÏÏÏÏÏÏÏÏÏÏÏÏÏÏÏÏÏÏ 36,956 35,352
Total loans ÏÏÏÏÏÏÏÏÏÏÏÏÏÏÏÏÏÏÏÏÏÏÏÏÏÏÏÏÏÏÏÏÏÏÏÏÏÏÏÏÏÏÏÏÏÏÏÏÏÏÏÏÏÏÏÏÏÏÏÏÏÏÏÏÏÏÏÏÏÏÏÏÏÏÏÏÏÏÏÏÏÏÏÏÏÏ 114,405 122,365
Less allowance for credit losses ÏÏÏÏÏÏÏÏÏÏÏÏÏÏÏÏÏÏÏÏÏÏÏÏÏÏÏÏÏÏÏÏÏÏÏÏÏÏÏÏÏÏÏÏÏÏÏÏÏÏÏÏÏÏÏÏÏÏÏÏÏÏÏ 2,457 1,787
Net loansÏÏÏÏÏÏÏÏÏÏÏÏÏÏÏÏÏÏÏÏÏÏÏÏÏÏÏÏÏÏÏÏÏÏÏÏÏÏÏÏÏÏÏÏÏÏÏÏÏÏÏÏÏÏÏÏÏÏÏÏÏÏÏÏÏÏÏÏÏÏÏÏÏÏÏÏÏÏÏÏÏÏÏÏÏ 111,948 120,578
Premises and equipment ÏÏÏÏÏÏÏÏÏÏÏÏÏÏÏÏÏÏÏÏÏÏÏÏÏÏÏÏÏÏÏÏÏÏÏÏÏÏÏÏÏÏÏÏÏÏÏÏÏÏÏÏÏÏÏÏÏÏÏÏÏÏÏÏÏÏÏÏÏÏÏÏÏÏÏÏÏÏÏÏ 1,741 1,836
Customers' liability on acceptances ÏÏÏÏÏÏÏÏÏÏÏÏÏÏÏÏÏÏÏÏÏÏÏÏÏÏÏÏÏÏÏÏÏÏÏÏÏÏÏÏÏÏÏÏÏÏÏÏÏÏÏÏÏÏÏÏÏÏÏÏÏÏÏÏÏÏÏÏÏÏ 178 183
Goodwill ÏÏÏÏÏÏÏÏÏÏÏÏÏÏÏÏÏÏÏÏÏÏÏÏÏÏÏÏÏÏÏÏÏÏÏÏÏÏÏÏÏÏÏÏÏÏÏÏÏÏÏÏÏÏÏÏÏÏÏÏÏÏÏÏÏÏÏÏÏÏÏÏÏÏÏÏÏÏÏÏÏÏÏÏÏÏÏÏÏÏÏÏÏÏÏ 5,488 4,312
Other intangible assetsÏÏÏÏÏÏÏÏÏÏÏÏÏÏÏÏÏÏÏÏÏÏÏÏÏÏÏÏÏÏÏÏÏÏÏÏÏÏÏÏÏÏÏÏÏÏÏÏÏÏÏÏÏÏÏÏÏÏÏÏÏÏÏÏÏÏÏÏÏÏÏÏÏÏÏÏÏÏÏÏÏÏ 1,924 997
Other assets ÏÏÏÏÏÏÏÏÏÏÏÏÏÏÏÏÏÏÏÏÏÏÏÏÏÏÏÏÏÏÏÏÏÏÏÏÏÏÏÏÏÏÏÏÏÏÏÏÏÏÏÏÏÏÏÏÏÏÏÏÏÏÏÏÏÏÏÏÏÏÏÏÏÏÏÏÏÏÏÏÏÏÏÏÏÏÏÏÏÏÏ 9,956 8,724
Total assets ÏÏÏÏÏÏÏÏÏÏÏÏÏÏÏÏÏÏÏÏÏÏÏÏÏÏÏÏÏÏÏÏÏÏÏÏÏÏÏÏÏÏÏÏÏÏÏÏÏÏÏÏÏÏÏÏÏÏÏÏÏÏÏÏÏÏÏÏÏÏÏÏÏÏÏÏÏÏÏÏÏÏÏÏÏ $171,390 $164,921
Liabilities and Shareholders' Equity
Deposits
Noninterest-bearingÏÏÏÏÏÏÏÏÏÏÏÏÏÏÏÏÏÏÏÏÏÏÏÏÏÏÏÏÏÏÏÏÏÏÏÏÏÏÏÏÏÏÏÏÏÏÏÏÏÏÏÏÏÏÏÏÏÏÏÏÏÏÏÏÏÏÏÏÏÏÏÏÏÏÏÏÏÏÏÏÏÏ $ 31,212 $ 26,633
Interest-bearing ÏÏÏÏÏÏÏÏÏÏÏÏÏÏÏÏÏÏÏÏÏÏÏÏÏÏÏÏÏÏÏÏÏÏÏÏÏÏÏÏÏÏÏÏÏÏÏÏÏÏÏÏÏÏÏÏÏÏÏÏÏÏÏÏÏÏÏÏÏÏÏÏÏÏÏÏÏÏÏÏÏÏÏÏÏ 65,447 68,177
Time certiÑcates of deposit greater than $100,000ÏÏÏÏÏÏÏÏÏÏÏÏÏÏÏÏÏÏÏÏÏÏÏÏÏÏÏÏÏÏÏÏÏÏÏÏÏÏÏÏÏÏÏÏÏÏÏÏÏÏÏÏÏÏ 8,560 14,725
Total depositsÏÏÏÏÏÏÏÏÏÏÏÏÏÏÏÏÏÏÏÏÏÏÏÏÏÏÏÏÏÏÏÏÏÏÏÏÏÏÏÏÏÏÏÏÏÏÏÏÏÏÏÏÏÏÏÏÏÏÏÏÏÏÏÏÏÏÏÏÏÏÏÏÏÏÏÏÏÏÏÏÏÏÏÏ 105,219 109,535
Short-term borrowings ÏÏÏÏÏÏÏÏÏÏÏÏÏÏÏÏÏÏÏÏÏÏÏÏÏÏÏÏÏÏÏÏÏÏÏÏÏÏÏÏÏÏÏÏÏÏÏÏÏÏÏÏÏÏÏÏÏÏÏÏÏÏÏÏÏÏÏÏÏÏÏÏÏÏÏÏÏÏÏÏÏÏ 14,670 11,833
Long-term debtÏÏÏÏÏÏÏÏÏÏÏÏÏÏÏÏÏÏÏÏÏÏÏÏÏÏÏÏÏÏÏÏÏÏÏÏÏÏÏÏÏÏÏÏÏÏÏÏÏÏÏÏÏÏÏÏÏÏÏÏÏÏÏÏÏÏÏÏÏÏÏÏÏÏÏÏÏÏÏÏÏÏÏÏÏÏÏÏÏ 25,716 21,876
Company-obligated mandatorily redeemable preferred securities of subsidiary trusts holding solely the junior
subordinated debentures of the parent company ÏÏÏÏÏÏÏÏÏÏÏÏÏÏÏÏÏÏÏÏÏÏÏÏÏÏÏÏÏÏÏÏÏÏÏÏÏÏÏÏÏÏÏÏÏÏÏÏÏÏÏÏÏÏÏ 2,826 1,400
Acceptances outstandingÏÏÏÏÏÏÏÏÏÏÏÏÏÏÏÏÏÏÏÏÏÏÏÏÏÏÏÏÏÏÏÏÏÏÏÏÏÏÏÏÏÏÏÏÏÏÏÏÏÏÏÏÏÏÏÏÏÏÏÏÏÏÏÏÏÏÏÏÏÏÏÏÏÏÏÏÏÏÏÏ 178 183
Other liabilities ÏÏÏÏÏÏÏÏÏÏÏÏÏÏÏÏÏÏÏÏÏÏÏÏÏÏÏÏÏÏÏÏÏÏÏÏÏÏÏÏÏÏÏÏÏÏÏÏÏÏÏÏÏÏÏÏÏÏÏÏÏÏÏÏÏÏÏÏÏÏÏÏÏÏÏÏÏÏÏÏÏÏÏÏÏÏÏÏÏ 6,320 4,926
Total liabilitiesÏÏÏÏÏÏÏÏÏÏÏÏÏÏÏÏÏÏÏÏÏÏÏÏÏÏÏÏÏÏÏÏÏÏÏÏÏÏÏÏÏÏÏÏÏÏÏÏÏÏÏÏÏÏÏÏÏÏÏÏÏÏÏÏÏÏÏÏÏÏÏÏÏÏÏÏÏÏÏÏÏÏÏÏ 154,929 149,753
Shareholders' equity
Common stock, par value $0.01 a share
authorized: 2001 Ì 4,000,000,000 shares; 2000 Ì 2,000,000,000 shares
issued: 2001 Ì 1,972,777,763 shares; 2000 Ì 1,943,541,593 shares ÏÏÏÏÏÏÏÏÏÏÏÏÏÏÏÏÏÏÏÏÏÏÏÏÏÏÏÏÏÏÏÏ 20 19
Capital surplus ÏÏÏÏÏÏÏÏÏÏÏÏÏÏÏÏÏÏÏÏÏÏÏÏÏÏÏÏÏÏÏÏÏÏÏÏÏÏÏÏÏÏÏÏÏÏÏÏÏÏÏÏÏÏÏÏÏÏÏÏÏÏÏÏÏÏÏÏÏÏÏÏÏÏÏÏÏÏÏÏÏÏÏÏÏÏ 4,906 4,276
Retained earnings ÏÏÏÏÏÏÏÏÏÏÏÏÏÏÏÏÏÏÏÏÏÏÏÏÏÏÏÏÏÏÏÏÏÏÏÏÏÏÏÏÏÏÏÏÏÏÏÏÏÏÏÏÏÏÏÏÏÏÏÏÏÏÏÏÏÏÏÏÏÏÏÏÏÏÏÏÏÏÏÏÏÏÏ 11,918 11,658
Less cost of common stock in treasury: 2001 Ì 21,068,251 shares; 2000 Ì 41,458,159 sharesÏÏÏÏÏÏÏÏÏÏÏÏ (478) (880)
Other comprehensive incomeÏÏÏÏÏÏÏÏÏÏÏÏÏÏÏÏÏÏÏÏÏÏÏÏÏÏÏÏÏÏÏÏÏÏÏÏÏÏÏÏÏÏÏÏÏÏÏÏÏÏÏÏÏÏÏÏÏÏÏÏÏÏÏÏÏÏÏÏÏÏÏÏÏ 95 95
Total shareholders' equityÏÏÏÏÏÏÏÏÏÏÏÏÏÏÏÏÏÏÏÏÏÏÏÏÏÏÏÏÏÏÏÏÏÏÏÏÏÏÏÏÏÏÏÏÏÏÏÏÏÏÏÏÏÏÏÏÏÏÏÏÏÏÏÏÏÏÏÏÏÏÏÏÏ 16,461 15,168
Total liabilities and shareholders' equity ÏÏÏÏÏÏÏÏÏÏÏÏÏÏÏÏÏÏÏÏÏÏÏÏÏÏÏÏÏÏÏÏÏÏÏÏÏÏÏÏÏÏÏÏÏÏÏÏÏÏÏÏÏÏÏÏÏÏÏÏ $171,390 $164,921
See Notes to Consolidated Financial Statements.
U.S. Bancorp 49

Consolidated Statement of Income
Year Ended December 31 (Dollars and Shares in Millions, Except Per Share Data) 2001 2000 1999
Interest IncomeLoans ÏÏÏÏÏÏÏÏÏÏÏÏÏÏÏÏÏÏÏÏÏÏÏÏÏÏÏÏÏÏÏÏÏÏÏÏÏÏÏÏÏÏÏÏÏÏÏÏÏÏÏÏÏÏÏÏÏÏÏÏÏÏÏÏÏÏÏÏÏÏÏÏÏÏÏÏÏÏÏÏÏ $ 9,455.4 $10,562.5 $ 9,122.7
Loans held for saleÏÏÏÏÏÏÏÏÏÏÏÏÏÏÏÏÏÏÏÏÏÏÏÏÏÏÏÏÏÏÏÏÏÏÏÏÏÏÏÏÏÏÏÏÏÏÏÏÏÏÏÏÏÏÏÏÏÏÏÏÏÏÏÏÏÏÏÏÏ 146.9 102.1 103.9
Investment securities
Taxable ÏÏÏÏÏÏÏÏÏÏÏÏÏÏÏÏÏÏÏÏÏÏÏÏÏÏÏÏÏÏÏÏÏÏÏÏÏÏÏÏÏÏÏÏÏÏÏÏÏÏÏÏÏÏÏÏÏÏÏÏÏÏÏÏÏÏÏÏÏÏÏÏÏÏÏÏ 1,206.1 1,008.3 1,047.1
Non-taxable ÏÏÏÏÏÏÏÏÏÏÏÏÏÏÏÏÏÏÏÏÏÏÏÏÏÏÏÏÏÏÏÏÏÏÏÏÏÏÏÏÏÏÏÏÏÏÏÏÏÏÏÏÏÏÏÏÏÏÏÏÏÏÏÏÏÏÏÏÏÏÏÏ 89.5 140.6 150.1
Money market investments ÏÏÏÏÏÏÏÏÏÏÏÏÏÏÏÏÏÏÏÏÏÏÏÏÏÏÏÏÏÏÏÏÏÏÏÏÏÏÏÏÏÏÏÏÏÏÏÏÏÏÏÏÏÏÏÏÏÏÏÏÏ 26.6 53.9 44.9
Trading securities ÏÏÏÏÏÏÏÏÏÏÏÏÏÏÏÏÏÏÏÏÏÏÏÏÏÏÏÏÏÏÏÏÏÏÏÏÏÏÏÏÏÏÏÏÏÏÏÏÏÏÏÏÏÏÏÏÏÏÏÏÏÏÏÏÏÏÏÏÏÏ 57.5 53.7 45.0
Other interest income ÏÏÏÏÏÏÏÏÏÏÏÏÏÏÏÏÏÏÏÏÏÏÏÏÏÏÏÏÏÏÏÏÏÏÏÏÏÏÏÏÏÏÏÏÏÏÏÏÏÏÏÏÏÏÏÏÏÏÏÏÏÏÏÏÏÏ 101.6 151.4 113.0
Total interest incomeÏÏÏÏÏÏÏÏÏÏÏÏÏÏÏÏÏÏÏÏÏÏÏÏÏÏÏÏÏÏÏÏÏÏÏÏÏÏÏÏÏÏÏÏÏÏÏÏÏÏÏÏÏÏÏÏÏÏÏÏÏ 11,083.6 12,072.5 10,626.7
Interest ExpenseDeposits ÏÏÏÏÏÏÏÏÏÏÏÏÏÏÏÏÏÏÏÏÏÏÏÏÏÏÏÏÏÏÏÏÏÏÏÏÏÏÏÏÏÏÏÏÏÏÏÏÏÏÏÏÏÏÏÏÏÏÏÏÏÏÏÏÏÏÏÏÏÏÏÏÏÏÏÏÏÏ 2,828.1 3,618.8 2,970.0
Short-term borrowingsÏÏÏÏÏÏÏÏÏÏÏÏÏÏÏÏÏÏÏÏÏÏÏÏÏÏÏÏÏÏÏÏÏÏÏÏÏÏÏÏÏÏÏÏÏÏÏÏÏÏÏÏÏÏÏÏÏÏÏÏÏÏÏÏÏÏ 534.1 781.7 582.4
Long-term debt ÏÏÏÏÏÏÏÏÏÏÏÏÏÏÏÏÏÏÏÏÏÏÏÏÏÏÏÏÏÏÏÏÏÏÏÏÏÏÏÏÏÏÏÏÏÏÏÏÏÏÏÏÏÏÏÏÏÏÏÏÏÏÏÏÏÏÏÏÏÏÏÏ 1,162.7 1,510.4 1,126.9
Company-obligated mandatorily redeemable preferred securities of subsidiary trusts holding
solely the junior subordinated debentures of the parent company ÏÏÏÏÏÏÏÏÏÏÏÏÏÏÏÏÏÏÏÏÏÏÏÏ 149.9 112.0 111.0
Total interest expense ÏÏÏÏÏÏÏÏÏÏÏÏÏÏÏÏÏÏÏÏÏÏÏÏÏÏÏÏÏÏÏÏÏÏÏÏÏÏÏÏÏÏÏÏÏÏÏÏÏÏÏÏÏÏÏÏÏÏÏ 4,674.8 6,022.9 4,790.3
Net interest income ÏÏÏÏÏÏÏÏÏÏÏÏÏÏÏÏÏÏÏÏÏÏÏÏÏÏÏÏÏÏÏÏÏÏÏÏÏÏÏÏÏÏÏÏÏÏÏÏÏÏÏÏÏÏÏÏÏÏÏÏÏÏÏÏÏÏÏÏ 6,408.8 6,049.6 5,836.4
Provision for credit losses ÏÏÏÏÏÏÏÏÏÏÏÏÏÏÏÏÏÏÏÏÏÏÏÏÏÏÏÏÏÏÏÏÏÏÏÏÏÏÏÏÏÏÏÏÏÏÏÏÏÏÏÏÏÏÏÏÏÏÏÏÏÏ 2,528.8 828.0 646.0
Net interest income after provision for credit lossesÏÏÏÏÏÏÏÏÏÏÏÏÏÏÏÏÏÏÏÏÏÏÏÏÏÏÏÏÏÏÏÏÏÏÏÏÏÏÏ 3,880.0 5,221.6 5,190.4
Noninterest IncomeCredit card fee revenueÏÏÏÏÏÏÏÏÏÏÏÏÏÏÏÏÏÏÏÏÏÏÏÏÏÏÏÏÏÏÏÏÏÏÏÏÏÏÏÏÏÏÏÏÏÏÏÏÏÏÏÏÏÏÏÏÏÏÏÏÏÏÏÏÏ 774.3 761.8 648.2
Merchant and ATM processing revenueÏÏÏÏÏÏÏÏÏÏÏÏÏÏÏÏÏÏÏÏÏÏÏÏÏÏÏÏÏÏÏÏÏÏÏÏÏÏÏÏÏÏÏÏÏÏÏÏÏÏ 428.8 230.3 189.6
Trust and investment management feesÏÏÏÏÏÏÏÏÏÏÏÏÏÏÏÏÏÏÏÏÏÏÏÏÏÏÏÏÏÏÏÏÏÏÏÏÏÏÏÏÏÏÏÏÏÏÏÏÏÏ 894.4 926.2 887.1
Deposit service charges ÏÏÏÏÏÏÏÏÏÏÏÏÏÏÏÏÏÏÏÏÏÏÏÏÏÏÏÏÏÏÏÏÏÏÏÏÏÏÏÏÏÏÏÏÏÏÏÏÏÏÏÏÏÏÏÏÏÏÏÏÏÏÏÏ 660.6 551.1 497.2
Cash management feesÏÏÏÏÏÏÏÏÏÏÏÏÏÏÏÏÏÏÏÏÏÏÏÏÏÏÏÏÏÏÏÏÏÏÏÏÏÏÏÏÏÏÏÏÏÏÏÏÏÏÏÏÏÏÏÏÏÏÏÏÏÏÏÏÏ 347.3 292.4 280.6
Mortgage banking revenueÏÏÏÏÏÏÏÏÏÏÏÏÏÏÏÏÏÏÏÏÏÏÏÏÏÏÏÏÏÏÏÏÏÏÏÏÏÏÏÏÏÏÏÏÏÏÏÏÏÏÏÏÏÏÏÏÏÏÏÏÏÏ 234.0 189.9 190.4
Trading account proÑts and commissions ÏÏÏÏÏÏÏÏÏÏÏÏÏÏÏÏÏÏÏÏÏÏÏÏÏÏÏÏÏÏÏÏÏÏÏÏÏÏÏÏÏÏÏÏÏÏÏÏ 221.6 258.4 222.4
Investment products fees and commissions ÏÏÏÏÏÏÏÏÏÏÏÏÏÏÏÏÏÏÏÏÏÏÏÏÏÏÏÏÏÏÏÏÏÏÏÏÏÏÏÏÏÏÏÏÏÏ 460.1 466.6 450.8
Investment banking revenue ÏÏÏÏÏÏÏÏÏÏÏÏÏÏÏÏÏÏÏÏÏÏÏÏÏÏÏÏÏÏÏÏÏÏÏÏÏÏÏÏÏÏÏÏÏÏÏÏÏÏÏÏÏÏÏÏÏÏÏÏ 258.2 360.3 246.6
Commercial product revenueÏÏÏÏÏÏÏÏÏÏÏÏÏÏÏÏÏÏÏÏÏÏÏÏÏÏÏÏÏÏÏÏÏÏÏÏÏÏÏÏÏÏÏÏÏÏÏÏÏÏÏÏÏÏÏÏÏÏÏÏ 385.9 304.4 215.7
Securities gains, netÏÏÏÏÏÏÏÏÏÏÏÏÏÏÏÏÏÏÏÏÏÏÏÏÏÏÏÏÏÏÏÏÏÏÏÏÏÏÏÏÏÏÏÏÏÏÏÏÏÏÏÏÏÏÏÏÏÏÏÏÏÏÏÏÏÏÏÏ 329.1 8.1 13.2
Merger and restructuring-related gainsÏÏÏÏÏÏÏÏÏÏÏÏÏÏÏÏÏÏÏÏÏÏÏÏÏÏÏÏÏÏÏÏÏÏÏÏÏÏÏÏÏÏÏÏÏÏÏÏÏÏÏ 62.2 Ì Ì
Other ÏÏÏÏÏÏÏÏÏÏÏÏÏÏÏÏÏÏÏÏÏÏÏÏÏÏÏÏÏÏÏÏÏÏÏÏÏÏÏÏÏÏÏÏÏÏÏÏÏÏÏÏÏÏÏÏÏÏÏÏÏÏÏÏÏÏÏÏÏÏÏÏÏÏÏÏÏÏÏÏÏ 302.9 533.7 403.1
Total noninterest income ÏÏÏÏÏÏÏÏÏÏÏÏÏÏÏÏÏÏÏÏÏÏÏÏÏÏÏÏÏÏÏÏÏÏÏÏÏÏÏÏÏÏÏÏÏÏÏÏÏÏÏÏÏÏÏÏÏ 5,359.4 4,883.2 4,244.9
Noninterest ExpenseSalaries ÏÏÏÏÏÏÏÏÏÏÏÏÏÏÏÏÏÏÏÏÏÏÏÏÏÏÏÏÏÏÏÏÏÏÏÏÏÏÏÏÏÏÏÏÏÏÏÏÏÏÏÏÏÏÏÏÏÏÏÏÏÏÏÏÏÏÏÏÏÏÏÏÏÏÏÏÏÏÏ 2,347.1 2,427.1 2,355.3
Employee beneÑts ÏÏÏÏÏÏÏÏÏÏÏÏÏÏÏÏÏÏÏÏÏÏÏÏÏÏÏÏÏÏÏÏÏÏÏÏÏÏÏÏÏÏÏÏÏÏÏÏÏÏÏÏÏÏÏÏÏÏÏÏÏÏÏÏÏÏÏÏÏ 366.2 399.8 410.1
Net occupancyÏÏÏÏÏÏÏÏÏÏÏÏÏÏÏÏÏÏÏÏÏÏÏÏÏÏÏÏÏÏÏÏÏÏÏÏÏÏÏÏÏÏÏÏÏÏÏÏÏÏÏÏÏÏÏÏÏÏÏÏÏÏÏÏÏÏÏÏÏÏÏÏÏ 417.9 396.9 371.8
Furniture and equipmentÏÏÏÏÏÏÏÏÏÏÏÏÏÏÏÏÏÏÏÏÏÏÏÏÏÏÏÏÏÏÏÏÏÏÏÏÏÏÏÏÏÏÏÏÏÏÏÏÏÏÏÏÏÏÏÏÏÏÏÏÏÏÏÏ 305.5 308.2 307.9
Communication ÏÏÏÏÏÏÏÏÏÏÏÏÏÏÏÏÏÏÏÏÏÏÏÏÏÏÏÏÏÏÏÏÏÏÏÏÏÏÏÏÏÏÏÏÏÏÏÏÏÏÏÏÏÏÏÏÏÏÏÏÏÏÏÏÏÏÏÏÏÏÏÏ 181.4 138.8 123.4
Postage ÏÏÏÏÏÏÏÏÏÏÏÏÏÏÏÏÏÏÏÏÏÏÏÏÏÏÏÏÏÏÏÏÏÏÏÏÏÏÏÏÏÏÏÏÏÏÏÏÏÏÏÏÏÏÏÏÏÏÏÏÏÏÏÏÏÏÏÏÏÏÏÏÏÏÏÏÏÏÏ 179.8 174.5 170.7
GoodwillÏÏÏÏÏÏÏÏÏÏÏÏÏÏÏÏÏÏÏÏÏÏÏÏÏÏÏÏÏÏÏÏÏÏÏÏÏÏÏÏÏÏÏÏÏÏÏÏÏÏÏÏÏÏÏÏÏÏÏÏÏÏÏÏÏÏÏÏÏÏÏÏÏÏÏÏÏÏÏ 251.1 235.0 175.8
Other intangible assets ÏÏÏÏÏÏÏÏÏÏÏÏÏÏÏÏÏÏÏÏÏÏÏÏÏÏÏÏÏÏÏÏÏÏÏÏÏÏÏÏÏÏÏÏÏÏÏÏÏÏÏÏÏÏÏÏÏÏÏÏÏÏÏÏÏ 278.4 157.3 154.0
Merger and restructuring-related charges ÏÏÏÏÏÏÏÏÏÏÏÏÏÏÏÏÏÏÏÏÏÏÏÏÏÏÏÏÏÏÏÏÏÏÏÏÏÏÏÏÏÏÏÏÏÏÏÏ 946.4 348.7 532.8
Other ÏÏÏÏÏÏÏÏÏÏÏÏÏÏÏÏÏÏÏÏÏÏÏÏÏÏÏÏÏÏÏÏÏÏÏÏÏÏÏÏÏÏÏÏÏÏÏÏÏÏÏÏÏÏÏÏÏÏÏÏÏÏÏÏÏÏÏÏÏÏÏÏÏÏÏÏÏÏÏÏÏ 1,331.4 1,130.7 1,059.5
Total noninterest expense ÏÏÏÏÏÏÏÏÏÏÏÏÏÏÏÏÏÏÏÏÏÏÏÏÏÏÏÏÏÏÏÏÏÏÏÏÏÏÏÏÏÏÏÏÏÏÏÏÏÏÏÏÏÏÏÏ 6,605.2 5,717.0 5,661.3
Income before income taxes ÏÏÏÏÏÏÏÏÏÏÏÏÏÏÏÏÏÏÏÏÏÏÏÏÏÏÏÏÏÏÏÏÏÏÏÏÏÏÏÏÏÏÏÏÏÏÏÏÏÏÏÏÏÏÏÏÏÏÏÏ 2,634.2 4,387.8 3,774.0
Applicable income taxes ÏÏÏÏÏÏÏÏÏÏÏÏÏÏÏÏÏÏÏÏÏÏÏÏÏÏÏÏÏÏÏÏÏÏÏÏÏÏÏÏÏÏÏÏÏÏÏÏÏÏÏÏÏÏÏÏÏÏÏÏÏÏÏÏ 927.7 1,512.2 1,392.2
Net income ÏÏÏÏÏÏÏÏÏÏÏÏÏÏÏÏÏÏÏÏÏÏÏÏÏÏÏÏÏÏÏÏÏÏÏÏÏÏÏÏÏÏÏÏÏÏÏÏÏÏÏÏÏÏÏÏÏÏÏÏÏÏÏÏÏÏÏÏÏÏÏÏÏÏÏÏ $ 1,706.5 $ 2,875.6 $ 2,381.8
Earnings per share ÏÏÏÏÏÏÏÏÏÏÏÏÏÏÏÏÏÏÏÏÏÏÏÏÏÏÏÏÏÏÏÏÏÏÏÏÏÏÏÏÏÏÏÏÏÏÏÏÏÏÏÏÏÏÏÏÏÏÏÏÏÏÏÏÏÏÏÏÏ $ .89 $ 1.51 $ 1.25
Diluted earnings per share ÏÏÏÏÏÏÏÏÏÏÏÏÏÏÏÏÏÏÏÏÏÏÏÏÏÏÏÏÏÏÏÏÏÏÏÏÏÏÏÏÏÏÏÏÏÏÏÏÏÏÏÏÏÏÏÏÏÏÏÏÏÏ $ .88 $ 1.50 $ 1.23
Average common shares ÏÏÏÏÏÏÏÏÏÏÏÏÏÏÏÏÏÏÏÏÏÏÏÏÏÏÏÏÏÏÏÏÏÏÏÏÏÏÏÏÏÏÏÏÏÏÏÏÏÏÏÏÏÏÏÏÏÏÏÏÏÏÏ 1,927.9 1,906.0 1,907.8
Average diluted common sharesÏÏÏÏÏÏÏÏÏÏÏÏÏÏÏÏÏÏÏÏÏÏÏÏÏÏÏÏÏÏÏÏÏÏÏÏÏÏÏÏÏÏÏÏÏÏÏÏÏÏÏÏÏÏÏÏÏ 1,939.5 1,918.5 1,930.0
See Notes to Consolidated Financial Statements.
U.S. Bancorp50

Consolidated Statement of Shareholders' Equity
Common Other TotalShares Common Capital Retained Treasury Comprehensive Shareholders'
(Dollars in Millions) Outstanding Stock Surplus Earnings Stock Income Equity
Balance December 31, 1998 ÏÏÏÏÏÏÏÏÏÏÏ 1,903,461,698 $19.3 $4,338.7 $ 8,758.4 $ (755.4) $ 212.9 $12,573.9
Net incomeÏÏÏÏÏÏÏÏÏÏÏÏÏÏÏÏÏÏÏÏÏÏÏÏÏÏÏÏÏÏÏÏÏÏ 2,381.8 2,381.8
Unrealized loss on securities available for sale ÏÏÏ (743.9) (743.9)
ReclassiÑcation adjustment for losses realized
in net incomeÏÏÏÏÏÏÏÏÏÏÏÏÏÏÏÏÏÏÏÏÏÏÏÏÏÏÏÏÏÏ 163.9 163.9
Income taxesÏÏÏÏÏÏÏÏÏÏÏÏÏÏÏÏÏÏÏÏÏÏÏÏÏÏÏÏÏÏÏÏ 210.5 210.5
Total comprehensive income ÏÏÏÏÏÏÏÏÏÏÏ 2,012.3
Cash dividends declared on common stock ÏÏÏÏ (1,090.8) (1,090.8)
Issuance of common stock and treasury sharesÏÏ 69,705,239 .2 213.8 1,377.0 1,591.0
Purchase of treasury stock ÏÏÏÏÏÏÏÏÏÏÏÏÏÏÏÏÏÏÏ (44,636,116) (1,187.9) (1,187.9)
Retirement of treasury stockÏÏÏÏÏÏÏÏÏÏÏÏÏÏÏÏÏÏ (.1) (343.8) 344.0 .1
Shares reserved to meet deferred
compensation obligationsÏÏÏÏÏÏÏÏÏÏÏÏÏÏÏÏÏÏÏ (21,643) 2.1 (2.0) .1
Amortization of restricted stock ÏÏÏÏÏÏÏÏÏÏÏÏÏÏÏ 47.8 47.8
Balance December 31, 1999 ÏÏÏÏÏÏÏÏÏÏÏ 1,928,509,178 $19.4 $4,258.6 $10,049.4 $ (224.3) $(156.6) $13,946.5
Net incomeÏÏÏÏÏÏÏÏÏÏÏÏÏÏÏÏÏÏÏÏÏÏÏÏÏÏÏÏÏÏÏÏÏÏ 2,875.6 2,875.6
Unrealized gain on securities available for sale ÏÏÏ 436.0 436.0
Foreign currency translation adjustment ÏÏÏÏÏÏÏ (.5) (.5)
ReclassiÑcation adjustment for gains realized in
net income ÏÏÏÏÏÏÏÏÏÏÏÏÏÏÏÏÏÏÏÏÏÏÏÏÏÏÏÏÏÏÏÏ (41.6) (41.6)
Income taxesÏÏÏÏÏÏÏÏÏÏÏÏÏÏÏÏÏÏÏÏÏÏÏÏÏÏÏÏÏÏÏÏ (141.8) (141.8)
Total comprehensive income ÏÏÏÏÏÏÏÏÏÏÏ 3,127.7
Cash dividends declared on common stock ÏÏÏÏ (1,267.0) (1,267.0)
Issuance of common stock and treasury sharesÏÏ 32,652,574 (35.0) 534.9 499.9
Purchase of treasury stock ÏÏÏÏÏÏÏÏÏÏÏÏÏÏÏÏÏÏÏ (58,633,923) (1,182.2) (1,182.2)
Shares reserved to meet deferred
compensation obligationsÏÏÏÏÏÏÏÏÏÏÏÏÏÏÏÏÏÏÏ (444,395) 8.5 (8.5) Ì
Amortization of restricted stock ÏÏÏÏÏÏÏÏÏÏÏÏÏÏÏ 43.5 43.5
Balance December 31, 2000 ÏÏÏÏÏÏÏÏÏÏÏ 1,902,083,434 $19.4 $4,275.6 $11,658.0 $ (880.1) $ 95.5 $15,168.4
Net incomeÏÏÏÏÏÏÏÏÏÏÏÏÏÏÏÏÏÏÏÏÏÏÏÏÏÏÏÏÏÏÏÏÏÏ 1,706.5 1,706.5
Unrealized gain on securities available for sale ÏÏÏ 194.5 194.5
Unrealized gain on derivatives ÏÏÏÏÏÏÏÏÏÏÏÏÏÏÏÏ 106.0 106.0
Foreign currency translation adjustment ÏÏÏÏÏÏÏ (4.0) (4.0)
Realized gain on derivatives ÏÏÏÏÏÏÏÏÏÏÏÏÏÏÏÏÏÏ 42.4 42.4
ReclassiÑcation adjustment for gains realized in
net income ÏÏÏÏÏÏÏÏÏÏÏÏÏÏÏÏÏÏÏÏÏÏÏÏÏÏÏÏÏÏÏÏ (333.1) (333.1)
Income taxesÏÏÏÏÏÏÏÏÏÏÏÏÏÏÏÏÏÏÏÏÏÏÏÏÏÏÏÏÏÏÏÏ (5.9) (5.9)
Total comprehensive income ÏÏÏÏÏÏÏÏÏÏÏ 1,706.4
Cash dividends declared on common stock ÏÏÏÏ (1,446.5) (1,446.5)
Issuance of common stock and treasury sharesÏÏ 69,502,689 .7 1,383.7 49.3 1,433.7
Purchase of treasury stock ÏÏÏÏÏÏÏÏÏÏÏÏÏÏÏÏÏÏÏ (19,743,672) (467.9) (467.9)
Retirement of treasury stockÏÏÏÏÏÏÏÏÏÏÏÏÏÏÏÏÏÏ (.4) (823.2) 823.6 Ì
Shares reserved to meet deferred
compensation obligationsÏÏÏÏÏÏÏÏÏÏÏÏÏÏÏÏÏÏÏ (132,939) 3.0 (3.0) Ì
Amortization of restricted stock ÏÏÏÏÏÏÏÏÏÏÏÏÏÏÏ 67.1 67.1
Balance December 31, 2001 ÏÏÏÏÏÏÏÏÏÏÏ 1,951,709,512 $19.7 $4,906.2 $11,918.0 $ (478.1) $ 95.4 $16,461.2
See Notes to Consolidated Financial Statements.
U.S. Bancorp 51

Consolidated Statement of Cash Flows
Year Ended December 31 (Dollars in Millions) 2001 2000 1999
Operating Activities
Net income ÏÏÏÏÏÏÏÏÏÏÏÏÏÏÏÏÏÏÏÏÏÏÏÏÏÏÏÏÏÏÏÏÏÏÏÏÏÏÏÏÏÏÏÏÏÏÏÏÏÏÏÏÏÏÏÏÏÏÏÏÏÏÏÏÏÏÏÏÏÏÏÏÏÏÏ $ 1,706.5 $ 2,875.6 $ 2,381.8
Adjustments to reconcile net income to net cash provided by operating activities
Provision for credit losses ÏÏÏÏÏÏÏÏÏÏÏÏÏÏÏÏÏÏÏÏÏÏÏÏÏÏÏÏÏÏÏÏÏÏÏÏÏÏÏÏÏÏÏÏÏÏÏÏÏÏÏÏÏÏÏÏÏÏ 2,528.8 828.0 646.0
Depreciation and amortization of premises and equipment ÏÏÏÏÏÏÏÏÏÏÏÏÏÏÏÏÏÏÏÏÏÏÏÏÏÏÏÏ 284.0 262.6 270.6
Amortization of goodwill and other intangiblesÏÏÏÏÏÏÏÏÏÏÏÏÏÏÏÏÏÏÏÏÏÏÏÏÏÏÏÏÏÏÏÏÏÏÏÏÏÏÏÏ 529.5 392.3 329.8
Provision for deferred income taxes ÏÏÏÏÏÏÏÏÏÏÏÏÏÏÏÏÏÏÏÏÏÏÏÏÏÏÏÏÏÏÏÏÏÏÏÏÏÏÏÏÏÏÏÏÏÏÏÏÏ (184.0) 357.1 252.9
Net (increase) decrease in trading securities ÏÏÏÏÏÏÏÏÏÏÏÏÏÏÏÏÏÏÏÏÏÏÏÏÏÏÏÏÏÏÏÏÏÏÏÏÏÏÏÏ (229.1) (135.6) 65.6
(Gain) loss on sale of securities and other assets, net ÏÏÏÏÏÏÏÏÏÏÏÏÏÏÏÏÏÏÏÏÏÏÏÏÏÏÏÏÏÏÏ (428.7) (47.3) 149.9
Mortgage loans originated for sale in the secondary market ÏÏÏÏÏÏÏÏÏÏÏÏÏÏÏÏÏÏÏÏÏÏÏÏÏÏÏ (15,500.2) (5,563.3) (6,117.1)
Proceeds from sales of mortgage loans ÏÏÏÏÏÏÏÏÏÏÏÏÏÏÏÏÏÏÏÏÏÏÏÏÏÏÏÏÏÏÏÏÏÏÏÏÏÏÏÏÏÏÏÏÏ 13,483.0 5,475.0 7,229.3
Other assets and liabilities, netÏÏÏÏÏÏÏÏÏÏÏÏÏÏÏÏÏÏÏÏÏÏÏÏÏÏÏÏÏÏÏÏÏÏÏÏÏÏÏÏÏÏÏÏÏÏÏÏÏÏÏÏÏÏ (7.9) (1.8) (242.2)
Net cash provided by operating activities ÏÏÏÏÏÏÏÏÏÏÏÏÏÏÏÏÏÏÏÏÏÏÏÏÏÏÏÏÏÏÏÏÏÏÏÏÏÏÏÏÏ 2,181.9 4,442.6 4,966.6
Investing Activities
Securities
Sales ÏÏÏÏÏÏÏÏÏÏÏÏÏÏÏÏÏÏÏÏÏÏÏÏÏÏÏÏÏÏÏÏÏÏÏÏÏÏÏÏÏÏÏÏÏÏÏÏÏÏÏÏÏÏÏÏÏÏÏÏÏÏÏÏÏÏÏÏÏÏÏÏÏÏÏÏÏ 19,240.2 10,194.0 6,819.7
Maturities ÏÏÏÏÏÏÏÏÏÏÏÏÏÏÏÏÏÏÏÏÏÏÏÏÏÏÏÏÏÏÏÏÏÏÏÏÏÏÏÏÏÏÏÏÏÏÏÏÏÏÏÏÏÏÏÏÏÏÏÏÏÏÏÏÏÏÏÏÏÏÏÏÏ 4,572.2 2,127.7 5,290.7
Purchases ÏÏÏÏÏÏÏÏÏÏÏÏÏÏÏÏÏÏÏÏÏÏÏÏÏÏÏÏÏÏÏÏÏÏÏÏÏÏÏÏÏÏÏÏÏÏÏÏÏÏÏÏÏÏÏÏÏÏÏÏÏÏÏÏÏÏÏÏÏÏÏÏ (32,278.6) (12,161.3) (9,135.8)
Loans
Sales and securitization ÏÏÏÏÏÏÏÏÏÏÏÏÏÏÏÏÏÏÏÏÏÏÏÏÏÏÏÏÏÏÏÏÏÏÏÏÏÏÏÏÏÏÏÏÏÏÏÏÏÏÏÏÏÏÏÏÏÏÏÏ 7,387.9 6,655.8 5,013.7
Purchases ÏÏÏÏÏÏÏÏÏÏÏÏÏÏÏÏÏÏÏÏÏÏÏÏÏÏÏÏÏÏÏÏÏÏÏÏÏÏÏÏÏÏÏÏÏÏÏÏÏÏÏÏÏÏÏÏÏÏÏÏÏÏÏÏÏÏÏÏÏÏÏÏ (87.5) (688.4) (254.6)
Net increase in loans outstanding ÏÏÏÏÏÏÏÏÏÏÏÏÏÏÏÏÏÏÏÏÏÏÏÏÏÏÏÏÏÏÏÏÏÏÏÏÏÏÏÏÏÏÏÏÏÏÏÏÏÏÏÏÏÏ (1,126.5) (13,511.0) (9,880.0)
Proceeds from sales of premises and equipment ÏÏÏÏÏÏÏÏÏÏÏÏÏÏÏÏÏÏÏÏÏÏÏÏÏÏÏÏÏÏÏÏÏÏÏÏÏÏÏÏ 166.3 212.9 64.2
Purchases of premises and equipmentÏÏÏÏÏÏÏÏÏÏÏÏÏÏÏÏÏÏÏÏÏÏÏÏÏÏÏÏÏÏÏÏÏÏÏÏÏÏÏÏÏÏÏÏÏÏÏÏÏÏ (299.2) (382.8) (289.0)
Acquisitions, net of cash acquired ÏÏÏÏÏÏÏÏÏÏÏÏÏÏÏÏÏÏÏÏÏÏÏÏÏÏÏÏÏÏÏÏÏÏÏÏÏÏÏÏÏÏÏÏÏÏÏÏÏÏÏÏÏÏ (741.4) 904.4 241.9
Divestitures of branches ÏÏÏÏÏÏÏÏÏÏÏÏÏÏÏÏÏÏÏÏÏÏÏÏÏÏÏÏÏÏÏÏÏÏÏÏÏÏÏÏÏÏÏÏÏÏÏÏÏÏÏÏÏÏÏÏÏÏÏÏÏÏÏ (340.0) (78.2) (469.0)
Other, net ÏÏÏÏÏÏÏÏÏÏÏÏÏÏÏÏÏÏÏÏÏÏÏÏÏÏÏÏÏÏÏÏÏÏÏÏÏÏÏÏÏÏÏÏÏÏÏÏÏÏÏÏÏÏÏÏÏÏÏÏÏÏÏÏÏÏÏÏÏÏÏÏÏÏÏÏ (143.9) (289.1) (961.3)
Net cash used in investing activitiesÏÏÏÏÏÏÏÏÏÏÏÏÏÏÏÏÏÏÏÏÏÏÏÏÏÏÏÏÏÏÏÏÏÏÏÏÏÏÏÏÏÏÏÏÏÏ (3,650.5) (7,016.0) (3,559.5)
Financing Activities
Net change in
Deposits ÏÏÏÏÏÏÏÏÏÏÏÏÏÏÏÏÏÏÏÏÏÏÏÏÏÏÏÏÏÏÏÏÏÏÏÏÏÏÏÏÏÏÏÏÏÏÏÏÏÏÏÏÏÏÏÏÏÏÏÏÏÏÏÏÏÏÏÏÏÏÏÏÏÏ (4,258.1) 3,403.7 (3,034.9)
Short-term borrowings ÏÏÏÏÏÏÏÏÏÏÏÏÏÏÏÏÏÏÏÏÏÏÏÏÏÏÏÏÏÏÏÏÏÏÏÏÏÏÏÏÏÏÏÏÏÏÏÏÏÏÏÏÏÏÏÏÏÏÏÏÏ 5,244.3 702.1 544.9
Principal payments on long-term debt ÏÏÏÏÏÏÏÏÏÏÏÏÏÏÏÏÏÏÏÏÏÏÏÏÏÏÏÏÏÏÏÏÏÏÏÏÏÏÏÏÏÏÏÏÏÏÏÏÏÏ (10,539.6) (5,277.5) (5,706.1)
Proceeds from long-term debt issuanceÏÏÏÏÏÏÏÏÏÏÏÏÏÏÏÏÏÏÏÏÏÏÏÏÏÏÏÏÏÏÏÏÏÏÏÏÏÏÏÏÏÏÏÏÏÏÏÏÏ 11,702.3 5,862.7 8,067.5
Proceeds from issuance of Company-obligated mandatorily redeemable preferred securities
of subsidiary trusts holding solely the junior subordinated debentures of the parent
company ÏÏÏÏÏÏÏÏÏÏÏÏÏÏÏÏÏÏÏÏÏÏÏÏÏÏÏÏÏÏÏÏÏÏÏÏÏÏÏÏÏÏÏÏÏÏÏÏÏÏÏÏÏÏÏÏÏÏÏÏÏÏÏÏÏÏÏÏÏÏÏÏÏÏÏ 1,500.0 Ì Ì
Proceeds from issuance of common stock ÏÏÏÏÏÏÏÏÏÏÏÏÏÏÏÏÏÏÏÏÏÏÏÏÏÏÏÏÏÏÏÏÏÏÏÏÏÏÏÏÏÏÏÏÏÏ 136.4 210.0 275.5
Repurchase of common stock ÏÏÏÏÏÏÏÏÏÏÏÏÏÏÏÏÏÏÏÏÏÏÏÏÏÏÏÏÏÏÏÏÏÏÏÏÏÏÏÏÏÏÏÏÏÏÏÏÏÏÏÏÏÏÏÏÏ (467.9) (1,182.2) (1,187.9)
Cash dividends paidÏÏÏÏÏÏÏÏÏÏÏÏÏÏÏÏÏÏÏÏÏÏÏÏÏÏÏÏÏÏÏÏÏÏÏÏÏÏÏÏÏÏÏÏÏÏÏÏÏÏÏÏÏÏÏÏÏÏÏÏÏÏÏÏÏÏÏ (1,235.1) (1,271.3) (1,029.7)
Net cash provided by (used in) Ñnancing activitiesÏÏÏÏÏÏÏÏÏÏÏÏÏÏÏÏÏÏÏÏÏÏÏÏÏÏÏÏÏÏÏÏ 2,082.3 2,447.5 (2,070.7)
Change in cash and cash equivalents ÏÏÏÏÏÏÏÏÏÏÏÏÏÏÏÏÏÏÏÏÏÏÏÏÏÏÏÏÏÏÏÏÏÏÏÏÏÏÏÏÏÏÏÏ 613.7 (125.9) (663.6)
Cash and cash equivalents at beginning of year ÏÏÏÏÏÏÏÏÏÏÏÏÏÏÏÏÏÏÏÏÏÏÏÏÏÏÏÏÏÏÏÏÏÏÏÏÏÏÏÏÏ 9,131.6 9,257.5 9,921.1
Cash and cash equivalents at end of year ÏÏÏÏÏÏÏÏÏÏÏÏÏÏÏÏÏÏÏÏÏÏÏÏÏÏÏÏÏÏÏÏÏÏÏÏÏÏÏÏ $ 9,745.3 $ 9,131.6 $ 9,257.5
See Notes to Consolidated Financial Statements.
U.S. Bancorp52
Notes to Consolidated Financial Statements
Institutional Trust and Custody and Fund Services. TheSigniÑcant Accounting Policiesbusiness segment also oÅers investment management
U.S. Bancorp and its subsidiaries (the ""Company'') services to several client segments including mutual funds,compose the organization created by the acquisition by institutional customers, and private asset management.Firstar Corporation (""Firstar'') of the former U.S. Bancorp Payment Services includes consumer and business credit(""USBM''). The new Company retained the U.S. Bancorp cards, corporate and purchasing card services, consumername. The Company is a multi-state Ñnancial services lines of credit, ATM processing and merchant processing.holding company headquartered in Minneapolis, Minnesota. Capital Markets engages in equity and Ñxed incomeThe Company provides a full range of Ñnancial services trading activities, oÅers investment banking andincluding lending and depository services through banking underwriting services for corporate and public sectoroÇces principally in 24 states. The Company also engages in customers and provides Ñnancial advisory services andcredit card, merchant, and ATM processing, mortgage securities, mutual funds, annuities and insurance products tobanking, insurance, trust and investment management, consumers and regionally based businesses through abrokerage, leasing and investment banking activities network of brokerage oÇces.principally in domestic markets. Treasury and Corporate Support includes the
Company's investment and residential mortgage portfolios,Basis of Presentation The consolidated Ñnancialfunding, capital management and asset securitizationstatements include the accounts of the Company and itsactivities, interest rate risk management, the net eÅect ofsubsidiaries. The consolidation eliminates all signiÑcanttransfer pricing related to loan and deposit balances, andintercompany accounts and transactions. Certain items inthe change in residual allocations associated with theprior periods have been reclassiÑed to conform to theprovision for loan losses. It also includes business activitiescurrent presentation.managed on a corporate basis, including income and
Uses of Estimates The preparation of Ñnancial statements expense of enterprise-wide operations and administrativein conformity with generally accepted accounting principles support functions.requires management to make estimates and assumptions
Segment Results Accounting policies for the lines ofthat aÅect the amounts reported in the Ñnancial statementsbusiness are the same as those used in preparation of theand accompanying notes. Actual experience could diÅerconsolidated Ñnancial statements with respect to activitiesfrom those estimates.speciÑcally attributable to each business line. However, the
BUSINESS SEGMENTS preparation of business line results requires management to
establish methodologies to allocate funding costs andWithin the Company, Ñnancial performance is measured bybeneÑts, expenses and other Ñnancial elements to each linemajor lines of business based on the products and servicesof business. For details of these methodologies and segmentprovided to customers through its distribution channels.results, see ""Basis for Financial Presentation'' on page 43The Company has six reportable operating segments:and Table 21 ""Line of Business Financial Performance''Wholesale Banking oÅers lending, depository, treasuryincluded in Management's Discussion and Analysis which ismanagement and other Ñnancial services to middle market,incorporated by reference into these Notes to Consolidatedlarge corporate and public sector clients.Financial Statements.Consumer Banking delivers products and services to the
broad consumer market and small businesses through SECURITIESbanking oÇces, telemarketing, on-line services, direct mail
Trading Account Securities Debt and equity securitiesand automated teller machines (""ATMs''). It encompassesheld for resale are classiÑed as trading account securitiescommunity banking, metropolitan banking, small businessand reported at fair value. Realized and unrealized gains orbanking, consumer lending, mortgage banking, andlosses are determined on a trade date basis and reported ininvestment product sales.noninterest income.Private Client, Trust and Asset Management provides
mutual fund processing services, trust, private banking and Available-for-sale Securities These securities are notÑnancial advisory services through four businesses including: trading account securities but may be sold before maturitythe Private Client Group, Corporate Trust Services, in response to changes in the Company's interest rate risk
U.S. Bancorp
Note 1
53

proÑle or demand for collateralized deposits by public charged oÅ at 120 days past due and are, therefore, not
entities. Available-for-sale securities are carried at fair value placed on nonaccrual status.
with unrealized net gains or losses reported within otherImpaired Loans A loan is considered to be impaired
comprehensive income in shareholders' equity. When sold,when, based on current information and events, it is
the amortized cost of the speciÑc securities is used toprobable that the Company will be unable to collect all
compute the gain or loss.amounts due (both interest and principal) according to the
Held-to-maturity Securities Debt securities for which the contractual terms of the loan agreement.
Company has the positive intent and ability to hold toLeases The Company engages in both direct and leveraged
maturity are reported at historical cost adjusted forlease Ñnancing. The net investment in direct Ñnancing leases
amortization of premiums and accretion of discounts.is the sum of all minimum lease payments and estimated
LOANS residual values, less unearned income. Unearned income is
added to interest income over the terms of the leases toLoans are reported net of unearned income. Interest income
produce a level yield.is accrued on the unpaid principal balances as earned. Loan
The investment in leveraged leases is the sum of alland commitment fees are deferred and recognized over the
lease payments (less nonrecourse debt payments) pluslife of the loan and/or commitment period as yield
estimated residual values, less unearned income. Incomeadjustments.
from leveraged leases is recognized over the term of the
leases based on the unrecovered equity investment.Allowance for Credit Losses Management determines the
adequacy of the allowance for credit losses based onLoans Held for Sale Loans held for sale (""LHFS'')
evaluations of the loan portfolio, recent loss experience,represent mortgage loan originations intended to be sold in
and other pertinent factors, including economic conditions.the secondary market and other loans that management has
This evaluation is inherently subjective as it requiresan active plan to sell. LHFS are carried at the lower of cost
estimates, including amounts of future cash collectionsor market value as determined on an aggregate basis by type
expected on nonaccrual loans, that may be susceptible toof loan. In the event management decides to sell loans
signiÑcant change. The allowance for credit losses relatingreceivable, the loans are transferred at the lower of cost or
to impaired loans is based on the loan's observable marketfair value. Any credit-related loss at the time of transfer is
price, the collateral for certain collateral-dependent loans,recorded as a reduction in the allowance for credit losses.
or the discounted cash Öows using the loan's eÅectiveSubsequent decreases in fair value are recognized in
interest rate.noninterest income.
The Company determines the amount of the allowance
required for certain sectors based on relative risk Other Real Estate Other real estate (""ORE''), which is
characteristics of the loan portfolio. The allowance included in other assets, is property acquired through
recorded for commercial loans is based on quarterly reviews foreclosure or other proceedings. ORE is carried at the
of individual credit relationships and an analysis of the lower of cost or fair value, less estimated selling costs. The
migration of commercial loans and actual loss experience. property is evaluated regularly and any decreases in the
The allowance recorded for homogeneous consumer loans carrying amount are included in noninterest expense.
is based on an analysis of product mix, risk characteristicsDERIVATIVE FINANCIAL INSTRUMENTS
of the portfolio, fraud loss and bankruptcy experiences, and
historical losses, adjusted for current trends, for each In the ordinary course of business, the Company enters into
homogenous category or group of loans. The allowance is derivative transactions to manage its market and
increased through provisions charged to operating earnings prepayment risks and to accommodate the business
and reduced by net charge-oÅs. requirements of its customers. All derivative instruments are
recorded as either assets or liabilities at fair value.Nonaccrual Loans Generally commercial loans (including
Subsequent changes in a derivative's fair value areimpaired loans) are placed on nonaccrual status when the
recognized currently in earnings unless speciÑc hedgecollection of interest or principal has become 90 days past
accounting criteria are met.due or is otherwise considered doubtful. When a loan is
All derivative instruments that qualify for speciÑc hedgeplaced on nonaccrual status, unpaid interest is reversed.
accounting are recorded at fair value and classiÑed either asFuture interest payments are generally applied against
a hedge of the fair value of a recognized asset or liabilityprincipal. Revolving consumer lines and credit cards are
(""fair value'' hedge) or as a hedge of the variability of cashcharged oÅ by 180 days past due and closed-end consumer
Öows to be received or paid related to a recognized asset orloans other than loans secured by 1-4 family properties are
liability or a forecasted transaction (""cash Öow'' hedge).
U.S. Bancorp54
Changes in the fair value of a derivative that is highly discounted cash Öow methodology, utilizing current
eÅective and designated as a fair value hedge and the prepayment speeds and discount rates. Impairment is
oÅsetting changes in the fair value of the hedged item are recognized through a valuation allowance for each impaired
recorded in income. Changes in the fair value of a stratum and recorded as amortization of intangible assets.
derivative that is highly eÅective and designated as a cashIntangible Assets For all purchase acquisitions completed
Öow hedge are recognized in other comprehensive incomeprior to July 1, 2001, the price paid over the net fair value
until income from the cash Öows of the hedged item areof the acquired businesses (""goodwill'') is amortized over
recognized. The Company performs an assessment, both atperiods ranging up to 25 years. For purchase acquisitions
the inception of the hedge and on a quarterly basiscompleted subsequent to June 30, 2001, goodwill is not
thereafter, to determine whether these derivatives are highlyamortized. Other intangible assets are amortized over their
eÅective in oÅsetting changes in the value of the hedgedestimated useful lives, which range from seven to Ñfteen
items. Any change in fair value resulting from hedgeyears, using straight-line and accelerated methods. The
ineÅectiveness is immediately recorded in noninterestrecoverability of goodwill and other intangible assets is
income.evaluated if events or circumstances indicate a possible
If a derivative designated as a hedge is terminated orinability to realize the carrying amount. The evaluation
ceases to be highly eÅective, the gain or loss is amortized toincludes assessing the estimated fair value of the intangible
earnings over the remaining life of the hedged asset orasset based on market prices for similar assets, where
liability (fair value hedge) or over the same period(s) thatavailable, and the present value of the estimated future cash
the forecasted hedged transactions impact earnings (cashÖows associated with the intangible asset.
Öow hedge). If the hedged item is disposed of, or the
forecasted transaction is no longer probable, the derivative Income Taxes Deferred taxes are recorded to reÖect the
is recorded at fair value with any resulting gain or loss tax consequences on future years of diÅerences between the
included in the gain or loss from the disposition of the tax bases of assets and liabilities and the Ñnancial reporting
hedged item or, in the case of a forecasted transaction that amounts at each year-end.
is no longer probable, included in earnings immediately.Statement of Cash Flows For purposes of reporting cash
OTHER SIGNIFICANT POLICIES Öows, cash and cash equivalents include cash and money
market investments, deÑned as interest-bearing amounts duePremises and Equipment Premises and equipment are
from banks, federal funds sold and securities purchasedstated at cost less accumulated depreciation and depreciated
under agreements to resell.primarily on a straight-line basis over the estimated life of
the assets. Stock-based Compensation The Company grants stock
Capital leases, less accumulated amortization, are options for a Ñxed number of shares to employees and
included in premises and equipment. The lease obligations directors with an exercise price equal to the fair value of
are included in long-term debt. Capitalized leases are the shares at the date of grant. The Company accounts for
amortized on a straight-line basis over the lease term and stock option grants in accordance with Accounting
the amortization is included in depreciation expense. Principles Board Opinion No. 25, ""Accounting for Stock
Issued to Employees,'' (""APB 25'') and accordinglyMortgage Servicing Rights Mortgage servicing rights
recognizes no compensation expense for the stock optionassociated with loans originated and sold, where servicing is
grants.retained, are capitalized and included in other intangible
assets in the consolidated balance sheet. The value of these Per Share Calculations Earnings per share is calculated by
capitalized servicing rights is amortized in proportion to, dividing net income (less preferred stock dividends) by the
and over the period of, estimated net servicing revenue and weighted average number of common shares outstanding
recorded in noninterest expense as amortization of during the year. Diluted earnings per share is calculated by
intangible assets. The carrying value of these rights is adjusting income and outstanding shares, assuming
periodically reviewed for impairment based on fair value. conversion of all potentially dilutive securities, using the
For purposes of measuring impairment, the servicing rights treasury stock method. All per share amounts have been
are stratiÑed based on the underlying loan type and note restated for stock splits.
rate and compared to a valuation prepared based on a
U.S. Bancorp 55

and intangible assets subsequent to their acquisition. TheAccounting ChangesCompany is required to adopt SFAS 142 on January 1,
Accounting for Derivative Instruments and Hedging 2002. The most signiÑcant changes made by SFAS 142 areActivities Statement of Financial Accounting Standards that goodwill and indeÑnite lived intangible assets will noNo. 133 (""SFAS 133''), ""Accounting for Derivative longer be amortized and will be tested for impairment atInstruments and Hedging Activities,'' as amended, least annually, thereafter. Any impairment charges from theestablishes accounting and reporting standards for all initial impairment test at the date of adoption would bederivative instruments and criteria for designation and recognized as a ""cumulative eÅect of change in accountingeÅectiveness of hedging activities. SFAS 133 requires that an principles'' in the income statement. The amortizationentity recognize all derivatives as either assets or liabilities provisions of SFAS 142 apply to goodwill and intangibleon the balance sheet and measure those instruments at fair assets acquired after June 30, 2001. With respect tovalue. The changes in the fair value of the derivatives are goodwill and intangible assets acquired prior to July 1,recognized currently in earnings unless speciÑc hedge 2001, the amortization provisions of SFAS 142 are eÅectiveaccounting criteria are met. If the derivative qualiÑes as a upon adoption of SFAS 142.hedge, the accounting treatment varies based on the type of The Company will apply the amortization provisions ofrisk being hedged. On January 1, 2001, the Company SFAS 142 during the Ñrst quarter of 2002. Managementadopted SFAS 133. Transition adjustments related to anticipates that applying the provisions of SFAS 141 toadoption resulted in an after-tax loss of approximately recent acquisitions and the provisions of SFAS 142 to$4.1 million recorded in net income and an after-tax purchase acquisitions completed prior to July 1, 2001, willincrease of $5.2 million recorded in other comprehensive increase after-tax income for the year ending December 31,income. The transition adjustments related to adoption 2002, by approximately $200 to $210 million, or $.10 perwere not material to the Company's Ñnancial statements, diluted share. This considers the application of SFAS 142'sand as such, were not separately reported in the deÑnition of a business and the impact of reclassifyingconsolidated statement of income. certain assets from goodwill to intangibles and changes in
estimated useful lives of certain intangible assets. TheAccounting for Business Combinations and GoodwillCompany has not yet fully determined the impact onand Other Intangible Assets In June 2001, the Financialearnings of impairments related to goodwill and indeÑniteAccounting Standards Board issued Statement of Financiallived intangible assets under the new guidelines required byAccounting Standards No. 141 (""SFAS 141''), ""BusinessSFAS 142. Any material impairment charge resulting fromCombinations'' and Statement of Financial Accountingthese transitional accounting rules will be reÖected as aStandard No. 142 (""SFAS 142''), ""Goodwill and Other""cumulative eÅect of a change in accounting principles'' inIntangible Assets.'' SFAS 141 mandates the purchasethe Ñrst quarter of 2002. Because banking regulationsmethod of accounting be used for all business combinationsexclude 100 percent of goodwill from the determination ofinitiated after June 30, 2001, and establishes speciÑc criteriacapital adequacy, the impact of any impairment on thefor the recognition of intangible assets separately fromCompany's capital adequacy will not be signiÑcant.goodwill. SFAS 142 addresses the accounting for goodwill
U.S. Bancorp
Note 2
56

On July 24, 2001, the Company acquired NOVABusiness CombinationsCorporation (""NOVA''), a merchant processor, in a stock
On February 27, 2001, Firstar and USBM merged in a and cash transaction valued at approximately $2.1 billion.pooling-of-interests transaction and accordingly all Ñnancial The transaction, representing total assets acquired ofinformation has been restated to include the historical $2.9 billion and total liabilities assumed of $773 million,information of both companies. Each share of Firstar stock was accounted for as a purchase. Included in total assets arewas exchanged for one share of the Company's common merchant contracts and other intangibles of $650 millionstock while each share of USBM stock was exchanged for and the excess of the purchase price over the fair value of1.265 shares of the Company's common stock. The new identiÑable net assets (""goodwill'') of $1.6 billion.Company retained the U.S. Bancorp name. In addition to these mergers, the Company has
On September 20, 1999, Firstar and Mercantile completed several strategic acquisitions to enhance itsBancorporation, Inc., (""Mercantile'') merged in a pooling- presence in certain growth markets and businesses. Theof-interests transaction and accordingly all Ñnancial following table summarizes acquisitions by the Companyinformation has been restated to include the historical and its acquirees completed since January 1, 1999, treatinginformation of both companies. Each share of Mercantile Firstar as the original acquiring company:stock was exchanged for 2.091 shares of Firstar common
stock.Goodwill
and Other Cash Paid/ Accounting(Dollars and Shares in Millions) Date Assets Deposits Intangibles (Received) Shares Issued Method
PaciÑc Century BankÏÏÏÏÏÏÏÏÏÏÏÏÏÏÏÏÏÏ September 2001 $ 570 $ 712 $ 138 $ (40) Ì PurchaseNOVA CorporationÏÏÏÏÏÏÏÏÏÏÏÏÏÏÏÏÏÏÏÏ July 2001 949 Ì 1,932 842 56.9 PurchaseU.S. BancorpÏÏÏÏÏÏÏÏÏÏÏÏÏÏÏÏÏÏÏÏÏÏÏÏÏ February 2001 86,602 51,335 Ì Ì 952.4 PoolingFirst Union branchesÏÏÏÏÏÏÏÏÏÏÏÏÏÏÏÏÏÏ December 2000 450 1,779 347 (1,123) Ì PurchaseScripps Financial CorporationÏÏÏÏÏÏÏÏÏÏ October 2000 650 618 113 Ì 9.4 PurchaseLyon Financial Services, Inc.ÏÏÏÏÏÏÏÏÏÏÏ September 2000 1,289 Ì 124 307 Ì PurchaseOliver-Allen CorporationÏÏÏÏÏÏÏÏÏÏÏÏÏÏÏ April 2000 280 Ì 34 Ì 3.6 PurchasePeninsula BankÏÏÏÏÏÏÏÏÏÏÏÏÏÏÏÏÏÏÏÏÏÏÏ January 2000 491 452 71 Ì 5.1 PurchaseWestern Bancorp ÏÏÏÏÏÏÏÏÏÏÏÏÏÏÏÏÏÏÏÏÏ November 1999 2,508 2,105 773 Ì 35.1 PurchaseMercantile Bancorporation ÏÏÏÏÏÏÏÏÏÏÏÏ September 1999 35,520 24,334 Ì Ì 331.8 PoolingVoyager Fleet Systems, Inc. ÏÏÏÏÏÏÏÏÏÏÏ September 1999 43 Ì 25 27 Ì PurchaseBank of Commerce ÏÏÏÏÏÏÏÏÏÏÏÏÏÏÏÏÏÏÏ July 1999 638 529 269 Ì 11.8 PurchaseMellon Network Services' Electronic
Funds Transfer Processing Unit ÏÏÏÏÏ June 1999 Ì Ì 78 170 Ì PurchaseLibra Investments, Inc. ÏÏÏÏÏÏÏÏÏÏÏÏÏÏÏÏ January 1999 33 Ì 4 Ì 1.3 Purchase
Separate results of operations as originally reported on a On January 18, 2002, the Company announced a
condensed basis of Firstar and USBM, for the period prior deÑnitive agreement to acquire The Leader Mortgage
to the merger, were as follows: Company, LLC (""Leader''), a wholly owned subsidiary of
First DeÑance Financial Corporation, in a cash transaction.Year Ended December 31
Leader specializes in acquiring servicing of loans originated(Dollars in Millions) 2000 1999
for state and local housing authorities. Leader hadNet interest income
$506 million in assets at December 31, 2001. In 2001, itFirstar ÏÏÏÏÏÏÏÏÏÏÏÏÏÏÏÏÏÏÏÏÏÏÏÏ $ 2,699 $ 2,643USBM ÏÏÏÏÏÏÏÏÏÏÏÏÏÏÏÏÏÏÏÏÏÏÏÏ 3,471 3,261 had $2.1 billion in mortgage production and an $8.6 billion
Total ÏÏÏÏÏÏÏÏÏÏÏÏÏÏÏÏÏÏÏÏÏÏ $ 6,170 $ 5,904 servicing portfolio at December 31, 2001. The transaction is
expected to close in the second quarter of 2002.Net incomeFirstar ÏÏÏÏÏÏÏÏÏÏÏÏÏÏÏÏÏÏÏÏÏÏÏÏ $ 1,284 $ 875USBM ÏÏÏÏÏÏÏÏÏÏÏÏÏÏÏÏÏÏÏÏÏÏÏÏ 1,592 1,507
Total ÏÏÏÏÏÏÏÏÏÏÏÏÏÏÏÏÏÏÏÏÏÏ $ 2,876 $ 2,382
Total assets at year endFirstar ÏÏÏÏÏÏÏÏÏÏÏÏÏÏÏÏÏÏÏÏÏÏÏÏ $ 77,585 $ 72,788USBM ÏÏÏÏÏÏÏÏÏÏÏÏÏÏÏÏÏÏÏÏÏÏÏÏ 87,336 81,530
Total ÏÏÏÏÏÏÏÏÏÏÏÏÏÏÏÏÏÏÏÏÏÏ $164,921 $154,318
U.S. Bancorp
Note 3
57

other acquisitions noted below and in Note 3 Ì BusinessMerger and Restructuring-relatedCombinations. In response to signiÑcant changes in theItemssecurities markets during 2001, including increased
The Company recorded in pre-tax earnings merger and volatility, declines in equity valuations and the increasinglyrestructuring-related items of $1,266.4 million, competitive environment for the industry, the Company$348.7 million and $540.3 million in 2001, 2000, and 1999, also incurred a charge to restructure its subsidiary, U.S.respectively. In 2001, merger-related items were primarily Bancorp PiperJaÅray, Inc. (""Piper Restructuring''). Theincurred in connection with the merger of Firstar and components of the merger and restructuring-related itemsUSBM, the NOVA acquisition and the Company's various are shown below:
Piper(Dollars in Millions) USBM NOVA Restructuring Mercantile Firstar(a) Other(b) Total
2001
Severance and employee-relatedÏÏÏÏÏÏÏÏÏÏÏÏÏÏÏÏÏ $ 268.2 $23.3 $28.8 $ 13.2 $ 1.3 $ 3.3 $ 338.1
Systems conversions and integrationÏÏÏÏÏÏÏÏÏÏÏÏÏ 208.1 1.6 Ì 7.3 .7 18.0 235.7
Asset write-downs and lease terminations ÏÏÏÏÏÏÏÏ 130.4 34.7 11.9 (.3) .4 5.6 182.7
Charitable contributions ÏÏÏÏÏÏÏÏÏÏÏÏÏÏÏÏÏÏÏÏÏÏÏÏÏ 76.0 Ì Ì Ì Ì Ì 76.0
Balance sheet restructurings ÏÏÏÏÏÏÏÏÏÏÏÏÏÏÏÏÏÏÏÏ 457.6 Ì Ì Ì Ì Ì 457.6
Branch sale gain ÏÏÏÏÏÏÏÏÏÏÏÏÏÏÏÏÏÏÏÏÏÏÏÏÏÏÏÏÏÏÏ (62.2) Ì Ì Ì Ì Ì (62.2)
Branch consolidationsÏÏÏÏÏÏÏÏÏÏÏÏÏÏÏÏÏÏÏÏÏÏÏÏÏÏÏ 20.0 Ì Ì Ì Ì Ì 20.0
Other merger-related charges ÏÏÏÏÏÏÏÏÏÏÏÏÏÏÏÏÏÏÏ 69.1 24.2 10.0 2.5 .8 1.5 108.1
Total 2001 ÏÏÏÏÏÏÏÏÏÏÏÏÏÏÏÏÏÏÏÏÏÏÏÏÏÏÏÏÏÏÏÏÏÏÏÏÏ $1,167.2 $83.8 $50.7 $ 22.7 $ 3.2 $ 28.4 $1,356.0
Provision for credit losses ÏÏÏÏÏÏÏÏÏÏÏÏÏÏÏÏÏÏÏÏÏÏÏ $ 382.2 $ Ì $ Ì $ Ì $ Ì $ Ì $ 382.2
Noninterest income ÏÏÏÏÏÏÏÏÏÏÏÏÏÏÏÏÏÏÏÏÏÏÏÏÏÏÏÏÏ (62.2) Ì Ì Ì Ì Ì (62.2)
Noninterest expense ÏÏÏÏÏÏÏÏÏÏÏÏÏÏÏÏÏÏÏÏÏÏÏÏÏÏÏÏ 847.2 1.6 50.7 22.7 3.2 21.0 946.4
Merger-related items ÏÏÏÏÏÏÏÏÏÏÏÏÏÏÏÏÏÏÏÏÏÏÏÏ 1,167.2 1.6 50.7 22.7 3.2 21.0 1,266.4
Balance sheet recognition ÏÏÏÏÏÏÏÏÏÏÏÏÏÏÏÏÏÏÏÏÏÏÏ Ì 82.2 Ì Ì Ì 7.4 89.6
Merger-related items Ì 2001 ÏÏÏÏÏÏÏÏÏÏÏÏÏÏÏÏÏÏÏ $1,167.2 $83.8 $50.7 $ 22.7 $ 3.2 $ 28.4 $1,356.0
2000
Severance and employee-relatedÏÏÏÏÏÏÏÏÏÏÏÏÏÏÏÏÏ $ 43.0 $16.3 $ .1 $ 59.4
Systems conversions ÏÏÏÏÏÏÏÏÏÏÏÏÏÏÏÏÏÏÏÏÏÏÏÏÏÏÏ 115.2 19.0 59.3 193.5
Asset write-downs and lease terminations ÏÏÏÏÏÏÏÏ 42.7 4.6 Ì 47.3
Charitable contributions ÏÏÏÏÏÏÏÏÏÏÏÏÏÏÏÏÏÏÏÏÏÏÏÏÏ Ì Ì 2.5 2.5
Other merger-related charges ÏÏÏÏÏÏÏÏÏÏÏÏÏÏÏÏÏÏÏ 26.1 12.7 7.2 46.0
Total 2000 ÏÏÏÏÏÏÏÏÏÏÏÏÏÏÏÏÏÏÏÏÏÏÏÏÏÏÏÏÏÏÏÏÏÏÏÏÏ $227.0 $52.6 $ 69.1 $ 348.7
1999
Severance and employee-relatedÏÏÏÏÏÏÏÏÏÏÏÏÏÏÏÏÏ $131.0 $10.6 $ 8.0 $ 149.6
Systems conversions ÏÏÏÏÏÏÏÏÏÏÏÏÏÏÏÏÏÏÏÏÏÏÏÏÏÏÏ 19.5 78.9 34.1 132.5
Asset write-downs and lease terminations ÏÏÏÏÏÏÏÏ .2 4.4 1.6 6.2
Charitable contributions ÏÏÏÏÏÏÏÏÏÏÏÏÏÏÏÏÏÏÏÏÏÏÏÏÏ 35.0 Ì Ì 35.0
Securities losses to restructure portfolioÏÏÏÏÏÏÏÏÏÏ 177.7 Ì Ì 177.7
Provision for credit losses ÏÏÏÏÏÏÏÏÏÏÏÏÏÏÏÏÏÏÏÏÏÏÏ 7.5 Ì Ì 7.5
Other merger-related charges ÏÏÏÏÏÏÏÏÏÏÏÏÏÏÏÏÏÏÏ 46.1 2.0 (16.3) 31.8
Total 1999 ÏÏÏÏÏÏÏÏÏÏÏÏÏÏÏÏÏÏÏÏÏÏÏÏÏÏÏÏÏÏÏÏÏÏÏÏÏ $417.0 $95.9 $ 27.4 $ 540.3
(a) Represents the 1998 acquisition of the former Firstar Corporation by Star Banc. Star Banc was renamed Firstar Corporation.
(b) In 2001, ""Other'' includes merger and restructuring-related items pertaining to the First Union branch acquisition and the PaciÑc Century Bank acquisition.
The Company determines merger and restructuring- determined based on the Company's existing severance pay
related charges and related accruals based on its integration programs and are paid out over a beneÑt period of up to
strategy and formulated plans. These plans are established two years from the time of termination. The total number
as of the acquisition date and regularly evaluated during the of employees included in severance amounts were
integration process. approximately 2,820 for USBM, 2,400 for Mercantile, 2,000
Severance and employee-related charges include the for Firstar, 160 for NOVA, 300 for the Piper Restructuring
cost of severance, other beneÑts and outplacement costs and 520 for all other acquisitions. Severance and employee-
associated with the termination of employees primarily in related costs are included in the determination of goodwill
branch oÇces and centralized corporate support and data for groups of acquired employees identiÑed at closing to be
processing functions. The severance amounts are severed. Severance and employee-related costs are recorded
U.S. Bancorp
Note 4
58
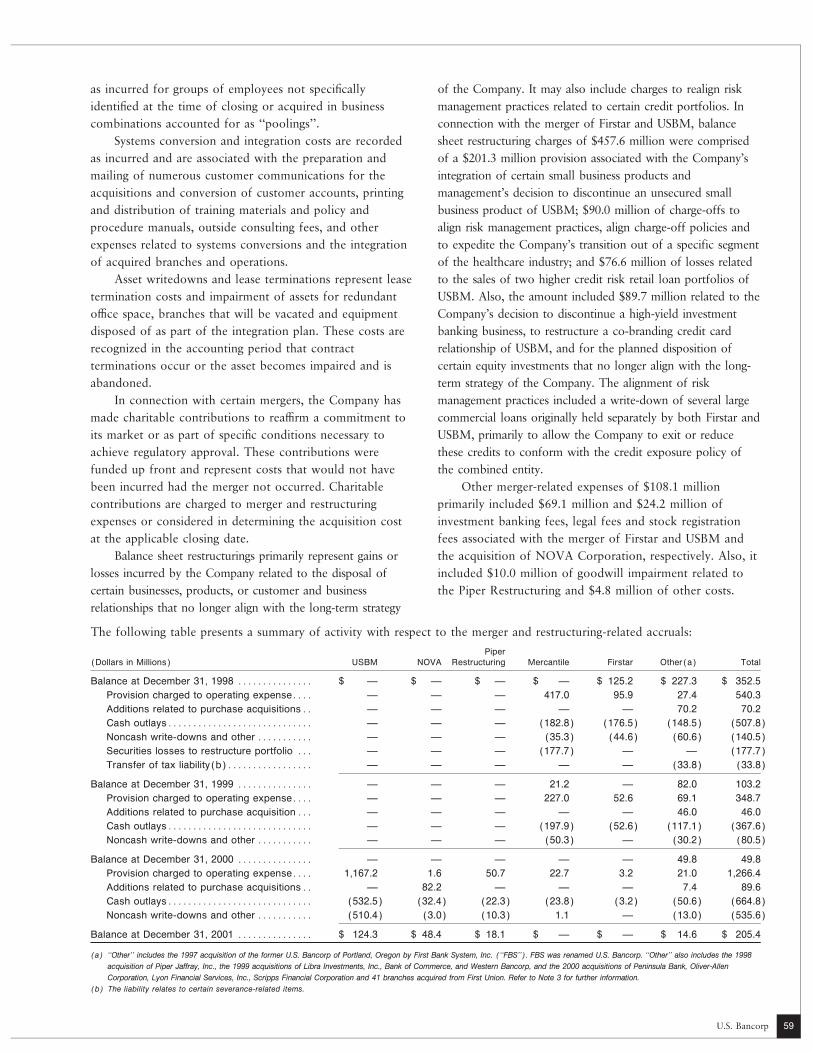
as incurred for groups of employees not speciÑcally of the Company. It may also include charges to realign risk
identiÑed at the time of closing or acquired in business management practices related to certain credit portfolios. In
combinations accounted for as ""poolings''. connection with the merger of Firstar and USBM, balance
Systems conversion and integration costs are recorded sheet restructuring charges of $457.6 million were comprised
as incurred and are associated with the preparation and of a $201.3 million provision associated with the Company's
mailing of numerous customer communications for the integration of certain small business products and
acquisitions and conversion of customer accounts, printing management's decision to discontinue an unsecured small
and distribution of training materials and policy and business product of USBM; $90.0 million of charge-offs to
procedure manuals, outside consulting fees, and other align risk management practices, align charge-off policies and
expenses related to systems conversions and the integration to expedite the Company's transition out of a specific segment
of acquired branches and operations. of the healthcare industry; and $76.6 million of losses related
Asset writedowns and lease terminations represent lease to the sales of two higher credit risk retail loan portfolios of
termination costs and impairment of assets for redundant USBM. Also, the amount included $89.7 million related to the
oÇce space, branches that will be vacated and equipment Company's decision to discontinue a high-yield investment
disposed of as part of the integration plan. These costs are banking business, to restructure a co-branding credit card
recognized in the accounting period that contract relationship of USBM, and for the planned disposition of
terminations occur or the asset becomes impaired and is certain equity investments that no longer align with the long-
abandoned. term strategy of the Company. The alignment of risk
In connection with certain mergers, the Company has management practices included a write-down of several large
made charitable contributions to reaÇrm a commitment to commercial loans originally held separately by both Firstar and
its market or as part of speciÑc conditions necessary to USBM, primarily to allow the Company to exit or reduce
achieve regulatory approval. These contributions were these credits to conform with the credit exposure policy of
funded up front and represent costs that would not have the combined entity.
been incurred had the merger not occurred. Charitable Other merger-related expenses of $108.1 million
contributions are charged to merger and restructuring primarily included $69.1 million and $24.2 million of
expenses or considered in determining the acquisition cost investment banking fees, legal fees and stock registration
at the applicable closing date. fees associated with the merger of Firstar and USBM and
Balance sheet restructurings primarily represent gains or the acquisition of NOVA Corporation, respectively. Also, it
losses incurred by the Company related to the disposal of included $10.0 million of goodwill impairment related to
certain businesses, products, or customer and business the Piper Restructuring and $4.8 million of other costs.
relationships that no longer align with the long-term strategy
The following table presents a summary of activity with respect to the merger and restructuring-related accruals:
Piper(Dollars in Millions) USBM NOVA Restructuring Mercantile Firstar Other(a) Total
Balance at December 31, 1998 ÏÏÏÏÏÏÏÏÏÏÏÏÏÏÏ $ Ì $ Ì $ Ì $ Ì $ 125.2 $ 227.3 $ 352.5
Provision charged to operating expenseÏÏÏÏ Ì Ì Ì 417.0 95.9 27.4 540.3
Additions related to purchase acquisitionsÏÏ Ì Ì Ì Ì Ì 70.2 70.2
Cash outlaysÏÏÏÏÏÏÏÏÏÏÏÏÏÏÏÏÏÏÏÏÏÏÏÏÏÏÏÏÏ Ì Ì Ì (182.8) (176.5) (148.5) (507.8)
Noncash write-downs and other ÏÏÏÏÏÏÏÏÏÏÏ Ì Ì Ì (35.3) (44.6) (60.6) (140.5)
Securities losses to restructure portfolio ÏÏÏ Ì Ì Ì (177.7) Ì Ì (177.7)
Transfer of tax liability(b)ÏÏÏÏÏÏÏÏÏÏÏÏÏÏÏÏÏ Ì Ì Ì Ì Ì (33.8) (33.8)
Balance at December 31, 1999 ÏÏÏÏÏÏÏÏÏÏÏÏÏÏÏ Ì Ì Ì 21.2 Ì 82.0 103.2
Provision charged to operating expenseÏÏÏÏ Ì Ì Ì 227.0 52.6 69.1 348.7
Additions related to purchase acquisitionÏÏÏ Ì Ì Ì Ì Ì 46.0 46.0
Cash outlaysÏÏÏÏÏÏÏÏÏÏÏÏÏÏÏÏÏÏÏÏÏÏÏÏÏÏÏÏÏ Ì Ì Ì (197.9) (52.6) (117.1) (367.6)
Noncash write-downs and other ÏÏÏÏÏÏÏÏÏÏÏ Ì Ì Ì (50.3) Ì (30.2) (80.5)
Balance at December 31, 2000 ÏÏÏÏÏÏÏÏÏÏÏÏÏÏÏ Ì Ì Ì Ì Ì 49.8 49.8
Provision charged to operating expenseÏÏÏÏ 1,167.2 1.6 50.7 22.7 3.2 21.0 1,266.4
Additions related to purchase acquisitionsÏÏ Ì 82.2 Ì Ì Ì 7.4 89.6
Cash outlaysÏÏÏÏÏÏÏÏÏÏÏÏÏÏÏÏÏÏÏÏÏÏÏÏÏÏÏÏÏ (532.5) (32.4) (22.3) (23.8) (3.2) (50.6) (664.8)
Noncash write-downs and other ÏÏÏÏÏÏÏÏÏÏÏ (510.4) (3.0) (10.3) 1.1 Ì (13.0) (535.6)
Balance at December 31, 2001 ÏÏÏÏÏÏÏÏÏÏÏÏÏÏÏ $ 124.3 $ 48.4 $ 18.1 $ Ì $ Ì $ 14.6 $ 205.4
(a) ""Other'' includes the 1997 acquisition of the former U.S. Bancorp of Portland, Oregon by First Bank System, Inc. (""FBS''). FBS was renamed U.S. Bancorp. ""Other'' also includes the 1998
acquisition of Piper Jaffray, Inc., the 1999 acquisitions of Libra Investments, Inc., Bank of Commerce, and Western Bancorp, and the 2000 acquisitions of Peninsula Bank, Oliver-Allen
Corporation, Lyon Financial Services, Inc., Scripps Financial Corporation and 41 branches acquired from First Union. Refer to Note 3 for further information.
(b) The liability relates to certain severance-related items.
U.S. Bancorp 59

The adequacy of the accrued liabilities is reviewed reÖect a lower utilization of beneÑts by aÅected staÅ,
regularly taking into consideration actual and projected changes in initial assumptions as a result of subsequent
payments. Adjustments are made to increase or decrease mergers and alterations of business plans.
these accruals as needed. Reversals of expenses can
The following table presents a summary of activity with respect to the merger of Firstar and USBM:
Severance Lease Systemsand Cancellation Balance Conversions
Employee- Investment and Related Sheet and(Dollars in Millions) related Banker Fees WriteoÅs Restructurings Integration Other(a) Total
Balance at December 31, 2000 ÏÏÏÏÏÏÏÏÏÏÏÏÏÏ $ Ì $ Ì $ Ì $ Ì $ Ì $ Ì $ Ì
Provision charged to operating expense ÏÏ 268.2 66.2 48.7 457.6 208.1 118.4 1,167.2
Cash outlays ÏÏÏÏÏÏÏÏÏÏÏÏÏÏÏÏÏÏÏÏÏÏÏÏÏÏÏ (175.6) (65.7) (5.2) Ì (208.1) (77.9) (532.5)
Non-cash write-downs and other ÏÏÏÏÏÏÏÏÏ (4.3) .3 (10.4) (455.5) Ì (40.5) (510.4)
Balance at December 31, 2001 ÏÏÏÏÏÏÏÏÏÏÏÏÏÏ $ 88.3 $ .8 $ 33.1 $ 2.1 $ Ì $ Ì $ 124.3
(a) Other accruable merger and restructuring-related items included charitable contributions of $76.0 million, a branch sale gain of ($62.2) million, $20.0 million to consolidate and
rationalize the branch network, capitalized software impairments of $81.7 million, and other charges of $2.9 million.
The components of the merger and restructuring-related In connection with the merger of Firstar and USBM,
accruals for all acquisitions were as follows: management estimates the Company will incur pre-tax
merger-related charges of approximately $271.1 million inDecember 31
(Dollars in Millions) 2001 2000 2002. These are currently estimated to include $14.0 million
in employee-related costs, $170.9 million for conversions ofSeverance ÏÏÏÏÏÏÏÏÏÏÏÏÏÏÏÏÏÏÏÏÏÏÏÏÏÏ $106.3 $13.8
Other employee-related costs ÏÏÏÏÏÏÏÏ 4.7 6.8 systems and consolidation of operations, $57.8 million inLease termination and facility costs ÏÏÏ 64.3 8.4 occupancy and equipment charges (elimination of duplicateContracts and system write-oÅs ÏÏÏÏÏÏ 18.3 7.4 facilities and write-oÅ of equipment) and $28.4 million inOtherÏÏÏÏÏÏÏÏÏÏÏÏÏÏÏÏÏÏÏÏÏÏÏÏÏÏÏÏÏÏÏ 11.8 13.4
other merger-related costs (including legal fees, balanceTotal ÏÏÏÏÏÏÏÏÏÏÏÏÏÏÏÏÏÏÏÏÏÏÏÏÏÏÏÏ $205.4 $49.8 sheet restructuring charges and other costs).
With respect to the NOVA acquisition, the CompanyThe merger and restructuring-related accrual by signiÑcant
expects to incur approximately $68.3 million of merger-acquisition or business restructuring was as follows:
related charges through 2003. The Piper Restructuring wasDecember 31
substantially completed by December 31, 2001. In addition,(Dollars in Millions) 2001 2000
the Company anticipates an additional $15.1 million ofUSBMÏÏÏÏÏÏÏÏÏÏÏÏÏÏÏÏÏÏÏÏÏÏÏÏÏÏÏÏÏÏ $124.3 $ Ì merger-related expenses in 2002 as a result of otherNOVA ÏÏÏÏÏÏÏÏÏÏÏÏÏÏÏÏÏÏÏÏÏÏÏÏÏÏÏÏÏÏ 48.4 Ì
acquisitions.Piper JaÅray Companies, Inc. ÏÏÏÏÏÏÏÏ 20.8 15.0
PaciÑc Century Bank ÏÏÏÏÏÏÏÏÏÏÏÏÏÏÏÏ 3.1 ÌRestrictions on Cash and Due fromLyon Financial Services, Inc. ÏÏÏÏÏÏÏÏÏ 1.0 2.7
BanksWestern BancorpÏÏÏÏÏÏÏÏÏÏÏÏÏÏÏÏÏÏÏÏ Ì 5.1
Scripps Financial Corporation ÏÏÏÏÏÏÏÏ Ì 4.6Bank subsidiaries are required to maintain minimum averageBank of CommerceÏÏÏÏÏÏÏÏÏÏÏÏÏÏÏÏÏÏ Ì 4.1
reserve balances with the Federal Reserve Bank. ThePeninsula Bank ÏÏÏÏÏÏÏÏÏÏÏÏÏÏÏÏÏÏÏÏÏ Ì 3.0
Other acquisitions ÏÏÏÏÏÏÏÏÏÏÏÏÏÏÏÏÏÏÏ 7.8 15.3 amount of those reserve balances was approximately
$916 million at December 31, 2001.Total ÏÏÏÏÏÏÏÏÏÏÏÏÏÏÏÏÏÏÏÏÏÏÏÏÏÏÏÏ $205.4 $49.8
U.S. Bancorp
Note 5
60

Investment SecuritiesThe detail of the amortized cost, gross unrealized holding gains and losses, and fair value of held-to-maturity and available-
for-sale securities at December 31 was as follows:
2001 2000
Gross Gross Gross GrossUnrealized Unrealized Unrealized Unrealized
Amortized Holding Holding Fair Amortized Holding Holding Fair(Dollars in Millions) Cost Gains Losses Value Cost Gains Losses Value
Held-to-maturity
Asset-backed securities ÏÏÏÏÏÏÏÏÏÏÏÏÏÏ $ 28 $ Ì $ Ì $ 28 $ 36 $ Ì $ Ì $ 36
Obligations of state and political
subdivisions ÏÏÏÏÏÏÏÏÏÏÏÏÏÏÏÏÏÏÏÏÏ 271 9 (2) 278 216 5 Ì 221
Total held-to-maturity securitiesÏÏÏÏÏÏÏ $ 299 $ 9 $ (2) $ 306 $ 252 $ 5 $ Ì $ 257
Available-for-sale
U.S. Treasuries and agenciesÏÏÏÏÏÏÏÏÏ $ 439 $ 10 $ Ì $ 449 $ 1,600 $ 27 $ (3) $ 1,624
Asset-backed securities ÏÏÏÏÏÏÏÏÏÏÏÏÏÏ 24,028 114 (114) 24,028 11,800 128 (35) 11,893
Obligations of state and political
subdivisions ÏÏÏÏÏÏÏÏÏÏÏÏÏÏÏÏÏÏÏÏÏ 877 16 (2) 891 2,370 41 (2) 2,409
Other ÏÏÏÏÏÏÏÏÏÏÏÏÏÏÏÏÏÏÏÏÏÏÏÏÏÏÏÏÏÏÏ 950 35 (44) 941 1,472 21 (29) 1,464
Total available-for-sale securities ÏÏ $26,294 $175 $(160) $26,309 $17,242 $217 $(69) $17,390
Securities carried at $18.1 billion at December 31, 2001, and $13.3 billion at December 31, 2000, were pledged to
secure public, private and trust deposits and for other purposes required by law. Securities sold under agreements to
repurchase were collateralized by securities and securities purchased under agreements to resell with an amortized cost of
$3.0 billion and $1.0 billion at December 31, 2001, and 2000, respectively.
The following table provides information as to the amount of gross gains and losses realized through the sales of available-
for-sale investment securities.
(Dollars in Millions) 2001 2000 1999
Gross realized gains ÏÏÏÏÏÏÏÏÏÏÏÏÏÏÏÏÏÏÏÏÏÏÏÏÏÏÏÏÏÏÏÏÏÏÏÏÏÏÏÏÏÏÏÏÏÏÏÏÏÏÏÏÏÏÏÏÏÏÏÏÏÏÏÏÏÏÏÏÏÏ $333.1 $ 23.1 $ 31.1
Gross realized losses(a) ÏÏÏÏÏÏÏÏÏÏÏÏÏÏÏÏÏÏÏÏÏÏÏÏÏÏÏÏÏÏÏÏÏÏÏÏÏÏÏÏÏÏÏÏÏÏÏÏÏÏÏÏÏÏÏÏÏÏÏÏÏÏÏÏÏÏ (4.0) (15.0) (195.6)
Net realized gains (losses) ÏÏÏÏÏÏÏÏÏÏÏÏÏÏÏÏÏÏÏÏÏÏÏÏÏÏÏÏÏÏÏÏÏÏÏÏÏÏÏÏÏÏÏÏÏÏÏÏÏÏÏÏÏÏÏÏÏÏÏÏ $329.1 $ 8.1 $(164.5)
Income tax (beneÑt) on realized gains (losses) ÏÏÏÏÏÏÏÏÏÏÏÏÏÏÏÏÏÏÏÏÏÏÏÏÏÏÏÏÏÏÏÏÏÏÏÏÏÏÏÏÏÏÏÏ $115.2 $ 2.8 $ (57.9)
(a) Included in the gross realized losses for 1999 is $177.7 million related to the Mercantile balance sheet restructuring. These losses were included in merger and restructuring-
related expense.
For amortized cost, fair value and yield by maturity date of held-to-maturity and available-for-sale securities outstanding
as of December 31, 2001, see Table 11 included in Management's Discussion and Analysis which is incorporated by
reference into these Notes to Consolidated Financial Statements.
U.S. Bancorp
Note 6
61

Loans and Allowance for Credit Losses
The composition of the loan portfolio at December 31 was as follows:
(Dollars in Millions) 2001 2000
Commercial
Commercial ÏÏÏÏÏÏÏÏÏÏÏÏÏÏÏÏÏÏÏÏÏÏÏÏÏÏÏÏÏÏÏÏÏÏÏÏÏÏÏÏÏÏÏÏÏÏÏÏÏÏÏÏÏÏÏÏÏÏÏÏÏÏÏÏÏÏÏÏÏÏÏÏÏÏÏÏÏÏÏÏÏÏÏÏÏÏÏÏÏ $ 40,472 $ 47,041
Lease Ñnancing ÏÏÏÏÏÏÏÏÏÏÏÏÏÏÏÏÏÏÏÏÏÏÏÏÏÏÏÏÏÏÏÏÏÏÏÏÏÏÏÏÏÏÏÏÏÏÏÏÏÏÏÏÏÏÏÏÏÏÏÏÏÏÏÏÏÏÏÏÏÏÏÏÏÏÏÏÏÏÏÏÏÏÏÏÏ 5,858 5,776
Total commercial ÏÏÏÏÏÏÏÏÏÏÏÏÏÏÏÏÏÏÏÏÏÏÏÏÏÏÏÏÏÏÏÏÏÏÏÏÏÏÏÏÏÏÏÏÏÏÏÏÏÏÏÏÏÏÏÏÏÏÏÏÏÏÏÏÏÏÏÏÏÏÏÏÏÏÏÏÏÏÏÏÏ 46,330 52,817
Commercial real estate
Commercial mortgages ÏÏÏÏÏÏÏÏÏÏÏÏÏÏÏÏÏÏÏÏÏÏÏÏÏÏÏÏÏÏÏÏÏÏÏÏÏÏÏÏÏÏÏÏÏÏÏÏÏÏÏÏÏÏÏÏÏÏÏÏÏÏÏÏÏÏÏÏÏÏÏÏÏÏÏÏÏÏ 18,765 19,466
Construction and developmentÏÏÏÏÏÏÏÏÏÏÏÏÏÏÏÏÏÏÏÏÏÏÏÏÏÏÏÏÏÏÏÏÏÏÏÏÏÏÏÏÏÏÏÏÏÏÏÏÏÏÏÏÏÏÏÏÏÏÏÏÏÏÏÏÏÏÏÏÏÏÏÏ 6,608 6,977
Total commercial real estate ÏÏÏÏÏÏÏÏÏÏÏÏÏÏÏÏÏÏÏÏÏÏÏÏÏÏÏÏÏÏÏÏÏÏÏÏÏÏÏÏÏÏÏÏÏÏÏÏÏÏÏÏÏÏÏÏÏÏÏÏÏÏÏÏÏÏÏÏÏÏ 25,373 26,443
Residential mortgages ÏÏÏÏÏÏÏÏÏÏÏÏÏÏÏÏÏÏÏÏÏÏÏÏÏÏÏÏÏÏÏÏÏÏÏÏÏÏÏÏÏÏÏÏÏÏÏÏÏÏÏÏÏÏÏÏÏÏÏÏÏÏÏÏÏÏÏÏÏÏÏÏÏÏÏÏÏ 5,746 7,753
Retail
Credit cardÏÏÏÏÏÏÏÏÏÏÏÏÏÏÏÏÏÏÏÏÏÏÏÏÏÏÏÏÏÏÏÏÏÏÏÏÏÏÏÏÏÏÏÏÏÏÏÏÏÏÏÏÏÏÏÏÏÏÏÏÏÏÏÏÏÏÏÏÏÏÏÏÏÏÏÏÏÏÏÏÏÏÏÏÏÏÏÏÏÏ 5,889 6,012
Retail leasing ÏÏÏÏÏÏÏÏÏÏÏÏÏÏÏÏÏÏÏÏÏÏÏÏÏÏÏÏÏÏÏÏÏÏÏÏÏÏÏÏÏÏÏÏÏÏÏÏÏÏÏÏÏÏÏÏÏÏÏÏÏÏÏÏÏÏÏÏÏÏÏÏÏÏÏÏÏÏÏÏÏÏÏÏÏÏÏ 4,906 4,153
Other retail
Home equity and second mortgage ÏÏÏÏÏÏÏÏÏÏÏÏÏÏÏÏÏÏÏÏÏÏÏÏÏÏÏÏÏÏÏÏÏÏÏÏÏÏÏÏÏÏÏÏÏÏÏÏÏÏÏÏÏÏÏÏÏÏÏÏÏÏÏÏ 14,318 13,600
Revolving credit ÏÏÏÏÏÏÏÏÏÏÏÏÏÏÏÏÏÏÏÏÏÏÏÏÏÏÏÏÏÏÏÏÏÏÏÏÏÏÏÏÏÏÏÏÏÏÏÏÏÏÏÏÏÏÏÏÏÏÏÏÏÏÏÏÏÏÏÏÏÏÏÏÏÏÏÏÏÏÏÏÏÏ 2,673 2,750
InstallmentÏÏÏÏÏÏÏÏÏÏÏÏÏÏÏÏÏÏÏÏÏÏÏÏÏÏÏÏÏÏÏÏÏÏÏÏÏÏÏÏÏÏÏÏÏÏÏÏÏÏÏÏÏÏÏÏÏÏÏÏÏÏÏÏÏÏÏÏÏÏÏÏÏÏÏÏÏÏÏÏÏÏÏÏÏÏÏ 2,292 2,186
Automobile ÏÏÏÏÏÏÏÏÏÏÏÏÏÏÏÏÏÏÏÏÏÏÏÏÏÏÏÏÏÏÏÏÏÏÏÏÏÏÏÏÏÏÏÏÏÏÏÏÏÏÏÏÏÏÏÏÏÏÏÏÏÏÏÏÏÏÏÏÏÏÏÏÏÏÏÏÏÏÏÏÏÏÏÏÏÏ 5,660 5,609
StudentÏÏÏÏÏÏÏÏÏÏÏÏÏÏÏÏÏÏÏÏÏÏÏÏÏÏÏÏÏÏÏÏÏÏÏÏÏÏÏÏÏÏÏÏÏÏÏÏÏÏÏÏÏÏÏÏÏÏÏÏÏÏÏÏÏÏÏÏÏÏÏÏÏÏÏÏÏÏÏÏÏÏÏÏÏÏÏÏÏÏ 1,218 1,042
Total other retail ÏÏÏÏÏÏÏÏÏÏÏÏÏÏÏÏÏÏÏÏÏÏÏÏÏÏÏÏÏÏÏÏÏÏÏÏÏÏÏÏÏÏÏÏÏÏÏÏÏÏÏÏÏÏÏÏÏÏÏÏÏÏÏÏÏÏÏÏÏÏÏÏÏÏÏÏÏÏ 26,161 25,187
Total retail ÏÏÏÏÏÏÏÏÏÏÏÏÏÏÏÏÏÏÏÏÏÏÏÏÏÏÏÏÏÏÏÏÏÏÏÏÏÏÏÏÏÏÏÏÏÏÏÏÏÏÏÏÏÏÏÏÏÏÏÏÏÏÏÏÏÏÏÏÏÏÏÏÏÏÏÏÏÏÏÏÏÏÏÏÏÏÏ 36,956 35,352
Total loans ÏÏÏÏÏÏÏÏÏÏÏÏÏÏÏÏÏÏÏÏÏÏÏÏÏÏÏÏÏÏÏÏÏÏÏÏÏÏÏÏÏÏÏÏÏÏÏÏÏÏÏÏÏÏÏÏÏÏÏÏÏÏÏÏÏÏÏÏÏÏÏÏÏÏÏÏÏÏÏÏÏÏÏ $114,405 $122,365
Loans are presented net of unearned interest which of the Company's commercial portfolio by industry type
amounted to $1.6 billion and $1.7 billion at December 31, and geography as of December 31, 2001, and 2000, see
2001 and 2000, respectively. The Company had loans of Table 9 included in Management's Discussion and Analysis
$28.0 billion at December 31, 2001, and $7.8 billion at which is incorporated by reference into these Notes to
December 31, 2000, pledged at the Federal Home Loan Consolidated Financial Statements.
Bank. Loans of $7.2 billion at December 31, 2001, and For detail of the Company's commercial real estate
$3.6 billion at December 31, 2000, were pledged at the portfolio by property type and geography as of
Federal Reserve Bank. December 31, 2001, and 2000, see Table 10 included in
The Company primarily lends to borrowers in the Management's Discussion and Analysis which is
24 states where it has banking oÇces. Collateral for incorporated by reference into these Notes to Consolidated
commercial loans may include marketable securities, Financial Statements. Such loans are collateralized by the
accounts receivable, inventory and equipment. For detail related property.
The following table lists information related to nonperforming loans as of December 31:
(Dollars in Millions) 2001 2000
Loans on nonaccrual status ÏÏÏÏÏÏÏÏÏÏÏÏÏÏÏÏÏÏÏÏÏÏÏÏÏÏÏÏÏÏÏÏÏÏÏÏÏÏÏÏÏÏÏÏÏÏÏÏÏÏÏÏÏÏÏÏÏÏÏÏÏÏÏÏÏÏÏÏÏÏÏÏÏÏÏÏÏÏ $1,001.3 $765.3
Renegotiated loansÏÏÏÏÏÏÏÏÏÏÏÏÏÏÏÏÏÏÏÏÏÏÏÏÏÏÏÏÏÏÏÏÏÏÏÏÏÏÏÏÏÏÏÏÏÏÏÏÏÏÏÏÏÏÏÏÏÏÏÏÏÏÏÏÏÏÏÏÏÏÏÏÏÏÏÏÏÏÏÏÏÏÏÏÏÏ Ì Ì
Total nonperforming loans ÏÏÏÏÏÏÏÏÏÏÏÏÏÏÏÏÏÏÏÏÏÏÏÏÏÏÏÏÏÏÏÏÏÏÏÏÏÏÏÏÏÏÏÏÏÏÏÏÏÏÏÏÏÏÏÏÏÏÏÏÏÏÏÏÏÏÏÏÏÏÏÏÏÏÏÏÏÏÏ $1,001.3 $765.3
Interest income that would have been recognized at original contractual terms ÏÏÏÏÏÏÏÏÏÏÏÏÏÏÏÏÏÏÏÏÏÏÏÏÏÏÏÏÏÏÏ $ 109.2 $ 72.2
Amount recognized as interest income ÏÏÏÏÏÏÏÏÏÏÏÏÏÏÏÏÏÏÏÏÏÏÏÏÏÏÏÏÏÏÏÏÏÏÏÏÏÏÏÏÏÏÏÏÏÏÏÏÏÏÏÏÏÏÏÏÏÏÏÏÏÏÏÏÏÏÏÏ 46.2 21.4
Forgone revenue ÏÏÏÏÏÏÏÏÏÏÏÏÏÏÏÏÏÏÏÏÏÏÏÏÏÏÏÏÏÏÏÏÏÏÏÏÏÏÏÏÏÏÏÏÏÏÏÏÏÏÏÏÏÏÏÏÏÏÏÏÏÏÏÏÏÏÏÏÏÏÏÏÏÏÏÏÏÏÏÏÏÏÏÏÏÏÏÏ $ 63.0 $ 50.8
U.S. Bancorp
Note 7
62

Activity in the allowance for credit losses was as follows:
(Dollars in Millions) 2001 2000 1999
Balance at beginning of year ÏÏÏÏÏÏÏÏÏÏÏÏÏÏÏÏÏÏÏÏÏÏÏÏÏÏÏÏÏÏÏÏÏÏÏÏÏÏÏÏÏÏÏÏÏÏÏÏÏÏÏÏÏÏÏÏÏÏÏÏÏ $1,786.9 $1,710.3 $1,705.7
Add
Provision charged to operating expense(a) ÏÏÏÏÏÏÏÏÏÏÏÏÏÏÏÏÏÏÏÏÏÏÏÏÏÏÏÏÏÏÏÏÏÏÏÏÏÏÏÏÏÏÏÏ 2,528.8 828.0 646.0
Deduct
Loans charged oÅÏÏÏÏÏÏÏÏÏÏÏÏÏÏÏÏÏÏÏÏÏÏÏÏÏÏÏÏÏÏÏÏÏÏÏÏÏÏÏÏÏÏÏÏÏÏÏÏÏÏÏÏÏÏÏÏÏÏÏÏÏÏÏÏÏÏÏÏ 1,771.4 1,017.6 902.8
Less recoveries of loans charged oÅ ÏÏÏÏÏÏÏÏÏÏÏÏÏÏÏÏÏÏÏÏÏÏÏÏÏÏÏÏÏÏÏÏÏÏÏÏÏÏÏÏÏÏÏÏÏÏÏÏÏÏ 224.9 192.2 230.2
Net loans charged oÅ ÏÏÏÏÏÏÏÏÏÏÏÏÏÏÏÏÏÏÏÏÏÏÏÏÏÏÏÏÏÏÏÏÏÏÏÏÏÏÏÏÏÏÏÏÏÏÏÏÏÏÏÏÏÏÏÏÏÏÏÏÏÏÏÏ 1,546.5 825.4 672.6
Losses from loan sales/transfersÏÏÏÏÏÏÏÏÏÏÏÏÏÏÏÏÏÏÏÏÏÏÏÏÏÏÏÏÏÏÏÏÏÏÏÏÏÏÏÏÏÏÏÏÏÏÏÏÏÏÏÏÏÏÏÏÏ (329.3) Ì Ì
Acquisitions and other changes ÏÏÏÏÏÏÏÏÏÏÏÏÏÏÏÏÏÏÏÏÏÏÏÏÏÏÏÏÏÏÏÏÏÏÏÏÏÏÏÏÏÏÏÏÏÏÏÏÏÏÏÏÏÏÏÏÏÏ 17.4 74.0 31.2
Balance at end of year ÏÏÏÏÏÏÏÏÏÏÏÏÏÏÏÏÏÏÏÏÏÏÏÏÏÏÏÏÏÏÏÏÏÏÏÏÏÏÏÏÏÏÏÏÏÏÏÏÏÏÏÏÏÏÏÏÏÏÏÏÏÏÏÏÏÏ $2,457.3 $1,786.9 $1,710.3
(a) In 2001, $382.2 million of the provision for credit losses was incurred in connection with the merger of Firstar and USBM.
A portion of the allowance for credit losses is allocated to loans deemed impaired. All impaired loans are included in non-
performing assets. A summary of these loans and their related allowance for loan losses is as follows:
2001 2000 1999
Recorded Valuation Recorded Valuation Recorded Valuation(Dollars in Millions) Investment Allowance Investment Allowance Investment Allowance
Impaired Loans
Valuation allowance requiredÏÏÏÏÏÏÏÏÏ $694 $125 $487 $57 $257 $8
No valuation allowance requiredÏÏÏÏÏÏ Ì Ì 127 Ì 132 Ì
Total impaired loans ÏÏÏÏÏÏÏÏÏÏÏÏÏÏÏÏÏÏÏÏ $694 $125 $614 $57 $389 $8
Average balance of impaired loans during
the year ÏÏÏÏÏÏÏÏÏÏÏÏÏÏÏÏÏÏÏÏÏÏÏÏÏÏÏÏÏ $780 $526 $408
Interest income recognized on impaired
loans during the year ÏÏÏÏÏÏÏÏÏÏÏÏÏÏÏÏÏ 25.0 7.8 3.3
Commitments to lend additional funds to customers whose loans were classiÑed as nonaccrual or renegotiated at
December 31, 2001, totaled $82.5 million. During 2001 there were no loans that were restructured at market interest rates
and returned to a fully performing status.
On November 16, 2001, the Company sold $737.8Accounting for Transfers andmillion of unsecured small business receivables. TheServicing of Financial Assets and transaction generated a loss on sale of $64.7 million. TheExtinguishments of LiabilitiesCompany retained interest-only strips, a cash collateral
Receivable Sales reserve, and subordinated securities. Key assumptions used
in measuring retained interests at the date of securitizationWhen the Company sells receivables, it may retain interest-are consistent with those presented in the table belowonly strips, servicing rights, a cash reserve account, and/orcaptioned ""Residual Economic Assumptions and Adverseother interests in the receivables. The gain or loss on saleChanges.'' These products are similar in nature to revolvingof the receivables depends in part on the previous carryingcredit card receivables. Each month new advances on theseamount of the Ñnancial assets involved in the transfer, andaccounts are sold. The proceeds from these sales are nettedis allocated between the assets sold and the retainedagainst the cash collected for the month. The net cashinterests based on their relative fair values at the date ofcollected is distributed accordingly to pay down thetransfer. Market prices are used to determine retainedoutstanding securities. The Company receives a fee tointerest fair values when readily available. However, quotescontinue to service the receivables. Since the Companyare generally not available for retained interests, so thereceives adequate compensation relative to current marketCompany generally estimates fair value based on the presentservicing prices, no servicing asset or liability regarding thisvalue of future expected cash Öows using management'ssecuritization is recognized.best estimates of the key assumptionsÌcredit losses,
During 2001 and 2000, the Company administered aprepayment speeds, forward yield curves, and discount ratesloan conduit which holds short-term participations incommensurate with the risks involved. Retained interestscommercial loans originated by the Company. These loansare valued at inception and updated quarterly using atotaled $5.9 billion at December 31, 2001 and included netdiscounted cash Öow methodology.sales of originated loans to the loan conduit of
U.S. Bancorp
Note 8
63

approximately $3.7 billion during 2001. The Company No valuation allowances were required during 2001 or
received fee revenue of $57.6 million and $18.0 million 2000 on servicing assets. Servicing assets are reported in
from the loan conduit in 2001 and 2000, respectively. aggregate but measured on a transaction speciÑc basis.
Under a credit enhancement agreement with the conduit, Market values were determined using discounted cash Öows,
the Company would be required to make payments to the utilizing the assumptions noted in the table below.
conduit in speciÑed amounts if the conduit experiencesKey economic assumptions used in valuing servicing assets
payment defaults on its loans. No credit enhancementsat the date of sale resulting from sales completed during
were needed during 2001 or 2000. In addition, the2001 and 2000 were as follows:
Company maintains a reserve to reÖect its obligation to2001 2000
provide credit enhancements to the conduit. (Dollars in Millions) SBA Loans(a) SBA Loans(a)
For the years ended December 31, 2001 and 2000, theFair value of assets recognized $9.1 $7.9
Company sold $147.5 million and $255.7 million of the Prepayment speed(b) ÏÏÏÏÏÏÏÏÏ 21 CPR 21 CPR
U.S. government guaranteed portions of loans originated Weighted-average life (years)ÏÏ 3.7 3.9
Expected credit lossesÏÏÏÏÏÏÏÏÏ NA NAunder Small Business Administration (SBA) programs,Discount rateÏÏÏÏÏÏÏÏÏÏÏÏÏÏÏÏÏÏ 12% 12%recognizing a pre-tax gain on sale of $6.3 million andVariable returns to transferees NA NA
$10.6 million, respectively. The SBA covers losses occurring(a) All were adjustable rate loans based on the Wall Street Journal prime rate.on these guaranteed portions. Although the Company(b) The Company used a prepayment vector based on loan seasoning for valuation. The
retains no credit recourse relating to these sales, it does given speed was the eÅective prepayment speed that yields the same weighted-
average life calculated using the prepayment vector.continue to own a portion of the non-guaranteed elements
of the loans. The Company continues to service the loans The Company also established a securitization trustand is required under the SBA programs to retain speciÑed which held credit card receivables originated by theyield amounts. A portion of the yield is recognized as Company. This trust was terminated in December 2000. Atservicing fee income as it occurs and the remainder is termination, $509 million of credit card receivables werecapitalized as a servicing asset, and included in the gain on transferred from the trust to the Company in exchange forsale calculation. the seller's certiÑcates held by the Company. In 2000,
$665 million of proceeds from collections of credit cardServicing Asset Position
receivables were reinvested in the trust. The Company2001 2000
received $18.0 million in servicing fee revenue from the(Dollars in Millions) SBA Loans SBA Loans
trust in 2000 and recorded a $2.2 million gain upon theServicing assets at beginning of
termination of the trust.year ÏÏÏÏÏÏÏÏÏÏÏÏÏÏÏÏÏÏÏÏÏÏÏÏÏÏ $6.9 $ 4.3
Servicing assets recognized
during the yearÏÏÏÏÏÏÏÏÏÏÏÏÏÏÏ 2.8 4.0
Amortization ÏÏÏÏÏÏÏÏÏÏÏÏÏÏÏÏÏÏÏÏ (2.2) (1.4)
Servicing assets at end of year ÏÏÏ $7.5 $ 6.9
U.S. Bancorp64

Residual Economic Assumptions and Adverse Changes
The Company has retained interests on the following asset sales: $1.8 billion sale of indirect automobile loans on
September 24, 1999; $420 million sale of corporate and purchasing card receivables on February 27, 1997; $737.8 million
sale of unsecured small business receivables on November 16, 2001; and sales of SBA loans since 1988. At December 31,
2001, key economic assumptions and the sensitivity of the current fair value of residual cash Öows to immediate 10 percent
and 20 percent adverse changes in those assumptions were as follows:
Indirect Corporate UnsecuredAutomobile SBA Card Small Business
At December 31, 2001 (Dollars in Millions) Loans Loans(a) Receivables(b) Receivables
Carrying amount/fair value of retained interests ÏÏÏÏÏÏÏÏÏÏÏÏÏÏÏÏÏÏÏÏÏÏÏÏÏÏ $23.1 $ 3.2 $4.3 $232.7
Weighted-average life (in years) ÏÏÏÏÏÏÏÏÏÏÏÏÏÏÏÏÏÏÏÏÏÏÏÏÏÏÏÏÏÏÏÏÏÏÏÏÏÏÏÏ 0.7 3.7 0.1 0.8
Prepayment speed assumption (annual)(c)(d)(e) ÏÏÏÏÏÏÏÏÏÏ 1.5 ABS 21 CPR Ì 6.0%
Impact on fair value of 10% adverse change ÏÏÏÏÏÏÏÏÏÏÏÏÏÏÏÏÏÏÏÏÏÏÏÏÏÏ $(0.7) $(0.2) $ Ì $ (3.1)
Impact on fair value of 20% adverse change ÏÏÏÏÏÏÏÏÏÏÏÏÏÏÏÏÏÏÏÏÏÏÏÏÏÏ (1.5) (0.4) Ì (4.7)
Expected credit losses (annual) ÏÏÏÏÏÏÏÏÏÏÏÏÏÏÏÏÏÏÏÏÏÏÏÏÏÏÏÏÏÏÏÏ 2.8% Ì% Ì% 13.5%
Impact on fair value of 10% adverse change ÏÏÏÏÏÏÏÏÏÏÏÏÏÏÏÏÏÏÏÏÏÏÏÏÏÏ $(0.7) $ Ì $ Ì $ (8.7)
Impact on fair value of 20% adverse change ÏÏÏÏÏÏÏÏÏÏÏÏÏÏÏÏÏÏÏÏÏÏÏÏÏÏ (1.4) Ì Ì (16.8)
Residual cash Öows discount rate (annual)ÏÏÏÏÏÏÏÏÏÏÏÏÏÏÏÏÏÏÏÏ 12.0% 12.0% Ì% 11.0%
Impact on fair value of 10% adverse change ÏÏÏÏÏÏÏÏÏÏÏÏÏÏÏÏÏÏÏÏÏÏÏÏÏÏ $(0.2) $(0.1) $ Ì $ (2.6)
Impact on fair value of 20% adverse change ÏÏÏÏÏÏÏÏÏÏÏÏÏÏÏÏÏÏÏÏÏÏÏÏÏÏ (0.4) (0.2) Ì (5.2)
Interest rates on variable and adjustable contracts ÏÏÏÏÏÏÏÏÏÏÏ NA NA NA 10.5%
Impact on fair value of 10% adverse change ÏÏÏÏÏÏÏÏÏÏÏÏÏÏÏÏÏÏÏÏÏÏÏÏÏÏ NA NA NA $ (6.7)
Impact on fair value of 20% adverse change ÏÏÏÏÏÏÏÏÏÏÏÏÏÏÏÏÏÏÏÏÏÏÏÏÏÏ NA NA NA (12.9)
(a) Credit losses are covered by the appropriate SBA loan program and are not included in retained interests. Principal reductions caused by defaults are included in the prepayment
assumption.
(b) Residual interest is eÅectively a single period receivable that is paid and renewed each month during the revolving period. Therefore, no assumptions are used in its estimate.
Losses are recognized in the period they occur.
(c) The Company uses prepayment vectors based on loan seasoning for valuation. The given speed is the eÅective prepayment speed that yields the same weighted-average life
calculated using the prepayment vector.
(d) ABS • absolute prepayment rate and is the auto industry's standard measure of prepayment speed. CPR • constant prepayment rate.
(e) Monthly repayment rate on small business lines of credit.
These sensitivities are hypothetical and should be used with caution. As the Ñgures indicate, changes in fair value based on a 10 percent variation in assumptions generally cannot be
extrapolated because the relationship of the change in the assumptions to the change in fair value may not be linear. Also, in this table the eÅect of a variation in a particular
assumption on the fair value of the retained interest is calculated without changing any other assumption; in reality, changes in one factor may result in changes in another (for
example, increases in market interest rates may result in lower prepayments and increased credit losses), which might magnify or counteract the sensitivities.
The table below summarizes certain cash Öows received from and paid to conduit or structured entities for the loan sales
described above:
Year Ended December 31 (Dollars in Millions) 2001 2000
Proceeds from new sales(a)ÏÏÏÏÏÏÏÏÏÏÏÏÏÏÏÏÏÏÏÏÏÏÏÏÏÏÏÏÏÏÏÏÏÏÏÏÏÏÏÏÏÏÏÏÏÏÏÏÏÏÏÏÏÏÏÏÏÏÏÏÏÏÏÏÏÏÏÏÏÏÏÏÏÏ $70,209.4 $37,911.6
Proceeds from existing securitizations(b) ÏÏÏÏÏÏÏÏÏÏÏÏÏÏÏÏÏÏÏÏÏÏÏÏÏÏÏÏÏÏÏÏÏÏÏÏÏÏÏÏÏÏÏÏÏÏÏÏÏÏÏÏÏÏÏÏÏÏÏÏÏÏ 6,969.9 8,042.7
Reinvestment in existing securitizations(b)ÏÏÏÏÏÏÏÏÏÏÏÏÏÏÏÏÏÏÏÏÏÏÏÏÏÏÏÏÏÏÏÏÏÏÏÏÏÏÏÏÏÏÏÏÏÏÏÏÏÏÏÏÏÏÏÏÏÏÏÏÏ (6,547.8) (7,972.9)
Servicing and other fees receivedÏÏÏÏÏÏÏÏÏÏÏÏÏÏÏÏÏÏÏÏÏÏÏÏÏÏÏÏÏÏÏÏÏÏÏÏÏÏÏÏÏÏÏÏÏÏÏÏÏÏÏÏÏÏÏÏÏÏÏÏÏÏÏÏÏÏÏÏÏÏ 73.9 52.9
Other cash Öows received on retained interests(c) ÏÏÏÏÏÏÏÏÏÏÏÏÏÏÏÏÏÏÏÏÏÏÏÏÏÏÏÏÏÏÏÏÏÏÏÏÏÏÏÏÏÏÏÏÏÏÏÏÏÏÏÏÏ 29.9 34.2
Purchases of delinquent or foreclosed assetsÏÏÏÏÏÏÏÏÏÏÏÏÏÏÏÏÏÏÏÏÏÏÏÏÏÏÏÏÏÏÏÏÏÏÏÏÏÏÏÏÏÏÏÏÏÏÏÏÏÏÏÏÏÏÏÏÏÏÏ Ì Ì
(a) Gross proceeds from commercial loan sales were $69.5 billion for 2001. The net cash Öows for these sales were $3.7 billion. For 2000, gross commercial loan sale proceeds were
$37.6 billion, with net cash Öows of ($30.3) million.
(b) The corporate card and unsecured small business receivables securitizations are revolving transactions where proceeds are reinvested until their legal terminations. The indirect
automobile and SBA loan sales are amortizing transactions where the cash Öow is used to pay oÅ investors.
(c) This amount represents total cash Öows received from retained interests by the transferor other than servicing fees. Other cash Öows include, for example, all cash Öows from
interest-only strips and cash above the minimum required level in cash collateral accounts.
U.S. Bancorp 65

Quantitative information relating to loan sales and managed assets was as follows:
At December 31 Year Ended December 31
Total Principal AmountPrincipal Balance 90 Days or More Past Due Average Balance Net Credit Losses
Asset Type (Dollars in Millions) 2001 2000 2001 2000 2001 2000 2001 2000
Commercial
Commercial ÏÏÏÏÏÏÏÏÏÏÏÏÏÏÏÏÏÏÏÏÏÏÏ $47,867 $ 49,982 $ 590 $ 525 $ 49,672 $ 48,403 $ 724 $259
Lease Ñnancing ÏÏÏÏÏÏÏÏÏÏÏÏÏÏÏÏÏÏÏ 5,858 5,776 207 72 5,852 4,512 114 21
Total commercial ÏÏÏÏÏÏÏÏÏÏÏÏÏÏÏ 53,725 55,758 797 597 55,524 52,915 838 280
Commercial real estate
Commercial mortgages ÏÏÏÏÏÏÏÏÏÏÏÏ 18,765 19,466 136 118 19,004 19,158 40 5
Construction and developmentÏÏÏÏÏÏ 6,608 6,977 37 40 7,077 6,882 12 8
Total commercial real estate ÏÏÏÏ 25,373 26,443 173 158 26,081 26,040 52 13
Residential mortgages ÏÏÏÏÏÏÏÏÏÏÏ 5,746 7,753 140 116 6,868 9,578 13 12
Retail
Credit cardÏÏÏÏÏÏÏÏÏÏÏÏÏÏÏÏÏÏÏÏÏÏÏÏ 5,889 6,012 128 111 5,645 5,490 271 238
Retail leasing ÏÏÏÏÏÏÏÏÏÏÏÏÏÏÏÏÏÏÏÏÏ 4,906 4,153 12 8 4,553 3,139 30 13
Other retailÏÏÏÏÏÏÏÏÏÏÏÏÏÏÏÏÏÏÏÏÏÏÏÏ 26,593 26,100 224 165 25,613 25,729 360 319
Total retail ÏÏÏÏÏÏÏÏÏÏÏÏÏÏÏÏÏÏÏÏÏ 37,388 36,265 364 285 35,811 34,358 661 570
Total managed loans ÏÏÏÏÏÏÏÏ $122,232 $126,219 $1,474 $1,155 $124,284 $122,891 $1,564 $875
Less:
Loans sold or securitized ÏÏÏÏÏÏÏÏÏÏ 7,827 3,854 6,107 4,574
Total loans heldÏÏÏÏÏÏÏÏÏÏÏÏÏ $114,405 $122,365 $118,177 $118,317
Sold or securitized assets
Commercial loans ÏÏÏÏÏÏÏÏÏÏÏÏÏÏÏÏÏ $5,868 $ 2,003 $ Ì $ Ì $ 4,298 $ 2,073 $ Ì $ Ì
Indirect automobile loans(a) ÏÏÏÏÏÏÏ 432 913 4 3 655 1,213 11 16
Guaranteed SBA loans(b) ÏÏÏÏÏÏÏÏÏ 582 518 2 Ì 629 360 Ì Ì
Corporate card receivables(b) ÏÏÏÏÏ 214 420 1 1 403 420 3 3
Credit card receivables ÏÏÏÏÏÏÏÏÏÏÏÏ Ì Ì Ì Ì Ì 508 Ì 30
Unsecured small business
receivables(b) ÏÏÏÏÏÏÏÏÏÏÏÏÏÏÏÏÏÏ 731 Ì 4 Ì 122 Ì 3 Ì
Total securitized assetsÏÏÏÏÏÏÏÏÏ $7,827 $ 3,854 $ 11 $ 4 $ 6,107 $ 4,574 $ 17 $ 49
(a) Reported in ""other retail'' loans.
(b) Reported in ""commercial'' loans.
Premises and Equipment
Premises and equipment at December 31 consisted of the following:
(Dollars in Millions) 2001 2000
LandÏÏÏÏÏÏÏÏÏÏÏÏÏÏÏÏÏÏÏÏÏÏÏÏÏÏÏÏÏÏÏÏÏÏÏÏÏÏÏÏÏÏÏÏÏÏÏÏÏÏÏÏÏÏÏÏÏÏÏÏÏÏÏÏÏÏÏÏÏÏÏÏÏÏÏÏÏÏÏÏÏÏÏÏÏÏÏÏÏÏÏÏÏÏÏÏÏÏÏÏÏ $ 274 $ 276
Buildings and improvements ÏÏÏÏÏÏÏÏÏÏÏÏÏÏÏÏÏÏÏÏÏÏÏÏÏÏÏÏÏÏÏÏÏÏÏÏÏÏÏÏÏÏÏÏÏÏÏÏÏÏÏÏÏÏÏÏÏÏÏÏÏÏÏÏÏÏÏÏÏÏÏÏÏÏÏÏÏÏÏ 1,854 1,786
Furniture, Ñxtures and equipment ÏÏÏÏÏÏÏÏÏÏÏÏÏÏÏÏÏÏÏÏÏÏÏÏÏÏÏÏÏÏÏÏÏÏÏÏÏÏÏÏÏÏÏÏÏÏÏÏÏÏÏÏÏÏÏÏÏÏÏÏÏÏÏÏÏÏÏÏÏÏÏÏÏÏ 2,012 1,888
Capitalized building and equipment leases ÏÏÏÏÏÏÏÏÏÏÏÏÏÏÏÏÏÏÏÏÏÏÏÏÏÏÏÏÏÏÏÏÏÏÏÏÏÏÏÏÏÏÏÏÏÏÏÏÏÏÏÏÏÏÏÏÏÏÏÏÏÏÏÏÏÏ 173 171
Construction in progress ÏÏÏÏÏÏÏÏÏÏÏÏÏÏÏÏÏÏÏÏÏÏÏÏÏÏÏÏÏÏÏÏÏÏÏÏÏÏÏÏÏÏÏÏÏÏÏÏÏÏÏÏÏÏÏÏÏÏÏÏÏÏÏÏÏÏÏÏÏÏÏÏÏÏÏÏÏÏÏÏÏÏ 8 48
4,321 4,169
Less accumulated depreciation and amortization ÏÏÏÏÏÏÏÏÏÏÏÏÏÏÏÏÏÏÏÏÏÏÏÏÏÏÏÏÏÏÏÏÏÏÏÏÏÏÏÏÏÏÏÏÏÏÏÏÏÏÏÏÏÏÏÏÏÏÏÏ 2,580 2,333
TotalÏÏÏÏÏÏÏÏÏÏÏÏÏÏÏÏÏÏÏÏÏÏÏÏÏÏÏÏÏÏÏÏÏÏÏÏÏÏÏÏÏÏÏÏÏÏÏÏÏÏÏÏÏÏÏÏÏÏÏÏÏÏÏÏÏÏÏÏÏÏÏÏÏÏÏÏÏÏÏÏÏÏÏÏÏÏÏÏÏÏÏÏÏÏÏÏÏÏ $1,741 $1,836
U.S. Bancorp
Note 9
66

Mortgage Servicing Rights
Changes in capitalized mortgage servicing rights are summarized as follows:
Year Ended December 31,
(Dollars in Millions) 2001 2000
Balance at beginning of year ÏÏÏÏÏÏÏÏÏÏÏÏÏÏÏÏÏÏÏÏÏÏÏÏÏÏÏÏÏÏÏÏÏÏÏÏÏÏÏÏÏÏÏÏÏÏÏÏÏÏÏÏÏÏÏÏÏÏÏÏÏÏÏÏÏÏÏÏÏÏÏÏÏÏÏÏÏÏÏ $ 229 $ 213
Rights purchasedÏÏÏÏÏÏÏÏÏÏÏÏÏÏÏÏÏÏÏÏÏÏÏÏÏÏÏÏÏÏÏÏÏÏÏÏÏÏÏÏÏÏÏÏÏÏÏÏÏÏÏÏÏÏÏÏÏÏÏÏÏÏÏÏÏÏÏÏÏÏÏÏÏÏÏÏÏÏÏÏÏÏÏÏÏÏÏÏÏÏ 25 16
Rights capitalizedÏÏÏÏÏÏÏÏÏÏÏÏÏÏÏÏÏÏÏÏÏÏÏÏÏÏÏÏÏÏÏÏÏÏÏÏÏÏÏÏÏÏÏÏÏÏÏÏÏÏÏÏÏÏÏÏÏÏÏÏÏÏÏÏÏÏÏÏÏÏÏÏÏÏÏÏÏÏÏÏÏÏÏÏÏÏÏÏÏÏ 315 137
Amortization ÏÏÏÏÏÏÏÏÏÏÏÏÏÏÏÏÏÏÏÏÏÏÏÏÏÏÏÏÏÏÏÏÏÏÏÏÏÏÏÏÏÏÏÏÏÏÏÏÏÏÏÏÏÏÏÏÏÏÏÏÏÏÏÏÏÏÏÏÏÏÏÏÏÏÏÏÏÏÏÏÏÏÏÏÏÏÏÏÏÏÏÏÏÏ (45) (35)
Rights sold ÏÏÏÏÏÏÏÏÏÏÏÏÏÏÏÏÏÏÏÏÏÏÏÏÏÏÏÏÏÏÏÏÏÏÏÏÏÏÏÏÏÏÏÏÏÏÏÏÏÏÏÏÏÏÏÏÏÏÏÏÏÏÏÏÏÏÏÏÏÏÏÏÏÏÏÏÏÏÏÏÏÏÏÏÏÏÏÏÏÏÏÏÏÏÏ (103) (101)
ImpairmentÏÏÏÏÏÏÏÏÏÏÏÏÏÏÏÏÏÏÏÏÏÏÏÏÏÏÏÏÏÏÏÏÏÏÏÏÏÏÏÏÏÏÏÏÏÏÏÏÏÏÏÏÏÏÏÏÏÏÏÏÏÏÏÏÏÏÏÏÏÏÏÏÏÏÏÏÏÏÏÏÏÏÏÏÏÏÏÏÏÏÏÏÏÏÏÏ (61) (1)
Balance at end of yearÏÏÏÏÏÏÏÏÏÏÏÏÏÏÏÏÏÏÏÏÏÏÏÏÏÏÏÏÏÏÏÏÏÏÏÏÏÏÏÏÏÏÏÏÏÏÏÏÏÏÏÏÏÏÏÏÏÏÏÏÏÏÏÏÏÏÏÏÏÏÏÏÏÏÏÏÏÏÏÏÏÏÏÏÏ $ 360 $ 229
The fair value of capitalized mortgage servicing rights was $360 million at December 31, 2001, and $245 million at
December 31, 2000. At December 31, 2001, the reduction in the current fair value of mortgage servicing rights to immediate
25 and 50 basis point adverse interest rate changes would be approximately $32 million and $63 million, respectively. The
Company has purchased principal-only securities that act as a partial economic hedge to this possible adverse interest rate
change. The Company serviced $22.0 billion and $17.0 billion of mortgage loans for other investors as of December 31,
2001 and 2000, respectively.
Intangible Assets
The following is a summary of intangible assets as of December 31, which are included in the consolidated balance sheet:
(Dollars in Millions) 2001 2000
Goodwill ÏÏÏÏÏÏÏÏÏÏÏÏÏÏÏÏÏÏÏÏÏÏÏÏÏÏÏÏÏÏÏÏÏÏÏÏÏÏÏÏÏÏÏÏÏÏÏÏÏÏÏÏÏÏÏÏÏÏÏÏÏÏÏÏÏÏÏÏÏÏÏÏÏÏÏÏÏÏÏÏÏÏÏÏÏÏÏÏÏÏÏÏÏÏÏÏÏ $5,488 $4,312
Core deposit beneÑts ÏÏÏÏÏÏÏÏÏÏÏÏÏÏÏÏÏÏÏÏÏÏÏÏÏÏÏÏÏÏÏÏÏÏÏÏÏÏÏÏÏÏÏÏÏÏÏÏÏÏÏÏÏÏÏÏÏÏÏÏÏÏÏÏÏÏÏÏÏÏÏÏÏÏÏÏÏÏÏÏÏÏÏÏÏ 530 374
Merchant processing contractsÏÏÏÏÏÏÏÏÏÏÏÏÏÏÏÏÏÏÏÏÏÏÏÏÏÏÏÏÏÏÏÏÏÏÏÏÏÏÏÏÏÏÏÏÏÏÏÏÏÏÏÏÏÏÏÏÏÏÏÏÏÏÏÏÏÏÏÏÏÏÏÏÏÏÏÏÏ 680 17
Mortgage servicing rightsÏÏÏÏÏÏÏÏÏÏÏÏÏÏÏÏÏÏÏÏÏÏÏÏÏÏÏÏÏÏÏÏÏÏÏÏÏÏÏÏÏÏÏÏÏÏÏÏÏÏÏÏÏÏÏÏÏÏÏÏÏÏÏÏÏÏÏÏÏÏÏÏÏÏÏÏÏÏÏÏÏÏ 360 229
Other identiÑed intangiblesÏÏÏÏÏÏÏÏÏÏÏÏÏÏÏÏÏÏÏÏÏÏÏÏÏÏÏÏÏÏÏÏÏÏÏÏÏÏÏÏÏÏÏÏÏÏÏÏÏÏÏÏÏÏÏÏÏÏÏÏÏÏÏÏÏÏÏÏÏÏÏÏÏÏÏÏÏÏÏÏÏ 354 377
Total intangible assets ÏÏÏÏÏÏÏÏÏÏÏÏÏÏÏÏÏÏÏÏÏÏÏÏÏÏÏÏÏÏÏÏÏÏÏÏÏÏÏÏÏÏÏÏÏÏÏÏÏÏÏÏÏÏÏÏÏÏÏÏÏÏÏÏÏÏÏÏÏÏÏÏÏÏÏÏÏÏÏÏÏ $7,412 $5,309
Short-Term Borrowings
The following table is a summary of short-term borrowings for the last three years:
2001 2000 1999
(Dollars in Millions) Amount Rate Amount Rate Amount Rate
At year-end
Federal funds purchasedÏÏÏÏÏÏÏÏÏÏÏÏÏÏÏÏÏÏÏÏÏÏÏÏÏÏÏÏÏÏ $ 1,146 1.1% $ 2,849 5.8% $ 5,489 4.7%
Securities sold under agreements to repurchase ÏÏÏÏÏÏÏÏ 3,001 1.1 3,347 4.6 3,174 3.8
Commercial paperÏÏÏÏÏÏÏÏÏÏÏÏÏÏÏÏÏÏÏÏÏÏÏÏÏÏÏÏÏÏÏÏÏÏÏÏ 452 1.9 223 6.4 170 4.7
Treasury, tax and loan notes ÏÏÏÏÏÏÏÏÏÏÏÏÏÏÏÏÏÏÏÏÏÏÏÏÏÏ 4,038 1.3 776 5.2 619 5.0
Other short-term borrowings ÏÏÏÏÏÏÏÏÏÏÏÏÏÏÏÏÏÏÏÏÏÏÏÏÏÏ 6,033 2.5 4,638 6.1 1,106 5.6
Total ÏÏÏÏÏÏÏÏÏÏÏÏÏÏÏÏÏÏÏÏÏÏÏÏÏÏÏÏÏÏÏÏÏÏÏÏÏÏÏÏÏÏÏÏÏ $14,670 1.8% $11,833 5.6% $10,558 4.6%
Average for the year
Federal funds purchasedÏÏÏÏÏÏÏÏÏÏÏÏÏÏÏÏÏÏÏÏÏÏÏÏÏÏÏÏÏÏ $ 4,997 5.0% $ 5,690 6.2% $ 5,898 5.0%
Securities sold under agreements to repurchase ÏÏÏÏÏÏÏÏ 2,657 2.9 3,028 4.8 3,128 4.0
Commercial paperÏÏÏÏÏÏÏÏÏÏÏÏÏÏÏÏÏÏÏÏÏÏÏÏÏÏÏÏÏÏÏÏÏÏÏÏ 390 3.9 215 6.3 370 5.1
Treasury, tax and loan notes ÏÏÏÏÏÏÏÏÏÏÏÏÏÏÏÏÏÏÏÏÏÏÏÏÏÏ 1,321 3.5 912 6.1 577 4.5
Other short-term borrowings ÏÏÏÏÏÏÏÏÏÏÏÏÏÏÏÏÏÏÏÏÏÏÏÏÏÏ 3,615 4.0 2,741 7.7 1,734 6.9
Total ÏÏÏÏÏÏÏÏÏÏÏÏÏÏÏÏÏÏÏÏÏÏÏÏÏÏÏÏÏÏÏÏÏÏÏÏÏÏÏÏÏÏÏÏÏ $12,980 4.1% $12,586 6.2% $11,707 5.0%
Maximum month-end balance
Federal funds purchasedÏÏÏÏÏÏÏÏÏÏÏÏÏÏÏÏÏÏÏÏÏÏÏÏÏÏÏÏÏÏ $ 7,829 $ 7,807 $ 7,080
Securities sold under agreements to repurchase ÏÏÏÏÏÏÏÏ 3,001 3,415 3,278
Commercial paperÏÏÏÏÏÏÏÏÏÏÏÏÏÏÏÏÏÏÏÏÏÏÏÏÏÏÏÏÏÏÏÏÏÏÏÏ 590 300 397
Treasury, tax and loan notes ÏÏÏÏÏÏÏÏÏÏÏÏÏÏÏÏÏÏÏÏÏÏÏÏÏÏ 6,618 3,578 1,435
Other short-term borrowings ÏÏÏÏÏÏÏÏÏÏÏÏÏÏÏÏÏÏÏÏÏÏÏÏÏÏ 7,149 4,920 4,945
U.S. Bancorp
Note 10
Note 11
Note 12
67

Long-Term Debt
Long-term debt (debt with original maturities of more than one year) at December 31 consisted of the following:
(Dollars in Millions) 2001 2000
U.S. Bancorp (Parent Company)
Fixed-rate subordinated notes
7.625% due 2002 ÏÏÏÏÏÏÏÏÏÏÏÏÏÏÏÏÏÏÏÏÏÏÏÏÏÏÏÏÏÏÏÏÏÏÏÏÏÏÏÏÏÏÏÏÏÏÏÏÏÏÏÏÏÏÏÏÏÏÏÏÏÏÏÏÏÏÏÏÏÏÏÏÏÏÏÏÏÏÏÏÏÏÏÏÏ $ 150 $ 150
8.125% due 2002 ÏÏÏÏÏÏÏÏÏÏÏÏÏÏÏÏÏÏÏÏÏÏÏÏÏÏÏÏÏÏÏÏÏÏÏÏÏÏÏÏÏÏÏÏÏÏÏÏÏÏÏÏÏÏÏÏÏÏÏÏÏÏÏÏÏÏÏÏÏÏÏÏÏÏÏÏÏÏÏÏÏÏÏÏÏ 150 150
7.00% due 2003 ÏÏÏÏÏÏÏÏÏÏÏÏÏÏÏÏÏÏÏÏÏÏÏÏÏÏÏÏÏÏÏÏÏÏÏÏÏÏÏÏÏÏÏÏÏÏÏÏÏÏÏÏÏÏÏÏÏÏÏÏÏÏÏÏÏÏÏÏÏÏÏÏÏÏÏÏÏÏÏÏÏÏÏÏÏÏ 150 150
6.625% due 2003 ÏÏÏÏÏÏÏÏÏÏÏÏÏÏÏÏÏÏÏÏÏÏÏÏÏÏÏÏÏÏÏÏÏÏÏÏÏÏÏÏÏÏÏÏÏÏÏÏÏÏÏÏÏÏÏÏÏÏÏÏÏÏÏÏÏÏÏÏÏÏÏÏÏÏÏÏÏÏÏÏÏÏÏÏÏ 100 100
7.25% due 2003 ÏÏÏÏÏÏÏÏÏÏÏÏÏÏÏÏÏÏÏÏÏÏÏÏÏÏÏÏÏÏÏÏÏÏÏÏÏÏÏÏÏÏÏÏÏÏÏÏÏÏÏÏÏÏÏÏÏÏÏÏÏÏÏÏÏÏÏÏÏÏÏÏÏÏÏÏÏÏÏÏÏÏÏÏÏÏ 32 32
8.00% due 2004 ÏÏÏÏÏÏÏÏÏÏÏÏÏÏÏÏÏÏÏÏÏÏÏÏÏÏÏÏÏÏÏÏÏÏÏÏÏÏÏÏÏÏÏÏÏÏÏÏÏÏÏÏÏÏÏÏÏÏÏÏÏÏÏÏÏÏÏÏÏÏÏÏÏÏÏÏÏÏÏÏÏÏÏÏÏÏ 73 125
7.625% due 2005 ÏÏÏÏÏÏÏÏÏÏÏÏÏÏÏÏÏÏÏÏÏÏÏÏÏÏÏÏÏÏÏÏÏÏÏÏÏÏÏÏÏÏÏÏÏÏÏÏÏÏÏÏÏÏÏÏÏÏÏÏÏÏÏÏÏÏÏÏÏÏÏÏÏÏÏÏÏÏÏÏÏÏÏÏÏ 121 150
6.75% due 2005 ÏÏÏÏÏÏÏÏÏÏÏÏÏÏÏÏÏÏÏÏÏÏÏÏÏÏÏÏÏÏÏÏÏÏÏÏÏÏÏÏÏÏÏÏÏÏÏÏÏÏÏÏÏÏÏÏÏÏÏÏÏÏÏÏÏÏÏÏÏÏÏÏÏÏÏÏÏÏÏÏÏÏÏÏÏÏ 191 300
6.875% due 2007 ÏÏÏÏÏÏÏÏÏÏÏÏÏÏÏÏÏÏÏÏÏÏÏÏÏÏÏÏÏÏÏÏÏÏÏÏÏÏÏÏÏÏÏÏÏÏÏÏÏÏÏÏÏÏÏÏÏÏÏÏÏÏÏÏÏÏÏÏÏÏÏÏÏÏÏÏÏÏÏÏÏÏÏÏÏ 250 250
7.30% due 2007 ÏÏÏÏÏÏÏÏÏÏÏÏÏÏÏÏÏÏÏÏÏÏÏÏÏÏÏÏÏÏÏÏÏÏÏÏÏÏÏÏÏÏÏÏÏÏÏÏÏÏÏÏÏÏÏÏÏÏÏÏÏÏÏÏÏÏÏÏÏÏÏÏÏÏÏÏÏÏÏÏÏÏÏÏÏÏ 200 200
7.50% due 2026 ÏÏÏÏÏÏÏÏÏÏÏÏÏÏÏÏÏÏÏÏÏÏÏÏÏÏÏÏÏÏÏÏÏÏÏÏÏÏÏÏÏÏÏÏÏÏÏÏÏÏÏÏÏÏÏÏÏÏÏÏÏÏÏÏÏÏÏÏÏÏÏÏÏÏÏÏÏÏÏÏÏÏÏÏÏÏ 200 200
Senior contingent convertible debt 1.50% due 2021ÏÏÏÏÏÏÏÏÏÏÏÏÏÏÏÏÏÏÏÏÏÏÏÏÏÏÏÏÏÏÏÏÏÏÏÏÏÏÏÏÏÏÏÏÏÏÏÏÏÏÏÏÏÏÏÏÏ 1,100 Ì
Medium-term notes ÏÏÏÏÏÏÏÏÏÏÏÏÏÏÏÏÏÏÏÏÏÏÏÏÏÏÏÏÏÏÏÏÏÏÏÏÏÏÏÏÏÏÏÏÏÏÏÏÏÏÏÏÏÏÏÏÏÏÏÏÏÏÏÏÏÏÏÏÏÏÏÏÏÏÏÏÏÏÏÏÏÏÏÏÏÏ 3,215 4,634
Capitalized lease obligations, mortgage indebtedness and other ÏÏÏÏÏÏÏÏÏÏÏÏÏÏÏÏÏÏÏÏÏÏÏÏÏÏÏÏÏÏÏÏÏÏÏÏÏÏÏÏÏÏÏÏÏ 142 122
Subtotal ÏÏÏÏÏÏÏÏÏÏÏÏÏÏÏÏÏÏÏÏÏÏÏÏÏÏÏÏÏÏÏÏÏÏÏÏÏÏÏÏÏÏÏÏÏÏÏÏÏÏÏÏÏÏÏÏÏÏÏÏÏÏÏÏÏÏÏÏÏÏÏÏÏÏÏÏÏÏÏÏÏÏÏÏÏÏÏÏÏÏ 6,074 6,563
Subsidiaries
Fixed-rate subordinated notes
6.00% due 2003 ÏÏÏÏÏÏÏÏÏÏÏÏÏÏÏÏÏÏÏÏÏÏÏÏÏÏÏÏÏÏÏÏÏÏÏÏÏÏÏÏÏÏÏÏÏÏÏÏÏÏÏÏÏÏÏÏÏÏÏÏÏÏÏÏÏÏÏÏÏÏÏÏÏÏÏÏÏÏÏÏÏÏÏÏÏÏ 79 100
6.375% due 2004 ÏÏÏÏÏÏÏÏÏÏÏÏÏÏÏÏÏÏÏÏÏÏÏÏÏÏÏÏÏÏÏÏÏÏÏÏÏÏÏÏÏÏÏÏÏÏÏÏÏÏÏÏÏÏÏÏÏÏÏÏÏÏÏÏÏÏÏÏÏÏÏÏÏÏÏÏÏÏÏÏÏÏÏÏÏ 75 75
6.375% due 2004 ÏÏÏÏÏÏÏÏÏÏÏÏÏÏÏÏÏÏÏÏÏÏÏÏÏÏÏÏÏÏÏÏÏÏÏÏÏÏÏÏÏÏÏÏÏÏÏÏÏÏÏÏÏÏÏÏÏÏÏÏÏÏÏÏÏÏÏÏÏÏÏÏÏÏÏÏÏÏÏÏÏÏÏÏÏ 150 150
7.55% due 2004 ÏÏÏÏÏÏÏÏÏÏÏÏÏÏÏÏÏÏÏÏÏÏÏÏÏÏÏÏÏÏÏÏÏÏÏÏÏÏÏÏÏÏÏÏÏÏÏÏÏÏÏÏÏÏÏÏÏÏÏÏÏÏÏÏÏÏÏÏÏÏÏÏÏÏÏÏÏÏÏÏÏÏÏÏÏÏ 100 100
8.35% due 2004 ÏÏÏÏÏÏÏÏÏÏÏÏÏÏÏÏÏÏÏÏÏÏÏÏÏÏÏÏÏÏÏÏÏÏÏÏÏÏÏÏÏÏÏÏÏÏÏÏÏÏÏÏÏÏÏÏÏÏÏÏÏÏÏÏÏÏÏÏÏÏÏÏÏÏÏÏÏÏÏÏÏÏÏÏÏÏ 100 100
7.30% due 2005 ÏÏÏÏÏÏÏÏÏÏÏÏÏÏÏÏÏÏÏÏÏÏÏÏÏÏÏÏÏÏÏÏÏÏÏÏÏÏÏÏÏÏÏÏÏÏÏÏÏÏÏÏÏÏÏÏÏÏÏÏÏÏÏÏÏÏÏÏÏÏÏÏÏÏÏÏÏÏÏÏÏÏÏÏÏÏ 100 100
6.875% due 2006 ÏÏÏÏÏÏÏÏÏÏÏÏÏÏÏÏÏÏÏÏÏÏÏÏÏÏÏÏÏÏÏÏÏÏÏÏÏÏÏÏÏÏÏÏÏÏÏÏÏÏÏÏÏÏÏÏÏÏÏÏÏÏÏÏÏÏÏÏÏÏÏÏÏÏÏÏÏÏÏÏÏÏÏÏÏ 125 125
6.625% due 2006 ÏÏÏÏÏÏÏÏÏÏÏÏÏÏÏÏÏÏÏÏÏÏÏÏÏÏÏÏÏÏÏÏÏÏÏÏÏÏÏÏÏÏÏÏÏÏÏÏÏÏÏÏÏÏÏÏÏÏÏÏÏÏÏÏÏÏÏÏÏÏÏÏÏÏÏÏÏÏÏÏÏÏÏÏÏ 100 100
6.50% due 2008 ÏÏÏÏÏÏÏÏÏÏÏÏÏÏÏÏÏÏÏÏÏÏÏÏÏÏÏÏÏÏÏÏÏÏÏÏÏÏÏÏÏÏÏÏÏÏÏÏÏÏÏÏÏÏÏÏÏÏÏÏÏÏÏÏÏÏÏÏÏÏÏÏÏÏÏÏÏÏÏÏÏÏÏÏÏÏ 300 300
6.30% due 2008 ÏÏÏÏÏÏÏÏÏÏÏÏÏÏÏÏÏÏÏÏÏÏÏÏÏÏÏÏÏÏÏÏÏÏÏÏÏÏÏÏÏÏÏÏÏÏÏÏÏÏÏÏÏÏÏÏÏÏÏÏÏÏÏÏÏÏÏÏÏÏÏÏÏÏÏÏÏÏÏÏÏÏÏÏÏÏ 300 300
5.70% due 2008 ÏÏÏÏÏÏÏÏÏÏÏÏÏÏÏÏÏÏÏÏÏÏÏÏÏÏÏÏÏÏÏÏÏÏÏÏÏÏÏÏÏÏÏÏÏÏÏÏÏÏÏÏÏÏÏÏÏÏÏÏÏÏÏÏÏÏÏÏÏÏÏÏÏÏÏÏÏÏÏÏÏÏÏÏÏÏ 400 400
7.125% due 2009 ÏÏÏÏÏÏÏÏÏÏÏÏÏÏÏÏÏÏÏÏÏÏÏÏÏÏÏÏÏÏÏÏÏÏÏÏÏÏÏÏÏÏÏÏÏÏÏÏÏÏÏÏÏÏÏÏÏÏÏÏÏÏÏÏÏÏÏÏÏÏÏÏÏÏÏÏÏÏÏÏÏÏÏÏÏ 500 500
7.80% due 2010 ÏÏÏÏÏÏÏÏÏÏÏÏÏÏÏÏÏÏÏÏÏÏÏÏÏÏÏÏÏÏÏÏÏÏÏÏÏÏÏÏÏÏÏÏÏÏÏÏÏÏÏÏÏÏÏÏÏÏÏÏÏÏÏÏÏÏÏÏÏÏÏÏÏÏÏÏÏÏÏÏÏÏÏÏÏÏ 300 300
6.375% due 2011 ÏÏÏÏÏÏÏÏÏÏÏÏÏÏÏÏÏÏÏÏÏÏÏÏÏÏÏÏÏÏÏÏÏÏÏÏÏÏÏÏÏÏÏÏÏÏÏÏÏÏÏÏÏÏÏÏÏÏÏÏÏÏÏÏÏÏÏÏÏÏÏÏÏÏÏÏÏÏÏÏÏÏÏÏÏ 1,500 Ì
Federal Home Loan Bank advances ÏÏÏÏÏÏÏÏÏÏÏÏÏÏÏÏÏÏÏÏÏÏÏÏÏÏÏÏÏÏÏÏÏÏÏÏÏÏÏÏÏÏÏÏÏÏÏÏÏÏÏÏÏÏÏÏÏÏÏÏÏÏÏÏÏÏÏÏÏÏÏ 7,196 2,753
Bank notesÏÏÏÏÏÏÏÏÏÏÏÏÏÏÏÏÏÏÏÏÏÏÏÏÏÏÏÏÏÏÏÏÏÏÏÏÏÏÏÏÏÏÏÏÏÏÏÏÏÏÏÏÏÏÏÏÏÏÏÏÏÏÏÏÏÏÏÏÏÏÏÏÏÏÏÏÏÏÏÏÏÏÏÏÏÏÏÏÏÏÏÏÏÏ 7,550 9,300
Euro medium-term notes due 2004ÏÏÏÏÏÏÏÏÏÏÏÏÏÏÏÏÏÏÏÏÏÏÏÏÏÏÏÏÏÏÏÏÏÏÏÏÏÏÏÏÏÏÏÏÏÏÏÏÏÏÏÏÏÏÏÏÏÏÏÏÏÏÏÏÏÏÏÏÏÏÏÏ 400 400
Capitalized lease obligations, mortgage indebtedness and other ÏÏÏÏÏÏÏÏÏÏÏÏÏÏÏÏÏÏÏÏÏÏÏÏÏÏÏÏÏÏÏÏÏÏÏÏÏÏÏÏÏÏÏÏÏ 367 210
Total ÏÏÏÏÏÏÏÏÏÏÏÏÏÏÏÏÏÏÏÏÏÏÏÏÏÏÏÏÏÏÏÏÏÏÏÏÏÏÏÏÏÏÏÏÏÏÏÏÏÏÏÏÏÏÏÏÏÏÏÏÏÏÏÏÏÏÏÏÏÏÏÏÏÏÏÏÏÏÏÏÏÏÏÏÏÏÏÏÏÏÏÏÏ $25,716 $21,876
In August 2001, the Company issued $1.1 billion of weighted-average interest rate of MTNs at December 31,
senior contingent convertible debt due August 6, 2021. The 2001, was 3.85 percent.
interest rate is 1.50% per annum. The debt would be Federal Home Loan Bank (""FHLB'') advances
convertible into the Company's stock only if the Company's outstanding at December 31, 2001, mature from
stock price increases to the contractual strike price. The February 2002 through October 2026. The advances bear
convertible strike price decreases over the term of the Ñxed or Öoating interest rates ranging from 0.50 percent to
bond. The notes are callable in August 2003 and putable in 8.25 percent. The Company has an arrangement with the
August 2002 and on speciÑed dates thereafter. FHLB whereby based on collateral available (residential
In July 2001, the Company's subsidiary U.S. Bank and commercial mortgages), the Company could have
National Association issued $1.5 billion of Ñxed-rate borrowed an additional $10.6 billion at December 31, 2001.
subordinated notes due August 1, 2011. The interest rate is The weighted-average interest rate of FHLB advances at
6.375% per annum. December 31, 2001, was 3.36 percent.
Medium-term notes (""MTNs'') outstanding at Bank notes outstanding at December 31, 2001, mature
December 31, 2001, mature from January 2002 through from January 2002 through November 2005. The Bank
December 2004. The MTNs bear Ñxed or Öoating interest notes bear Ñxed or Öoating interest rates ranging from
rates ranging from 2.01 percent to 7.50 percent. The 1.79 percent to 6.30 percent. The weighted-average interest
U.S. Bancorp
Note 13
68

rate of Bank notes at December 31, 2001, was 2.69 percent. amount of junior subordinated deferrable interest
Euro medium-term notes outstanding at December 31, debentures (the ""Debentures'') of the Company. The
2001, bear Öoating rate interest at three-month LIBOR plus Debentures are the sole assets of the Trusts and are
.15 percent. The interest rate at December 31, 2001, was eliminated, along with the related income statement eÅects,
2.58 percent. in the consolidated Ñnancial statements.
The Company's obligations under the Debentures andMaturities of long-term debt outstanding at December 31,
related documents, taken together, constitute a full and2001, were:
unconditional guarantee by the Company of the obligationsParent
of the Trusts. The guarantee covers the distributions and(Dollars in Millions) Consolidated Company
payments on liquidation or redemption of the Trust2002 ÏÏÏÏÏÏÏÏÏÏÏÏÏÏÏÏÏÏÏÏÏÏÏÏÏÏÏ $ 6,789 $1,465
Preferred Securities, but only to the extent of funds held by2003 ÏÏÏÏÏÏÏÏÏÏÏÏÏÏÏÏÏÏÏÏÏÏÏÏÏÏÏ 3,970 1,545
the Trusts.2004 ÏÏÏÏÏÏÏÏÏÏÏÏÏÏÏÏÏÏÏÏÏÏÏÏÏÏÏ 5,529 916
2005 ÏÏÏÏÏÏÏÏÏÏÏÏÏÏÏÏÏÏÏÏÏÏÏÏÏÏÏ 3,533 336 The Trust Preferred Securities are mandatorily2006 ÏÏÏÏÏÏÏÏÏÏÏÏÏÏÏÏÏÏÏÏÏÏÏÏÏÏÏ 242 3 redeemable upon the maturity of the Debentures, or uponThereafter ÏÏÏÏÏÏÏÏÏÏÏÏÏÏÏÏÏÏÏÏÏÏ 5,653 1,809
earlier redemption as provided in the indentures. TheTotal ÏÏÏÏÏÏÏÏÏÏÏÏÏÏÏÏÏÏÏÏÏÏÏÏÏÏÏ $25,716 $6,074 Company has the right to redeem retail Debentures in
whole or in part on or after speciÑc dates, at a redemption
Company-obligated Mandatorily price speciÑed in the indentures plus any accrued but
Redeemable Preferred Securities of unpaid interest to the redemption date. The Company has
Subsidiary Trusts Holding Solely the the right to redeem institutional Debentures in whole, (but
Junior Subordinated Debentures of not in part), on or after speciÑc dates, at a redemption
the Parent Company price speciÑed in the indentures plus any accrued but
unpaid interest to the redemption date. The Trust PreferredThe Company has issued $2.9 billion of company-
Securities are redeemable in whole or in part in 2003, 2006obligated mandatorily redeemable preferred securities of
and 2007 in the amounts of $350 million, $2,250 millionsubsidiary trusts holding solely the junior subordinated
and $300 million, respectively.debentures of the parent company (""Trust Preferred
The Trust Preferred Securities qualify as tier I capitalSecurities'') through nine separate issuances by nine wholly
of the Company for regulatory capital purposes. Theowned subsidiary grantor trusts (""Trusts''). The Trust
Company used the proceeds from the sales of thePreferred Securities accrue and pay distributions periodically
Debentures for general corporate purposes.at speciÑed rates as provided in the indentures. The Trusts
used the net proceeds from the oÅerings to purchase a like
The following table is a summary of the Trust Preferred Securities as of December 31, 2001:
TrustPreferred
Issuance Securities Debentures Rate Rate at Maturity RedemptionIssuance Trust (Dollars in Millions) Date Amount Amount Type(a) 12/31/01 Date Date(b)
Retail
USB Capital VÏÏÏÏÏÏÏÏÏÏÏÏÏÏÏÏÏ 12/2001 $300 $309 Fixed 7.25% 12/2031 12/07/2006
USB Capital IV ÏÏÏÏÏÏÏÏÏÏÏÏÏÏÏÏ 11/2001 500 515 Fixed 7.35% 11/2031 11/01/2006
USB Capital III ÏÏÏÏÏÏÏÏÏÏÏÏÏÏÏÏ 05/2001 700 722 Fixed 7.75% 05/2031 05/04/2006
USB Capital II ÏÏÏÏÏÏÏÏÏÏÏÏÏÏÏÏÏ 03/1998 350 361 Fixed 7.20% 04/2028 04/01/2003
Institutional
Star Capital I ÏÏÏÏÏÏÏÏÏÏÏÏÏÏÏÏÏÏ 06/1997 150 155 Variable 2.64% 06/2027 06/15/2007
Mercantile Capital Trust IÏÏÏÏÏÏÏ 02/1997 150 155 Variable 3.08% 02/2027 02/01/2007
USB Capital I ÏÏÏÏÏÏÏÏÏÏÏÏÏÏÏÏÏ 12/1996 300 309 Fixed 8.27% 12/2026 12/15/2006
Firstar Capital Trust I ÏÏÏÏÏÏÏÏÏÏ 12/1996 150 155 Fixed 8.32% 12/2026 12/15/2006
FBS Capital IÏÏÏÏÏÏÏÏÏÏÏÏÏÏÏÏÏÏ 11/1996 300 309 Fixed 8.09% 11/2026 11/15/2006
(a) The variable rate Trust Preferred Securities re-price quarterly.
(b) Earliest date of redemption.
U.S. Bancorp
Note 14
69

On February 16, 2000, USBM's Board of DirectorsShareholders' Equityauthorized the repurchase of up to $2.5 billion of its
At December 31, 2001 and 2000, the Company had common stock over a two-year period ending March 31,authority to issue 4 billion and 2 billion shares of common 2002. This USBM repurchase program replaced a programstock, respectively, and 10 million shares of preferred stock. that was scheduled to expire on March 31, 2000. OnThe Company had 1,951.7 million and 1,902.1 million April 11, 2000, Firstar's Board of Directors approved ashares of common stock outstanding at December 31, 2001 common stock repurchase program of 100 million shares.and 2000, respectively. At December 31, 2001, the The stock repurchase programs of Firstar and USBM wereCompany had 279.1 million shares of common stock rescinded on October 4, 2000, and January 17, 2001,reserved for future issuances. These shares are primarily respectively, in connection with the planned merger of thereserved for stock option plans, dividend reinvestment plans formerly separate companies. On July 17, 2001, theand deferred compensation plans. In connection with the Company's Board of Directors authorized the repurchase ofmerger of Firstar and USBM, the number of authorized up to 56.4 million shares of the Company's common stockcommon shares for U.S. Bancorp was increased from to replace shares issued in connection with the July 24,2 billion to 4 billion eÅective February 27, 2001. 2001 acquisition of NOVA Corporation. The stockAdditionally, the par value of the Company's common repurchase authorization will expire on July 23, 2003.stock was reduced from $1.25 per share to $.01 per share. Under this program the Company has repurchased 19.7
The Company has a Preferred Share Purchase Rights million shares for $467.9 million in 2001. The CompanyPlan intended to preserve the long-term value of the had forward contracts to purchase 26.7 million sharesCompany by discouraging a hostile takeover of the within this authorization. These contracts were settled inCompany. Under the plan, each share of common stock January of 2002. On December 18, 2001, the Board ofcarries a right to purchase one one-thousandth of a share of Directors approved an authorization to repurchase anpreferred stock. The rights become exercisable in certain additional 100 million shares of outstanding common stocklimited circumstances involving a potential business over the following 24 months.combination transaction or an acquisition of shares of the
The following table summarizes the Company's commonCompany and are exercisable at a price of $100 per right,stock repurchased in each of the last three years:subject to adjustment. Following certain other events, each(Dollars and Shares in Millions) Shares Valueright entitles its holder to purchase for $100 an amount of
common stock of the Company, or, in certain 2001ÏÏÏÏÏÏÏÏÏÏÏÏÏÏÏÏÏÏÏÏÏÏÏÏÏÏÏÏÏÏÏÏ 19.7 $ 467.9
2000ÏÏÏÏÏÏÏÏÏÏÏÏÏÏÏÏÏÏÏÏÏÏÏÏÏÏÏÏÏÏÏÏ 58.6 1,182.2circumstances, securities of the acquirer, having a then-1999ÏÏÏÏÏÏÏÏÏÏÏÏÏÏÏÏÏÏÏÏÏÏÏÏÏÏÏÏÏÏÏÏ 44.6 1,187.9current market value of twice the exercise price of the
right. The dilutive eÅect of the rights on the acquiring USBM oÅered employees and directors an Employee
company is intended to encourage it to negotiate with the Stock Purchase Plan (""ESPP'') that permitted all eligible
Company's Board of Directors prior to attempting a employees with at least one year of service and directors to
takeover. If the Board of Directors believes a proposed purchase common stock. In connection with the merger
acquisition is in the best interests of the Company and its with Firstar, the ESPP was terminated eÅective October 13,
shareholders, the Board may amend the plan or redeem the 2000.
rights for a nominal amount in order to permit the USBM's Dividend Reinvestment Plan providing for
acquisition to be completed without interference from the automatic reinvestment of dividends and optional cash
plan. Until a right is exercised, the holder of a right has no purchases was suspended on November 9, 2000, following
rights as a shareholder of the Company. The rights expire the announcement of the deÑnitive agreement to merge
on February 27, 2011. with Firstar.
The Company issued 57.2 million and 18.2 million
shares of common stock with an aggregate value of
$1.9 billion and $298 million in connection with purchase
acquisitions during 2001 and 2000, respectively.
U.S. Bancorp
Note 15
70

Shareholders' equity is aÅected by transactions and valuations of asset and liability positions that require adjustments to
Accumulated Other Comprehensive Income. The reconciliation of transactions aÅecting Accumulated Other Comprehensive
Income included in shareholders' equity for the years ended December 31, is as follows:
(Dollars in Millions) Pre-tax Tax-eÅect Net-of-tax
2001
Unrealized gain on securities available-for-saleÏÏÏÏÏÏÏÏÏÏÏÏÏÏÏÏÏÏÏÏÏÏÏÏÏÏÏÏÏÏÏÏÏÏÏÏÏÏÏÏÏÏÏÏÏ $ 194.5 $ (77.6) $ 116.9
Unrealized gain on derivatives ÏÏÏÏÏÏÏÏÏÏÏÏÏÏÏÏÏÏÏÏÏÏÏÏÏÏÏÏÏÏÏÏÏÏÏÏÏÏÏÏÏÏÏÏÏÏÏÏÏÏÏÏÏÏÏÏÏÏÏÏ 106.0 (40.3) 65.7
Realized gain on derivatives ÏÏÏÏÏÏÏÏÏÏÏÏÏÏÏÏÏÏÏÏÏÏÏÏÏÏÏÏÏÏÏÏÏÏÏÏÏÏÏÏÏÏÏÏÏÏÏÏÏÏÏÏÏÏÏÏÏÏÏÏÏÏ 42.4 (16.1) 26.3
ReclassiÑcation adjustment for gains realized in net income ÏÏÏÏÏÏÏÏÏÏÏÏÏÏÏÏÏÏÏÏÏÏÏÏÏÏÏÏÏÏÏÏÏ (333.1) 126.6 (206.5)
Foreign currency translation adjustments ÏÏÏÏÏÏÏÏÏÏÏÏÏÏÏÏÏÏÏÏÏÏÏÏÏÏÏÏÏÏÏÏÏÏÏÏÏÏÏÏÏÏÏÏÏÏÏÏÏÏ (4.0) 1.5 (2.5)
Total ÏÏÏÏÏÏÏÏÏÏÏÏÏÏÏÏÏÏÏÏÏÏÏÏÏÏÏÏÏÏÏÏÏÏÏÏÏÏÏÏÏÏÏÏÏÏÏÏÏÏÏÏÏÏÏÏÏÏÏÏÏÏÏÏÏÏÏÏÏÏÏÏÏÏÏÏÏÏÏÏ $ 5.8 $ (5.9) $ (.1)
2000
Unrealized gain on securities available-for-saleÏÏÏÏÏÏÏÏÏÏÏÏÏÏÏÏÏÏÏÏÏÏÏÏÏÏÏÏÏÏÏÏÏÏÏÏÏÏÏÏÏÏÏÏÏ $ 436.0 $(157.8) $ 278.2
ReclassiÑcation adjustment for gains realized in net income ÏÏÏÏÏÏÏÏÏÏÏÏÏÏÏÏÏÏÏÏÏÏÏÏÏÏÏÏÏÏÏÏÏ (41.6) 15.8 (25.8)
Foreign currency translation adjustments ÏÏÏÏÏÏÏÏÏÏÏÏÏÏÏÏÏÏÏÏÏÏÏÏÏÏÏÏÏÏÏÏÏÏÏÏÏÏÏÏÏÏÏÏÏÏÏÏÏÏ (.5) .2 (.3)
Total ÏÏÏÏÏÏÏÏÏÏÏÏÏÏÏÏÏÏÏÏÏÏÏÏÏÏÏÏÏÏÏÏÏÏÏÏÏÏÏÏÏÏÏÏÏÏÏÏÏÏÏÏÏÏÏÏÏÏÏÏÏÏÏÏÏÏÏÏÏÏÏÏÏÏÏÏÏÏÏÏ $ 393.9 $(141.8) $ 252.1
1999
Unrealized loss on securities available-for-saleÏÏÏÏÏÏÏÏÏÏÏÏÏÏÏÏÏÏÏÏÏÏÏÏÏÏÏÏÏÏÏÏÏÏÏÏÏÏÏÏÏÏÏÏÏ $(743.9) $ 268.2 $(475.7)
ReclassiÑcation adjustment for losses realized in net income ÏÏÏÏÏÏÏÏÏÏÏÏÏÏÏÏÏÏÏÏÏÏÏÏÏÏÏÏÏÏÏÏ 163.9 (57.7) 106.2
Total ÏÏÏÏÏÏÏÏÏÏÏÏÏÏÏÏÏÏÏÏÏÏÏÏÏÏÏÏÏÏÏÏÏÏÏÏÏÏÏÏÏÏÏÏÏÏÏÏÏÏÏÏÏÏÏÏÏÏÏÏÏÏÏÏÏÏÏÏÏÏÏÏÏÏÏÏÏÏÏÏ $(580.0) $ 210.5 $(369.5)
Earnings Per Share
The components of earnings per share were:
(Dollars and Shares in Millions, Except Per Share Data) 2001 2000 1999
Net income ÏÏÏÏÏÏÏÏÏÏÏÏÏÏÏÏÏÏÏÏÏÏÏÏÏÏÏÏÏÏÏÏÏÏÏÏÏÏÏÏÏÏÏÏÏÏÏÏÏÏÏÏÏÏÏÏÏÏÏÏÏÏÏÏÏÏÏÏÏÏÏÏÏÏÏÏÏ $1,706.5 $2,875.6 $2,381.8
Weighted-average common shares outstandingÏÏÏÏÏÏÏÏÏÏÏÏÏÏÏÏÏÏÏÏÏÏÏÏÏÏÏÏÏÏÏÏÏÏÏÏÏÏÏÏÏÏÏÏ 1,927.9 1,906.0 1,907.8
Net eÅect of the assumed purchase of stock based on the treasury stock
method for options and stock plansÏÏÏÏÏÏÏÏÏÏÏÏÏÏÏÏÏÏÏÏÏÏÏÏÏÏÏÏÏÏÏÏÏÏÏÏÏÏÏÏÏÏÏÏÏÏÏÏÏÏÏÏÏ 11.6 12.5 22.2
Dilutive common shares outstanding ÏÏÏÏÏÏÏÏÏÏÏÏÏÏÏÏÏÏÏÏÏÏÏÏÏÏÏÏÏÏÏÏÏÏÏÏÏÏÏÏÏÏÏÏÏÏÏÏÏÏÏÏÏÏ 1,939.5 1,918.5 1,930.0
Earnings per share
BasicÏÏÏÏÏÏÏÏÏÏÏÏÏÏÏÏÏÏÏÏÏÏÏÏÏÏÏÏÏÏÏÏÏÏÏÏÏÏÏÏÏÏÏÏÏÏÏÏÏÏÏÏÏÏÏÏÏÏÏÏÏÏÏÏÏÏÏÏÏÏÏÏÏÏÏÏÏÏÏÏÏ $ .89 $ 1.51 $ 1.25
Diluted ÏÏÏÏÏÏÏÏÏÏÏÏÏÏÏÏÏÏÏÏÏÏÏÏÏÏÏÏÏÏÏÏÏÏÏÏÏÏÏÏÏÏÏÏÏÏÏÏÏÏÏÏÏÏÏÏÏÏÏÏÏÏÏÏÏÏÏÏÏÏÏÏÏÏÏÏÏÏÏ $ .88 $ 1.50 $ 1.23
As a result of the Firstar and USBM merger, theEmployee BeneÑtsCompany maintained two diÅerent qualiÑed pension plans,
Retirement Plans Pension beneÑts are provided to with three diÅerent pension beneÑt structures during 2001:substantially all employees based on years of service and the former USBM's cash balance pension beneÑt structure,employees' compensation while employed with the a Ñnal average pay beneÑt structure for the former FirstarCompany. Employees are fully vested after Ñve years of organization, and a cash balance pension beneÑt structureservice. The Company's funding policy is to contribute related to the Mercantile acquisition. The two pensionamounts to its plans suÇcient to meet the minimum plans were merged as of January 1, 2002, under a new Ñnalfunding requirements of the Employee Retirement Income average pay beneÑt structure; however, the beneÑt structureSecurity Act of 1974, plus such additional amounts as the of the new plan does not become eÅective for theCompany determines to be appropriate. The actuarial cost Mercantile acquisition until January 1, 2003. Under the newmethod used to compute the pension liabilities and expense plan's beneÑt structure, a participant's future retirementis the projected unit credit method. Prior to their beneÑts are based on a participant's highest Ñve-year averageacquisition dates, employees of certain acquired companies annual compensation during his or her last 10 years beforewere covered by separate, noncontributory pension plans retirement or termination from the Company. Generally,that provided beneÑts based on years of service and under the two previous cash balance pension beneÑtcompensation. Generally, the Company merges plans of structures the participants' earned retirement beneÑts wereacquired companies into its existing pension plans when it based on their average compensation over their career.becomes practicable. Retirement beneÑts under the former Firstar beneÑt
U.S. Bancorp
Note 16
Note 17
71

structure were earned based on Ñnal average pay and years Post-Retirement Medical Plans In addition to providing
of service, similar to the new plan. Plan assets primarily pension beneÑts, the Company provides health care and
consist of various equity mutual funds, listed stocks and death beneÑts to certain retired employees through several
other miscellaneous assets. retiree medical programs. As a result of the merger of
The Company also maintains several unfunded, non- USBM with Firstar, there were three major retiree medical
qualiÑed, supplemental executive retirement programs that programs in place during 2001 with various terms andprovide additional defined pension benefits for senior subsidy schedules. EÅective January 1, 2002, the Companymanagers and executive employees. Because all the non- adopted one retiree medical program for all future retirees.qualified plans are unfunded, the aggregate accumulated For certain eligible employees, the provisions of the USBMbenefit obligations exceed the assets. A supplemental executive retiree medical plan and the Mercantile retiree medical planretirement plan of USBM was frozen for substantially all will remain in place until December 31, 2002. Generally, allparticipants as of September 30, 2001, but with service credit employees may become eligible for retiree health carerunning through December 31, 2001. The assumptions used in beneÑts by meeting deÑned age and service requirements.computing the present value of the accumulated benefit
The Company may also subsidize the cost of coverage forobligation, the projected benefit obligation and net pension
employees meeting certain age and service requirements.expense are substantially consistent with those assumptions
The medical plan contains other cost-sharing features suchused for the funded qualified plans. The Company anticipates
as deductibles and coinsurance. The estimated cost of theserecognizing curtailment gains of approximately $11.7 million
retiree beneÑt payments is accrued during the employees'in early 2002 in connection with changes to non-qualified
active service.pension plans.
Information presented in the four tables below reÖects a measurement date of September 30.
The following table sets forth the components of net periodic beneÑt cost for the retirement plans:
Pension Plans Post-Retirement Medical Plans
(Dollars in Millions) 2001 2000 1999 2001 2000 1999
Components of net periodic beneÑt cost
Service cost ÏÏÏÏÏÏÏÏÏÏÏÏÏÏÏÏÏÏÏÏÏÏÏÏÏÏÏÏÏÏÏÏÏÏÏÏÏÏÏÏÏÏ $ 61.0 $ 65.4 $ 70.1 $ 2.1 $ 2.0 $ 3.8
Interest cost ÏÏÏÏÏÏÏÏÏÏÏÏÏÏÏÏÏÏÏÏÏÏÏÏÏÏÏÏÏÏÏÏÏÏÏÏÏÏÏÏÏÏ 118.7 117.3 107.1 17.9 16.3 16.5
Expected return on plan assets ÏÏÏÏÏÏÏÏÏÏÏÏÏÏÏÏÏÏÏÏÏÏÏÏ (232.6) (201.6) (177.5) (1.0) (.6) (.5)
Net amortization and deferral ÏÏÏÏÏÏÏÏÏÏÏÏÏÏÏÏÏÏÏÏÏÏÏÏÏÏ (10.7) (13.2) 1.3 .2 .2 2.0
Recognized actuarial loss ÏÏÏÏÏÏÏÏÏÏÏÏÏÏÏÏÏÏÏÏÏÏÏÏÏÏÏÏÏ (1.2) .7 1.9 (.1) (1.4) .2
Net periodic beneÑt costÏÏÏÏÏÏÏÏÏÏÏÏÏÏÏÏÏÏÏÏÏÏÏÏÏÏÏÏÏÏÏÏÏÏ (64.8) (31.4) 2.9 19.1 16.5 22.0
Curtailment and settlement (gain) loss ÏÏÏÏÏÏÏÏÏÏÏÏÏÏÏÏÏ Ì (17.0) (6.2) Ì 10.3 Ì
Net periodic beneÑt cost after curtailment and
settlement (gain) lossÏÏÏÏÏÏÏÏÏÏÏÏÏÏÏÏÏÏÏÏÏÏÏÏÏÏÏÏÏÏÏÏÏÏ $ (64.8) (48.4) $ (3.3) $19.1 $26.8 $22.0
The following table sets forth the weighted average plan assumptions and other data:
USBM Firstar
(Dollars in Millions) 2001 2000 1999 2001 2000 1999
Pension plan actuarial computations
Discount rate in determining beneÑt obligations ÏÏÏÏÏÏÏÏÏÏÏÏÏÏÏÏ 7.5% 7.8% 7.5% 7.5% 8.0% 6.6%
Expected long-term return on plan assets(b) ÏÏÏÏÏÏÏÏÏÏÏÏÏÏÏÏÏÏ 11.0 9.5 9.5 12.2 12.2 11.4
Rate of increase in future compensation ÏÏÏÏÏÏÏÏÏÏÏÏÏÏÏÏÏÏÏÏÏÏÏ 3.5 5.6 5.6 3.5 4.0 4.1
Post-retirement medical plan actuarial computations
Discount rate in determining beneÑt obligations ÏÏÏÏÏÏÏÏÏÏÏÏÏÏÏÏ 7.5% 7.8% 7.5% 7.5% 8.0% 6.8%
Expected long-term return on plan assetsÏÏÏÏÏÏÏÏÏÏÏÏÏÏÏÏÏÏÏÏÏÏ 5.0 5.0 5.0 * * *
Health care cost trend rate(a)
Prior to age 65 ÏÏÏÏÏÏÏÏÏÏÏÏÏÏÏÏÏÏÏÏÏÏÏÏÏÏÏÏÏÏÏÏÏÏÏÏÏÏÏÏÏÏÏ 10.5% 7.7% 7.0% 10.5% 7.5% 7.7%
After age 65ÏÏÏÏÏÏÏÏÏÏÏÏÏÏÏÏÏÏÏÏÏÏÏÏÏÏÏÏÏÏÏÏÏÏÏÏÏÏÏÏÏÏÏÏÏÏ 13.0 7.7 5.5 13.0 7.5 7.7
EÅect of one percent increase in health care cost trend rate
Service and interest costs ÏÏÏÏÏÏÏÏÏÏÏÏÏÏÏÏÏÏÏÏÏÏÏÏÏÏÏÏÏÏÏÏÏÏÏÏ $ 1.2 $ 1.0 $ 1.3 $ .4 $ .4 $ .4
Accumulated post-retirement beneÑt obligation ÏÏÏÏÏÏÏÏÏÏÏÏÏÏÏÏÏ 13.1 13.1 12.4 6.0 5.2 4.0
EÅect of one percent decrease in health care cost trend rate
Service and interest costs ÏÏÏÏÏÏÏÏÏÏÏÏÏÏÏÏÏÏÏÏÏÏÏÏÏÏÏÏÏÏÏÏÏÏÏÏ $ (1.0) $ (.9) $ (1.0) $ (.4) $ (.4) $ (.4)
Accumulated post-retirement beneÑt obligation ÏÏÏÏÏÏÏÏÏÏÏÏÏÏÏÏÏ (13.6) (11.6) (10.9) (5.7) (4.6) (3.6)
* The Firstar plan had no assets as of December 31, 2001, 2000 and 1999.
(a) The pre-65 and post-65 rates are assumed to decrease gradually to 5.5% and 6.0% respectively by 2011 and remain at these levels thereafter.
(b) In connection with the merger of Firstar and USBM, the asset management practices and investment strategies of the plan were conformed. At December 31, 2001, the investment
asset allocation was weighted toward equities and diversiÑed by industry and companies with varying market capitalization levels.
U.S. Bancorp72

The following table summarizes beneÑt obligation and plan asset activity for the retirement plans:
Pension Plans Post-Retirement Medical Plans
(Dollars in Millions) 2001 2000 2001 2000
Change in beneÑt obligation
BeneÑt obligation at beginning of measurement period ÏÏÏÏÏÏÏÏÏÏÏÏÏÏÏÏ $1,595.4 $1,580.3 $ 244.1 $ 225.0
Service cost ÏÏÏÏÏÏÏÏÏÏÏÏÏÏÏÏÏÏÏÏÏÏÏÏÏÏÏÏÏÏÏÏÏÏÏÏÏÏÏÏÏÏÏÏÏÏÏÏÏÏÏÏÏÏÏ 61.0 65.4 2.1 2.0
Interest cost ÏÏÏÏÏÏÏÏÏÏÏÏÏÏÏÏÏÏÏÏÏÏÏÏÏÏÏÏÏÏÏÏÏÏÏÏÏÏÏÏÏÏÏÏÏÏÏÏÏÏÏÏÏÏÏ 118.7 117.3 17.9 16.3
Plan participants' contributions ÏÏÏÏÏÏÏÏÏÏÏÏÏÏÏÏÏÏÏÏÏÏÏÏÏÏÏÏÏÏÏÏÏÏÏÏÏÏ Ì Ì 10.3 6.8
Plan amendments ÏÏÏÏÏÏÏÏÏÏÏÏÏÏÏÏÏÏÏÏÏÏÏÏÏÏÏÏÏÏÏÏÏÏÏÏÏÏÏÏÏÏÏÏÏÏÏÏÏÏ 4.0 Ì (2.4) Ì
Actuarial loss ÏÏÏÏÏÏÏÏÏÏÏÏÏÏÏÏÏÏÏÏÏÏÏÏÏÏÏÏÏÏÏÏÏÏÏÏÏÏÏÏÏÏÏÏÏÏÏÏÏÏÏÏÏÏ 47.7 .1 24.9 19.8
BeneÑt paymentsÏÏÏÏÏÏÏÏÏÏÏÏÏÏÏÏÏÏÏÏÏÏÏÏÏÏÏÏÏÏÏÏÏÏÏÏÏÏÏÏÏÏÏÏÏÏÏÏÏÏÏ (170.4) (111.7) (31.8) (25.8)
Curtailments ÏÏÏÏÏÏÏÏÏÏÏÏÏÏÏÏÏÏÏÏÏÏÏÏÏÏÏÏÏÏÏÏÏÏÏÏÏÏÏÏÏÏÏÏÏÏÏÏÏÏÏÏÏÏÏ Ì (4.4) Ì Ì
SettlementsÏÏÏÏÏÏÏÏÏÏÏÏÏÏÏÏÏÏÏÏÏÏÏÏÏÏÏÏÏÏÏÏÏÏÏÏÏÏÏÏÏÏÏÏÏÏÏÏÏÏÏÏÏÏÏÏ Ì (51.6) Ì Ì
BeneÑt obligation at end of measurement periodÏÏÏÏÏÏÏÏÏÏÏÏÏÏÏÏÏÏÏÏÏÏ $1,656.4 $1,595.4 $ 265.1 $ 244.1
Change in fair value of plan assets
Fair value at beginning of measurement period ÏÏÏÏÏÏÏÏÏÏÏÏÏÏÏÏÏÏÏÏÏÏÏ $2,283.2 $1,985.3 $ 21.8 $ 13.4
Actual return on plan assets ÏÏÏÏÏÏÏÏÏÏÏÏÏÏÏÏÏÏÏÏÏÏÏÏÏÏÏÏÏÏÏÏÏÏÏÏÏÏÏÏ (531.8) 443.8 1.8 .9
Employer contributions ÏÏÏÏÏÏÏÏÏÏÏÏÏÏÏÏÏÏÏÏÏÏÏÏÏÏÏÏÏÏÏÏÏÏÏÏÏÏÏÏÏÏÏÏÏ 30.1 16.3 33.3 26.5
Plan participants' contributions ÏÏÏÏÏÏÏÏÏÏÏÏÏÏÏÏÏÏÏÏÏÏÏÏÏÏÏÏÏÏÏÏÏÏÏÏÏÏ Ì Ì 10.3 6.8
Acquisitions/divestitures ÏÏÏÏÏÏÏÏÏÏÏÏÏÏÏÏÏÏÏÏÏÏÏÏÏÏÏÏÏÏÏÏÏÏÏÏÏÏÏÏÏÏÏÏ Ì 1.1 Ì Ì
SettlementsÏÏÏÏÏÏÏÏÏÏÏÏÏÏÏÏÏÏÏÏÏÏÏÏÏÏÏÏÏÏÏÏÏÏÏÏÏÏÏÏÏÏÏÏÏÏÏÏÏÏÏÏÏÏÏÏ Ì (51.6) Ì Ì
BeneÑt paymentsÏÏÏÏÏÏÏÏÏÏÏÏÏÏÏÏÏÏÏÏÏÏÏÏÏÏÏÏÏÏÏÏÏÏÏÏÏÏÏÏÏÏÏÏÏÏÏÏÏÏÏ (170.4) (111.7) (31.8) (25.8)
Fair value at end of measurement periodÏÏÏÏÏÏÏÏÏÏÏÏÏÏÏÏÏÏÏÏÏÏÏÏÏÏÏÏÏ $1,611.1 $2,283.2 $ 35.4 $ 21.8
Funded status
Funded status at end of measurement periodÏÏÏÏÏÏÏÏÏÏÏÏÏÏÏÏÏÏÏÏÏÏÏÏÏ $ (45.3) $ 687.8 $(229.7) $(222.3)
Unrecognized transition (asset) obligation ÏÏÏÏÏÏÏÏÏÏÏÏÏÏÏÏÏÏÏÏÏÏÏÏÏÏÏ Ì (1.8) 8.1 9.0
Unrecognized prior service cost ÏÏÏÏÏÏÏÏÏÏÏÏÏÏÏÏÏÏÏÏÏÏÏÏÏÏÏÏÏÏÏÏÏÏÏÏÏ (74.8) (87.6) (9.5) (7.8)
Unrecognized net (gain) loss ÏÏÏÏÏÏÏÏÏÏÏÏÏÏÏÏÏÏÏÏÏÏÏÏÏÏÏÏÏÏÏÏÏÏÏÏÏÏÏ 473.2 (338.6) 16.6 (7.6)
Fourth quarter contributionÏÏÏÏÏÏÏÏÏÏÏÏÏÏÏÏÏÏÏÏÏÏÏÏÏÏÏÏÏÏÏÏÏÏÏÏÏÏÏÏÏÏ 6.7 3.7 5.7 15.9
Net amount recognized ÏÏÏÏÏÏÏÏÏÏÏÏÏÏÏÏÏÏÏÏÏÏÏÏÏÏÏÏÏÏÏÏÏÏÏÏÏÏÏÏÏÏÏÏÏ $ 359.8 $ 263.5 $(208.8) $(212.8)
Components of statement of financial position
Prepaid beneÑt cost ÏÏÏÏÏÏÏÏÏÏÏÏÏÏÏÏÏÏÏÏÏÏÏÏÏÏÏÏÏÏÏÏÏÏÏÏÏÏÏÏÏÏÏÏÏÏÏÏ $ 531.7 $ 433.1 $ Ì $ Ì
Accrued beneÑt liability ÏÏÏÏÏÏÏÏÏÏÏÏÏÏÏÏÏÏÏÏÏÏÏÏÏÏÏÏÏÏÏÏÏÏÏÏÏÏÏÏÏÏÏÏÏ (171.8) (169.6) (208.8) (212.8)
Net amount recognized ÏÏÏÏÏÏÏÏÏÏÏÏÏÏÏÏÏÏÏÏÏÏÏÏÏÏÏÏÏÏÏÏÏÏÏÏÏÏÏÏÏÏÏÏÏ $ 359.8 $ 263.5 $(208.8) $(212.8)
The following table provides information for pension plans matching contribution. Although the matching contribution
with beneÑt obligations in excess of plan assets: is initially invested in the Company's common stock,
eÅective in 2002 an employee will be allowed to reinvest(Dollars in Millions) 2001 2000
the matching contributions among various investmentBeneÑt obligation ÏÏÏÏÏÏÏÏÏÏÏÏÏ $227.5 $216.5
alternatives. Total expense was $53.7 million, $53.6 millionAccumulated beneÑt obligation 220.6 193.9
Fair value of plan assets ÏÏÏÏÏÏ Ì Ì and $57.3 million in 2001, 2000 and 1999, respectively.
Employee Investment Plan The Company has deÑned Stock Options and Compensationcontribution retirement savings plans which allow qualiÑed Plansemployees, at their option, to make contributions up to
As part of its employee and director compensationcertain percentages of pre-tax base salary through salaryprograms, the Company may grant certain stock awardsdeductions under Section 401(k) of the Internal Revenueunder the provisions of the existing stock option andCode. Employee contributions are invested, at thecompensation plans. The Company has stock optionsemployees' direction, among a variety of investmentoutstanding under various plans at December 31, 2001,alternatives. Employee contributions are 100 percentincluding plans assumed in acquisitions. The plans providematched by the Company, up to the Ñrst four percent of anfor grants of options to purchase shares of common stockemployee's compensation. The Company's matchinggenerally at the stock's fair market value at the date ofcontribution vests immediately; however, a participant must
be employed on December 31st to receive that year's
U.S. Bancorp
Note 18
73

grant. In addition, the plans provide for grants of shares of Restricted shares vest over three to seven years.
common stock which are subject to restriction on transfer Compensation expense for restricted stock is based on the
and to forfeiture if certain vesting requirements are not met. market price of the Company stock at the time of the grant
With respect to stock option and stock compensation and amortized on a straight-line basis over the vesting
plans, the Company has elected to follow APB 25 in period. Compensation expense related to the restricted
accounting for its employee stock incentive and purchase stock was $71.9 million, $43.4 million and $69.5 million in
plans. Under APB 25, because the exercise price of the 2001, 2000 and 1999, respectively.
Company's employee stock options equals the market price Stock incentive plans of acquired companies are
of the underlying stock on the date of grant, no generally terminated at the merger closing dates. Option
compensation expense is recognized. On the date exercised, holders under such plans receive the Company's common
if new shares are issued, the option proceeds equal to the stock, or options to buy the Company's stock, based on the
par value of the shares are credited to common stock and conversion terms of the various merger agreements. The
additional proceeds are credited to capital surplus. If historical option information presented below has been
treasury shares are issued, the option proceeds equal to the restated to reÖect the options originally granted under
average treasury share price are credited to treasury stock acquired companies' plans.
and additional proceeds are credited to capital surplus. At December 31, 2001, there were 64.4 million shares
Option grants are generally exercisable up to ten years (subject to adjustment for forfeitures) available for grant
from the date of grant and vest over three to Ñve years. under various plans.
The following is a summary of stock options outstanding and exercised under various stock option plans of the Company:
2001 2000 1999
Weighted- Weighted- Weighted-Average Average AverageExercise Exercise Exercise
Stock Options Price Stock Options Price Stock Options Price
Stock option plans
Number outstanding at beginning
of year ÏÏÏÏÏÏÏÏÏÏÏÏÏÏÏÏÏÏÏÏÏÏÏÏ 153,396,226 $22.80 153,163,030 $22.74 107,405,102 $17.97
Granted ÏÏÏÏÏÏÏÏÏÏÏÏÏÏÏÏÏÏÏÏÏÏ 65,144,310 21.25 22,633,170 19.64 75,922,950 27.08
Assumed/converted ÏÏÏÏÏÏÏÏÏÏ 8,669,285 16.40 447,341 6.85 1,210,738 16.58
Exercised ÏÏÏÏÏÏÏÏÏÏÏÏÏÏÏÏÏÏÏÏ (12,775,067) 13.44 (10,017,357) 11.02 (22,332,730) 13.03
Cancelled ÏÏÏÏÏÏÏÏÏÏÏÏÏÏÏÏÏÏÏÏ (12,824,489) 23.29 (12,829,958) 19.91 (9,043,030) 25.63
Number outstanding at end of year ÏÏ 201,610,265 $22.58 153,396,226 $22.80 153,163,030 $22.74
Exercisable at end of year ÏÏÏÏÏÏÏÏ 117,534,343 $22.36 68,870,745 $19.78 70,527,758 $18.00
Restricted share plans
Number outstanding at beginning
of year ÏÏÏÏÏÏÏÏÏÏÏÏÏÏÏÏÏÏÏÏÏÏÏÏ 6,377,137 4,212,954 6,072,217
Granted ÏÏÏÏÏÏÏÏÏÏÏÏÏÏÏÏÏÏÏÏÏÏ 1,021,887 4,110,440 1,379,808
Assumed/converted ÏÏÏÏÏÏÏÏÏÏ 298,988 Ì Ì
Cancelled/vested ÏÏÏÏÏÏÏÏÏÏÏÏÏ (5,520,424) (1,946,257) (3,239,071)
Number outstanding at end of year ÏÏ 2,177,588 6,377,137 4,212,954
Weighted-average fair value of
shares grantedÏÏÏÏÏÏÏÏÏÏÏÏÏÏÏÏÏ $ 6.76 $ 6.32 $ 7.20
U.S. Bancorp74

Additional information regarding options outstanding as of December 31, 2001, is as follows:
Options Outstanding Exercisable Options
Weighted-Average Weighted- Weighted-
Remaining Average AverageContractual Exercise Exercise
Range of Exercise Prices Shares Life (Years) Price Shares Price
$1.44 Ì $10.00 ÏÏÏÏÏÏÏÏÏÏÏÏÏÏÏÏÏÏÏÏÏÏÏÏÏÏÏÏÏÏÏÏÏÏÏÏÏÏ 7,679,415 2.7 $ 5.99 7,649,800 $ 5.98
$10.01 Ì $15.00ÏÏÏÏÏÏÏÏÏÏÏÏÏÏÏÏÏÏÏÏÏÏÏÏÏÏÏÏÏÏÏÏÏÏÏÏÏ 8,966,154 5.3 11.78 7,366,306 11.76
$15.01 Ì $20.00ÏÏÏÏÏÏÏÏÏÏÏÏÏÏÏÏÏÏÏÏÏÏÏÏÏÏÏÏÏÏÏÏÏÏÏÏÏ 51,659,341 8.7 18.63 16,774,997 17.59
$20.01 Ì $25.00ÏÏÏÏÏÏÏÏÏÏÏÏÏÏÏÏÏÏÏÏÏÏÏÏÏÏÏÏÏÏÏÏÏÏÏÏÏ 65,876,786 8.2 22.84 23,274,436 22.90
$25.01 Ì $30.00ÏÏÏÏÏÏÏÏÏÏÏÏÏÏÏÏÏÏÏÏÏÏÏÏÏÏÏÏÏÏÏÏÏÏÏÏÏ 60,157,207 7.0 28.16 55,353,547 28.25
$30.01 Ì $35.00ÏÏÏÏÏÏÏÏÏÏÏÏÏÏÏÏÏÏÏÏÏÏÏÏÏÏÏÏÏÏÏÏÏÏÏÏÏ 6,386,174 6.4 32.51 6,230,069 32.51
$35.01 Ì $37.20ÏÏÏÏÏÏÏÏÏÏÏÏÏÏÏÏÏÏÏÏÏÏÏÏÏÏÏÏÏÏÏÏÏÏÏÏÏ 885,188 6.5 35.78 885,188 35.78
201,610,265 7.6 $22.58 117,534,343 $22.36
Pro forma information regarding net income and earnings per share is required under Statement of Financial Accounting
Standard No. 123 (""SFAS 123''), ""Accounting and Disclosure of Stock-Based Compensation'' and has been determined as if
the Company accounted for its employee stock option plans under the fair value method of SFAS 123. The fair value of
options was estimated at the grant date using a Black-Scholes option pricing model. Option valuation models require use of
highly subjective assumptions. Because the Company's employee stock options have characteristics signiÑcantly diÅerent from
those of traded options, and because changes in the subjective input assumptions can materially aÅect the fair value estimate,
the existing models do not necessarily provide a reliable single measure of the fair value of employee stock options.
The pro forma disclosures include options granted in 2001, 2000, 1999 and 1998 and are not likely to be representative
of the pro forma disclosures for future years. The estimated fair value of the options is amortized to expense over the
options' respective vesting periods.
Year Ended December 31
(Dollars in Millions, Except Per Share Data) 2001(a) 2000 1999
Pro forma net income ÏÏÏÏÏÏÏÏÏÏÏÏÏÏÏÏÏÏÏÏÏÏÏÏÏÏÏÏÏÏÏÏÏÏÏÏÏÏÏÏÏÏÏÏÏÏÏÏÏÏÏÏÏÏÏÏÏÏÏÏÏÏÏÏÏÏÏÏÏÏÏÏÏÏÏÏÏÏÏÏ $1,478.9 $2,752.1 $2,240.5
Pro forma earnings per share ÏÏÏÏÏÏÏÏÏÏÏÏÏÏÏÏÏÏÏÏÏÏÏÏÏÏÏÏÏÏÏÏÏÏÏÏÏÏÏÏÏÏÏÏÏÏÏÏÏÏÏÏÏÏÏÏÏÏÏÏÏÏÏÏÏÏÏÏÏÏÏÏÏ
Earnings per shareÏÏÏÏÏÏÏÏÏÏÏÏÏÏÏÏÏÏÏÏÏÏÏÏÏÏÏÏÏÏÏÏÏÏÏÏÏÏÏÏÏÏÏÏÏÏÏÏÏÏÏÏÏÏÏÏÏÏÏÏÏÏÏÏÏÏÏÏÏÏÏÏÏÏÏÏÏÏÏÏ $ .77 $ 1.44 $ 1.17
Diluted earnings per shareÏÏÏÏÏÏÏÏÏÏÏÏÏÏÏÏÏÏÏÏÏÏÏÏÏÏÏÏÏÏÏÏÏÏÏÏÏÏÏÏÏÏÏÏÏÏÏÏÏÏÏÏÏÏÏÏÏÏÏÏÏÏÏÏÏÏÏÏÏÏÏÏÏ .76 1.43 1.16
(a) Pro forma earnings per share for 2001 was impacted by changes in control provisions that accelerated the vesting of stock options granted to USBM employees.
U.S. Bancorp Firstar USBM
Weighted-average assumptions in option valuation 2001 2000 1999 2000 1999
Risk-free interest rates ÏÏÏÏÏÏÏÏÏÏÏÏÏÏÏÏÏÏÏÏÏÏÏÏÏÏÏÏÏÏÏÏÏÏÏÏÏÏÏÏÏÏÏÏÏÏÏÏÏÏÏÏÏÏÏÏÏÏÏÏ 4.6% 5.4% 5.6% 6.1% 5.4%
Dividend yieldsÏÏÏÏÏÏÏÏÏÏÏÏÏÏÏÏÏÏÏÏÏÏÏÏÏÏÏÏÏÏÏÏÏÏÏÏÏÏÏÏÏÏÏÏÏÏÏÏÏÏÏÏÏÏÏÏÏÏÏÏÏÏÏÏÏÏÏÏ 3.0% 2.5% 2.0% 3.0% 3.5%
Stock volatility factor ÏÏÏÏÏÏÏÏÏÏÏÏÏÏÏÏÏÏÏÏÏÏÏÏÏÏÏÏÏÏÏÏÏÏÏÏÏÏÏÏÏÏÏÏÏÏÏÏÏÏÏÏÏÏÏÏÏÏÏÏÏÏ .42 .37 .41 .37 .27
Expected life of options (in years) ÏÏÏÏÏÏÏÏÏÏÏÏÏÏÏÏÏÏÏÏÏÏÏÏÏÏÏÏÏÏÏÏÏÏÏÏÏÏÏÏÏÏÏÏÏÏÏÏÏ 4.5 2.5-5.5 2.5-5.5 4.7 6.1
U.S. Bancorp 75

Income Taxes
The components of income tax expense were:
(Dollars in Millions) 2001 2000 1999
Federal
Current ÏÏÏÏÏÏÏÏÏÏÏÏÏÏÏÏÏÏÏÏÏÏÏÏÏÏÏÏÏÏÏÏÏÏÏÏÏÏÏÏÏÏÏÏÏÏÏÏÏÏÏÏÏÏÏÏÏÏÏÏÏÏÏÏÏÏÏÏÏÏÏÏÏÏÏÏÏÏÏÏÏ $ 979.9 $ 996.1 $1,036.0
Deferred ÏÏÏÏÏÏÏÏÏÏÏÏÏÏÏÏÏÏÏÏÏÏÏÏÏÏÏÏÏÏÏÏÏÏÏÏÏÏÏÏÏÏÏÏÏÏÏÏÏÏÏÏÏÏÏÏÏÏÏÏÏÏÏÏÏÏÏÏÏÏÏÏÏÏÏÏÏÏÏÏ (164.5) 324.5 219.5
Federal income tax ÏÏÏÏÏÏÏÏÏÏÏÏÏÏÏÏÏÏÏÏÏÏÏÏÏÏÏÏÏÏÏÏÏÏÏÏÏÏÏÏÏÏÏÏÏÏÏÏÏÏÏÏÏÏÏÏÏÏÏÏÏÏÏÏÏÏÏ 815.4 1,320.6 1,255.5
State
Current ÏÏÏÏÏÏÏÏÏÏÏÏÏÏÏÏÏÏÏÏÏÏÏÏÏÏÏÏÏÏÏÏÏÏÏÏÏÏÏÏÏÏÏÏÏÏÏÏÏÏÏÏÏÏÏÏÏÏÏÏÏÏÏÏÏÏÏÏÏÏÏÏÏÏÏÏÏÏÏÏÏ 131.8 159.0 103.3
Deferred ÏÏÏÏÏÏÏÏÏÏÏÏÏÏÏÏÏÏÏÏÏÏÏÏÏÏÏÏÏÏÏÏÏÏÏÏÏÏÏÏÏÏÏÏÏÏÏÏÏÏÏÏÏÏÏÏÏÏÏÏÏÏÏÏÏÏÏÏÏÏÏÏÏÏÏÏÏÏÏÏ (19.5) 32.6 33.4
State income tax ÏÏÏÏÏÏÏÏÏÏÏÏÏÏÏÏÏÏÏÏÏÏÏÏÏÏÏÏÏÏÏÏÏÏÏÏÏÏÏÏÏÏÏÏÏÏÏÏÏÏÏÏÏÏÏÏÏÏÏÏÏÏÏÏÏÏÏÏÏ 112.3 191.6 136.7
Total income tax provision ÏÏÏÏÏÏÏÏÏÏÏÏÏÏÏÏÏÏÏÏÏÏÏÏÏÏÏÏÏÏÏÏÏÏÏÏÏÏÏÏÏÏÏÏÏÏÏÏÏÏÏÏÏÏÏÏÏÏÏÏ $ 927.7 $1,512.2 $1,392.2
The reconciliation between income tax expense and the amount computed by applying the statutory federal income tax rate
was as follows:
(Dollars in Millions) 2001 2000 1999
Tax at statutory rate (35%) ÏÏÏÏÏÏÏÏÏÏÏÏÏÏÏÏÏÏÏÏÏÏÏÏÏÏÏÏÏÏÏÏÏÏÏÏÏÏÏÏÏÏÏÏÏÏÏÏÏÏÏÏÏÏÏÏÏÏÏÏÏÏ $ 922.0 $1,535.8 $1,320.9
State income tax, at statutory rates, net of federal tax beneÑt ÏÏÏÏÏÏÏÏÏÏÏÏÏÏÏÏÏÏÏÏÏÏÏÏÏÏÏÏÏÏÏ 73.0 124.5 88.9
Tax eÅect of:
Tax-exempt interest, net ÏÏÏÏÏÏÏÏÏÏÏÏÏÏÏÏÏÏÏÏÏÏÏÏÏÏÏÏÏÏÏÏÏÏÏÏÏÏÏÏÏÏÏÏÏÏÏÏÏÏÏÏÏÏÏÏÏÏÏÏÏÏ (38.9) (56.0) (60.3)
Amortization of nondeductible goodwill ÏÏÏÏÏÏÏÏÏÏÏÏÏÏÏÏÏÏÏÏÏÏÏÏÏÏÏÏÏÏÏÏÏÏÏÏÏÏÏÏÏÏÏÏÏÏÏÏÏ 88.1 91.6 73.1
Tax creditsÏÏÏÏÏÏÏÏÏÏÏÏÏÏÏÏÏÏÏÏÏÏÏÏÏÏÏÏÏÏÏÏÏÏÏÏÏÏÏÏÏÏÏÏÏÏÏÏÏÏÏÏÏÏÏÏÏÏÏÏÏÏÏÏÏÏÏÏÏÏÏÏÏÏÏ (69.4) (62.7) (41.7)
Nondeductible merger charges ÏÏÏÏÏÏÏÏÏÏÏÏÏÏÏÏÏÏÏÏÏÏÏÏÏÏÏÏÏÏÏÏÏÏÏÏÏÏÏÏÏÏÏÏÏÏÏÏÏÏÏÏÏÏÏÏ 52.5 4.9 56.4
Sale of preferred minority interestÏÏÏÏÏÏÏÏÏÏÏÏÏÏÏÏÏÏÏÏÏÏÏÏÏÏÏÏÏÏÏÏÏÏÏÏÏÏÏÏÏÏÏÏÏÏÏÏÏÏÏÏÏÏ Ì (50.0) Ì
Other items ÏÏÏÏÏÏÏÏÏÏÏÏÏÏÏÏÏÏÏÏÏÏÏÏÏÏÏÏÏÏÏÏÏÏÏÏÏÏÏÏÏÏÏÏÏÏÏÏÏÏÏÏÏÏÏÏÏÏÏÏÏÏÏÏÏÏÏÏÏÏÏÏÏÏ (99.6) (75.9) (45.1)
Applicable income taxesÏÏÏÏÏÏÏÏÏÏÏÏÏÏÏÏÏÏÏÏÏÏÏÏÏÏÏÏÏÏÏÏÏÏÏÏÏÏÏÏÏÏÏÏÏÏÏÏÏÏÏÏÏÏÏÏÏÏÏÏÏÏÏÏÏÏ $ 927.7 $1,512.2 $1,392.2
Deferred income tax assets and liabilities reÖect the tax eÅect of temporary diÅerences between the carrying amounts of
assets and liabilities for Ñnancial reporting purposes and the amounts used for the same items for income tax reporting
purposes.
SigniÑcant components of the Company's deferred tax assets and liabilities as of December 31 were as follows:
(Dollars in Millions) 2001 2000
Deferred tax assets
Allowance for credit losses ÏÏÏÏÏÏÏÏÏÏÏÏÏÏÏÏÏÏÏÏÏÏÏÏÏÏÏÏÏÏÏÏÏÏÏÏÏÏÏÏÏÏÏÏÏÏÏÏÏÏÏÏÏÏÏÏÏÏÏÏÏÏÏÏÏÏÏÏÏÏÏÏÏÏÏÏÏ $ 1,043.9 $ 637.0
Pension and post-retirement beneÑts ÏÏÏÏÏÏÏÏÏÏÏÏÏÏÏÏÏÏÏÏÏÏÏÏÏÏÏÏÏÏÏÏÏÏÏÏÏÏÏÏÏÏÏÏÏÏÏÏÏÏÏÏÏÏÏÏÏÏÏÏÏÏÏÏÏÏÏÏ 59.5 53.5
Real estate and other asset basis diÅerences ÏÏÏÏÏÏÏÏÏÏÏÏÏÏÏÏÏÏÏÏÏÏÏÏÏÏÏÏÏÏÏÏÏÏÏÏÏÏÏÏÏÏÏÏÏÏÏÏÏÏÏÏÏÏÏÏÏÏÏÏ 32.6 31.9
State and federal operating loss carryforwards ÏÏÏÏÏÏÏÏÏÏÏÏÏÏÏÏÏÏÏÏÏÏÏÏÏÏÏÏÏÏÏÏÏÏÏÏÏÏÏÏÏÏÏÏÏÏÏÏÏÏÏÏÏÏÏÏÏÏÏ 24.4 25.0
Federal AMT credits and capital losses ÏÏÏÏÏÏÏÏÏÏÏÏÏÏÏÏÏÏÏÏÏÏÏÏÏÏÏÏÏÏÏÏÏÏÏÏÏÏÏÏÏÏÏÏÏÏÏÏÏÏÏÏÏÏÏÏÏÏÏÏÏÏÏÏÏÏ 22.0 22.0
Accrued severance, pension and retirement beneÑts ÏÏÏÏÏÏÏÏÏÏÏÏÏÏÏÏÏÏÏÏÏÏÏÏÏÏÏÏÏÏÏÏÏÏÏÏÏÏÏÏÏÏÏÏÏÏÏÏÏÏÏÏÏÏ 2.2 30.6
Charitable contributionsÏÏÏÏÏÏÏÏÏÏÏÏÏÏÏÏÏÏÏÏÏÏÏÏÏÏÏÏÏÏÏÏÏÏÏÏÏÏÏÏÏÏÏÏÏÏÏÏÏÏÏÏÏÏÏÏÏÏÏÏÏÏÏÏÏÏÏÏÏÏÏÏÏÏÏÏÏÏÏÏÏ Ì .9
Other deferred tax assets, net ÏÏÏÏÏÏÏÏÏÏÏÏÏÏÏÏÏÏÏÏÏÏÏÏÏÏÏÏÏÏÏÏÏÏÏÏÏÏÏÏÏÏÏÏÏÏÏÏÏÏÏÏÏÏÏÏÏÏÏÏÏÏÏÏÏÏÏÏÏÏÏÏÏÏ 234.0 196.0
Gross deferred tax assets ÏÏÏÏÏÏÏÏÏÏÏÏÏÏÏÏÏÏÏÏÏÏÏÏÏÏÏÏÏÏÏÏÏÏÏÏÏÏÏÏÏÏÏÏÏÏÏÏÏÏÏÏÏÏÏÏÏÏÏÏÏÏÏÏÏÏÏÏÏÏÏÏÏÏÏ 1,418.6 996.9
Deferred tax liabilities
Leasing activitiesÏÏÏÏÏÏÏÏÏÏÏÏÏÏÏÏÏÏÏÏÏÏÏÏÏÏÏÏÏÏÏÏÏÏÏÏÏÏÏÏÏÏÏÏÏÏÏÏÏÏÏÏÏÏÏÏÏÏÏÏÏÏÏÏÏÏÏÏÏÏÏÏÏÏÏÏÏÏÏÏÏÏÏÏÏÏÏ (1,642.5) (1,218.1)
Accelerated depreciationÏÏÏÏÏÏÏÏÏÏÏÏÏÏÏÏÏÏÏÏÏÏÏÏÏÏÏÏÏÏÏÏÏÏÏÏÏÏÏÏÏÏÏÏÏÏÏÏÏÏÏÏÏÏÏÏÏÏÏÏÏÏÏÏÏÏÏÏÏÏÏÏÏÏÏÏÏÏÏÏ (117.7) (92.7)
Securities available-for-sale ÏÏÏÏÏÏÏÏÏÏÏÏÏÏÏÏÏÏÏÏÏÏÏÏÏÏÏÏÏÏÏÏÏÏÏÏÏÏÏÏÏÏÏÏÏÏÏÏÏÏÏÏÏÏÏÏÏÏÏÏÏÏÏÏÏÏÏÏÏÏÏÏÏÏÏÏÏ (59.7) (52.2)
Deferred fees ÏÏÏÏÏÏÏÏÏÏÏÏÏÏÏÏÏÏÏÏÏÏÏÏÏÏÏÏÏÏÏÏÏÏÏÏÏÏÏÏÏÏÏÏÏÏÏÏÏÏÏÏÏÏÏÏÏÏÏÏÏÏÏÏÏÏÏÏÏÏÏÏÏÏÏÏÏÏÏÏÏÏÏÏÏÏÏÏÏÏ (49.2) 35.0
Other investment basis diÅerences ÏÏÏÏÏÏÏÏÏÏÏÏÏÏÏÏÏÏÏÏÏÏÏÏÏÏÏÏÏÏÏÏÏÏÏÏÏÏÏÏÏÏÏÏÏÏÏÏÏÏÏÏÏÏÏÏÏÏÏÏÏÏÏÏÏÏÏÏÏÏ (32.5) (41.1)
Other deferred tax liabilities, netÏÏÏÏÏÏÏÏÏÏÏÏÏÏÏÏÏÏÏÏÏÏÏÏÏÏÏÏÏÏÏÏÏÏÏÏÏÏÏÏÏÏÏÏÏÏÏÏÏÏÏÏÏÏÏÏÏÏÏÏÏÏÏÏÏÏÏÏÏÏÏÏÏ (73.6) (124.0)
Gross deferred tax liabilities ÏÏÏÏÏÏÏÏÏÏÏÏÏÏÏÏÏÏÏÏÏÏÏÏÏÏÏÏÏÏÏÏÏÏÏÏÏÏÏÏÏÏÏÏÏÏÏÏÏÏÏÏÏÏÏÏÏÏÏÏÏÏÏÏÏÏÏÏÏÏÏÏÏ (1,975.2) (1,493.1)
Valuation allowance ÏÏÏÏÏÏÏÏÏÏÏÏÏÏÏÏÏÏÏÏÏÏÏÏÏÏÏÏÏÏÏÏÏÏÏÏÏÏÏÏÏÏÏÏÏÏÏÏÏÏÏÏÏÏÏÏÏÏÏÏÏÏÏÏÏÏÏÏÏÏÏÏÏÏÏÏÏÏÏÏÏÏÏÏ (16.6) (16.6)
Net deferred tax liability ÏÏÏÏÏÏÏÏÏÏÏÏÏÏÏÏÏÏÏÏÏÏÏÏÏÏÏÏÏÏÏÏÏÏÏÏÏÏÏÏÏÏÏÏÏÏÏÏÏÏÏÏÏÏÏÏÏÏÏÏÏÏÏÏÏÏÏÏÏÏÏÏÏÏ $ (573.2) $ (512.8)
U.S. Bancorp
Note 19
76
At December 31, 2001, for income tax purposes, the The Company enters into forward commitments to sell
Company had federal net operating loss carryforwards of groups of residential mortgage loans that it originates or
$1.2 million available, which expire in years 2002 through purchases as part of its mortgage banking activities. The
2009. A valuation allowance has been established to oÅset Company commits to sell the loans at speciÑed prices in a
deferred tax assets related to state net operating loss future period, typically within 90 days. The Company is
carryforwards totaling approximately $437 million, which exposed to interest rate risk during the period between
expire at various times within the next 15 years. issuing a loan commitment and the sale of the loan into the
Certain events covered by Internal Revenue Code secondary market. SpeciÑc forward commitments are
section 593(e), which was not repealed, will trigger a designated as a hedge against changes in the fair value of
recapture of base year reserves of acquired thrift Ñxed-rate mortgage loans held for sale attributed to changes
institutions. The base year reserves of acquired thrift in interest rates. The fair value of these forward
institutions would be recaptured if an entity ceases to commitments was $52.5 million at December 31, 2001. The
qualify as a bank for federal income tax purposes. The base change in fair value of the forward commitments attributed
year reserves of thrift institutions also remain subject to to hedge ineÅectiveness recorded in noninterest income was
income tax penalty provisions that, in general, require $17.9 million for the year ended December 31, 2001.
recapture upon certain stock redemptions of, and excessCash Flow Hedges The Company has interest rate swaps
distributions to, stockholders. At December 31, 2001,designated as cash Öow hedges linked to the cash Öows of
retained earnings included approximately $101.8 million ofvariable rate LIBOR loans and Öoating rate debt. The swaps
base year reserves for which no deferred federal income taxhave a fair value of $106 million at December 31, 2001.
liability has been recognized.The gain will be reclassiÑed from other comprehensive
income into earnings during the same period the forecastedDerivative and Other OÅ-Balancetransactions occur. The estimated amount of the gain to beSheet InstrumentsreclassiÑed into earnings within the next 12 months is
In the normal course of business, the Company uses various $64.4 million, which includes cash Öow hedges terminatedderivative and other oÅ-balance sheet instruments to early where the forecasted transaction is still probable. Themanage its interest rate risk and market risks and Company has determined that the occurrence of the hedgedaccommodate the business requirements of its customers. forecasted transactions remains probable. The change in fairThese instruments carry varying degrees of credit, interest value of the swaps attributed to hedge ineÅectiveness wasrate, and market or liquidity risks. not material for the year ended December 31, 2001.
DERIVATIVES Other Derivative Activity The Company acts as an
intermediary for interest rate swaps, caps, Öoors and foreignThe Company requires the recognition of derivative
exchange contracts on behalf of its customers. Theinstruments as either assets or liabilities and the
Company minimizes its market and liquidity risks by takingmeasurement of those instruments at fair value. Subsequent
oÅsetting positions. The Company manages its credit risk,changes in the derivatives' fair values are recognized
or potential risk of loss from default by counterparties,currently in earnings unless speciÑc hedge accounting
through credit limit approval and monitoring procedures.criteria are met.
Market value changes on intermediated swaps and other
Fair Value Hedges The Company's interest rate swaps derivatives are recognized in income in the period of
designated as fair value hedges of underlying Ñxed-rate debt change. Gains or losses on intermediated transactions were
and deposit obligations have a fair value of $276.5 million not signiÑcant for the year ended December 31, 2001.
and fair value hedges of Trust Preferred Securities have a In addition, the Company enters into interest rate
fair value of $(43.5) million at December 31, 2001. Each swaps and other derivative contracts to protect against
period the changes in fair value of both the hedge interest rate risk and credit risk that do not meet the
instruments and the underlying debt obligations are criteria to receive hedge accounting treatment. These
recorded as gains or losses in trading account proÑts and derivatives are recorded at fair value on the balance sheet as
commissions. All fair value hedges are intended to reduce trading account assets or liabilities and any changes in fair
the interest rate risk associated with the underlying hedged value are recorded in trading proÑts/losses and
item. The fair value hedge transactions were considered commissions.
highly eÅective for the year ended December 31, 2001, and The Company also enters into forward commitments to
the change in fair value of the swaps attributed to hedge sell groups of residential mortgage loans to protect against
ineÅectiveness was not material. changes in the fair value of Ñxed-rate mortgage loan
commitments not yet funded. These forward commitment
U.S. Bancorp
Note 20
77
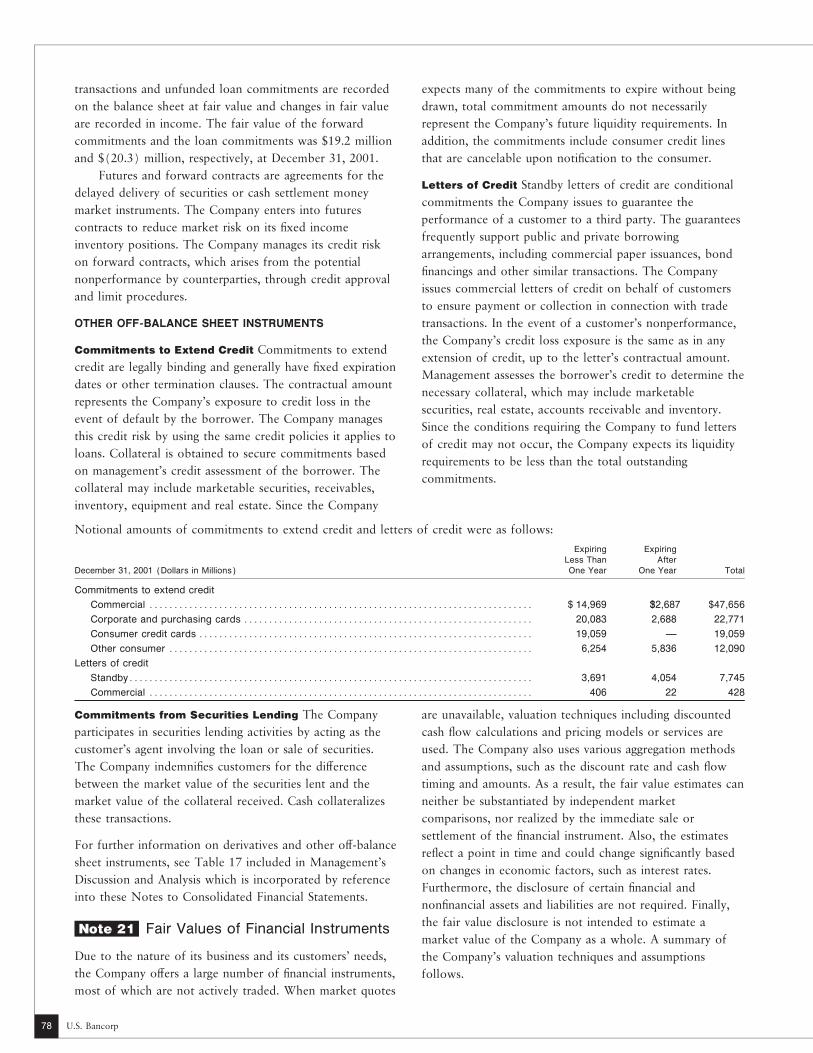
transactions and unfunded loan commitments are recorded expects many of the commitments to expire without being
on the balance sheet at fair value and changes in fair value drawn, total commitment amounts do not necessarily
are recorded in income. The fair value of the forward represent the Company's future liquidity requirements. In
commitments and the loan commitments was $19.2 million addition, the commitments include consumer credit lines
and $(20.3) million, respectively, at December 31, 2001. that are cancelable upon notiÑcation to the consumer.
Futures and forward contracts are agreements for theLetters of Credit Standby letters of credit are conditional
delayed delivery of securities or cash settlement moneycommitments the Company issues to guarantee the
market instruments. The Company enters into futuresperformance of a customer to a third party. The guarantees
contracts to reduce market risk on its Ñxed incomefrequently support public and private borrowing
inventory positions. The Company manages its credit riskarrangements, including commercial paper issuances, bond
on forward contracts, which arises from the potentialÑnancings and other similar transactions. The Company
nonperformance by counterparties, through credit approvalissues commercial letters of credit on behalf of customers
and limit procedures.to ensure payment or collection in connection with trade
OTHER OFF-BALANCE SHEET INSTRUMENTS transactions. In the event of a customer's nonperformance,
the Company's credit loss exposure is the same as in anyCommitments to Extend Credit Commitments to extend
extension of credit, up to the letter's contractual amount.credit are legally binding and generally have Ñxed expiration
Management assesses the borrower's credit to determine thedates or other termination clauses. The contractual amount
necessary collateral, which may include marketablerepresents the Company's exposure to credit loss in the
securities, real estate, accounts receivable and inventory.event of default by the borrower. The Company manages
Since the conditions requiring the Company to fund lettersthis credit risk by using the same credit policies it applies to
of credit may not occur, the Company expects its liquidityloans. Collateral is obtained to secure commitments based
requirements to be less than the total outstandingon management's credit assessment of the borrower. The
commitments.collateral may include marketable securities, receivables,
inventory, equipment and real estate. Since the Company
Notional amounts of commitments to extend credit and letters of credit were as follows:
Expiring ExpiringLess Than After
December 31, 2001 (Dollars in Millions) One Year One Year Total
Commitments to extend credit
Commercial ÏÏÏÏÏÏÏÏÏÏÏÏÏÏÏÏÏÏÏÏÏÏÏÏÏÏÏÏÏÏÏÏÏÏÏÏÏÏÏÏÏÏÏÏÏÏÏÏÏÏÏÏÏÏÏÏÏÏÏÏÏÏÏÏÏÏÏÏÏÏÏÏÏÏÏÏÏ $ 14,969 $32,687 $47,656
Corporate and purchasing cards ÏÏÏÏÏÏÏÏÏÏÏÏÏÏÏÏÏÏÏÏÏÏÏÏÏÏÏÏÏÏÏÏÏÏÏÏÏÏÏÏÏÏÏÏÏÏÏÏÏÏÏÏÏÏÏÏÏÏ 20,083 2,688 22,771
Consumer credit cards ÏÏÏÏÏÏÏÏÏÏÏÏÏÏÏÏÏÏÏÏÏÏÏÏÏÏÏÏÏÏÏÏÏÏÏÏÏÏÏÏÏÏÏÏÏÏÏÏÏÏÏÏÏÏÏÏÏÏÏÏÏÏÏÏÏÏÏ 19,059 Ì 19,059
Other consumer ÏÏÏÏÏÏÏÏÏÏÏÏÏÏÏÏÏÏÏÏÏÏÏÏÏÏÏÏÏÏÏÏÏÏÏÏÏÏÏÏÏÏÏÏÏÏÏÏÏÏÏÏÏÏÏÏÏÏÏÏÏÏÏÏÏÏÏÏÏÏÏÏÏ 6,254 5,836 12,090
Letters of credit
StandbyÏÏÏÏÏÏÏÏÏÏÏÏÏÏÏÏÏÏÏÏÏÏÏÏÏÏÏÏÏÏÏÏÏÏÏÏÏÏÏÏÏÏÏÏÏÏÏÏÏÏÏÏÏÏÏÏÏÏÏÏÏÏÏÏÏÏÏÏÏÏÏÏÏÏÏÏÏÏÏÏÏ 3,691 4,054 7,745
Commercial ÏÏÏÏÏÏÏÏÏÏÏÏÏÏÏÏÏÏÏÏÏÏÏÏÏÏÏÏÏÏÏÏÏÏÏÏÏÏÏÏÏÏÏÏÏÏÏÏÏÏÏÏÏÏÏÏÏÏÏÏÏÏÏÏÏÏÏÏÏÏÏÏÏÏÏÏÏ 406 22 428
Commitments from Securities Lending The Company are unavailable, valuation techniques including discounted
participates in securities lending activities by acting as the cash Öow calculations and pricing models or services are
customer's agent involving the loan or sale of securities. used. The Company also uses various aggregation methods
The Company indemniÑes customers for the diÅerence and assumptions, such as the discount rate and cash Öow
between the market value of the securities lent and the timing and amounts. As a result, the fair value estimates can
market value of the collateral received. Cash collateralizes neither be substantiated by independent market
these transactions. comparisons, nor realized by the immediate sale or
settlement of the Ñnancial instrument. Also, the estimatesFor further information on derivatives and other oÅ-balance
reÖect a point in time and could change signiÑcantly basedsheet instruments, see Table 17 included in Management's
on changes in economic factors, such as interest rates.Discussion and Analysis which is incorporated by reference
Furthermore, the disclosure of certain Ñnancial andinto these Notes to Consolidated Financial Statements.
nonÑnancial assets and liabilities are not required. Finally,
the fair value disclosure is not intended to estimate aFair Values of Financial Instrumentsmarket value of the Company as a whole. A summary of
Due to the nature of its business and its customers' needs, the Company's valuation techniques and assumptions
the Company oÅers a large number of Ñnancial instruments, follows.
most of which are not actively traded. When market quotes
U.S. Bancorp
Note 21
78

Cash and Cash Equivalents The carrying value of cash, maturities. Their carrying value is assumed to approximate
amounts due from banks, federal funds sold and securities their fair value.
purchased under resale agreements was assumed toLong-term Debt and Company-obligated Mandatorily
approximate fair value.Redeemable Preferred Securities of Subsidiary Trusts
Securities Generally, trading account securities and Holding Solely the Junior Subordinated Debentures of
investment securities were valued using available market the Parent Company Estimated fair value for medium-
quotes. In some instances, for securities that are not widely term notes, Euro medium-term notes, bank notes, Federal
traded, market quotes for comparable securities were used. Home Loan Bank advances, capital lease obligations and
mortgage note obligations was determined using aLoans The loan portfolio consists of both Öoating and
discounted cash Öow analysis based on current market ratesÑxed-rate loans, the fair value of which was estimated using
of similar maturity debt securities to discounted cash Öows.discounted cash Öow analyses and other valuation
Other long-term debt instruments and company-obligatedtechniques. To calculate discounted cash Öows, the loans
mandatorily redeemable preferred securities of subsidiarywere aggregated into pools of similar types and expected
trusts holding solely the junior subordinated debentures ofrepayment terms. The expected cash Öows of loans
the parent company were valued using available marketconsidered historical prepayment experiences and estimated
quotes.credit losses for nonperforming loans and were discounted
using current rates oÅered to borrowers of similar credit Interest Rate Swaps and Options The interest rate swap
characteristics. cash Öows were estimated using a third party pricing model
and discounted based on appropriate LIBOR, EurodollarDeposit Liabilities The fair value of demand deposits,
futures and swap yield curves.savings accounts and certain money market deposits is equal
to the amount payable on demand at year-end. The fair Loan Commitments, Letters of Credit and Guarantees
value of Ñxed-rate certiÑcates of deposit was estimated by The Company's commitments have Öoating rates and do
discounting the contractural cash Öow using the discount not expose the Company to interest rate risk, with the
rates implied by the high-grade corporate bond yield curve. exception of mortgage commitments. No premium or
discount was ascribed to the loan commitments becauseShort-term Borrowings Federal funds purchased, securities
virtually all funding would be at current market rates.sold under agreements to repurchase and other short-term
funds borrowed are at Öoating rates or have short-term
U.S. Bancorp 79

The estimated fair values of the Company's Ñnancial instruments at December 31 are shown in the table below.
2001 2000
Carrying Fair Carrying Fair(Dollars in Millions) Amount Value Amount Value
Financial Assets
Cash and cash equivalents ÏÏÏÏÏÏÏÏÏÏÏÏÏÏÏÏÏÏÏÏÏÏÏÏÏÏÏÏÏÏÏÏÏÏÏÏÏÏÏÏÏÏÏÏ $ 9,745 $ 9,745 $ 9,132 $ 9,132
Trading account securitiesÏÏÏÏÏÏÏÏÏÏÏÏÏÏÏÏÏÏÏÏÏÏÏÏÏÏÏÏÏÏÏÏÏÏÏÏÏÏÏÏÏÏÏÏÏ 982 982 753 753
Investment securities ÏÏÏÏÏÏÏÏÏÏÏÏÏÏÏÏÏÏÏÏÏÏÏÏÏÏÏÏÏÏÏÏÏÏÏÏÏÏÏÏÏÏÏÏÏÏÏÏÏ 26,608 26,615 17,642 17,647
Loans held for sale ÏÏÏÏÏÏÏÏÏÏÏÏÏÏÏÏÏÏÏÏÏÏÏÏÏÏÏÏÏÏÏÏÏÏÏÏÏÏÏÏÏÏÏÏÏÏÏÏÏÏÏ 2,820 2,820 764 764
Loans ÏÏÏÏÏÏÏÏÏÏÏÏÏÏÏÏÏÏÏÏÏÏÏÏÏÏÏÏÏÏÏÏÏÏÏÏÏÏÏÏÏÏÏÏÏÏÏÏÏÏÏÏÏÏÏÏÏÏÏÏÏÏÏ 111,948 112,236 120,578 121,139
Total Ñnancial assets ÏÏÏÏÏÏÏÏÏÏÏÏÏÏÏÏÏÏÏÏÏÏÏÏÏÏÏÏÏÏÏÏÏÏÏÏÏÏÏÏÏÏÏÏÏÏ 152,103 $152,398 148,869 $149,435
NonÑnancial assetsÏÏÏÏÏÏÏÏÏÏÏÏÏÏÏÏÏÏÏÏÏÏÏÏÏÏÏÏÏÏÏÏÏÏÏÏÏÏÏÏÏÏÏÏÏ 19,287 16,052
Total assets ÏÏÏÏÏÏÏÏÏÏÏÏÏÏÏÏÏÏÏÏÏÏÏÏÏÏÏÏÏÏÏÏÏÏÏÏÏÏÏÏÏÏÏÏÏÏÏÏ $171,390 $164,921
Financial Liabilities
Deposits ÏÏÏÏÏÏÏÏÏÏÏÏÏÏÏÏÏÏÏÏÏÏÏÏÏÏÏÏÏÏÏÏÏÏÏÏÏÏÏÏÏÏÏÏÏÏÏÏÏÏÏÏÏÏÏÏÏÏÏÏÏ $105,219 $105,561 $109,535 $109,593
Short-term borrowings ÏÏÏÏÏÏÏÏÏÏÏÏÏÏÏÏÏÏÏÏÏÏÏÏÏÏÏÏÏÏÏÏÏÏÏÏÏÏÏÏÏÏÏÏÏÏÏÏ 14,670 14,670 11,833 11,833
Long-term debtÏÏÏÏÏÏÏÏÏÏÏÏÏÏÏÏÏÏÏÏÏÏÏÏÏÏÏÏÏÏÏÏÏÏÏÏÏÏÏÏÏÏÏÏÏÏÏÏÏÏÏÏÏÏÏ 25,716 25,801 21,876 22,006
Company-obligated mandatorily redeemable preferred securities of
subsidiary trusts holding solely the junior subordinated debentures of
the parent company ÏÏÏÏÏÏÏÏÏÏÏÏÏÏÏÏÏÏÏÏÏÏÏÏÏÏÏÏÏÏÏÏÏÏÏÏÏÏÏÏÏÏÏÏÏÏÏ 2,826 2,915 1,400 1,351
Total Ñnancial liabilities ÏÏÏÏÏÏÏÏÏÏÏÏÏÏÏÏÏÏÏÏÏÏÏÏÏÏÏÏÏÏÏÏÏÏÏÏÏÏÏÏÏÏÏÏ 148,431 $148,947 144,644 $144,783
NonÑnancial liabilities ÏÏÏÏÏÏÏÏÏÏÏÏÏÏÏÏÏÏÏÏÏÏÏÏÏÏÏÏÏÏÏÏÏÏÏÏÏÏÏÏÏÏÏ 6,498 5,109
Shareholders' equityÏÏÏÏÏÏÏÏÏÏÏÏÏÏÏÏÏÏÏÏÏÏÏÏÏÏÏÏÏÏÏÏÏÏÏÏÏÏÏÏÏÏÏÏ 16,461 15,168
Total liabilities and shareholders' equityÏÏÏÏÏÏÏÏÏÏÏÏÏÏÏÏÏÏÏÏÏÏÏ $171,390 $164,921
Derivative Positions
Asset and liability management positions
Interest rate swapsÏÏÏÏÏÏÏÏÏÏÏÏÏÏÏÏÏÏÏÏÏÏÏÏÏÏÏÏÏÏÏÏÏÏÏÏÏÏÏÏÏÏÏÏÏ $ 339 $ 339 $ Ì $ 107
Forward commitments to sell residential mortgages ÏÏÏÏÏÏÏÏÏÏÏÏÏÏÏ 72 72 (14) (14)
Customer intermediated positions
Interest rate contracts ÏÏÏÏÏÏÏÏÏÏÏÏÏÏÏÏÏÏÏÏÏÏÏÏÏÏÏÏÏÏÏÏÏÏÏÏÏÏÏÏÏÏ 10 10 6 6
Foreign exchange contracts ÏÏÏÏÏÏÏÏÏÏÏÏÏÏÏÏÏÏÏÏÏÏÏÏÏÏÏÏÏÏÏÏÏÏÏÏÏ 2 2 4 4
Commitments and Contingent Liabilities
Rental expense for operating leases amounted to $165.2 million in 2001, $219.3 million in 2000 and $193.8 million in 1999.
Future minimum payments, net of sublease rentals, under capitalized leases and noncancelable operating leases with initial or
remaining terms of one year or more, consisted of the following at December 31, 2001:
Capitalized Operating(Dollars in Millions) Leases Leases
2002 ÏÏÏÏÏÏÏÏÏÏÏÏÏÏÏÏÏÏÏÏÏÏÏÏÏÏÏÏÏÏÏÏÏÏÏÏÏÏÏÏÏÏÏÏÏÏÏÏÏÏÏÏÏÏÏÏÏÏÏÏÏÏÏÏÏÏÏÏÏÏÏÏÏÏÏÏÏÏÏÏÏÏÏÏÏÏÏÏÏÏÏÏÏÏÏÏÏÏ $12.6 $ 191.5
2003 ÏÏÏÏÏÏÏÏÏÏÏÏÏÏÏÏÏÏÏÏÏÏÏÏÏÏÏÏÏÏÏÏÏÏÏÏÏÏÏÏÏÏÏÏÏÏÏÏÏÏÏÏÏÏÏÏÏÏÏÏÏÏÏÏÏÏÏÏÏÏÏÏÏÏÏÏÏÏÏÏÏÏÏÏÏÏÏÏÏÏÏÏÏÏÏÏÏÏ 9.0 164.4
2004 ÏÏÏÏÏÏÏÏÏÏÏÏÏÏÏÏÏÏÏÏÏÏÏÏÏÏÏÏÏÏÏÏÏÏÏÏÏÏÏÏÏÏÏÏÏÏÏÏÏÏÏÏÏÏÏÏÏÏÏÏÏÏÏÏÏÏÏÏÏÏÏÏÏÏÏÏÏÏÏÏÏÏÏÏÏÏÏÏÏÏÏÏÏÏÏÏÏÏ 8.1 137.4
2005 ÏÏÏÏÏÏÏÏÏÏÏÏÏÏÏÏÏÏÏÏÏÏÏÏÏÏÏÏÏÏÏÏÏÏÏÏÏÏÏÏÏÏÏÏÏÏÏÏÏÏÏÏÏÏÏÏÏÏÏÏÏÏÏÏÏÏÏÏÏÏÏÏÏÏÏÏÏÏÏÏÏÏÏÏÏÏÏÏÏÏÏÏÏÏÏÏÏÏ 6.9 113.6
2006 ÏÏÏÏÏÏÏÏÏÏÏÏÏÏÏÏÏÏÏÏÏÏÏÏÏÏÏÏÏÏÏÏÏÏÏÏÏÏÏÏÏÏÏÏÏÏÏÏÏÏÏÏÏÏÏÏÏÏÏÏÏÏÏÏÏÏÏÏÏÏÏÏÏÏÏÏÏÏÏÏÏÏÏÏÏÏÏÏÏÏÏÏÏÏÏÏÏÏ 6.3 95.3
Thereafter ÏÏÏÏÏÏÏÏÏÏÏÏÏÏÏÏÏÏÏÏÏÏÏÏÏÏÏÏÏÏÏÏÏÏÏÏÏÏÏÏÏÏÏÏÏÏÏÏÏÏÏÏÏÏÏÏÏÏÏÏÏÏÏÏÏÏÏÏÏÏÏÏÏÏÏÏÏÏÏÏÏÏÏÏÏÏÏÏÏÏÏÏÏ 51.2 508.4
Total minimum lease payments ÏÏÏÏÏÏÏÏÏÏÏÏÏÏÏÏÏÏÏÏÏÏÏÏÏÏÏÏÏÏÏÏÏÏÏÏÏÏÏÏÏÏÏÏÏÏÏÏÏÏÏÏÏÏÏÏÏÏÏÏÏÏÏÏÏÏÏÏÏÏÏÏÏÏ 94.1 $1,201.6
Less amount representing interestÏÏÏÏÏÏÏÏÏÏÏÏÏÏÏÏÏÏÏÏÏÏÏÏÏÏÏÏÏÏÏÏÏÏÏÏÏÏÏÏÏÏÏÏÏÏÏÏÏÏÏÏÏÏÏÏÏÏÏÏÏÏÏÏÏÏÏÏÏÏÏ 38.4
Present value of net minimum lease paymentsÏÏÏÏÏÏÏÏÏÏÏÏÏÏÏÏÏÏÏÏÏÏÏÏÏÏÏÏÏÏÏÏÏÏÏÏÏÏÏÏÏÏÏÏÏÏÏÏÏÏÏÏÏÏÏÏÏÏÏÏ $55.7
Various legal proceedings are currently pending against the Company. Due to their complex nature, it may be years
before some matters are resolved. In the opinion of management, the aggregate liability, if any, will not have a material
adverse eÅect on the Company's Ñnancial position, liquidity or results of operations.
U.S. Bancorp
Note 22
80

U.S. Bancorp (Parent Company)
Condensed Balance Sheet
December 31 (Dollars in Millions) 2001 2000
Assets
Deposits with subsidiary banks, principally interest-bearingÏÏÏÏÏÏÏÏÏÏÏÏÏÏÏÏÏÏÏÏÏÏÏÏÏÏÏÏÏÏÏÏÏÏÏÏÏÏÏÏÏÏÏÏÏÏÏÏÏÏ $ 3,184 $ 1,714
Available-for-sale securitiesÏÏÏÏÏÏÏÏÏÏÏÏÏÏÏÏÏÏÏÏÏÏÏÏÏÏÏÏÏÏÏÏÏÏÏÏÏÏÏÏÏÏÏÏÏÏÏÏÏÏÏÏÏÏÏÏÏÏÏÏÏÏÏÏÏÏÏÏÏÏÏÏÏÏÏÏÏÏÏ 189 325
Investments in
Bank aÇliates ÏÏÏÏÏÏÏÏÏÏÏÏÏÏÏÏÏÏÏÏÏÏÏÏÏÏÏÏÏÏÏÏÏÏÏÏÏÏÏÏÏÏÏÏÏÏÏÏÏÏÏÏÏÏÏÏÏÏÏÏÏÏÏÏÏÏÏÏÏÏÏÏÏÏÏÏÏÏÏÏÏÏÏÏÏÏÏÏ 17,907 15,019
Nonbank aÇliates ÏÏÏÏÏÏÏÏÏÏÏÏÏÏÏÏÏÏÏÏÏÏÏÏÏÏÏÏÏÏÏÏÏÏÏÏÏÏÏÏÏÏÏÏÏÏÏÏÏÏÏÏÏÏÏÏÏÏÏÏÏÏÏÏÏÏÏÏÏÏÏÏÏÏÏÏÏÏÏÏÏÏÏÏ 1,291 1,059
Advances to
Bank aÇliates ÏÏÏÏÏÏÏÏÏÏÏÏÏÏÏÏÏÏÏÏÏÏÏÏÏÏÏÏÏÏÏÏÏÏÏÏÏÏÏÏÏÏÏÏÏÏÏÏÏÏÏÏÏÏÏÏÏÏÏÏÏÏÏÏÏÏÏÏÏÏÏÏÏÏÏÏÏÏÏÏÏÏÏÏÏÏÏÏ 1,214 1,971
Nonbank aÇliates ÏÏÏÏÏÏÏÏÏÏÏÏÏÏÏÏÏÏÏÏÏÏÏÏÏÏÏÏÏÏÏÏÏÏÏÏÏÏÏÏÏÏÏÏÏÏÏÏÏÏÏÏÏÏÏÏÏÏÏÏÏÏÏÏÏÏÏÏÏÏÏÏÏÏÏÏÏÏÏÏÏÏÏÏ 928 1,958
Other assets ÏÏÏÏÏÏÏÏÏÏÏÏÏÏÏÏÏÏÏÏÏÏÏÏÏÏÏÏÏÏÏÏÏÏÏÏÏÏÏÏÏÏÏÏÏÏÏÏÏÏÏÏÏÏÏÏÏÏÏÏÏÏÏÏÏÏÏÏÏÏÏÏÏÏÏÏÏÏÏÏÏÏÏÏÏÏÏÏÏÏÏÏ 2,258 2,179
Total assets ÏÏÏÏÏÏÏÏÏÏÏÏÏÏÏÏÏÏÏÏÏÏÏÏÏÏÏÏÏÏÏÏÏÏÏÏÏÏÏÏÏÏÏÏÏÏÏÏÏÏÏÏÏÏÏÏÏÏÏÏÏÏÏÏÏÏÏÏÏÏÏÏÏÏÏÏÏÏÏÏÏÏÏÏÏÏ $26,971 $24,225
Liabilities and Shareholders' Equity
Short-term funds borrowed ÏÏÏÏÏÏÏÏÏÏÏÏÏÏÏÏÏÏÏÏÏÏÏÏÏÏÏÏÏÏÏÏÏÏÏÏÏÏÏÏÏÏÏÏÏÏÏÏÏÏÏÏÏÏÏÏÏÏÏÏÏÏÏÏÏÏÏÏÏÏÏÏÏÏÏÏÏÏÏ $ 452 $ 224
Advances from subsidiariesÏÏÏÏÏÏÏÏÏÏÏÏÏÏÏÏÏÏÏÏÏÏÏÏÏÏÏÏÏÏÏÏÏÏÏÏÏÏÏÏÏÏÏÏÏÏÏÏÏÏÏÏÏÏÏÏÏÏÏÏÏÏÏÏÏÏÏÏÏÏÏÏÏÏÏÏÏÏÏ 69 97
Long-term debt ÏÏÏÏÏÏÏÏÏÏÏÏÏÏÏÏÏÏÏÏÏÏÏÏÏÏÏÏÏÏÏÏÏÏÏÏÏÏÏÏÏÏÏÏÏÏÏÏÏÏÏÏÏÏÏÏÏÏÏÏÏÏÏÏÏÏÏÏÏÏÏÏÏÏÏÏÏÏÏÏÏÏÏÏÏÏÏÏÏÏ 6,074 6,563
Junior subordinated debentures issued to subsidiary trusts ÏÏÏÏÏÏÏÏÏÏÏÏÏÏÏÏÏÏÏÏÏÏÏÏÏÏÏÏÏÏÏÏÏÏÏÏÏÏÏÏÏÏÏÏÏÏÏÏÏ 2,990 1,443
Other liabilitiesÏÏÏÏÏÏÏÏÏÏÏÏÏÏÏÏÏÏÏÏÏÏÏÏÏÏÏÏÏÏÏÏÏÏÏÏÏÏÏÏÏÏÏÏÏÏÏÏÏÏÏÏÏÏÏÏÏÏÏÏÏÏÏÏÏÏÏÏÏÏÏÏÏÏÏÏÏÏÏÏÏÏÏÏÏÏÏÏÏÏÏ 925 730
Shareholders' equity ÏÏÏÏÏÏÏÏÏÏÏÏÏÏÏÏÏÏÏÏÏÏÏÏÏÏÏÏÏÏÏÏÏÏÏÏÏÏÏÏÏÏÏÏÏÏÏÏÏÏÏÏÏÏÏÏÏÏÏÏÏÏÏÏÏÏÏÏÏÏÏÏÏÏÏÏÏÏÏÏÏÏÏÏÏ 16,461 15,168
Total liabilities and shareholders' equity ÏÏÏÏÏÏÏÏÏÏÏÏÏÏÏÏÏÏÏÏÏÏÏÏÏÏÏÏÏÏÏÏÏÏÏÏÏÏÏÏÏÏÏÏÏÏÏÏÏÏÏÏÏÏÏÏÏÏÏÏÏ $26,971 $24,225
Condensed Statement of Income
Year Ended December 31 (Dollars in Millions) 2001 2000 1999
Income
Dividends from subsidiaries (including $1,300.1, $3,010.5 and $1,661.0 from bank
subsidiaries) ÏÏÏÏÏÏÏÏÏÏÏÏÏÏÏÏÏÏÏÏÏÏÏÏÏÏÏÏÏÏÏÏÏÏÏÏÏÏÏÏÏÏÏÏÏÏÏÏÏÏÏÏÏÏÏÏÏÏÏÏÏÏÏÏÏÏÏÏÏÏÏÏ $1,310.2 $3,027.8 $1,704.3
Interest from subsidiaries ÏÏÏÏÏÏÏÏÏÏÏÏÏÏÏÏÏÏÏÏÏÏÏÏÏÏÏÏÏÏÏÏÏÏÏÏÏÏÏÏÏÏÏÏÏÏÏÏÏÏÏÏÏÏÏÏÏÏÏÏÏÏÏÏ 272.8 234.8 177.2
Service and management fees from subsidiariesÏÏÏÏÏÏÏÏÏÏÏÏÏÏÏÏÏÏÏÏÏÏÏÏÏÏÏÏÏÏÏÏÏÏÏÏÏÏÏÏÏÏÏ 221.8 246.0 229.1
Other income ÏÏÏÏÏÏÏÏÏÏÏÏÏÏÏÏÏÏÏÏÏÏÏÏÏÏÏÏÏÏÏÏÏÏÏÏÏÏÏÏÏÏÏÏÏÏÏÏÏÏÏÏÏÏÏÏÏÏÏÏÏÏÏÏÏÏÏÏÏÏÏÏÏÏÏ 21.0 217.0 202.0
Total income ÏÏÏÏÏÏÏÏÏÏÏÏÏÏÏÏÏÏÏÏÏÏÏÏÏÏÏÏÏÏÏÏÏÏÏÏÏÏÏÏÏÏÏÏÏÏÏÏÏÏÏÏÏÏÏÏÏÏÏÏÏÏÏÏÏÏÏÏÏ 1,825.8 3,725.6 2,312.6
Expenses
Interest on short-term funds borrowed ÏÏÏÏÏÏÏÏÏÏÏÏÏÏÏÏÏÏÏÏÏÏÏÏÏÏÏÏÏÏÏÏÏÏÏÏÏÏÏÏÏÏÏÏÏÏÏÏÏÏÏÏ 18.5 19.3 26.8
Interest on long-term debt ÏÏÏÏÏÏÏÏÏÏÏÏÏÏÏÏÏÏÏÏÏÏÏÏÏÏÏÏÏÏÏÏÏÏÏÏÏÏÏÏÏÏÏÏÏÏÏÏÏÏÏÏÏÏÏÏÏÏÏÏÏÏÏ 318.5 441.7 296.4
Interest on junior subordinated debentures issued to subsidiary trustsÏÏÏÏÏÏÏÏÏÏÏÏÏÏÏÏÏÏÏÏÏÏÏ 141.7 111.3 110.3
Merger and restructuring-related charges ÏÏÏÏÏÏÏÏÏÏÏÏÏÏÏÏÏÏÏÏÏÏÏÏÏÏÏÏÏÏÏÏÏÏÏÏÏÏÏÏÏÏÏÏÏÏÏÏÏ 49.5 21.3 103.8
Other expenses ÏÏÏÏÏÏÏÏÏÏÏÏÏÏÏÏÏÏÏÏÏÏÏÏÏÏÏÏÏÏÏÏÏÏÏÏÏÏÏÏÏÏÏÏÏÏÏÏÏÏÏÏÏÏÏÏÏÏÏÏÏÏÏÏÏÏÏÏÏÏÏÏÏ 322.5 225.2 307.7
Total expenses ÏÏÏÏÏÏÏÏÏÏÏÏÏÏÏÏÏÏÏÏÏÏÏÏÏÏÏÏÏÏÏÏÏÏÏÏÏÏÏÏÏÏÏÏÏÏÏÏÏÏÏÏÏÏÏÏÏÏÏÏÏÏÏÏÏÏÏ 850.7 818.8 845.0
Income before income taxes and equity in undistributed income of subsidiaries ÏÏÏÏÏÏÏÏÏÏÏÏÏÏ 975.1 2,906.8 1,467.6
Income tax creditÏÏÏÏÏÏÏÏÏÏÏÏÏÏÏÏÏÏÏÏÏÏÏÏÏÏÏÏÏÏÏÏÏÏÏÏÏÏÏÏÏÏÏÏÏÏÏÏÏÏÏÏÏÏÏÏÏÏÏÏÏÏÏÏÏÏÏÏÏÏÏÏ (102.4) (34.0) (36.9)
Income of parent companyÏÏÏÏÏÏÏÏÏÏÏÏÏÏÏÏÏÏÏÏÏÏÏÏÏÏÏÏÏÏÏÏÏÏÏÏÏÏÏÏÏÏÏÏÏÏÏÏÏÏÏÏÏÏÏÏÏÏÏÏÏÏÏ 1,077.5 2,940.8 1,504.5
Equity (deÑciency) in undistributed income of subsidiaries ÏÏÏÏÏÏÏÏÏÏÏÏÏÏÏÏÏÏÏÏÏÏÏÏÏÏÏÏÏÏÏÏÏ 629.0 (65.2) 877.3
Net incomeÏÏÏÏÏÏÏÏÏÏÏÏÏÏÏÏÏÏÏÏÏÏÏÏÏÏÏÏÏÏÏÏÏÏÏÏÏÏÏÏÏÏÏÏÏÏÏÏÏÏÏÏÏÏÏÏÏÏÏÏÏÏÏÏÏÏÏÏÏÏÏ $1,706.5 $2,875.6 $2,381.8
U.S. Bancorp
Note 23
81

Condensed Statement of Cash Flows
Year Ended December 31 (Dollars in Millions) 2001 2000 1999
Operating Activities
Net income ÏÏÏÏÏÏÏÏÏÏÏÏÏÏÏÏÏÏÏÏÏÏÏÏÏÏÏÏÏÏÏÏÏÏÏÏÏÏÏÏÏÏÏÏÏÏÏÏÏÏÏÏÏÏÏÏÏÏÏÏÏÏÏÏÏÏÏÏÏÏÏÏÏÏÏÏÏ $1,706.5 $2,875.6 $2,381.8
Adjustments to reconcile net income to net cash provided by operating activities
(Equity) deÑciency in undistributed income of subsidiaries ÏÏÏÏÏÏÏÏÏÏÏÏÏÏÏÏÏÏÏÏÏÏÏÏÏÏÏÏÏÏ (629.0) 65.2 (877.3)
(Gain) loss on sale of securities, net ÏÏÏÏÏÏÏÏÏÏÏÏÏÏÏÏÏÏÏÏÏÏÏÏÏÏÏÏÏÏÏÏÏÏÏÏÏÏÏÏÏÏÏÏÏÏÏÏÏÏ (8.2) 4.1 (7.0)
Depreciation and amortization of premises and equipment ÏÏÏÏÏÏÏÏÏÏÏÏÏÏÏÏÏÏÏÏÏÏÏÏÏÏÏÏÏÏ 8.7 51.7 76.2
Other, net ÏÏÏÏÏÏÏÏÏÏÏÏÏÏÏÏÏÏÏÏÏÏÏÏÏÏÏÏÏÏÏÏÏÏÏÏÏÏÏÏÏÏÏÏÏÏÏÏÏÏÏÏÏÏÏÏÏÏÏÏÏÏÏÏÏÏÏÏÏÏÏÏÏÏÏ 71.2 (391.1) (3.2)
Net cash provided by operating activities ÏÏÏÏÏÏÏÏÏÏÏÏÏÏÏÏÏÏÏÏÏÏÏÏÏÏÏÏÏÏÏÏÏÏÏÏÏÏÏÏÏÏÏ 1,149.2 2,605.5 1,570.5
Investing Activities
Securities
Sales and maturitiesÏÏÏÏÏÏÏÏÏÏÏÏÏÏÏÏÏÏÏÏÏÏÏÏÏÏÏÏÏÏÏÏÏÏÏÏÏÏÏÏÏÏÏÏÏÏÏÏÏÏÏÏÏÏÏÏÏÏÏÏÏÏÏÏÏÏ 254.9 92.2 128.9
PurchasesÏÏÏÏÏÏÏÏÏÏÏÏÏÏÏÏÏÏÏÏÏÏÏÏÏÏÏÏÏÏÏÏÏÏÏÏÏÏÏÏÏÏÏÏÏÏÏÏÏÏÏÏÏÏÏÏÏÏÏÏÏÏÏÏÏÏÏÏÏÏÏÏÏÏÏ (73.5) (59.4) (334.3)
Investments in subsidiariesÏÏÏÏÏÏÏÏÏÏÏÏÏÏÏÏÏÏÏÏÏÏÏÏÏÏÏÏÏÏÏÏÏÏÏÏÏÏÏÏÏÏÏÏÏÏÏÏÏÏÏÏÏÏÏÏÏÏÏÏÏÏÏ (1,941.0) (4.6) (26.0)
Equity distributions from subsidiaries ÏÏÏÏÏÏÏÏÏÏÏÏÏÏÏÏÏÏÏÏÏÏÏÏÏÏÏÏÏÏÏÏÏÏÏÏÏÏÏÏÏÏÏÏÏÏÏÏÏÏÏÏÏ 600.0 Ì 145.0
Net decrease (increase) in advances to aÇliates ÏÏÏÏÏÏÏÏÏÏÏÏÏÏÏÏÏÏÏÏÏÏÏÏÏÏÏÏÏÏÏÏÏÏÏÏÏÏÏÏÏÏ 1,759.6 (829.0) 58.1
Other, net ÏÏÏÏÏÏÏÏÏÏÏÏÏÏÏÏÏÏÏÏÏÏÏÏÏÏÏÏÏÏÏÏÏÏÏÏÏÏÏÏÏÏÏÏÏÏÏÏÏÏÏÏÏÏÏÏÏÏÏÏÏÏÏÏÏÏÏÏÏÏÏÏÏÏÏÏÏÏ 34.7 (113.7) (421.3)
Net cash provided by (used in) investing activities ÏÏÏÏÏÏÏÏÏÏÏÏÏÏÏÏÏÏÏÏÏÏÏÏÏÏÏÏÏÏÏÏÏÏ 634.7 (914.5) (449.6)
Financing Activities
Net (decrease) increase in short-term advances from subsidiariesÏÏÏÏÏÏÏÏÏÏÏÏÏÏÏÏÏÏÏÏÏÏÏÏÏÏ (10.6) (15.6) 62.6
Net increase (decrease )in short-term funds borrowed ÏÏÏÏÏÏÏÏÏÏÏÏÏÏÏÏÏÏÏÏÏÏÏÏÏÏÏÏÏÏÏÏÏÏÏÏ 228.9 53.3 (11.5)
Net (decrease) increase in long-term debt ÏÏÏÏÏÏÏÏÏÏÏÏÏÏÏÏÏÏÏÏÏÏÏÏÏÏÏÏÏÏÏÏÏÏÏÏÏÏÏÏÏÏÏÏÏÏÏÏ (512.8) 1,183.7 824.8
Proceeds from issuance of junior subordinated debentures to subsidiary trusts ÏÏÏÏÏÏÏÏÏÏÏÏÏÏ 1,546.4 Ì Ì
Proceeds from issuance of common stock ÏÏÏÏÏÏÏÏÏÏÏÏÏÏÏÏÏÏÏÏÏÏÏÏÏÏÏÏÏÏÏÏÏÏÏÏÏÏÏÏÏÏÏÏÏÏÏÏ 136.4 210.0 277.6
Repurchase of common stockÏÏÏÏÏÏÏÏÏÏÏÏÏÏÏÏÏÏÏÏÏÏÏÏÏÏÏÏÏÏÏÏÏÏÏÏÏÏÏÏÏÏÏÏÏÏÏÏÏÏÏÏÏÏÏÏÏÏÏÏ (467.9) (1,182.2) (1,187.9)
Cash dividends paid ÏÏÏÏÏÏÏÏÏÏÏÏÏÏÏÏÏÏÏÏÏÏÏÏÏÏÏÏÏÏÏÏÏÏÏÏÏÏÏÏÏÏÏÏÏÏÏÏÏÏÏÏÏÏÏÏÏÏÏÏÏÏÏÏÏÏÏÏÏ (1,235.1) (1,271.3) (1,029.7)
Net cash used in Ñnancing activities ÏÏÏÏÏÏÏÏÏÏÏÏÏÏÏÏÏÏÏÏÏÏÏÏÏÏÏÏÏÏÏÏÏÏÏÏÏÏÏÏÏÏÏÏÏÏÏÏ (314.7) (1,022.1) (1,064.1)
Change in cash and cash equivalents ÏÏÏÏÏÏÏÏÏÏÏÏÏÏÏÏÏÏÏÏÏÏÏÏÏÏÏÏÏÏÏÏÏÏÏÏÏÏÏÏÏÏÏÏÏÏ 1,469.2 668.9 56.8
Cash and cash equivalents at beginning of year ÏÏÏÏÏÏÏÏÏÏÏÏÏÏÏÏÏÏÏÏÏÏÏÏÏÏÏÏÏÏÏÏÏÏÏÏÏÏÏÏÏÏÏ 1,714.4 1,045.5 988.7
Cash and cash equivalents at end of year ÏÏÏÏÏÏÏÏÏÏÏÏÏÏÏÏÏÏÏÏÏÏÏÏÏÏÏÏÏÏÏÏÏÏÏÏÏÏÏÏÏÏ $3,183.6 $1,714.4 $1,045.5
Transfer of funds (dividends, loans or advances) from total dividends by a national bank in any calendar year
bank subsidiaries to the Company is restricted. Federal law exceed the bank's net income for that year combined with
prohibits loans unless they are secured and generally limits its retained net income for the preceding two calendar years
any loan to the Company or individual aÇliate to or if the bank's retained earnings are less than zero.
10 percent of the bank's equity. In aggregate, loans to the Furthermore, dividends are restricted by the Comptroller of
Company and all aÇliates cannot exceed 20 percent of the the Currency's minimum capital constraints for all national
bank's equity. banks. Within these guidelines, all bank subsidiaries have
Dividend payments to the Company by its subsidiary the ability to pay dividends without prior regulatory
banks are subject to regulatory review and statutory approval. The amount of dividends available to the parent
limitations and, in some instances, regulatory approval. The company from the bank subsidiaries at December 31, 2001,
approval of the Comptroller of the Currency is required if was $1,183 million.
U.S. Bancorp82
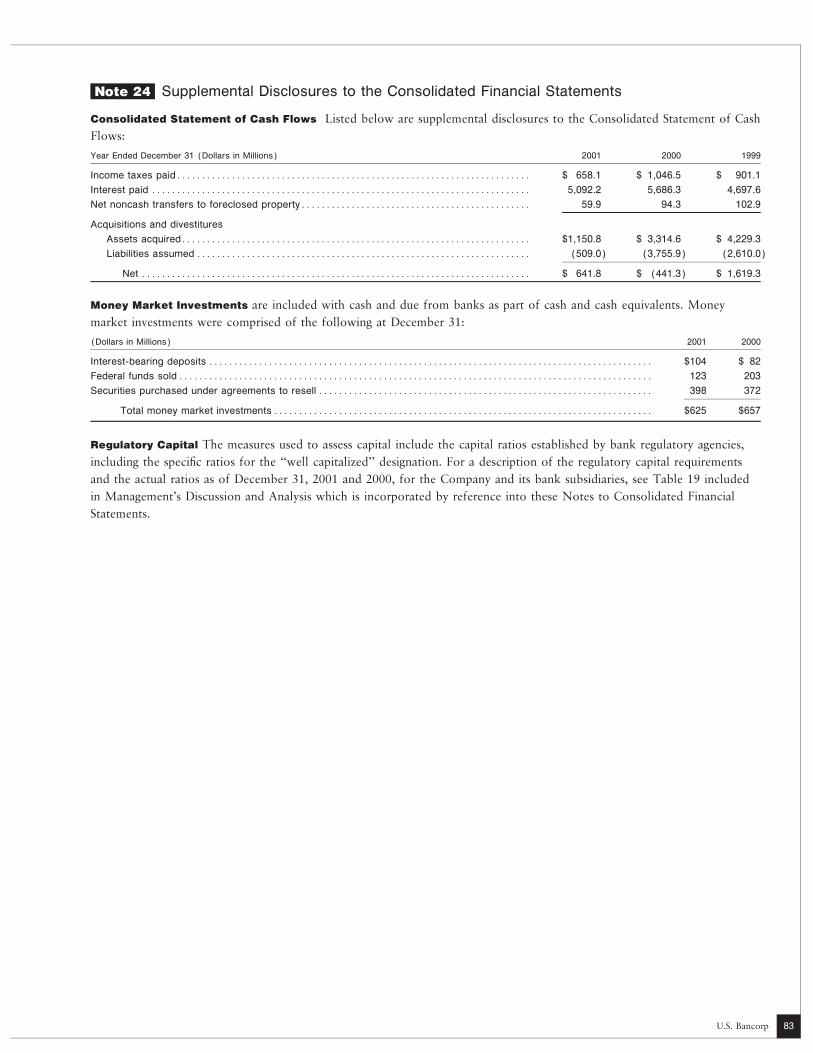
Supplemental Disclosures to the Consolidated Financial Statements
Consolidated Statement of Cash Flows Listed below are supplemental disclosures to the Consolidated Statement of Cash
Flows:
Year Ended December 31 (Dollars in Millions) 2001 2000 1999
Income taxes paidÏÏÏÏÏÏÏÏÏÏÏÏÏÏÏÏÏÏÏÏÏÏÏÏÏÏÏÏÏÏÏÏÏÏÏÏÏÏÏÏÏÏÏÏÏÏÏÏÏÏÏÏÏÏÏÏÏÏÏÏÏÏÏÏÏÏÏÏÏÏÏ $ 658.1 $ 1,046.5 $ 901.1
Interest paid ÏÏÏÏÏÏÏÏÏÏÏÏÏÏÏÏÏÏÏÏÏÏÏÏÏÏÏÏÏÏÏÏÏÏÏÏÏÏÏÏÏÏÏÏÏÏÏÏÏÏÏÏÏÏÏÏÏÏÏÏÏÏÏÏÏÏÏÏÏÏÏÏÏÏÏÏ 5,092.2 5,686.3 4,697.6
Net noncash transfers to foreclosed propertyÏÏÏÏÏÏÏÏÏÏÏÏÏÏÏÏÏÏÏÏÏÏÏÏÏÏÏÏÏÏÏÏÏÏÏÏÏÏÏÏÏÏÏÏÏÏ 59.9 94.3 102.9
Acquisitions and divestitures
Assets acquiredÏÏÏÏÏÏÏÏÏÏÏÏÏÏÏÏÏÏÏÏÏÏÏÏÏÏÏÏÏÏÏÏÏÏÏÏÏÏÏÏÏÏÏÏÏÏÏÏÏÏÏÏÏÏÏÏÏÏÏÏÏÏÏÏÏÏÏÏÏÏ $1,150.8 $ 3,314.6 $ 4,229.3
Liabilities assumed ÏÏÏÏÏÏÏÏÏÏÏÏÏÏÏÏÏÏÏÏÏÏÏÏÏÏÏÏÏÏÏÏÏÏÏÏÏÏÏÏÏÏÏÏÏÏÏÏÏÏÏÏÏÏÏÏÏÏÏÏÏÏÏÏÏÏÏ (509.0) (3,755.9) (2,610.0)
Net ÏÏÏÏÏÏÏÏÏÏÏÏÏÏÏÏÏÏÏÏÏÏÏÏÏÏÏÏÏÏÏÏÏÏÏÏÏÏÏÏÏÏÏÏÏÏÏÏÏÏÏÏÏÏÏÏÏÏÏÏÏÏÏÏÏÏÏÏÏÏÏÏÏÏÏÏÏÏ $ 641.8 $ (441.3) $ 1,619.3
Money Market Investments are included with cash and due from banks as part of cash and cash equivalents. Money
market investments were comprised of the following at December 31:
(Dollars in Millions) 2001 2000
Interest-bearing deposits ÏÏÏÏÏÏÏÏÏÏÏÏÏÏÏÏÏÏÏÏÏÏÏÏÏÏÏÏÏÏÏÏÏÏÏÏÏÏÏÏÏÏÏÏÏÏÏÏÏÏÏÏÏÏÏÏÏÏÏÏÏÏÏÏÏÏÏÏÏÏÏÏÏÏÏÏÏÏÏÏÏÏÏÏÏÏÏÏÏ $104 $ 82
Federal funds sold ÏÏÏÏÏÏÏÏÏÏÏÏÏÏÏÏÏÏÏÏÏÏÏÏÏÏÏÏÏÏÏÏÏÏÏÏÏÏÏÏÏÏÏÏÏÏÏÏÏÏÏÏÏÏÏÏÏÏÏÏÏÏÏÏÏÏÏÏÏÏÏÏÏÏÏÏÏÏÏÏÏÏÏÏÏÏÏÏÏÏÏÏÏÏÏ 123 203
Securities purchased under agreements to resell ÏÏÏÏÏÏÏÏÏÏÏÏÏÏÏÏÏÏÏÏÏÏÏÏÏÏÏÏÏÏÏÏÏÏÏÏÏÏÏÏÏÏÏÏÏÏÏÏÏÏÏÏÏÏÏÏÏÏÏÏÏÏÏÏÏÏÏ 398 372
Total money market investments ÏÏÏÏÏÏÏÏÏÏÏÏÏÏÏÏÏÏÏÏÏÏÏÏÏÏÏÏÏÏÏÏÏÏÏÏÏÏÏÏÏÏÏÏÏÏÏÏÏÏÏÏÏÏÏÏÏÏÏÏÏÏÏÏÏÏÏÏÏÏÏÏÏÏÏÏ $625 $657
Regulatory Capital The measures used to assess capital include the capital ratios established by bank regulatory agencies,
including the speciÑc ratios for the ""well capitalized'' designation. For a description of the regulatory capital requirements
and the actual ratios as of December 31, 2001 and 2000, for the Company and its bank subsidiaries, see Table 19 included
in Management's Discussion and Analysis which is incorporated by reference into these Notes to Consolidated Financial
Statements.
U.S. Bancorp
Note 24
83
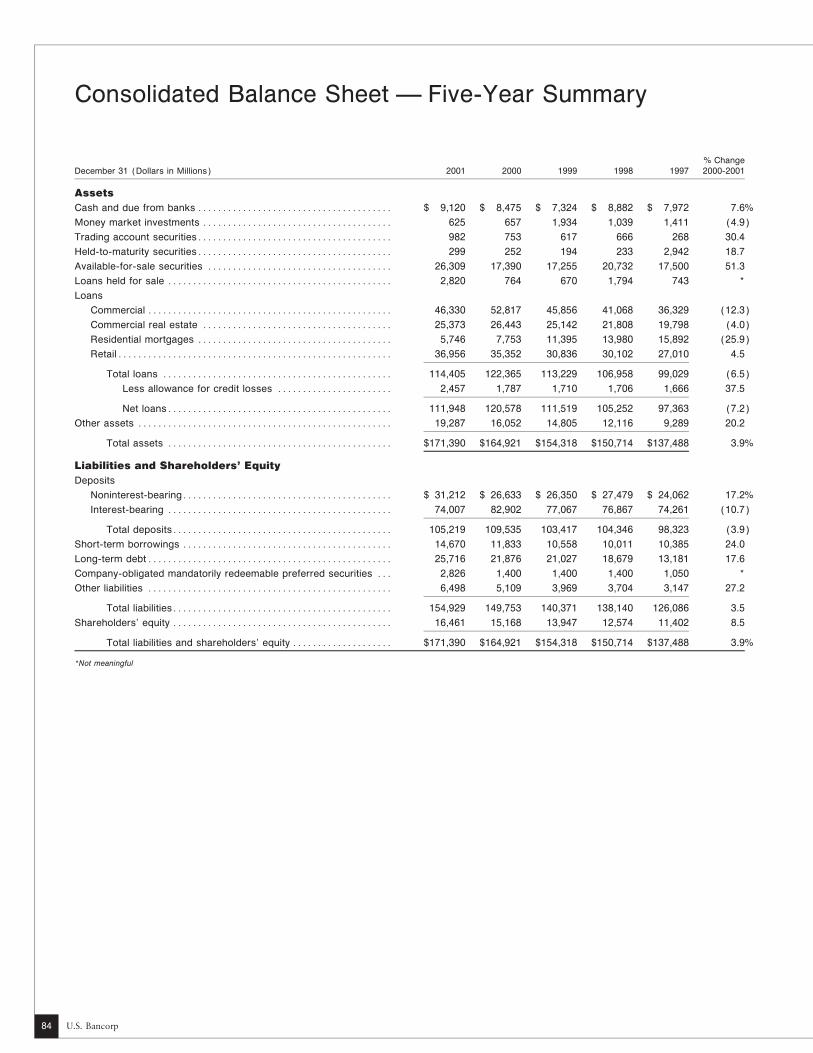
Consolidated Balance Sheet Ì Five-Year Summary
% ChangeDecember 31 (Dollars in Millions) 2001 2000 1999 1998 1997 2000-2001
Assets
Cash and due from banks ÏÏÏÏÏÏÏÏÏÏÏÏÏÏÏÏÏÏÏÏÏÏÏÏÏÏÏÏÏÏÏÏÏÏÏÏÏÏÏ $ 9,120 $ 8,475 $ 7,324 $ 8,882 $ 7,972 7.6%
Money market investments ÏÏÏÏÏÏÏÏÏÏÏÏÏÏÏÏÏÏÏÏÏÏÏÏÏÏÏÏÏÏÏÏÏÏÏÏÏÏ 625 657 1,934 1,039 1,411 (4.9)
Trading account securitiesÏÏÏÏÏÏÏÏÏÏÏÏÏÏÏÏÏÏÏÏÏÏÏÏÏÏÏÏÏÏÏÏÏÏÏÏÏÏÏ 982 753 617 666 268 30.4
Held-to-maturity securitiesÏÏÏÏÏÏÏÏÏÏÏÏÏÏÏÏÏÏÏÏÏÏÏÏÏÏÏÏÏÏÏÏÏÏÏÏÏÏÏ 299 252 194 233 2,942 18.7
Available-for-sale securities ÏÏÏÏÏÏÏÏÏÏÏÏÏÏÏÏÏÏÏÏÏÏÏÏÏÏÏÏÏÏÏÏÏÏÏÏÏ 26,309 17,390 17,255 20,732 17,500 51.3
Loans held for sale ÏÏÏÏÏÏÏÏÏÏÏÏÏÏÏÏÏÏÏÏÏÏÏÏÏÏÏÏÏÏÏÏÏÏÏÏÏÏÏÏÏÏÏÏÏ 2,820 764 670 1,794 743 *
Loans
Commercial ÏÏÏÏÏÏÏÏÏÏÏÏÏÏÏÏÏÏÏÏÏÏÏÏÏÏÏÏÏÏÏÏÏÏÏÏÏÏÏÏÏÏÏÏÏÏÏÏÏ 46,330 52,817 45,856 41,068 36,329 (12.3)
Commercial real estate ÏÏÏÏÏÏÏÏÏÏÏÏÏÏÏÏÏÏÏÏÏÏÏÏÏÏÏÏÏÏÏÏÏÏÏÏÏÏ 25,373 26,443 25,142 21,808 19,798 (4.0)
Residential mortgages ÏÏÏÏÏÏÏÏÏÏÏÏÏÏÏÏÏÏÏÏÏÏÏÏÏÏÏÏÏÏÏÏÏÏÏÏÏÏÏ 5,746 7,753 11,395 13,980 15,892 (25.9)
RetailÏÏÏÏÏÏÏÏÏÏÏÏÏÏÏÏÏÏÏÏÏÏÏÏÏÏÏÏÏÏÏÏÏÏÏÏÏÏÏÏÏÏÏÏÏÏÏÏÏÏÏÏÏÏÏ 36,956 35,352 30,836 30,102 27,010 4.5
Total loans ÏÏÏÏÏÏÏÏÏÏÏÏÏÏÏÏÏÏÏÏÏÏÏÏÏÏÏÏÏÏÏÏÏÏÏÏÏÏÏÏÏÏÏÏÏÏ 114,405 122,365 113,229 106,958 99,029 (6.5)
Less allowance for credit losses ÏÏÏÏÏÏÏÏÏÏÏÏÏÏÏÏÏÏÏÏÏÏÏ 2,457 1,787 1,710 1,706 1,666 37.5
Net loansÏÏÏÏÏÏÏÏÏÏÏÏÏÏÏÏÏÏÏÏÏÏÏÏÏÏÏÏÏÏÏÏÏÏÏÏÏÏÏÏÏÏÏÏÏ 111,948 120,578 111,519 105,252 97,363 (7.2)
Other assets ÏÏÏÏÏÏÏÏÏÏÏÏÏÏÏÏÏÏÏÏÏÏÏÏÏÏÏÏÏÏÏÏÏÏÏÏÏÏÏÏÏÏÏÏÏÏÏÏÏÏÏ 19,287 16,052 14,805 12,116 9,289 20.2
Total assets ÏÏÏÏÏÏÏÏÏÏÏÏÏÏÏÏÏÏÏÏÏÏÏÏÏÏÏÏÏÏÏÏÏÏÏÏÏÏÏÏÏÏÏÏÏ $171,390 $164,921 $154,318 $150,714 $137,488 3.9%
Liabilities and Shareholders' Equity
Deposits
Noninterest-bearingÏÏÏÏÏÏÏÏÏÏÏÏÏÏÏÏÏÏÏÏÏÏÏÏÏÏÏÏÏÏÏÏÏÏÏÏÏÏÏÏÏÏ $ 31,212 $ 26,633 $ 26,350 $ 27,479 $ 24,062 17.2%
Interest-bearing ÏÏÏÏÏÏÏÏÏÏÏÏÏÏÏÏÏÏÏÏÏÏÏÏÏÏÏÏÏÏÏÏÏÏÏÏÏÏÏÏÏÏÏÏÏ 74,007 82,902 77,067 76,867 74,261 (10.7)
Total depositsÏÏÏÏÏÏÏÏÏÏÏÏÏÏÏÏÏÏÏÏÏÏÏÏÏÏÏÏÏÏÏÏÏÏÏÏÏÏÏÏÏÏÏÏ 105,219 109,535 103,417 104,346 98,323 (3.9)
Short-term borrowings ÏÏÏÏÏÏÏÏÏÏÏÏÏÏÏÏÏÏÏÏÏÏÏÏÏÏÏÏÏÏÏÏÏÏÏÏÏÏÏÏÏÏ 14,670 11,833 10,558 10,011 10,385 24.0
Long-term debtÏÏÏÏÏÏÏÏÏÏÏÏÏÏÏÏÏÏÏÏÏÏÏÏÏÏÏÏÏÏÏÏÏÏÏÏÏÏÏÏÏÏÏÏÏÏÏÏÏ 25,716 21,876 21,027 18,679 13,181 17.6
Company-obligated mandatorily redeemable preferred securities ÏÏÏ 2,826 1,400 1,400 1,400 1,050 *
Other liabilities ÏÏÏÏÏÏÏÏÏÏÏÏÏÏÏÏÏÏÏÏÏÏÏÏÏÏÏÏÏÏÏÏÏÏÏÏÏÏÏÏÏÏÏÏÏÏÏÏÏ 6,498 5,109 3,969 3,704 3,147 27.2
Total liabilitiesÏÏÏÏÏÏÏÏÏÏÏÏÏÏÏÏÏÏÏÏÏÏÏÏÏÏÏÏÏÏÏÏÏÏÏÏÏÏÏÏÏÏÏÏ 154,929 149,753 140,371 138,140 126,086 3.5
Shareholders' equity ÏÏÏÏÏÏÏÏÏÏÏÏÏÏÏÏÏÏÏÏÏÏÏÏÏÏÏÏÏÏÏÏÏÏÏÏÏÏÏÏÏÏÏÏ 16,461 15,168 13,947 12,574 11,402 8.5
Total liabilities and shareholders' equity ÏÏÏÏÏÏÏÏÏÏÏÏÏÏÏÏÏÏÏÏ $171,390 $164,921 $154,318 $150,714 $137,488 3.9%
*Not meaningful
U.S. Bancorp84

Consolidated Statement of Income Ì Five-Year Summary
% ChangeYear Ended December 31 (Dollars in Millions) 2001 2000 1999 1998 1997 2000-2001
Interest Income
Loans ÏÏÏÏÏÏÏÏÏÏÏÏÏÏÏÏÏÏÏÏÏÏÏÏÏÏÏÏÏÏÏÏÏÏÏÏÏÏÏÏÏÏÏÏÏÏÏÏÏÏÏÏÏÏÏÏÏ $ 9,455.4 $10,562.5 $ 9,122.7 $ 8,818.3 $8,419.0 (10.5)%
Loans held for saleÏÏÏÏÏÏÏÏÏÏÏÏÏÏÏÏÏÏÏÏÏÏÏÏÏÏÏÏÏÏÏÏÏÏÏÏÏÏÏÏÏÏÏÏÏ 146.9 102.1 103.9 91.9 40.0 43.9
Investment securities
Taxable ÏÏÏÏÏÏÏÏÏÏÏÏÏÏÏÏÏÏÏÏÏÏÏÏÏÏÏÏÏÏÏÏÏÏÏÏÏÏÏÏÏÏÏÏÏÏÏÏÏÏÏÏ 1,206.1 1,008.3 1,047.1 1,179.5 1,060.7 19.6
Non-taxable ÏÏÏÏÏÏÏÏÏÏÏÏÏÏÏÏÏÏÏÏÏÏÏÏÏÏÏÏÏÏÏÏÏÏÏÏÏÏÏÏÏÏÏÏÏÏÏÏ 89.5 140.6 150.1 158.2 158.0 (36.3)
Money market investments ÏÏÏÏÏÏÏÏÏÏÏÏÏÏÏÏÏÏÏÏÏÏÏÏÏÏÏÏÏÏÏÏÏÏÏÏÏ 26.6 53.9 44.9 63.0 63.6 (50.6)
Trading securities ÏÏÏÏÏÏÏÏÏÏÏÏÏÏÏÏÏÏÏÏÏÏÏÏÏÏÏÏÏÏÏÏÏÏÏÏÏÏÏÏÏÏÏÏÏÏ 57.5 53.7 45.0 25.6 16.8 7.1
Other interest income ÏÏÏÏÏÏÏÏÏÏÏÏÏÏÏÏÏÏÏÏÏÏÏÏÏÏÏÏÏÏÏÏÏÏÏÏÏÏÏÏÏÏ 101.6 151.4 113.0 88.2 42.6 (32.9)
Total interest incomeÏÏÏÏÏÏÏÏÏÏÏÏÏÏÏÏÏÏÏÏÏÏÏÏÏÏÏÏÏÏÏÏÏÏÏÏÏ 11,083.6 12,072.5 10,626.7 10,424.7 9,800.7 (8.2)
Interest Expense
Deposits ÏÏÏÏÏÏÏÏÏÏÏÏÏÏÏÏÏÏÏÏÏÏÏÏÏÏÏÏÏÏÏÏÏÏÏÏÏÏÏÏÏÏÏÏÏÏÏÏÏÏÏÏÏÏ 2,828.1 3,618.8 2,970.0 3,234.7 3,084.2 (21.8)
Short-term borrowingsÏÏÏÏÏÏÏÏÏÏÏÏÏÏÏÏÏÏÏÏÏÏÏÏÏÏÏÏÏÏÏÏÏÏÏÏÏÏÏÏÏÏ 534.1 781.7 582.4 594.7 643.3 (31.7)
Long-term debt ÏÏÏÏÏÏÏÏÏÏÏÏÏÏÏÏÏÏÏÏÏÏÏÏÏÏÏÏÏÏÏÏÏÏÏÏÏÏÏÏÏÏÏÏÏÏÏÏ 1,162.7 1,510.4 1,126.9 926.5 586.0 (23.0)
Company-obligated mandatorily redeemable preferred securities ÏÏÏ 149.9 112.0 111.0 103.8 76.3 33.8
Total interest expense ÏÏÏÏÏÏÏÏÏÏÏÏÏÏÏÏÏÏÏÏÏÏÏÏÏÏÏÏÏÏÏÏÏÏÏ 4,674.8 6,022.9 4,790.3 4,859.7 4,389.8 (22.4)
Net interest income ÏÏÏÏÏÏÏÏÏÏÏÏÏÏÏÏÏÏÏÏÏÏÏÏÏÏÏÏÏÏÏÏÏÏÏÏÏÏÏÏÏÏÏÏ 6,408.8 6,049.6 5,836.4 5,565.0 5,410.9 5.9
Provision for credit losses ÏÏÏÏÏÏÏÏÏÏÏÏÏÏÏÏÏÏÏÏÏÏÏÏÏÏÏÏÏÏÏÏÏÏÏÏÏÏ 2,528.8 828.0 646.0 491.3 639.9 **
Net interest income after provision for credit lossesÏÏÏÏÏÏÏÏÏÏÏÏÏÏÏ 3,880.0 5,221.6 5,190.4 5,073.7 4,771.0 (25.7)
Noninterest Income
Credit card fee revenueÏÏÏÏÏÏÏÏÏÏÏÏÏÏÏÏÏÏÏÏÏÏÏÏÏÏÏÏÏÏÏÏÏÏÏÏÏÏÏÏÏ 774.3 761.8 648.2 748.0 611.8 1.6
Merchant and ATM processing revenueÏÏÏÏÏÏÏÏÏÏÏÏÏÏÏÏÏÏÏÏÏÏÏÏÏÏ 428.8 230.3 189.6 * * 86.2
Trust and investment management feesÏÏÏÏÏÏÏÏÏÏÏÏÏÏÏÏÏÏÏÏÏÏÏÏÏÏ 894.4 926.2 887.1 788.3 686.1 (3.4)
Deposit service charges ÏÏÏÏÏÏÏÏÏÏÏÏÏÏÏÏÏÏÏÏÏÏÏÏÏÏÏÏÏÏÏÏÏÏÏÏÏÏÏÏ 660.6 551.1 497.2 470.3 450.6 19.9
Cash management feesÏÏÏÏÏÏÏÏÏÏÏÏÏÏÏÏÏÏÏÏÏÏÏÏÏÏÏÏÏÏÏÏÏÏÏÏÏÏÏÏÏ 347.3 292.4 280.6 242.0 214.2 18.8
Mortgage banking revenueÏÏÏÏÏÏÏÏÏÏÏÏÏÏÏÏÏÏÏÏÏÏÏÏÏÏÏÏÏÏÏÏÏÏÏÏÏÏ 234.0 189.9 190.4 244.6 137.9 23.2
Trading account proÑts and commissions ÏÏÏÏÏÏÏÏÏÏÏÏÏÏÏÏÏÏÏÏÏÏÏÏ 221.6 258.4 222.4 130.3 44.8 (14.2)
Investment products fees and commissions ÏÏÏÏÏÏÏÏÏÏÏÏÏÏÏÏÏÏÏÏÏÏ 460.1 466.6 450.8 306.9 110.4 (1.4)
Investment banking revenue ÏÏÏÏÏÏÏÏÏÏÏÏÏÏÏÏÏÏÏÏÏÏÏÏÏÏÏÏÏÏÏÏÏÏÏÏ 258.2 360.3 246.6 100.4 Ì (28.3)
Commercial product revenueÏÏÏÏÏÏÏÏÏÏÏÏÏÏÏÏÏÏÏÏÏÏÏÏÏÏÏÏÏÏÏÏÏÏÏÏ 385.9 304.4 215.7 121.9 97.9 26.8
Securities gains, netÏÏÏÏÏÏÏÏÏÏÏÏÏÏÏÏÏÏÏÏÏÏÏÏÏÏÏÏÏÏÏÏÏÏÏÏÏÏÏÏÏÏÏÏ 329.1 8.1 13.2 29.1 7.3 **
Merger and restructuring-related gainsÏÏÏÏÏÏÏÏÏÏÏÏÏÏÏÏÏÏÏÏÏÏÏÏÏÏÏ 62.2 Ì Ì 48.1 Ì **
Other ÏÏÏÏÏÏÏÏÏÏÏÏÏÏÏÏÏÏÏÏÏÏÏÏÏÏÏÏÏÏÏÏÏÏÏÏÏÏÏÏÏÏÏÏÏÏÏÏÏÏÏÏÏÏÏÏÏ 302.9 533.7 403.1 420.1 357.6 (43.2)
Total noninterest income ÏÏÏÏÏÏÏÏÏÏÏÏÏÏÏÏÏÏÏÏÏÏÏÏÏÏÏÏÏÏÏÏÏ 5,359.4 4,883.2 4,244.9 3,650.0 2,718.6 9.8
Noninterest Expense
Salaries ÏÏÏÏÏÏÏÏÏÏÏÏÏÏÏÏÏÏÏÏÏÏÏÏÏÏÏÏÏÏÏÏÏÏÏÏÏÏÏÏÏÏÏÏÏÏÏÏÏÏÏÏÏÏÏ 2,347.1 2,427.1 2,355.3 2,196.7 1,892.0 (3.3)
Employee beneÑts ÏÏÏÏÏÏÏÏÏÏÏÏÏÏÏÏÏÏÏÏÏÏÏÏÏÏÏÏÏÏÏÏÏÏÏÏÏÏÏÏÏÏÏÏÏ 366.2 399.8 410.1 424.9 424.0 (8.4)
Net occupancyÏÏÏÏÏÏÏÏÏÏÏÏÏÏÏÏÏÏÏÏÏÏÏÏÏÏÏÏÏÏÏÏÏÏÏÏÏÏÏÏÏÏÏÏÏÏÏÏÏ 417.9 396.9 371.8 356.9 335.0 5.3
Furniture and equipmentÏÏÏÏÏÏÏÏÏÏÏÏÏÏÏÏÏÏÏÏÏÏÏÏÏÏÏÏÏÏÏÏÏÏÏÏÏÏÏÏ 305.5 308.2 307.9 314.1 312.3 (.9)
Communication ÏÏÏÏÏÏÏÏÏÏÏÏÏÏÏÏÏÏÏÏÏÏÏÏÏÏÏÏÏÏÏÏÏÏÏÏÏÏÏÏÏÏÏÏÏÏÏÏ 181.4 138.8 123.4 114.2 * 30.7
Postage ÏÏÏÏÏÏÏÏÏÏÏÏÏÏÏÏÏÏÏÏÏÏÏÏÏÏÏÏÏÏÏÏÏÏÏÏÏÏÏÏÏÏÏÏÏÏÏÏÏÏÏÏÏÏÏ 179.8 174.5 170.7 155.4 106.6 3.0
GoodwillÏÏÏÏÏÏÏÏÏÏÏÏÏÏÏÏÏÏÏÏÏÏÏÏÏÏÏÏÏÏÏÏÏÏÏÏÏÏÏÏÏÏÏÏÏÏÏÏÏÏÏÏÏÏÏ 251.1 235.0 175.8 176.0 114.1 6.9
Other intangible assets ÏÏÏÏÏÏÏÏÏÏÏÏÏÏÏÏÏÏÏÏÏÏÏÏÏÏÏÏÏÏÏÏÏÏÏÏÏÏÏÏÏ 278.4 157.3 154.0 125.8 93.3 77.0
Merger and restructuring-related charges ÏÏÏÏÏÏÏÏÏÏÏÏÏÏÏÏÏÏÏÏÏÏÏÏ 946.4 348.7 532.8 593.8 633.0 **
Other ÏÏÏÏÏÏÏÏÏÏÏÏÏÏÏÏÏÏÏÏÏÏÏÏÏÏÏÏÏÏÏÏÏÏÏÏÏÏÏÏÏÏÏÏÏÏÏÏÏÏÏÏÏÏÏÏÏ 1,331.4 1,130.7 1,059.5 965.6 1,029.4 17.8
Total noninterest expense ÏÏÏÏÏÏÏÏÏÏÏÏÏÏÏÏÏÏÏÏÏÏÏÏÏÏÏÏÏÏÏÏ 6,605.2 5,717.0 5,661.3 5,423.4 4,939.7 15.5
Income before income taxes ÏÏÏÏÏÏÏÏÏÏÏÏÏÏÏÏÏÏÏÏÏÏÏÏÏÏÏÏÏÏÏÏÏÏÏÏ 2,634.2 4,387.8 3,774.0 3,300.3 2,549.9 (40.0)
Applicable income taxes ÏÏÏÏÏÏÏÏÏÏÏÏÏÏÏÏÏÏÏÏÏÏÏÏÏÏÏÏÏÏÏÏÏÏÏÏÏÏÏÏ 927.7 1,512.2 1,392.2 1,167.4 950.6 (38.7)
Net income ÏÏÏÏÏÏÏÏÏÏÏÏÏÏÏÏÏÏÏÏÏÏÏÏÏÏÏÏÏÏÏÏÏÏÏÏÏÏÏÏÏÏÏÏÏÏÏÏÏÏÏÏ $ 1,706.5 $ 2,875.6 $ 2,381.8 $ 2,132.9 $1,599.3 (40.7)
Net income applicable to common equityÏÏÏÏÏÏÏÏÏÏÏÏÏÏÏÏÏÏÏÏÏÏÏÏÏ $ 1,706.5 $ 2,875.6 $ 2,381.8 $ 2,132.8 $1,588.2 (40.7)%
*Information not available
**Not meaningful
U.S. Bancorp 85

Consolidated Daily Average Balance Sheet and Related
Year Ended December 31 2001 2000
Yields Yields(Dollars in Millions) Balance Interest and Rates Balance Interest and Rates
Assets
Money market investments ÏÏÏÏÏÏÏÏÏÏÏÏÏÏÏÏÏÏÏÏÏÏÏÏÏÏÏÏÏÏÏÏ $ 712 $ 26.6 3.74% $ 931 $ 53.9 5.79%
Trading account securitiesÏÏÏÏÏÏÏÏÏÏÏÏÏÏÏÏÏÏÏÏÏÏÏÏÏÏÏÏÏÏÏÏÏ 771 59.3 7.69 779 57.6 7.39
Taxable securities ÏÏÏÏÏÏÏÏÏÏÏÏÏÏÏÏÏÏÏÏÏÏÏÏÏÏÏÏÏÏÏÏÏÏÏÏÏÏÏÏ 20,129 1,206.1 5.99 14,567 1,008.3 6.92
Non-taxable securities ÏÏÏÏÏÏÏÏÏÏÏÏÏÏÏÏÏÏÏÏÏÏÏÏÏÏÏÏÏÏÏÏÏÏÏÏ 1,787 128.9 7.21 2,744 203.1 7.40
Loans held for sale ÏÏÏÏÏÏÏÏÏÏÏÏÏÏÏÏÏÏÏÏÏÏÏÏÏÏÏÏÏÏÏÏÏÏÏÏÏÏÏ 1,911 146.9 7.69 1,303 102.1 7.84
Loans
Commercial ÏÏÏÏÏÏÏÏÏÏÏÏÏÏÏÏÏÏÏÏÏÏÏÏÏÏÏÏÏÏÏÏÏÏÏÏÏÏÏÏ 50,072 3,642.5 7.31 50,062 4,257.2 8.50
Commercial real estate ÏÏÏÏÏÏÏÏÏÏÏÏÏÏÏÏÏÏÏÏÏÏÏÏÏÏÏÏÏ 26,081 2,011.2 7.71 26,040 2,305.5 8.85
Residential mortgages ÏÏÏÏÏÏÏÏÏÏÏÏÏÏÏÏÏÏÏÏÏÏÏÏÏÏÏÏÏÏ 6,868 513.7 7.48 9,578 723.4 7.55
Retail ÏÏÏÏÏÏÏÏÏÏÏÏÏÏÏÏÏÏÏÏÏÏÏÏÏÏÏÏÏÏÏÏÏÏÏÏÏÏÏÏÏÏÏÏÏ 35,156 3,302.7 9.39 32,637 3,295.4 10.10
Total loans ÏÏÏÏÏÏÏÏÏÏÏÏÏÏÏÏÏÏÏÏÏÏÏÏÏÏÏÏÏÏÏÏÏÏÏÏÏ 118,177 9,470.1 8.01 118,317 10,581.5 8.94
Other earning assetsÏÏÏÏÏÏÏÏÏÏÏÏÏÏÏÏÏÏÏÏÏÏÏÏÏÏÏÏÏÏÏÏÏÏÏÏÏÏ 1,678 101.6 6.05 1,965 151.4 7.70
Allowance for credit lossesÏÏÏÏÏÏÏÏÏÏÏÏÏÏÏÏÏÏÏÏÏÏÏÏÏÏÏÏÏ 1,979 1,781
Total earning assets(a) ÏÏÏÏÏÏÏÏÏÏÏÏÏÏÏÏÏÏÏÏÏÏÏÏÏ 145,165 11,139.5 7.67 140,606 12,157.9 8.65
Other assets ÏÏÏÏÏÏÏÏÏÏÏÏÏÏÏÏÏÏÏÏÏÏÏÏÏÏÏÏÏÏÏÏÏÏÏÏÏÏÏÏÏÏÏÏÏ 22,758 19,656
Total assets ÏÏÏÏÏÏÏÏÏÏÏÏÏÏÏÏÏÏÏÏÏÏÏÏÏÏÏÏÏÏÏÏÏÏÏÏ $165,944 $158,481
Liabilities and Shareholders' Equity
Noninterest-bearing deposits ÏÏÏÏÏÏÏÏÏÏÏÏÏÏÏÏÏÏÏÏÏÏÏÏÏÏÏÏÏÏ $ 25,109 $ 23,820
Interest-bearing deposits
Interest checking ÏÏÏÏÏÏÏÏÏÏÏÏÏÏÏÏÏÏÏÏÏÏÏÏÏÏÏÏÏÏÏÏÏÏÏÏÏÏ 13,962 203.6 1.46 13,035 270.4 2.07
Money market accountsÏÏÏÏÏÏÏÏÏÏÏÏÏÏÏÏÏÏÏÏÏÏÏÏÏÏÏÏÏÏÏÏ 24,932 711.0 2.85 22,774 1,000.0 4.39
Savings accountsÏÏÏÏÏÏÏÏÏÏÏÏÏÏÏÏÏÏÏÏÏÏÏÏÏÏÏÏÏÏÏÏÏÏÏÏÏÏ 4,571 42.5 .93 5,027 74.0 1.47
Time certiÑcates of deposit less than $100,000 ÏÏÏÏÏÏÏÏÏÏ 23,328 1,241.4 5.32 25,861 1,458.3 5.64
Time deposits greater than $100,000ÏÏÏÏÏÏÏÏÏÏÏÏÏÏÏÏÏÏÏÏ 13,054 629.6 4.82 12,909 816.1 6.32
Total interest-bearing deposits ÏÏÏÏÏÏÏÏÏÏÏÏÏÏÏÏÏÏÏ 79,847 2,828.1 3.54 79,606 3,618.8 4.55
Short-term borrowings ÏÏÏÏÏÏÏÏÏÏÏÏÏÏÏÏÏÏÏÏÏÏÏÏÏÏÏÏÏÏÏÏÏÏÏÏ 12,980 534.1 4.11 12,586 781.7 6.21
Long-term debtÏÏÏÏÏÏÏÏÏÏÏÏÏÏÏÏÏÏÏÏÏÏÏÏÏÏÏÏÏÏÏÏÏÏÏÏÏÏÏÏÏÏÏ 24,608 1,162.7 4.72 22,410 1,510.4 6.74
Company-obligated mandatorily redeemable preferred
securities ÏÏÏÏÏÏÏÏÏÏÏÏÏÏÏÏÏÏÏÏÏÏÏÏÏÏÏÏÏÏÏÏÏÏÏÏÏÏÏÏÏÏÏÏÏ 1,955 149.9 7.66 1,400 112.0 8.00
Total interest-bearing liabilities ÏÏÏÏÏÏÏÏÏÏÏÏÏÏÏÏÏÏÏ 119,390 4,674.8 3.92 116,002 6,022.9 5.19
Other liabilities ÏÏÏÏÏÏÏÏÏÏÏÏÏÏÏÏÏÏÏÏÏÏÏÏÏÏÏÏÏÏÏÏÏÏÏÏÏÏÏÏÏÏÏ 5,244 4,294
Shareholders' equity ÏÏÏÏÏÏÏÏÏÏÏÏÏÏÏÏÏÏÏÏÏÏÏÏÏÏÏÏÏÏÏÏÏÏÏÏÏÏ 16,201 14,365
Total liabilities and shareholders' equityÏÏÏÏÏÏÏÏÏÏÏ $165,944 $158,481
Net interest income ÏÏÏÏÏÏÏÏÏÏÏÏÏÏÏÏÏÏÏÏÏÏÏÏÏÏÏÏÏÏÏÏÏÏÏÏÏÏÏ $ 6,464.7 $ 6,135.0
Gross interest margin ÏÏÏÏÏÏÏÏÏÏÏÏÏÏÏÏÏÏÏÏÏÏÏÏÏÏÏÏÏÏÏÏÏÏÏÏÏ 3.75% 3.46%
Gross interest margin without taxable-equivalent
incrementsÏÏÏÏÏÏÏÏÏÏÏÏÏÏÏÏÏÏÏÏÏÏÏÏÏÏÏÏÏÏÏÏÏÏÏÏÏÏÏÏÏÏÏÏ 3.71% 3.40%
Percent of Earning Assets
Interest incomeÏÏÏÏÏÏÏÏÏÏÏÏÏÏÏÏÏÏÏÏÏÏÏÏÏÏÏÏÏÏÏÏÏÏÏÏÏÏÏÏÏÏÏ 7.67% 8.65%
Interest expenseÏÏÏÏÏÏÏÏÏÏÏÏÏÏÏÏÏÏÏÏÏÏÏÏÏÏÏÏÏÏÏÏÏÏÏÏÏÏÏÏÏÏ 3.22 4.29
Net interest margin ÏÏÏÏÏÏÏÏÏÏÏÏÏÏÏÏÏÏÏÏÏÏÏÏÏÏÏÏÏÏÏÏÏÏÏÏÏÏÏ 4.45 4.36
Net interest margin without taxable-equivalent incrementsÏÏÏÏ 4.41% 4.30%
Interest and rates are presented on a fully taxable-equivalent basis under a tax rate of 35 percent.
Interest income and rates on loans include loan fees. Nonaccrual loans are included in average loan balances.
(a) Before deducting the allowance for credit losses and excluding the unrealized gain (loss) on available-for-sale securities.
U.S. Bancorp86

Yields and Rates
1999 1998 2000-2001
Yields Yields % ChangeBalance Interest and Rates Balance Interest and Rates Average Balance
$ 1,082 $ 44.9 4.15% $ 1,170 $ 63.0 5.38% (23.5)%
630 47.8 7.59 428 27.6 6.45 (1.0)
16,301 1,047.1 6.42 17,977 1,179.5 6.56 38.2
2,970 220.6 7.43 3,137 238.2 7.59 (34.9)
1,450 103.9 7.17 1,264 91.9 7.27 46.7
43,328 3,288.3 7.59 38,983 3,110.4 7.98 Ì
23,076 1,940.3 8.41 20,458 1,784.1 8.72 .2
12,680 953.7 7.52 15,160 1,170.5 7.72 (28.3)
30,554 2,963.4 9.70 27,850 2,782.5 9.99 7.7
109,638 9,145.7 8.34 102,451 8,847.5 8.64 (.1)
1,686 113.0 6.70 1,311 88.2 6.73 (14.6)
1,709 1,688 11.1
133,757 10,723.0 8.02 127,738 10,535.9 8.25 3.2
18,119 16,837 15.8
$150,167 $142,887 4.7
$ 23,556 $ 23,011 5.4
12,898 231.0 1.79 12,263 230.9 1.88 7.1
22,534 842.2 3.74 20,337 825.1 4.06 9.5
5,961 111.9 1.88 6,504 146.7 2.26 (9.1)
26,296 1,322.6 5.03 29,583 1,622.7 5.49 (9.8)
8,675 462.3 5.33 7,242 409.3 5.65 1.1
76,364 2,970.0 3.89 75,929 3,234.7 4.26 .3
11,707 582.4 4.97 11,102 594.7 5.36 3.1
20,248 1,126.9 5.57 15,732 926.5 5.89 9.8
1,400 111.0 7.93 1,314 103.8 7.90 39.6
109,719 4,790.3 4.37 104,077 4,859.7 4.67 2.9
3,671 3,416 22.1
13,221 12,383 12.8
$150,167 $142,887 4.7%
$ 5,932.7 $ 5,676.2
3.65% 3.58%
3.57% 3.49%
8.02% 8.25%
3.58 3.81
4.44 4.44
4.36% 4.36%
U.S. Bancorp 87

Quarterly Consolidated Financial Data
2001 2000
First Second Third Fourth First Second Third Fourth(Dollars in Millions, Except Per Share Data) Quarter Quarter Quarter Quarter Quarter Quarter Quarter Quarter
Interest IncomeLoans ÏÏÏÏÏÏÏÏÏÏÏÏÏÏÏÏÏÏÏÏÏÏÏÏÏÏÏÏÏÏÏÏÏÏÏÏÏÏ $2,660.9 $2,437.9 $2,285.6 $2,071.0 $2,472.1 $2,591.8 $2,710.7 $2,787.9
Loans held for sale ÏÏÏÏÏÏÏÏÏÏÏÏÏÏÏÏÏÏÏÏÏÏÏÏÏÏ 16.6 25.9 53.9 50.5 12.0 35.2 32.7 22.2
Investment securities
Taxable ÏÏÏÏÏÏÏÏÏÏÏÏÏÏÏÏÏÏÏÏÏÏÏÏÏÏÏÏÏÏÏÏÏ 253.3 287.8 321.2 343.8 251.0 255.6 250.4 251.3
Non-taxableÏÏÏÏÏÏÏÏÏÏÏÏÏÏÏÏÏÏÏÏÏÏÏÏÏÏÏÏÏÏ 31.2 27.8 15.9 14.6 38.9 33.5 34.8 33.4
Money market investments ÏÏÏÏÏÏÏÏÏÏÏÏÏÏÏÏÏÏÏ 8.9 7.4 6.3 4.0 13.6 15.0 14.5 10.8
Trading securities ÏÏÏÏÏÏÏÏÏÏÏÏÏÏÏÏÏÏÏÏÏÏÏÏÏÏÏ 15.9 14.1 11.2 16.3 14.3 12.6 12.8 14.0
Other interest income ÏÏÏÏÏÏÏÏÏÏÏÏÏÏÏÏÏÏÏÏÏÏÏÏ 32.0 26.1 24.3 19.2 37.3 37.0 37.7 39.4
Total interest income ÏÏÏÏÏÏÏÏÏÏÏÏÏÏÏÏÏÏ 3,018.8 2,827.0 2,718.4 2,519.4 2,839.2 2,980.7 3,093.6 3,159.0
Interest ExpenseDeposits ÏÏÏÏÏÏÏÏÏÏÏÏÏÏÏÏÏÏÏÏÏÏÏÏÏÏÏÏÏÏÏÏÏÏÏÏ 883.7 783.0 670.0 491.4 813.2 875.9 954.0 975.7
Short-term borrowings ÏÏÏÏÏÏÏÏÏÏÏÏÏÏÏÏÏÏÏÏÏÏÏ 186.2 124.4 122.9 100.6 171.1 198.7 191.2 220.7
Long-term debtÏÏÏÏÏÏÏÏÏÏÏÏÏÏÏÏÏÏÏÏÏÏÏÏÏÏÏÏÏÏ 365.7 315.0 276.7 205.3 336.9 371.3 403.9 398.3
Company-obligated mandatorily redeemable
preferred securitiesÏÏÏÏÏÏÏÏÏÏÏÏÏÏÏÏÏÏÏÏÏÏÏ 27.6 35.4 39.7 47.2 28.4 29.3 31.5 22.8
Total interest expense ÏÏÏÏÏÏÏÏÏÏÏÏÏÏÏÏÏ 1,463.2 1,257.8 1,109.3 844.5 1,349.6 1,475.2 1,580.6 1,617.5
Net interest income ÏÏÏÏÏÏÏÏÏÏÏÏÏÏÏÏÏÏÏÏÏÏÏÏÏÏ 1,555.6 1,569.2 1,609.1 1,674.9 1,489.6 1,505.5 1,513.0 1,541.5
Provision for credit lossesÏÏÏÏÏÏÏÏÏÏÏÏÏÏÏÏÏÏÏÏ 532.4 441.3 1,289.3 265.8 183.2 201.3 214.0 229.5
Net interest income after provision for credit
losses ÏÏÏÏÏÏÏÏÏÏÏÏÏÏÏÏÏÏÏÏÏÏÏÏÏÏÏÏÏÏÏÏÏÏÏ 1,023.2 1,127.9 319.8 1,409.1 1,306.4 1,304.2 1,299.0 1,312.0
Noninterest IncomeCredit card fee revenue ÏÏÏÏÏÏÏÏÏÏÏÏÏÏÏÏÏÏÏÏÏÏ 191.7 198.2 192.2 192.2 161.4 187.4 202.2 210.8
Merchant and ATM processing revenue ÏÏÏÏÏÏÏ 58.0 62.4 138.5 169.9 57.5 59.9 59.0 53.9
Trust and investment management fees ÏÏÏÏÏÏÏ 225.0 228.0 226.2 215.2 230.9 230.4 231.1 233.8
Deposit service chargesÏÏÏÏÏÏÏÏÏÏÏÏÏÏÏÏÏÏÏÏÏÏ 146.5 176.7 168.7 168.7 123.4 138.0 144.3 145.4
Cash management fees ÏÏÏÏÏÏÏÏÏÏÏÏÏÏÏÏÏÏÏÏÏÏ 76.8 84.9 89.7 95.9 71.8 74.1 74.7 71.8
Mortgage banking revenue ÏÏÏÏÏÏÏÏÏÏÏÏÏÏÏÏÏÏÏ 48.2 57.0 60.3 68.5 42.7 48.1 44.7 54.4
Trading account proÑts and commissionsÏÏÏÏÏÏ 71.9 55.8 43.6 50.3 85.3 59.8 50.9 62.4
Investment products fees and commissionsÏÏÏÏ 125.7 114.2 108.0 112.2 140.8 109.1 107.8 108.9
Investment banking revenue ÏÏÏÏÏÏÏÏÏÏÏÏÏÏÏÏÏÏ 60.2 71.1 56.9 70.0 94.0 72.9 100.6 92.8
Commercial product revenue ÏÏÏÏÏÏÏÏÏÏÏÏÏÏÏÏÏ 76.1 93.8 96.2 119.8 61.6 71.6 86.0 85.2
Securities gains (losses), net ÏÏÏÏÏÏÏÏÏÏÏÏÏÏÏÏ 216.0 31.3 59.8 22.0 (.3) .3 1.1 7.0
Merger and restructuring-related gains ÏÏÏÏÏÏÏÏ Ì 62.2 Ì Ì Ì Ì Ì Ì
Other ÏÏÏÏÏÏÏÏÏÏÏÏÏÏÏÏÏÏÏÏÏÏÏÏÏÏÏÏÏÏÏÏÏÏÏÏÏÏÏ 104.8 91.0 68.2 38.9 112.3 151.7 131.2 138.5
Total noninterest incomeÏÏÏÏÏÏÏÏÏÏÏÏÏÏÏ 1,400.9 1,326.6 1,308.3 1,323.6 1,181.4 1,203.3 1,233.6 1,264.9
Noninterest ExpenseSalariesÏÏÏÏÏÏÏÏÏÏÏÏÏÏÏÏÏÏÏÏÏÏÏÏÏÏÏÏÏÏÏÏÏÏÏÏÏ 590.5 570.5 580.3 605.8 629.6 601.4 602.4 593.7
Employee beneÑts ÏÏÏÏÏÏÏÏÏÏÏÏÏÏÏÏÏÏÏÏÏÏÏÏÏÏÏ 108.1 90.7 85.4 82.0 111.9 100.3 89.4 98.2
Net occupancy ÏÏÏÏÏÏÏÏÏÏÏÏÏÏÏÏÏÏÏÏÏÏÏÏÏÏÏÏÏÏ 110.1 101.4 102.5 103.9 97.2 95.7 99.8 104.2
Furniture and equipment ÏÏÏÏÏÏÏÏÏÏÏÏÏÏÏÏÏÏÏÏÏ 76.9 74.9 74.9 78.8 76.7 75.7 79.6 76.2
CommunicationÏÏÏÏÏÏÏÏÏÏÏÏÏÏÏÏÏÏÏÏÏÏÏÏÏÏÏÏÏÏ 38.7 50.3 49.4 43.0 33.6 33.8 35.7 35.7
Postage ÏÏÏÏÏÏÏÏÏÏÏÏÏÏÏÏÏÏÏÏÏÏÏÏÏÏÏÏÏÏÏÏÏÏÏÏ 46.9 43.8 44.7 44.4 44.6 42.6 43.1 44.2
Goodwill ÏÏÏÏÏÏÏÏÏÏÏÏÏÏÏÏÏÏÏÏÏÏÏÏÏÏÏÏÏÏÏÏÏÏÏÏ 67.8 58.6 62.3 62.4 56.5 57.8 58.5 62.2
Other intangible assetsÏÏÏÏÏÏÏÏÏÏÏÏÏÏÏÏÏÏÏÏÏÏÏ 46.6 54.0 84.8 93.0 39.3 39.0 39.2 39.8
Merger and restructuring-related chargesÏÏÏÏÏÏ 404.2 252.8 148.8 140.6 65.0 81.9 117.7 84.1
Other ÏÏÏÏÏÏÏÏÏÏÏÏÏÏÏÏÏÏÏÏÏÏÏÏÏÏÏÏÏÏÏÏÏÏÏÏÏÏÏ 308.7 297.7 334.4 390.6 268.2 282.9 286.0 293.6
Total noninterest expense ÏÏÏÏÏÏÏÏÏÏÏÏÏ 1,798.5 1,594.7 1,567.5 1,644.5 1,422.6 1,411.1 1,451.4 1,431.9
Income before income taxesÏÏÏÏÏÏÏÏÏÏÏÏÏÏÏÏÏÏ 625.6 859.8 60.6 1,088.2 1,065.2 1,096.4 1,081.2 1,145.0
Applicable income taxes ÏÏÏÏÏÏÏÏÏÏÏÏÏÏÏÏÏÏÏÏÏ 215.5 297.5 21.9 392.8 378.4 386.6 370.9 376.3
Net income ÏÏÏÏÏÏÏÏÏÏÏÏÏÏÏÏÏÏÏÏÏÏÏÏÏÏÏÏÏÏÏÏÏ $ 410.1 $ 562.3 $ 38.7 $ 695.4 $ 686.8 $ 709.8 $ 710.3 $ 768.7
Earnings per share ÏÏÏÏÏÏÏÏÏÏÏÏÏÏÏÏÏÏÏÏÏÏÏÏÏÏ $ .22 $ .30 $ .02 $ .36 $ .36 $ .37 $ .37 $ .41
Diluted earnings per share ÏÏÏÏÏÏÏÏÏÏÏÏÏÏÏÏÏÏÏ $ .21 $ .29 $ .02 $ .36 $ .36 $ .37 $ .37 $ .40
U.S. Bancorp88
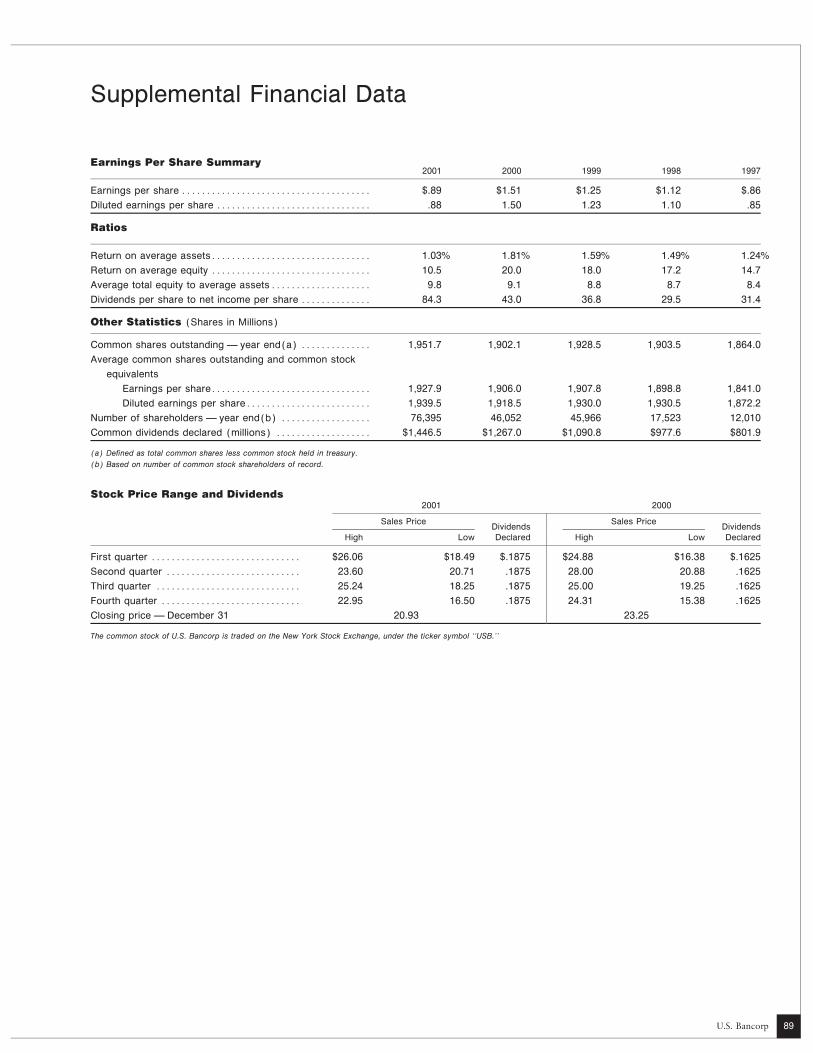
Supplemental Financial Data
Earnings Per Share Summary2001 2000 1999 1998 1997
Earnings per share ÏÏÏÏÏÏÏÏÏÏÏÏÏÏÏÏÏÏÏÏÏÏÏÏÏÏÏÏÏÏÏÏÏÏÏÏÏÏ $.89 $1.51 $1.25 $1.12 $.86
Diluted earnings per share ÏÏÏÏÏÏÏÏÏÏÏÏÏÏÏÏÏÏÏÏÏÏÏÏÏÏÏÏÏÏÏ .88 1.50 1.23 1.10 .85
Ratios
Return on average assetsÏÏÏÏÏÏÏÏÏÏÏÏÏÏÏÏÏÏÏÏÏÏÏÏÏÏÏÏÏÏÏÏ 1.03% 1.81% 1.59% 1.49% 1.24%
Return on average equity ÏÏÏÏÏÏÏÏÏÏÏÏÏÏÏÏÏÏÏÏÏÏÏÏÏÏÏÏÏÏÏÏ 10.5 20.0 18.0 17.2 14.7
Average total equity to average assetsÏÏÏÏÏÏÏÏÏÏÏÏÏÏÏÏÏÏÏÏ 9.8 9.1 8.8 8.7 8.4
Dividends per share to net income per share ÏÏÏÏÏÏÏÏÏÏÏÏÏÏ 84.3 43.0 36.8 29.5 31.4
Other Statistics (Shares in Millions)
Common shares outstanding Ì year end(a) ÏÏÏÏÏÏÏÏÏÏÏÏÏÏ 1,951.7 1,902.1 1,928.5 1,903.5 1,864.0
Average common shares outstanding and common stock
equivalents
Earnings per shareÏÏÏÏÏÏÏÏÏÏÏÏÏÏÏÏÏÏÏÏÏÏÏÏÏÏÏÏÏÏÏÏ 1,927.9 1,906.0 1,907.8 1,898.8 1,841.0
Diluted earnings per shareÏÏÏÏÏÏÏÏÏÏÏÏÏÏÏÏÏÏÏÏÏÏÏÏÏ 1,939.5 1,918.5 1,930.0 1,930.5 1,872.2
Number of shareholders Ì year end(b) ÏÏÏÏÏÏÏÏÏÏÏÏÏÏÏÏÏÏ 76,395 46,052 45,966 17,523 12,010
Common dividends declared (millions) ÏÏÏÏÏÏÏÏÏÏÏÏÏÏÏÏÏÏÏ $1,446.5 $1,267.0 $1,090.8 $977.6 $801.9
(a) DeÑned as total common shares less common stock held in treasury.
(b) Based on number of common stock shareholders of record.
Stock Price Range and Dividends2001 2000
Sales Price Sales PriceDividends Dividends
High Low Declared High Low Declared
First quarter ÏÏÏÏÏÏÏÏÏÏÏÏÏÏÏÏÏÏÏÏÏÏÏÏÏÏÏÏÏÏ $26.06 $18.49 $.1875 $24.88 $16.38 $.1625
Second quarter ÏÏÏÏÏÏÏÏÏÏÏÏÏÏÏÏÏÏÏÏÏÏÏÏÏÏÏ 23.60 20.71 .1875 28.00 20.88 .1625
Third quarter ÏÏÏÏÏÏÏÏÏÏÏÏÏÏÏÏÏÏÏÏÏÏÏÏÏÏÏÏÏ 25.24 18.25 .1875 25.00 19.25 .1625
Fourth quarter ÏÏÏÏÏÏÏÏÏÏÏÏÏÏÏÏÏÏÏÏÏÏÏÏÏÏÏÏ 22.95 16.50 .1875 24.31 15.38 .1625
Closing price Ì December 31 20.93 23.25
The common stock of U.S. Bancorp is traded on the New York Stock Exchange, under the ticker symbol ""USB.''
U.S. Bancorp 89

Annual Report on Form 10-K
Securities and Exchange Commission Index Page
Washington, D.C. 20549Part I
Item 1 BusinessAnnual Report pursuant to Section 13 or 15(d) of theGeneralÏÏÏÏÏÏÏÏÏÏÏÏÏÏÏÏÏÏÏÏÏÏÏÏÏÏÏÏÏÏÏÏÏÏÏÏÏÏÏÏÏ 91-92Securities Exchange Act of 1934 for the Ñscal year endedDistribution of Assets, Liabilities and
December 31, 2001Stockholders' Equity; Interest Rates
and Interest DiÅerential ÏÏÏÏÏÏÏÏÏÏÏÏÏÏÏÏÏ18-20, 86-87Commission File Number 1-6880Investment Portfolio ÏÏÏÏÏÏÏÏÏÏÏÏÏÏÏÏÏÏÏÏÏÏÏÏÏÏ27-28, 61
Loan Portfolio ÏÏÏÏÏÏÏÏÏÏÏÏÏÏÏÏÏÏÏ23-27, 29-36, 54, 62-63U.S. BancorpSummary of Loan Loss Experience ÏÏÏÏÏÏÏÏÏÏÏ 29-36, 54,Incorporated in the State of Delaware
62-63IRS Employer IdentiÑcation #41-0255900
DepositsÏÏÏÏÏÏÏÏÏÏÏÏÏÏÏÏÏÏÏÏÏÏÏÏÏÏÏÏÏÏÏÏÏÏÏÏÏÏÏÏ 28-29Address: 225 South Sixth Street
Return on Equity and Assets ÏÏÏÏÏÏÏÏÏÏÏÏÏÏÏÏÏÏÏÏÏ17, 88Minneapolis, Minnesota 55402-4302 Short-Term Borrowings ÏÏÏÏÏÏÏÏÏÏÏÏÏÏÏÏÏÏÏÏÏÏÏÏÏÏ29, 67
Telephone: (612) 973-1111 Item 2 Properties ÏÏÏÏÏÏÏÏÏÏÏÏÏÏÏÏÏÏÏÏÏÏÏÏÏÏÏÏÏÏÏÏÏÏÏÏÏÏÏÏÏ 92
Item 3 Legal ProceedingsÏÏÏÏÏÏÏÏÏÏÏÏÏÏÏÏÏÏÏÏÏÏÏÏÏÏÏÏÏÏÏÏ noneSecurities registered pursuant to Section 12(b) of the Act
Item 4 Submission of Matters to a Vote of(and listed on the New York Stock Exchange): Common
Security Holders ÏÏÏÏÏÏÏÏÏÏÏÏÏÏÏÏÏÏÏÏÏÏÏÏÏÏÏÏÏÏ noneStock, Par Value $.01. Prior to the merger of U.S. Bancorp
Part IIwith Firstar Corporation, the par value of U.S. Bancorp
Item 5 Market for the Registrant's Common Equitycommon stock was $1.25.
and Related Stockholder Matters ÏÏÏÏÏ3, 40-41, 69-71,Securities registered pursuant to section 12(g) of the 73-75, 89, 90
Act: None. Item 6 Selected Financial Data ÏÏÏÏÏÏÏÏÏÏÏÏÏÏÏÏÏÏÏÏÏÏÏÏÏÏÏÏÏ 17
As of January 31, 2002, U.S. Bancorp had Item 7 Management's Discussion and Analysis of
Financial Condition and Results of Operations ÏÏ 16-471,918,425,072 shares of common stock outstanding. The
Item 7A Quantitative and Qualitative Disclosures Aboutaggregate market value of common stock held by non-Market Risk ÏÏÏÏÏÏÏÏÏÏÏÏÏÏÏÏÏÏÏÏÏÏÏÏÏÏÏÏÏÏÏÏÏ 36-40aÇliates as of January 31, 2002, was approximately
Item 8 Financial Statements and Supplementary Data ÏÏÏÏÏ 49-89$39.0 billion.Item 9 Changes in and Disagreements with Accountants onU.S. Bancorp (1) has Ñled all reports required to be
Accounting and Financial Disclosure ÏÏÏÏÏÏÏÏÏÏÏÏ noneÑled by Section 13 or 15(d) of the Securities Exchange ActPart IIIof 1934 during the preceding 12 months and (2) has beenItem 10 Directors and Executive OÇcers subject to such Ñling requirements for the past 90 days.
of the Registrant ÏÏÏÏÏÏÏÏÏÏÏÏÏÏÏÏÏÏÏÏÏÏÏÏÏÏÏÏ 94-96*Disclosure of delinquent Ñlers pursuant to Item 405 of
Item 11 Executive Compensation ÏÏÏÏÏÏÏÏÏÏÏÏÏÏÏÏÏÏÏÏÏÏÏÏÏÏÏÏÏ *Regulation S-K is contained in the registrant's deÑnitive
Item 12 Security Ownership of Certain BeneÑcial Ownersproxy statement incorporated by reference in Part III of this
and ManagementÏÏÏÏÏÏÏÏÏÏÏÏÏÏÏÏÏÏÏÏÏÏÏÏÏÏÏÏÏÏÏÏÏ *Form 10-K and any amendment to this Form 10-K.
Item 13 Certain Relationships and Related TransactionsÏÏÏÏÏÏÏÏ *This Annual Report and Form 10-K incorporates into a
Part IVsingle document the requirements of the accounting
Item 14 Exhibits, Financial Statement Schedules andprofession and the Securities and Exchange Commission. Reports on Form 8-KÏÏÏÏÏÏÏÏÏÏÏÏÏÏÏÏÏÏÏÏÏÏÏÏÏ 92-93
Only those sections of the Annual Report referenced in the*U.S. Bancorp's deÑnitive proxy statement for the 2002 Annual Meeting of Shareholders
following cross-reference index and the information under is incorporated herein by reference, other than the sections entitled ""Report of the
Compensation and Human Resources Committee on Executive Compensation'' andthe caption ""Forward-Looking Statements'' are incorporated""Comparative Stock Performance.''
in the Form 10-K.
U.S. Bancorp90

General U.S. Bancorp is a multi-state Ñnancial services customers. Its wholly-owned subsidiary U.S. Bancorp Piper
holding company headquartered in Minneapolis, Minnesota JaÅray Inc. engages in equity and Ñxed income trading
and was created by the acquisition by Firstar Corporation activities and oÅers investment banking and underwriting
of the former U.S. Bancorp of Minneapolis, Minnesota. services to corporate and public sector customers. This non-
The merger was completed on February 27, 2001, and the bank subsidiary also provides brokerage products, including
combined company retained the U.S. Bancorp name. securities, mutual funds and annuities, and insurance
U.S. Bancorp was incorporated in Delaware in 1929 and products to consumers and regionally based businesses
operates as a Ñnancial holding company and a bank holding through a network of 123 brokerage oÇces.
company under the Bank Holding Company Act of 1956. On a full-time equivalent basis, employment during
U.S. Bancorp provides a full range of Ñnancial services, 2001 averaged a total of 50,461 employees.
including lending and depository services, cash management,Competition The commercial banking business is highly
foreign exchange and trust and investment managementcompetitive. Subsidiary banks compete with other
services. It also engages in credit card services, merchantcommercial banks and with other Ñnancial institutions,
and automated teller machine (""ATM'') processing,including savings and loan associations, mutual savings
mortgage banking, insurance, brokerage, leasing andbanks, Ñnance companies, mortgage banking companies,
investment banking.credit unions and investment companies. In recent years,
U.S. Bancorp's banking subsidiaries are engaged in thecompetition has increased from institutions not subject to
general banking business, principally in domestic markets.the same regulatory restrictions as domestic banks and bank
The subsidiaries range in size from $312 million toholding companies.
$108 billion in deposits and provide a wide range of
products and services to individuals, businesses, institutional Government Policies The operations of the Company's
organizations, governmental entities and other Ñnancial various operating units are aÅected by state and federal
institutions. Commercial and consumer lending services are legislative changes and by policies of various regulatory
principally oÅered to customers within the Company's authorities, including those of the numerous states in which
domestic markets, to domestic customers with foreign they operate, the United States and foreign governments.
operations and within certain niche national venues. These policies include, for example, statutory maximum
Lending services include traditional credit products as well legal lending rates, domestic monetary policies of the Board
as credit card services, Ñnancing and import/export trade, of Governors of the Federal Reserve System, United States
asset-backed lending, agricultural Ñnance and other Ñscal policy, international currency regulations and
products. Leasing products are oÅered through non-bank monetary policies, and capital adequacy and liquidity
subsidiaries. Depository services include checking accounts, constraints imposed by bank regulatory agencies.
savings accounts and time certiÑcate contracts. AncillarySupervision and Regulation U.S. Bancorp is a registered
services such as foreign exchange, treasury management andbank holding company and Ñnancial holding company
receivable lock-box collection are provided to corporateunder the Bank Holding Company Act of 1956 (the ""Act'')
customers. U.S. Bancorp's bank and trust subsidiariesand is subject to the supervision of, and regulation by, the
provide a full range of Ñduciary services for individuals,Board of Governors of the Federal Reserve System (the
estates, foundations, business corporations and charitable""Board'').
organizations.Under the Act, a Ñnancial holding company may engage
Banking and investment services are provided through ain banking, managing or controlling banks, furnishing or
network of 2,147 banking oÇces principally operating inperforming services for banks it controls, and conducting
24 states in the Midwest and West. The Company operatesother Ñnancial activities. U.S. Bancorp must obtain the prior
a network of 4,904 branded ATMs and provides 24-hour,approval of the Board before acquiring more than 5 percent
seven days-a-week telephone customer service. Mortgageof the outstanding shares of another bank or bank holding
banking services are provided through banking oÇces andcompany, and must provide notice to, and in some
loan production oÇces throughout the Company's markets.situations obtain the prior approval of, the Board in
The Company is one of the largest providers of Visa@connection with engaging in, or acquiring more than
corporate and purchasing card services and corporate trust5 percent of the outstanding shares of a company engaged
services in the United States. Its wholly owned subsidiaryin, a new Ñnancial activity.
Nova Information Systems, Inc. provides merchantUnder the Act, as amended by the Riegle-Neal
processing services directly to merchants and through aInterstate Banking and Branching EÇciency Act of 1994
network of banking aÇliations.(the ""Interstate Act''), U.S. Bancorp may acquire banks
U.S. Bancorp's other non-banking subsidiaries oÅer athroughout the United States, subject only to state or
variety of products and services to the Company's
U.S. Bancorp 91

federal deposit caps and state minimum age requirements. The following Exhibit Index lists the Exhibits to the
The Interstate Act authorizes interstate branching by Annual Report on Form 10-K.
acquisition and consolidations in those states that have not (1)3.1 Restated CertiÑcate of Incorporation, asopted out of interstate branching.
amended. Filed as Exhibit 3.1 to Form 10-KNational banks are subject to the supervision of, and
for the year ended December 31, 2000.are examined by, the Comptroller of the Currency. All
3.2 Restated bylaws, as amended.subsidiary banks of the Company are members of the
Federal Deposit Insurance Corporation (""FDIC'') and are 4.1 ®Pursuant to Item 601(b)(4)(iii)(A) of
subject to examination by the FDIC. In practice, the Regulation S-K, copies of instruments deÑning
primary federal regulator makes regular examinations of the rights of holders of long-term debt are not
each subsidiary bank subject to its regulatory review or Ñled. U.S. Bancorp agrees to furnish a copy
participates in joint examinations with other federal thereof to the Securities and Exchange
regulators. Areas subject to regulation by federal authorities Commission upon request.©
include the allowance for credit losses, investments, loans, (1)4.2 Warrant Agreement, dated as of October 2,mergers, issuance of securities, payment of dividends, 1995, between U.S. Bancorp and First Chicagoestablishment of branches and other aspects of operations. Trust Company of New York, as Warrant
Agent and Form of Warrant. Filed asProperties U.S. Bancorp and its signiÑcant subsidiariesExhibits 4.18 and 4.19 to Registrationoccupy their headquarter oÇces under long-term leases andStatement on Form S-3, File No. 33-61667.are located in Minneapolis, Minnesota and Cincinnati,
(2)10.1 U.S. Bancorp 2001 Stock Incentive Plan.Ohio. The Company also leases seven principal freestanding
operations centers in St. Paul, Portland, Nashville and (2)10.2 U.S. Bancorp Executive Incentive Plan.Denver, and owns Ñve principal freestanding operations (1)(2)10.3 U.S. Bancorp Executive Deferral Plan, ascenters in Cincinnati, Kansas City, St. Louis, Fargo and
amended. Filed as Exhibit 10.7 to Form 10-KMilwaukee. At December 31, 2001, U.S. Bancorp's
for the year ended December 31, 1999.subsidiaries owned and operated a total of 1,383 facilities
(2)10.4 Summary of NonqualiÑed Supplementaland leased an additional 1,388 facilities, all of which are
Executive Retirement Plan, as amended, of thewell maintained. The Company believes its current facilities
former U.S. Bancorp.are adequate to meet its needs. Additional information with
(1)(2)10.5 1991 Performance and Equity Incentive Plan ofrespect to premises and equipment is presented in Notes 9the former U.S. Bancorp. Filed as Exhibit 10.13and 22 of the Notes to Consolidated Financial Statements.to Form 10-K for the year ended December 31,
EXHIBITS 1997.Financial Statements Filed Page
(1)(2)10.6 Description of Retirement BeneÑts of JoshuaU.S. Bancorp and Subsidiaries
Green III. Filed as Exhibit 10.14 to Form 10-KConsolidated Financial Statements ÏÏÏÏÏÏÏÏÏÏÏÏÏÏÏÏÏÏ 49
for the year ended December 31, 1997.Notes to Consolidated Financial Statements ÏÏÏÏÏÏÏÏÏÏÏÏ 53
Report of Independent Accountants ÏÏÏÏÏÏÏÏÏÏÏÏÏÏÏÏÏÏÏÏ 48 (1)(2)10.7 Form of Director IndemniÑcation Agreement
Schedules to the consolidated Ñnancial statements entered into with former directors of the
required by Regulation S-X are omitted since the required former U.S. Bancorp. Filed as Exhibit 10.15 to
information is included in the footnotes or is not Form 10-K for the year ended December 31,
applicable. 1997.
During the three months ended December 31, 2001, (1)(2)10.8 U.S. Bancorp Independent Director Retirementthe Company Ñled the following Current Reports on and Death BeneÑt Plan, as amended. Filed asForm 8-K: Exhibit 10.17 to Form 10-K for the year ended
Form 8-K Ñled October 17, 2001, relating to third December 31, 1999.quarter 2001 and anticipated full year 2001 earnings; (1)(2)10.9 U.S. Bancorp Deferred Compensation Plan for
Form 8-K Ñled October 31, 2001, announcingDirectors, as amended. Filed as Exhibit 10.18
commencement of an underwritten oÅering of trustto Form 10-K for the year ended December 31,
preferred securities;1999.
Form 8-K Ñled December 6, 2001, announcing
commencement of an underwritten oÅering of trust
preferred securities.
U.S. Bancorp92

Victoria Buyniski Gluckman(2)10.10 Summary of U.S. Bancorp SupplementalDirectorExecutive Retirement Plan.
Arthur D. Collins, Jr.(2)10.11 U.S. Bancorp Deferred Compensation Plan.Director(2)10.12 Form of Change in Control Agreement,Peter H. Coors
eÅective November 16, 2001, betweenDirector
U.S. Bancorp and certain executive oÇcers ofJohn C. Dannemiller
U.S. Bancorp.Director
(2)10.13 Employment Agreement with Jerry A.Joshua Green III
Grundhofer.Director
(2)10.14 Employment Agreement with John F. J.P. Hayden, Jr.Grundhofer. Director
12 Statement re: Computation of Ratio of Earnings Roger L. Howe
to Fixed Charges. Director
21 Subsidiaries of the Registrant. Thomas H. Jacobsen
Director23 Consent of PricewaterhouseCoopers LLP.(1) Exhibit has previously been Ñled with the Securities and Exchange Commission and Delbert W. Johnson
is incorporated herein as an exhibit by reference. Director(2) Management contracts or compensatory plans or arrangements required to be Ñled
as an exhibit pursuant to Item 14(c) of Form 10-K. Joel W. Johnson
DirectorSIGNATURES
Jerry W. Levin
Pursuant to the requirements of Section 13 or 15(d) of the DirectorSecurities Exchange Act of 1934, the registrant has duly Sheldon B. Lubar
caused this report to be signed on February 28, 2002, on its Directorbehalf by the undersigned thereunto duly authorized. Frank Lyon, Jr.
DirectorU.S. BancorpDaniel F. McKeithan, Jr.By: Jerry A. GrundhoferDirectorPresident and Chief Executive OÇcer
David B. O'Maley
DirectorPursuant to the requirements of the Securities Exchange Act
of 1934, this report has been signed below on February 28, O'dell M. Owens, M.D., M.P.H.
2002, by the following persons on behalf of the registrant Director
and in the capacities indicated. Thomas E. Petry
Jerry A. Grundhofer Director
President, Chief Executive OÇcer and Director Richard G. Reiten
(principal executive oÇcer) Director
David M. MoÅett S. Walter Richey
Vice Chairman and Chief Financial OÇcer Director(principal Ñnancial oÇcer) Warren R. Staley
Terrance R. Dolan DirectorExecutive Vice President and Controller Patrick T. Stokes
(principal accounting oÇcer) DirectorJohn F. Grundhofer John J. Stollenwerk
Chairman DirectorLinda L. Ahlers
Director
U.S. Bancorp 93

EXECUTIVE OFFICERS
Jerry A. Grundhofer Andrew Cecere Richard K. Davis
Mr. Grundhofer, 57, has served as Mr. Cecere, 41, has served as Vice Mr. Davis, 44, has served as Vice
President and Chief Executive OÇcer of Chairman of U.S. Bancorp since the Chairman of U.S. Bancorp since the
U.S. Bancorp and Chairman, President merger of Firstar Corporation and U.S. merger of Firstar Corporation and U.S.
and Chief Executive OÇcer of U.S. Bank Bancorp in February 2001. He assumed Bancorp in February 2001, when he
National Association since the merger of responsibility for Private Client and Trust assumed responsibility for Consumer
Firstar Corporation and U.S. Bancorp in Services in February 2001 and U.S. Banking and Payment Services. Previously,
February 2001. Prior to the merger, Bancorp Asset Management in he had been Vice Chairman of Consumer
Mr. Grundhofer was President and Chief November 2001. Previously, he had Banking of Firstar Corporation from 1998
Executive OÇcer of Firstar Corporation, served as Chief Financial OÇcer of U.S. until 2001 and Executive Vice President,
having served as Chairman, President and Bancorp from May 2000 through Consumer Banking of Star Banc
Chief Executive OÇcer of Star Banc February 2001. Additionally, he served as Corporation from 1993 until its merger
Corporation from 1993 until its merger Vice Chairman of U.S. Bank with with Firstar Corporation in 1998.
with Firstar Corporation in 1998. responsibility for Commercial Services Andrew S. DuÅfrom 1999 to 2001, having been a SeniorJennie P. Carlson Mr. DuÅ, 44, has served as ViceVice President of Finance since 1992.Ms. Carlson, 41, has served as Executive Chairman of U.S. Bancorp, responsible for
Vice President, Human Resources since William L. Chenevich Private Advisory Services, Equity Capital
January 2002. Until that time, she served Mr. Chenevich, 58, has served as Vice Markets and Fixed Income Capital
as Executive Vice President, Deputy Chairman of U.S. Bancorp since the Markets, since November 2001, and until
General Counsel and Corporate Secretary merger of Firstar Corporation and U.S. that time as Vice Chairman responsible
of U.S. Bancorp since the merger of Bancorp in February 2001, when he for Wealth Management and Capital
Firstar Corporation and U.S. Bancorp in assumed responsibility for Technology Markets since 1999. He has served as
February 2001. From 1995 until the and Operations Services. Previously, he President and Chief Executive OÇcer of
merger, she was General Counsel and had served as Vice Chairman of U.S. Bancorp Piper JaÅray since
Secretary of Firstar Corporation and Star Technology and Operations Services of January 2000. Prior to that time, he had
Banc Corporation, a predecessor Firstar Corporation from 1999 to 2001. served as President of Piper JaÅray Inc.,
company, as well as Senior Vice President Prior to joining Firstar he was Group the broker-dealer subsidiary of Piper
from 1994 to 1999 and Executive Vice Executive Vice President at Visa JaÅray Companies, since January 1996.
President from 1999 to 2001. International from 1994 to 1999.
U.S. Bancorp94

Edward Grzedzinski Lee R. Mitau Stephen E. Smith
Mr. Grzedzinski, 46, has served as Vice Mr. Mitau, 53, has served as Executive Mr. Smith, 54, has served as Executive
Chairman of U.S. Bancorp since July Vice President and General Counsel of Vice President and Director of Human
2001. He is President and Chief Executive U.S. Bancorp since 1995. Mr. Mitau also Resources of U.S. Bancorp since the
OÇcer of NOVA Information Systems, serves as Corporate Secretary. Prior to merger of Firstar Corporation and U.S.
which he co-founded in 1991 and which 1995 he was a partner at the law Ñrm of Bancorp in February 2001. Prior to the
became a wholly owned subsidiary of Dorsey & Whitney LLP. merger, he was Executive Vice President
U.S. Bancorp in connection with the and Corporate Director of HumanDavid M. MoÅettacquisition of NOVA Corporation in July Resources of Firstar Corporation and StarMr. MoÅett, 50, has served as Vice2001. Mr. Grzedzinski served as Chairman Banc Corporation, a predecessorChairman and Chief Financial OÇcer ofof NOVA Corporation from 1995 until company, since 1995, having served asU.S. Bancorp since the merger of FirstarJuly 2001. Director of Human Resources of StarCorporation and U.S. Bancorp in February
Banc Corporation since 1993.Joseph E. Hasten 2001. Prior to the merger, he was Vice
Mr. Hasten, 50, has served as Vice Chairman and Chief Financial OÇcer of
Chairman of U.S. Bancorp since the Firstar Corporation, and had served as
merger of Firstar Corporation and U.S. Chief Financial OÇcer of Star Banc
Bancorp in February 2001, when he Corporation from 1993 until its merger
assumed responsibility for Corporate with Firstar Corporation in 1998.
Banking. Previously, he had been Vice Daniel M. QuinnChairman of Wholesale Banking of Firstar Mr. Quinn, 45, Vice Chairman of U.S.Corporation, after joining Mercantile Bancorp, assumed responsibility forBancorporation, a predecessor company, Commercial Banking in April 1999 andas President of its St. Louis bank and of for Regional Commercial Real Estate inCorporate Banking in 1995. August 1999. Previously, he had been
J. Robert HoÅmann President of U.S. Bank in Colorado
Mr. HoÅman, 56, has served as Executive (formerly Colorado National Bank) since
Vice President and Chief Credit OÇcer of 1996.
U.S. Bancorp since 1990.
U.S. Bancorp 95

DIRECTORS
John F. Grundhofer1 Thomas H. Jacobsen4 O'dell M. Owens, M.D., M.P.H.3,4
Chairman Former Chairman Medical Director
U.S. Bancorp Firstar Corporation United Healthcare
Milwaukee, Wisconsin Cincinnati, OhioJerry A. Grundhofer1
President and Chief Executive OÇcer Delbert W. Johnson1,3,4 Thomas E. Petry1,2,3
U.S. Bancorp Vice President Retired Chairman and
Safeguard ScientiÑcs, Inc. Chief Executive OÇcerLinda L. Ahlers3,4
Wayne, Pennsylvania Eagle-Picher Industries, Inc.PresidentCincinnati, OhioMarshall Field's Joel W. Johnson4,5
Minneapolis, Minnesota Chairman, President and Richard G. Reiten1,2,3
Chief Executive OÇcer Chairman and Chief Executive OÇcerVictoria Buyniski Gluckman3,4
Hormel Foods Corporation Northwest Natural Gas CompanyPresident and Chief Executive OÇcerAustin, Minnesota Portland, OregonUnited Medical Resources, Inc.
Cincinnati, Ohio Jerry W. Levin2,5 S. Walter Richey1,2
Chairman and Chief Executive OÇcer Former Chairman andArthur D. Collins, Jr.1,2,5
Sunbeam Corporation Chief Executive OÇcerPresident and Chief Executive OÇcerBoca Raton, Florida Meritex, Inc.Medtronic, Inc.
Roseville, MinnesotaMinneapolis, Minnesota Sheldon B. Lubar1,5
Chairman Warren R. Staley1,3
Peter H. Coors2,4,5
Lubar & Company Chairman and Chief Executive OÇcerChairmanMilwaukee, Wisconsin Cargill, Inc.Coors Brewing Company
Minneapolis, MinnesotaGolden, Colorado Frank Lyon, Jr.2,4
President Patrick T. Stokes1,5
John C. Dannemiller4,5
Wingmead Farms President and Chief Executive OÇcerRetired ChairmanNorth Little Rock, Arkansas Anheuser-Busch, Inc.Applied Industrial Technologies
St. Louis, MissouriCleveland, Ohio Daniel F. McKeithan, Jr.1,3,5
President and Chief Executive OÇcer John J. Stollenwerk2,3,4
Joshua Green III3,4
Tamarack Petroleum Company, Inc. President and Chief Executive OÇcerChairman and Chief Executive OÇcerMilwaukee, Wisconsin Allen-Edmonds Shoe CorporationJoshua Green Corporation
Port Washington, WisconsinSeattle, Washington David B. O'Maley1,2
Chairman, President andJ.P. Hayden, Jr.1,2,5
Chief Executive OÇcerChairman of the Executive CommitteeOhio National Financial ServicesThe Midland CompanyCincinnati, OhioAmelia, Ohio
Roger L. Howe1,2,3
Chairman Emeritus
U.S. Precision Lens, Inc.
Cincinnati, Ohio
1. Executive Committee
2. Compensation Committee
3. Audit Committee
4. Community Outreach and Fair Lending Committee
5. Governance Committee
U.S. Bancorp96

Corporate Information
Executive Offices
U.S. Bancorp225 South Sixth StreetMinneapolis, Minnesota 55402
After June 2002800 Nicollet MallMinneapolis, Minnesota 55402
Common Stock Transfer Agent and Registrar
U.S. Bank National Association, a subsidiary of U.S. Bancorp,acts as our transfer agent and registrar, dividend paying agentand dividend reinvestment plan agent, and maintains all shareholder records for the corporation. Inquiries related toshareholder records, stock transfers, changes of ownership,changes of address and dividend payment should be sent to the transfer agent at the following address:
U.S. Bank National Association1555 North River Center Drive, Suite 301Milwaukee, Wisconsin 53212Phone: 800-637-7549Fax: 414-905-5049Internet: www.investorservice.usbank.com
Independent Accountants
PricewaterhouseCoopers LLP serves as the independentaccountants of U.S. Bancorp.
Common Stock Listing and Trading
U.S. Bancorp common stock is listed and traded on the New York Stock Exchange under the ticker symbol USB.
Dividends and Dividend Reinvestment Plan
U.S. Bancorp currently pays quarterly dividends on our com-mon stock on or about the 15th day of January, April, July andOctober, subject to prior approval by our Board of Directors.U.S. Bancorp shareholders can choose to participate in a planthat provides automatic reinvestment of dividends and/oroptional cash purchase of additional shares of U.S. Bancorpcommon stock. For more information, please contact:
U.S. Bank National AssociationDividend Reinvestment Department1555 North River Center Drive, Suite 301Milwaukee, Wisconsin 53212Phone: 800-637-7549
Investment Community Contacts
Howell D. McCulloughSenior Vice President, Investor [email protected]: 612-973-2261
Judith T. MurphyVice President, Investor [email protected]: 612-973-2264
Financial Information
U.S. Bancorp news and financial results are available throughour Web site and by mail.
Web site. For information about U.S. Bancorp, including newsand financial results and online annual reports, access our homepage on the Internet at www.usbank.com.
Mail. At your request, we will mail to you our quarterly earningsnews releases, quarterly financial data reported on Form 10-Qand additional copies of our annual reports. To be added to theU.S. Bancorp mailing list for quarterly earnings news releases orto request other information, please contact:
U.S. Bancorp Investor Relations225 South Sixth StreetMinneapolis, Minnesota 55402Phone: [email protected]
Media Requests
Steve DaleSenior Vice President, Media RelationsPhone: 612-973-0898
Other Business Information
For product and service information, branch office and ATM locations, information about lines of business, account access, employment opportunities and more, visitwww.usbank.com or www.firstar.com.
Diversity
U.S. Bancorp and our subsidiaries are committed to developingand maintaining a workplace that reflects the diversity of thecommunities we serve. We support a work environment whereindividual differences are valued and respected and where eachindividual who shares the fundamental values of the company hasan opportunity to contribute and grow based on individual merit.
Equal Employment Opportunity/Affirmative Action
U.S. Bancorp and our subsidiaries are committed to providingEqual Employment Opportunity to all employees and applicantsfor employment. In keeping with this commitment, employmentdecisions are made based upon performance, skill and abilities,rather than race, color, religion, national origin or ancestry, sex, age, disability, veteran status, sexual orientation or anyother factors protected by law. The corporation complies withmunicipal, state and federal fair employment laws, includingregulations applying to federal contractors.
U.S. Bancorp, including each of our subsidiaries, is an Equal Opportunity Employer and a Drug-Free Workplace.
U.S. Bank and Firstar BankMembers FDIC
This report is printed on recycled paper containing a minimum 10 percent post-consumer recycled waste.

U.S. Bancorp225 South Sixth StreetMinneapolis, Minnesota 55402
www.usbank.comwww.firstar.com
Corporate ProfileU.S. Bancorp is a multi-state financial holding company
with headquarters in Minneapolis, Minnesota. The merger of
Firstar Corporation and the former U.S. Bancorp closed
on February 27, 2001, making the new U.S. Bancorp the
8th largest financial holding company in the United States,
with total assets exceeding $171 billion. We place No. 41
in The Super 100, a Forbes magazine composite ranking
based on sales, profits, assets and market value.
Through U.S. Bank, Firstar Bank and other subsidiaries,
U.S. Bancorp serves more than 10 million customers
principally through 2,147 full-service branch offices in
24 states, additional specialized offices across the country
and in several foreign countries, 4,904 ATMs, and Internet
and telephone banking.
U.S. Bancorp and our subsidiaries provide a compre-
hensive selection of premium financial products and services
to individuals, businesses, nonprofit organizations, institu-
tions and government entities.
U.S. Bancorp, our subsidiary full-service banks and
other subsidiaries operate the following major lines of
business: Consumer Banking, Wholesale Banking, Payment
Services, and Private Client, Trust and Asset Management.
U.S. Bancorp Piper Jaffray offers full securities brokerage,
equity capital, fixed income capital and individual investment
services.
U.S. Bancorp is home of the exclusive Five Star
Service Guarantee, which assures customers of certain
key banking standards.