uscellular - s1.q4cdn.coms1.q4cdn.com/183458318/files/doc_financials/annual/usm.2015.annual... ·...
TRANSCRIPT

2015 Annual Report uscellular.com

Honoring Our Founder
“ A deep-rooted conviction of mine has always been that the customer is king.”
– LeRoy Carlson, 1989, TDS: The First Twenty Years
“ Roy has always had the ability to anticipate the rapidly changing telecommunications industry – a skill that was invaluable as we founded U.S. Cellular. His willingness to embrace change, combined with his commitment to providing the customer with outstanding service, will forever motivate and inspire U.S. Cellular.”
– Kenneth Meyers, CEO – U. S. Cellular
U.S. Cellular® celebrates the 100th birthday of our founder, LeRoy (Roy) T. Carlson. His vision, leadership, values, and business principles set the foundation for the company that U.S. Cellular is today. Roy’s belief in delivering exceptional customer service and the latest technology, and his unwavering commitment to the nation’s rural and suburban communities are still the focus of our business; they provide the basis on which U.S. Cellular will continue to grow our business and serve the needs of our customers, associates and shareholders.
“ The concept I had in mind was simple: bring together a group of small, primarily rural, telephone companies whose skills, strengths and assets could be shared by all.”
– LeRoy Carlson, 1989, TDS: The First Twenty Years
“ The key to harnessing the business power and potential of communications technology is to respect and understand the people who use, develop and support it.”
– LeRoy Carlson, 2002 KPMG Illinois High Tech Awards ceremony
“ The people who live in these rural and suburban areas should have the same and equal access to the full range of technological advances available today as those enjoyed by people who live in urban areas.”
– LeRoy Carlson, 1979, TDS Annual Report

Building on 2015 successesAt TDS we strive to differentiate ourselves from the national telecommunication giants by providing the best services and products together with exceptional customer service. We focus our efforts on America’s suburban and rural markets, including some of the most remote areas of the country. We have strengthened and expanded our high-quality networks and improved our data and communications service offerings. Combined with our customer-focused culture, our networks and service offerings are the foundation upon which we are growing and building value for our shareholders.
TDS businesses achieved signifi cant milestones in 2015:
• U.S. Cellular completed 4G LTE deployment.
• U.S. Cellular began Voice over LTE (VoLTE) trials. VoLTE will bring customer benefi ts, including enabling both voice and data to be delivered simultaneously to devices.
• TDS Telecom continued to deploy fi ber technology in key markets, reaching 21% of its ILEC service addresses.
• OneNeck IT Solutions opened one and expanded another data center.
In a very competitive industry dominated by large players, we take a personal approach to our customers and to the communities in which we operate. Our prominent local presence in these markets is a competitive advantage. From sponsoring high school sports teams to staffi ng call centers in our markets, we have built local presence that allows us to know and better serve our customers and their changing needs.
A further strength, that is an advantage, is that we have expanded our business into a diversifi ed portfolio of data and communications companies. We are growing and prospering by sharing expertise and capabilities from wireless, wireline, cable, and hosted and managed services to develop services for the customers in our markets.
Dear SHareHoLDerS
At TDS we strive to differentiate ourselves from the national telecommunications giants by providing the best services and products together with exceptional customer service.
TDS’ mission is to provide outstanding communication services to our customers and meet the needs of our shareholders, our people, and our communities. In pursuing this mission, we seek to continuously grow our businesses, create opportunities for our associates and employees, and steadily build value over the long term for our shareholders.
telephone and data systems 1

We plan to grow by focusing on what our customers desire: competitive pricing and promotions that showcase our high-quality 4G LTE network. Supporting this effort, we are redesigning our stores into retail destinations that can enhance the customer experience and further boost sales. We successfully repositioned our company to grow our customer base again, even in the face of a very competitive wireless market. We saw a steady and meaningful improvement in our churn levels as we delivered high levels of customer satisfaction. We also continued to see former customers return to U.S. Cellular, representing approximately 20% of new accounts.
We continue to manage our expense levels, which contributed to stronger margins and growth in operating cash fl ow in 2015. Growing our customer base and revenue also is crucial to improving our margins and profi tability. We see opportunity for revenue growth with further smartphone penetration allowing us to monetize data usage. In addition, sales of our Shared Connect data plans create more devices per account. These plans, and the increasing use of connected devices like tablets by our customers, drive them to choose larger data buckets resulting in revenue growth.
The rapidly growing small and medium business (SMB) market and regional government agencies are a natural fi t for U.S. Cellular given our local focus. We have reorganized our sales channel and expanded our business pricing portfolio to include shared data and machine-to-machine offerings. As the needs of our SMB customers grow, we continue to expand our Business Solutions Product Catalog with products like international roaming, fl eet management applications, wireless priority service, and more.
U.S. Cellular exists to provide exceptional wireless communication services which enhance consumers’ lives, increase the competitiveness of local businesses, and improve the effi ciency of government operations in the mid-sized and rural markets we serve.
As a mid-sized operator, we seek to use our relatively smaller size to our competitive advantage. This starts with a network that provides high-quality services in the “Middle of Anywhere” and is complemented by our associates, who take a more personal approach to knowing and serving our customers. This local focus is a unique differentiator that allows our associates to deliver outstanding customer service by treating customers like neighbors, not numbers.
We achieved two important goals in 2015: we reignited customer growth and improved profi tability, laying the foundation for continued success.
Operating on a network quality foundation In 2015, we continued our investment in our network to provide more capacity to meet growing demands for data services and to provide better in-home coverage. With 4G LTE, we can provide our customers, even in the more remote rural areas, with all the benefi ts of our data services, also creating new growth opportunities for us. We secured 4G LTE roaming agreements with national carriers to further enhance our customers’ data experience.
Building on the strength of our newly completed 4G LTE network, we are further refi ning our network strategy and are planning to begin the multi-year rollout of VoLTE. We are designing VoLTE to bring even more quality products and services to our customers over the next few years, and increase our fl exibility to pursue attractive new revenue opportunities.
Reigniting customer growth Customer growth has been and will continue to be our number one priority. We are proud of our 2015 accomplishments and excited about our prospects, even while acknowledging that adding new customers is increasingly diffi cult in the wireless industry.
Completing the 4G LTE deployment was the culmination of a four-year effort, and one of our major priorities for the year.
2 telephone and data systems
TDS Telecom seeks to own and offer our customers “the best data pipe” into their homes and businesses through a portfolio of broadband offerings.
TDS Telecom seeks to own and offer our customers “the best data pipe” into their homes and businesses through a portfolio of broadband offerings. The TDS Telecom businesses—wireline, cable, and hosted and managed services—pursue communications and data market opportunities to provide compelling services, solutions, and products to both residential and commercial consumers.
WirelineIn our wireline business, our targeted investments in fi ber technology have strengthened our triple play bundle offerings and resulted in higher average revenue per connection and low churn rates. Take rates for our IPTV service, TDS TV, have exceeded expectations in 2015, with 98% of all TDS TV customers subscribing to triple play bundles. We have now launched TDS TV in 27 markets, enabling 167,000 service addresses, which is roughly 23% of our total footprint. By mid-year 2016, we intend to deepen our fi ber build to reach approximately 25% of our residential ILEC footprint.
In order to accelerate sales, we have continued our Fiberville marketing campaign, which markets high-speed broadband and TDS TV in new neighborhoods prior to build-outs. The campaign has been increasingly effective over the past year, as we have seen 10-20% market penetration in advance of turning up service.
CableWe are pleased with the progress of our cable business since we entered the industry in 2013. Cable is a natural extension of TDS Telecom’s original wireline business that enables us to leverage our existing expertise and infrastructure. Both wireline and cable share the common strategy to “own the best data pipe in the market.” As part of this broadband strategy, we plan to continue growing high-margin broadband services bundled with video and voice products.
We are seeing our cable customer base continue to grow, accelerated by the attractive demographics in these markets, with household growth greater than the national average. We continue to evaluate additional strategic cable acquisitions that can further augment our growth and profi tability.
TDS TeLeCoM
HMSOur hosted and managed services (HMS) business, OneNeck IT Solutions, is another key element of our strategy to expand our business as it builds upon our core capabilities. As a communications service provider, we have foundational expertise in building and managing data networks and IT infrastructure.
HMS plays an important role in TDS Telecom’s growth strategy. We are in the advanced stages of integrating the fi ve HMS businesses we acquired. In 2015, we completed both the construction of a new data center in Denver, Colorado and an expansion of another data center in Madison, Wisconsin. With this additional capacity up and running, combined with a highly motivated sales force trained on our extensive line of services and products, we are poised for more growth.
While we saw higher equipment sales in 2015, there’s still progress to be made in increasing recurring sales revenues. We believe the HMS industry has attractive long-term growth potential as mid-market companies look to outsource their IT needs.
telephone and data systems 3

Upgrading our Annual Report We have changed the format of our annual report this year, revising the Management’s Discussion and Analysis section by adding charts and other graphics to more plainly and clearly present our business and our performance. We hope you find this information and format helpful and, as always, welcome your feedback.
Honoring Our Visionary Founder and Looking Ahead As TDS begins its 48th year of business, we look forward to celebrating the legacy of our centenarian founder, LeRoy T. (Roy) Carlson. From our humble origins in rural Wisconsin to our nationwide presence today, we continue to operate and serve with Roy’s basic principle, that “the customer is king.” It is the foundation upon which we intend to continue building shareholder value with our growing portfolio of businesses.
Thank you Thank you to each of the associates and employees of the TDS companies for your dedication and innovation in providing outstanding services, products, and total customer experiences to each of our customers across the nation.
Thank you also to each of our shareholders and our debt holders for your continuing support of our long-term growth and development.
Sincerely,
LeRoy T. Carlson, Jr. Walter C. D. CarlsonPresident and Chief Chairman of the Board Executive Officer
Creating long-term value At the corporate level of TDS, we are continually looking to build value in the TDS portfolio of businesses. We intend to supplement organic growth through strategic acquisitions. Our long-term strategy calls for the majority of our capital to be reinvested in our operating businesses to strengthen their growth and competitive positions. We also return value to TDS shareholders through the payment of regular quarterly cash dividends and through share repurchases.
In 2015, TDS primarily focused on investing in the networks that we believe will strengthen our competitive position and improve operating performance. Looking forward, we will continue to execute on our strategies to build strong, competitive businesses providing high-quality, data-focused products and services.
Since August of 2013, TDS has invested $581.4 million, primarily through the acquisition of cable companies, and has returned $195.8 million to shareholders through payments of $147.0 million in cash dividends and $48.8 million in stock repurchases.
Regulatory TDS and its subsidiaries are active participants in the public policy arena, engaging policy makers on issues that directly impact our customers and our businesses. We advocated in Washington that the government auction of new spectrum later this year be structured to benefit all carriers and not just the very largest ones. We are thoroughly considering our participation in this 600 MHz auction. We also are advocating in support of programs to fund the ongoing needs for high-quality wireless and wired broadband communications in rural communities.
TDS CorporaTe
4 telephone and data systems

TELEPHONE AND DATA SYSTEMS, INC.
ANNUAL REPORT TO SHAREHOLDERS FOR THE YEAR ENDED DECEMBER 31, 2015Pursuant to SEC Rule 14a-3
The following audited financial statements and certain other financial information for the year endedDecember 31, 2015, represent Telephone and Data Systems’ annual report to shareholders as requiredby the rules and regulations of the Security and Exchange Commission (‘‘SEC’’).
The following information was filed with the SEC on February 24, 2016 as Exhibit 13 to Telephone andData Systems’ Annual Report on Form 10-K for the year ended December 31, 2015. Such informationhas not been updated or revised since the date it was originally filed with the SEC. Accordingly, you areencouraged to review such information together with any subsequent information that we have filed withthe SEC and other publicly available information.
Financial Reports Contents
Executive Overview 1
Terms used by TDS 3
Results of Operations – TDS Consolidated 5
U.S. Cellular Operations 9
TDS Telecom Operations 18
Wireline Operations 22
Cable Operations 27
HMS Operations 30
Liquidity and Capital Resources 32
Contractual and Other Obligations 39
Consolidated Cash Flows 39
Consolidated Balance Sheet Analysis 41
Applications of Critical Accounting Policies and Estimates 42
Other Items 47
Regulatory Matters 47
Private Securities Litigation Reform Act of 1995 Safe Harbor Cautionary Statement 49
Market Risk 51
Supplemental Information 53
Telephone and Data Systems, Inc. Exhibit 13
Page No.
Management’s Discussion and Analysis of Financial Condition and Results of Operations 1
Consolidated Statement of Operations 58
Consolidated Statement of Comprehensive Income (Loss) 59
Consolidated Statement of Cash Flows 60
Consolidated Balance Sheet – Assets 61
Consolidated Balance Sheet – Liabilities and Equity 62
Consolidated Statement of Changes in Equity 63
Notes to Consolidated Financial Statements 66
Reports of Management 108
Report of Independent Registered Public Accounting Firm 110
Selected Consolidated Financial Data 111
Consolidated Quarterly Information (Unaudited) 112
Shareholder Information 113

11MAR201618343100
11MAR201618465399 11MAR201618464613
EXECUTIVE OVERVIEWManagement’s Discussion and Analysis of Financial Condition and Results of Operations (‘‘MD&A’’) should be read inconjunction with the Financial Statements and Notes to Consolidated Financial Statements for the year endedDecember 31, 2015. This report contains statements that are not based on historical facts, including the words‘‘believes,’’ ‘‘anticipates,’’ ‘‘intends,’’ ‘‘expects’’ and similar words. These statements constitute and represent ‘‘forwardlooking statements’’ as this term is defined in the Private Securities Litigation Reform Act of 1995. Such forward lookingstatements involve known and unknown risks, uncertainties and other factors that may cause actual results, events ordevelopments to be significantly different from any future results, events or developments expressed or implied by suchforward looking statements.
TDS uses certain ‘‘non-GAAP financial measures’’ throughout the MD&A. A discussion of the reason TDS uses thesemeasures and a reconciliation to their most directly comparable GAAP financial measure is included in the SupplementalInformation section within this MD&A.
General
Telephone and Data Systems, Inc. (‘‘TDS’’) is a diversified telecommunications company that provides high-qualitytelecommunications services to approximately 6 million customers nationwide. TDS provides wireless services through its84%-owned subsidiary, United States Cellular Corporation (‘‘U.S. Cellular’’). TDS also provides wireline services, cableservices and hosted and managed services (‘‘HMS’’), through its wholly-owned subsidiary, TDS TelecommunicationsCorporation (‘‘TDS Telecom’’). TDS’ segments operate almost entirely in the United States. See Note 18 — BusinessSegment Information in the Notes to Consolidated Financial Statements for summary financial information on eachbusiness segment.
2015 Operating Revenues 2015 Adjusted EBITDA*
77%
14%
3%6%
Wireless
Wireline
Cable
HMS
Wireless
Wireline
Cable
HMS
74%
22%
3%1%
* Represents a non-GAAP financial measure. Refer to Supplemental Information within this MD&A for a reconciliation of this measure.
TDS Mission and Strategy
TDS’ mission is to provide outstanding communications services to its customers and meet the needs of itsshareholders, its people, and its communities. In pursuing this mission, TDS seeks to profitably grow its businesses,create opportunities for its associates and employees, and steadily build value over the long-term for its shareholders.Across all of its businesses, TDS is focused on providing exceptional customer experiences through best-in-classservices and products and superior customer service.
TDS’ long-term strategy calls for the majority of its capital to be reinvested in its operating businesses to strengthen theircompetitive positions, while still returning value to TDS shareholders through the payment of a regular quarterly cashdividend and share repurchases.
1
MANAGEMENT’S DISCUSSION AND ANALYSIS OF FINANCIAL CONDITION AND RESULTS OF OPERATIONS

11MAR201618464745
11MAR201618465639
Throughout 2015, as discussed below, TDS primarily focused on investing in the networks that are the backbone of itscommitment to provide outstanding communications services to its customers. TDS believes these investments willstrengthen its competitive position and improve operating performance. Looking ahead to 2016, TDS will look to buildshareholder value by continuing to execute on its strategies to build strong, competitive businesses providinghigh-quality, data-focused products and services.
Invest in the business to improve returns and pursue initiatives that align with long-term strategies
Consistent with its strategy, TDS made significant investments in 2015 to improve the performance of its networks. U.S.Cellular completed the rollout of the 4G LTE network giving customers faster data speeds on an even higher-qualitywireless network. U.S. Cellular also participated in Auction 97 indirectly through its limited partnership interest inAdvantage Spectrum L.P. (‘‘Advantage Spectrum’’). Advantage Spectrum was the provisional winning bidder of 124licenses for an aggregate bid of $338.3 million.
At TDS Telecom, the wireline segment continued its targeted fiber deployment and now offers IPTV service in 27markets. During 2015, TDS Telecom also worked to integrate cable acquisitions and continued efforts to improvenetwork quality and product offerings of previously acquired cable businesses. The HMS segment opened a new datacenter in Denver, CO to expand its presence in the IT outsourcing market.
Return value to shareholders
Since August of 2013, TDS has invested $581.4 million, primarily through acquisition of cable companies and returned$195.8 million to shareholders through payment of $147.0 million in regular quarterly cash dividends and $48.8 million ofstock repurchases. During 2015, TDS paid $61.2 million in regular quarterly cash dividends. TDS increased the dividendpaid to its investors by 5% in 2015 which marks the 41st consecutive year of dividend increases and in February 2016,TDS increased its dividend per share from $0.141 to $0.148. There were no TDS and limited U.S. Cellular sharerepurchases in 2015. There is no assurance that TDS will continue to increase the dividend rate or pay dividends and noassurance that TDS or U.S. Cellular will make any significant amount of share repurchases in the future.
Shares RepurchasedAnnual Dividends Per TDS Share (Shares in millions)
$0.00
1996
1995
1997
1998
1999
2000
2001
2002
2003
2004
2005
2006
2007
2008
2009
2010
2011
2012
2013
2014
2015
$0.10
$0.20
$0.30
$0.40
$0.50
$0.60
0
1
2
3
4
5
6
7
8
2007 2008 2009 2010 2011 2012 2013 2014 2015
TDS U.S. Cellular
Support growth initiatives through sound and disciplined financing strategies.
During 2015, U.S. Cellular sold $300 million in 7.25% senior notes and secured a $225 million term loan to fund itsoperations, current and future spectrum purchases, growth in equipment installment plan receivables and capitalexpenditures.
2
MANAGEMENT’S DISCUSSION AND ANALYSIS OF FINANCIAL CONDITION AND RESULTS OF OPERATIONS

Significant Financial and Operating Matters
The following is a summary of certain selected information contained in the comprehensive MD&A that follows. Theoverview does not contain all of the information that may be important. You should carefully read the entire MD&A andnot rely solely on the highlights.
� Net income attributable to TDS shareholders was $219.0 million in 2015, compared to a net loss of $136.4 million in2014. The year-over-year improvement was attributable to several factors including (i) increased equipment revenuesbolstered by equipment installment plan activity; (ii) reduced cost of equipment sold due to fewer wireless equipmentsales transactions overall and lower cost per wireless unit sold; (iii) reduced selling, general and administrativeexpenses; (iv) increased gains from sales and exchanges of businesses and licenses; and (v) non-cash losses onimpairment in 2014. Diluted earnings per share was $1.98 compared to a diluted loss per share of $1.26 one yearago.
� In March 2015, U.S. Cellular announced that it would discontinue its loyalty reward program effective September 1,2015. All unredeemed reward points expired at that time and the deferred revenue balance related to such expiredpoints was recognized as service revenues. The amount of deferred revenue recognized upon discontinuation of thisprogram was $58.2 million.
� U.S. Cellular completed license exchanges and the sale of towers outside of its operating markets. See Note 6 —Acquisitions, Divestitures and Exchanges in the Notes to Consolidated Financial Statements for additional informationrelated to these transactions.
� Total additions to Property, plant and equipment were $759.4 million, including expenditures to complete the networkrollout of 4G LTE, construct cell sites, increase capacity in existing cell sites and switches, outfit new and remodelexisting retail stores, enhance billing and other customer management related systems and platforms, perform networkupgrades and fiber expansion, and expand HMS data center facilities.
Terms Used by TDS
All defined terms in this MD&A are used as defined in the Notes to Consolidated Financial Statements, and additionalterms are defined below:
� 4G LTE – fourth generation Long-Term Evolution which is a wireless broadband technology.
� Auction 97 – An FCC auction of AWS-3 spectrum licenses that ended in January 2015.
� Average Billings per Account (‘‘ABPA’’) – metric is calculated by dividing total postpaid service revenues plusequipment installment plan billings by the average number of postpaid accounts by the number of months in theperiod.
� Average Billings per User (‘‘ABPU’’) – metric is calculated by dividing total postpaid service revenues plusequipment installment plan billings by the average number of postpaid customers by the number of months in theperiod.
� Average Revenue per Account (‘‘ARPA’’) – metric is calculated by dividing total postpaid service revenues by theaverage number of postpaid accounts by the number of months in the period.
� Average Revenue per User (‘‘ARPU’’) – metric is calculated by dividing a revenue base by an average number ofcustomers by the number of months in the period. These revenue bases and customer populations are shown below:
� Postpaid ARPU – consists of total postpaid service revenues and postpaid customers.
� Service Revenue ARPU – consists of total postpaid, prepaid and reseller service revenues, inbound roaming andother service revenues and postpaid, prepaid and reseller customers.
� Broadband Connections – refers to the number of Wireline customers provided high-capacity data circuits viavarious technologies, including DSL and dedicated internet circuit technologies or the Cable billable number of linesinto a building for high-speed data services.
� Churn Rate – represents the percentage of the customers that disconnect service each month. These rates representthe average monthly churn rate for each respective period.
3
MANAGEMENT’S DISCUSSION AND ANALYSIS OF FINANCIAL CONDITION AND RESULTS OF OPERATIONS

� FCC – Federal Communications Commission
� Gross Additions – represents the total number of new customers added during the period, without regard tocustomers who terminate service.
� IPTV Connections – represents the number of customers provided video services using IP networking technology.
� ManagedIP Connections – refers to the number of telephone handsets, data lines and IP trunks providingcommunications using IP networking technology.
� Net Additions (Losses) – represents the total number of new customers added during the period, net of customerswho terminate service during that period.
� Smartphone Penetration – is calculated by dividing postpaid smartphone customers by total postpaid customers.
� Video Connections – generally, a home or business receiving video programming counts as one video connection.In counting bulk residential or commercial connections, such as an apartment building or a hotel, connections arecounted based on the number of units/rooms within the building receiving service.
� Voice Connections – refers to the individual circuit connecting a customer to Wireline’s central office facilities or theCable billable number of lines into a building for voice services.
� VoLTE – Voice over Long-Term Evolution which is a technology specification that defines the standards andprocedures for delivering voice communication and data over 4G LTE networks.
� Wireline Residential Revenue per Connection – is calculated by dividing total wireline residential revenue by theaverage number of total wireline residential customers.
4
MANAGEMENT’S DISCUSSION AND ANALYSIS OF FINANCIAL CONDITION AND RESULTS OF OPERATIONS
RESULTS OF OPERATIONS — TDS CONSOLIDATEDYear Ended December 31, 2015 2014 2013 2015 vs. 2014 2014 vs. 2013
(Dollars in thousands)Operating revenues
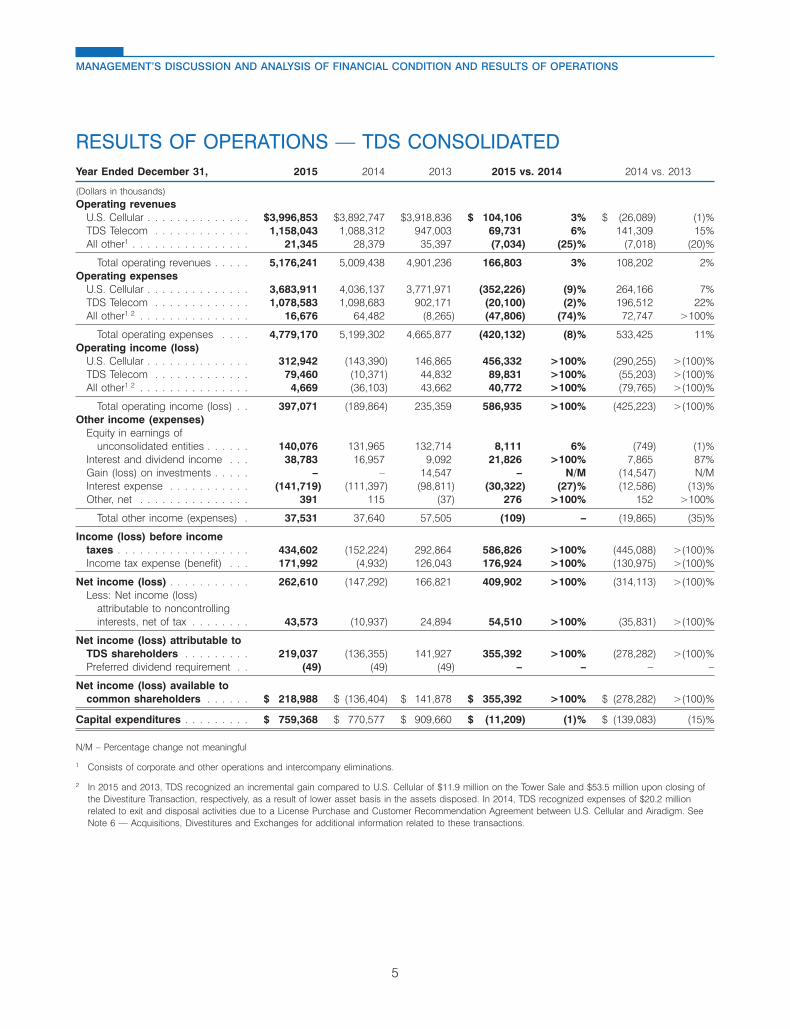
U.S. Cellular . . . . . . . . . . . . . . $3,996,853 $3,892,747 $3,918,836 $ 104,106 3% $ (26,089) (1)%TDS Telecom . . . . . . . . . . . . . 1,158,043 1,088,312 947,003 69,731 6% 141,309 15%All other1 . . . . . . . . . . . . . . . . 21,345 28,379 35,397 (7,034) (25)% (7,018) (20)%
Total operating revenues . . . . . 5,176,241 5,009,438 4,901,236 166,803 3% 108,202 2%Operating expenses
U.S. Cellular . . . . . . . . . . . . . . 3,683,911 4,036,137 3,771,971 (352,226) (9)% 264,166 7%TDS Telecom . . . . . . . . . . . . . 1,078,583 1,098,683 902,171 (20,100) (2)% 196,512 22%All other1 2 . . . . . . . . . . . . . . . 16,676 64,482 (8,265) (47,806) (74)% 72,747 >100%
Total operating expenses . . . . 4,779,170 5,199,302 4,665,877 (420,132) (8)% 533,425 11%Operating income (loss)
U.S. Cellular . . . . . . . . . . . . . . 312,942 (143,390) 146,865 456,332 >100% (290,255) >(100)%TDS Telecom . . . . . . . . . . . . . 79,460 (10,371) 44,832 89,831 >100% (55,203) >(100)%All other1 2 . . . . . . . . . . . . . . . 4,669 (36,103) 43,662 40,772 >100% (79,765) >(100)%
Total operating income (loss) . . 397,071 (189,864) 235,359 586,935 >100% (425,223) >(100)%Other income (expenses)
Equity in earnings ofunconsolidated entities . . . . . . 140,076 131,965 132,714 8,111 6% (749) (1)%
Interest and dividend income . . . 38,783 16,957 9,092 21,826 >100% 7,865 87%Gain (loss) on investments . . . . . – – 14,547 – N/M (14,547) N/MInterest expense . . . . . . . . . . . (141,719) (111,397) (98,811) (30,322) (27)% (12,586) (13)%Other, net . . . . . . . . . . . . . . . 391 115 (37) 276 >100% 152 >100%
Total other income (expenses) . 37,531 37,640 57,505 (109) – (19,865) (35)%
Income (loss) before incometaxes . . . . . . . . . . . . . . . . . . 434,602 (152,224) 292,864 586,826 >100% (445,088) >(100)%Income tax expense (benefit) . . . 171,992 (4,932) 126,043 176,924 >100% (130,975) >(100)%
Net income (loss) . . . . . . . . . . . 262,610 (147,292) 166,821 409,902 >100% (314,113) >(100)%Less: Net income (loss)
attributable to noncontrollinginterests, net of tax . . . . . . . . 43,573 (10,937) 24,894 54,510 >100% (35,831) >(100)%
Net income (loss) attributable toTDS shareholders . . . . . . . . . 219,037 (136,355) 141,927 355,392 >100% (278,282) >(100)%Preferred dividend requirement . . (49) (49) (49) – – – –
Net income (loss) available tocommon shareholders . . . . . . $ 218,988 $ (136,404) $ 141,878 $ 355,392 >100% $ (278,282) >(100)%
Capital expenditures . . . . . . . . . $ 759,368 $ 770,577 $ 909,660 $ (11,209) (1)% $ (139,083) (15)%
N/M – Percentage change not meaningful
1 Consists of corporate and other operations and intercompany eliminations.
2 In 2015 and 2013, TDS recognized an incremental gain compared to U.S. Cellular of $11.9 million on the Tower Sale and $53.5 million upon closing ofthe Divestiture Transaction, respectively, as a result of lower asset basis in the assets disposed. In 2014, TDS recognized expenses of $20.2 millionrelated to exit and disposal activities due to a License Purchase and Customer Recommendation Agreement between U.S. Cellular and Airadigm. SeeNote 6 — Acquisitions, Divestitures and Exchanges for additional information related to these transactions.
5
MANAGEMENT’S DISCUSSION AND ANALYSIS OF FINANCIAL CONDITION AND RESULTS OF OPERATIONS
11MAR201618465519
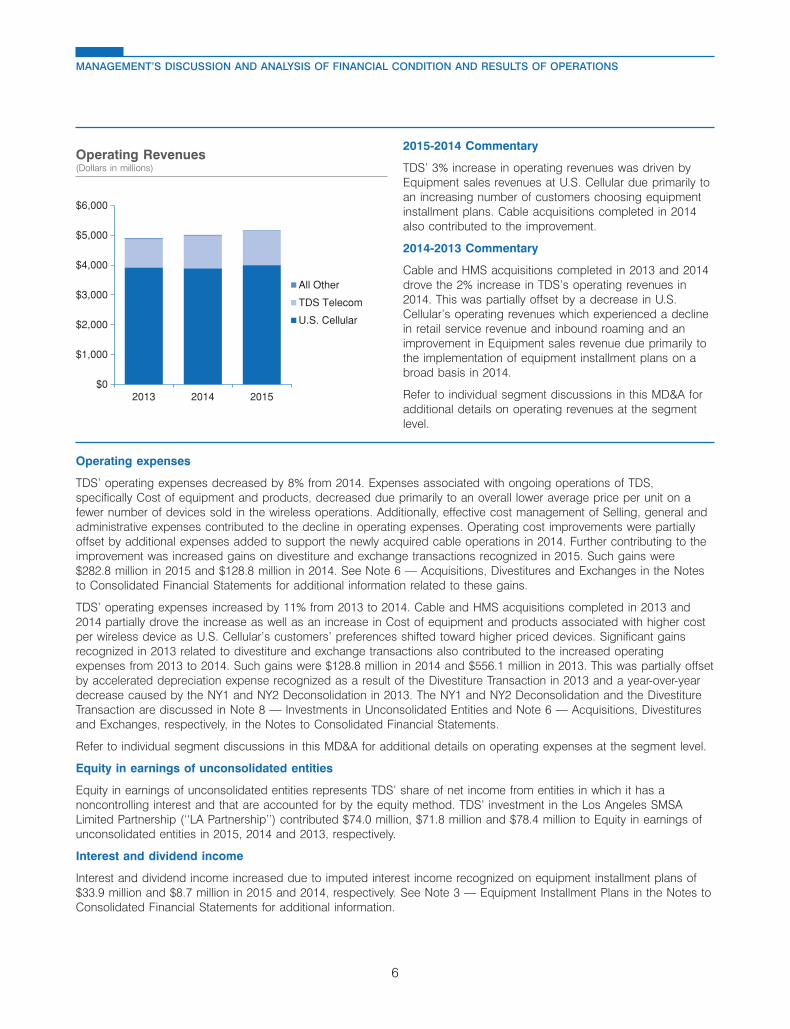
TDS’ 3% increase in operating revenues was driven byEquipment sales revenues at U.S. Cellular due primarily toan increasing number of customers choosing equipmentinstallment plans. Cable acquisitions completed in 2014also contributed to the improvement.
Cable and HMS acquisitions completed in 2013 and 2014drove the 2% increase in TDS’s operating revenues in2014. This was partially offset by a decrease in U.S.Cellular’s operating revenues which experienced a declinein retail service revenue and inbound roaming and animprovement in Equipment sales revenue due primarily tothe implementation of equipment installment plans on abroad basis in 2014.
Refer to individual segment discussions in this MD&A foradditional details on operating revenues at the segment
$0
$1,000
$2,000
$3,000
$4,000
$5,000
$6,000
2013 2014 2015
All Other
TDS Telecom
U.S. Cellular
level.
Operating expenses
TDS’ operating expenses decreased by 8% from 2014. Expenses associated with ongoing operations of TDS,specifically Cost of equipment and products, decreased due primarily to an overall lower average price per unit on afewer number of devices sold in the wireless operations. Additionally, effective cost management of Selling, general andadministrative expenses contributed to the decline in operating expenses. Operating cost improvements were partiallyoffset by additional expenses added to support the newly acquired cable operations in 2014. Further contributing to theimprovement was increased gains on divestiture and exchange transactions recognized in 2015. Such gains were$282.8 million in 2015 and $128.8 million in 2014. See Note 6 — Acquisitions, Divestitures and Exchanges in the Notesto Consolidated Financial Statements for additional information related to these gains.
TDS’ operating expenses increased by 11% from 2013 to 2014. Cable and HMS acquisitions completed in 2013 and2014 partially drove the increase as well as an increase in Cost of equipment and products associated with higher costper wireless device as U.S. Cellular’s customers’ preferences shifted toward higher priced devices. Significant gainsrecognized in 2013 related to divestiture and exchange transactions also contributed to the increased operatingexpenses from 2013 to 2014. Such gains were $128.8 million in 2014 and $556.1 million in 2013. This was partially offsetby accelerated depreciation expense recognized as a result of the Divestiture Transaction in 2013 and a year-over-yeardecrease caused by the NY1 and NY2 Deconsolidation in 2013. The NY1 and NY2 Deconsolidation and the DivestitureTransaction are discussed in Note 8 — Investments in Unconsolidated Entities and Note 6 — Acquisitions, Divestituresand Exchanges, respectively, in the Notes to Consolidated Financial Statements.
Refer to individual segment discussions in this MD&A for additional details on operating expenses at the segment level.
Equity in earnings of unconsolidated entities
Equity in earnings of unconsolidated entities represents TDS’ share of net income from entities in which it has anoncontrolling interest and that are accounted for by the equity method. TDS’ investment in the Los Angeles SMSALimited Partnership (‘‘LA Partnership’’) contributed $74.0 million, $71.8 million and $78.4 million to Equity in earnings ofunconsolidated entities in 2015, 2014 and 2013, respectively.
Interest and dividend income
Interest and dividend income increased due to imputed interest income recognized on equipment installment plans of$33.9 million and $8.7 million in 2015 and 2014, respectively. See Note 3 — Equipment Installment Plans in the Notes toConsolidated Financial Statements for additional information.
6
MANAGEMENT’S DISCUSSION AND ANALYSIS OF FINANCIAL CONDITION AND RESULTS OF OPERATIONS
2015-2014 Commentary
2014-2013 Commentary
Operating Revenues(Dollars in millions)

Gain (loss) on investments
In connection with the NY1 & NY2 Deconsolidation, TDS recognized a non-cash pre-tax gain of $14.5 million which wasrecorded in Gain (loss) on investments in 2013. See Note 8 — Investments in Unconsolidated Entities in the Notes toConsolidated Financial Statements for additional information.
Interest expense
Interest expense increased from 2014 to 2015 due primarily to U.S. Cellular’s issuance of $275 million of 7.25% SeniorNotes in December 2014 and the $225 million Term Loan in July 2015. Interest expense increased from 2013 to 2014due primarily to a decrease in capitalized interest related to network and systems projects.
Income tax expense
The effective tax rates on Income before income taxes and extraordinary items (‘‘pre-tax income’’) for 2015, 2014 and2013 were 39.6%, 3.2% and 43.0%, respectively. The following significant discrete and other items impacted income taxexpense for these years:
2015 — The effective tax rate for 2015 is consistent with a normalized tax rate inclusive of federal and state tax. Therewere no significant discrete items that impacted the rate.
2014 — The effective tax rate for 2014 includes tax expense of $38.5 million related to valuation allowances recordedagainst certain state deferred tax assets, higher tax expense of $18.3 million due to the tax effects of a nondeductibleimpairment of Goodwill, and a tax benefit of $10.8 million related to a release of valuation allowance on federal netoperating losses previously limited under loss utilization rules. The overall effective tax rate is lower due to the effect ofthese items combined with the loss in 2014 in Income (loss) before income taxes.
2013 — The effective tax rate for 2013 includes tax expense of $14.9 million related to the NY1 & NY2 Deconsolidationand the Divestiture Transaction, and a tax benefit of $5.5 million resulting from statute of limitation expirations. The NY1and NY2 Deconsolidation and the Divestiture Transaction are discussed in Note 8 — Investments in UnconsolidatedEntities and Note 6 — Acquisitions, Divestitures and Exchanges, respectively, in the Notes to Consolidated FinancialStatements.
See Note 4 — Income Taxes in the Notes to Consolidated Financial Statements for further information on the effectivetax rate.
Net income (loss) attributable to noncontrolling interests, net of tax
Net income (loss) attributable to noncontrolling interests, net of tax includes the noncontrolling public shareholders’share of U.S. Cellular’s net income (loss), the noncontrolling shareholders’ or partners’ share of certain U.S. Cellularsubsidiaries’ net income (loss) and other TDS noncontrolling interests.
Year Ended December 31, 2015 2014 2013
(Dollars in thousands)Net income (loss) attributable to noncontrolling interests, net of tax
U.S. Cellular noncontrolling public shareholders’ . . . . . . . . . . . . . . . . . . . . . . . . . $ 38,230 $ (6,826) $ 21,775Noncontrolling shareholders’ or partners’ . . . . . . . . . . . . . . . . . . . . . . . . . . . . . 5,343 (4,111) 3,119
$ 43,573 $ (10,937) $ 24,894
7
MANAGEMENT’S DISCUSSION AND ANALYSIS OF FINANCIAL CONDITION AND RESULTS OF OPERATIONS
11MAR201618464870
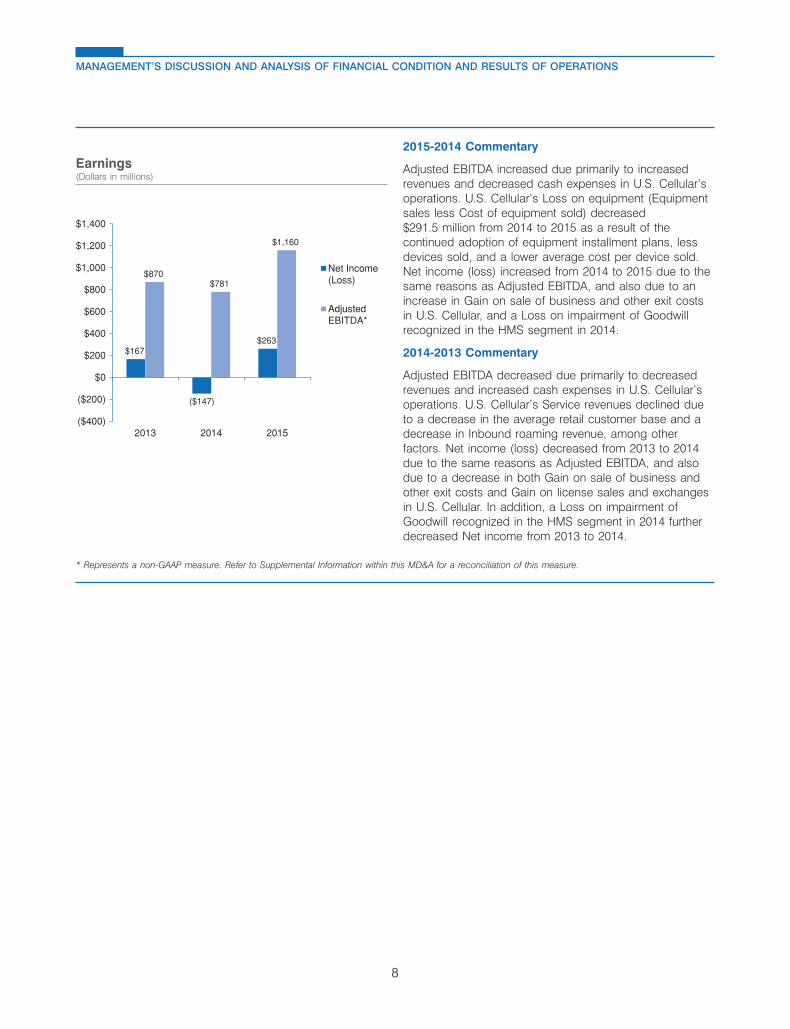
Adjusted EBITDA increased due primarily to increasedrevenues and decreased cash expenses in U.S. Cellular’soperations. U.S. Cellular’s Loss on equipment (Equipmentsales less Cost of equipment sold) decreased$291.5 million from 2014 to 2015 as a result of thecontinued adoption of equipment installment plans, lessdevices sold, and a lower average cost per device sold.Net income (loss) increased from 2014 to 2015 due to thesame reasons as Adjusted EBITDA, and also due to anincrease in Gain on sale of business and other exit costsin U.S. Cellular, and a Loss on impairment of Goodwillrecognized in the HMS segment in 2014.
Adjusted EBITDA decreased due primarily to decreasedrevenues and increased cash expenses in U.S. Cellular’soperations. U.S. Cellular’s Service revenues declined dueto a decrease in the average retail customer base and adecrease in Inbound roaming revenue, among otherfactors. Net income (loss) decreased from 2013 to 2014
$167
($147)
$263
$870 $781
$1,160
($400)
($200)
$0
$200
$400
$600
$800
$1,000
$1,200
$1,400
2013 2014 2015
Net Income(Loss)
AdjustedEBITDA*
due to the same reasons as Adjusted EBITDA, and alsodue to a decrease in both Gain on sale of business andother exit costs and Gain on license sales and exchangesin U.S. Cellular. In addition, a Loss on impairment ofGoodwill recognized in the HMS segment in 2014 furtherdecreased Net income from 2013 to 2014.
* Represents a non-GAAP measure. Refer to Supplemental Information within this MD&A for a reconciliation of this measure.
8
MANAGEMENT’S DISCUSSION AND ANALYSIS OF FINANCIAL CONDITION AND RESULTS OF OPERATIONS
2015-2014 Commentary
2014-2013 Commentary
Earnings(Dollars in millions)

11MAR201607260845
13MAR201601440360
BUSINESS OVERVIEWU.S. Cellular owns, operates, and invests in wireless markets throughout the United States. U.S. Cellular is an 84%-owned subsidiary of TDS. U.S. Cellular’s strategy is to attract and retain wireless customers through a value propositioncomprised of a high-quality network, outstanding customer service, and competitive devices, plans, and pricing, allprovided with a local focus.
U.S. Cellular headquarters, Chicago, IL
U.S. Cellular operations
� Serves approximately 4.9 million customers including 4.4 million postpaid and 0.4 million prepaid customers.
� Operates in 23 states.
� Employs approximately 6,400 employees.
� Headquartered in Chicago, Illinois.
� 6,297 cell sites including 3,978 owned towers in service.
SIGNIFICANT TRENDS AND DEVELOPMENTSTechnology and Support Systems:
� U.S. Cellular continued to deploy 4G LTE as a result of U.S. Cellular’s strategic initiative to enhance its network. 4GLTE now reaches 99% of postpaid customers and 98% of cell sites. The adoption of data-rich smartphones andconnected devices is driving significant growth in data traffic. At the end of the year, 72% of postpaid customers had4G capable devices, with the LTE network handling 81% of data traffic. Also, U.S. Cellular began user trials related toVoLTE technology to allow customers to utilize the LTE network for both voice and data services, and these trials areanticipated to continue into 2016.
� In 2015, U.S. Cellular spent $285.8 million in cash for license acquisitions, the majority of which came from U.S.Cellular’s participation in Auction 97 indirectly through its limited partnership interest in Advantage Spectrum.
9
MANAGEMENT’S DISCUSSION AND ANALYSIS OF FINANCIAL CONDITION AND RESULTS OF OPERATIONS
U.S. CELLULAR OPERATIONS
OPERATIONS

Advantage Spectrum was the provisional winning bidder of 124 AWS licenses for an aggregate bid of $338.3 million,after its expected designated entity discount of 25%. Advantage Spectrum’s bid amount, less the initial depositamount of $60.0 million paid in 2014, was paid to the FCC in March 2015. These licenses have not yet been grantedby the FCC. U.S. Cellular’s strategy is to continue to obtain interests in and access to wireless licenses in currentoperating markets. This strategy will help ensure adequate spectrum to deliver a best-in-class network that meets thegrowing capacity and speed requirements of U.S. Cellular customers.
Asset Management:
� U.S. Cellular continued to pursue opportunities to monetize non-strategic assets to support investment in the business.In December 2014, U.S. Cellular entered into an agreement with a third party to sell 595 towers and certain relatedcontracts, assets, and liabilities for $159.0 million in cash. The gain recognized was $3.8 million and $108.2 million in2014 and 2015, respectively. This agreement and related transactions are referred to as the ‘‘Tower Sale.’’
� Additionally, U.S. Cellular entered into various agreements to transfer certain non-operating licenses to third parties inexchange for receiving licenses in operating markets and cash. In connection with these various agreements, U.S.Cellular received cash totaling $145.0 million and recognized an aggregate pre-tax gain of $149.1 million in 2015.
� In January 2016, U.S. Cellular entered into an agreement to purchase a 700 MHz A Block license for $36.0 million.The transaction is expected to close in the third quarter of 2016 pending regulatory approval. In February 2016, U.S.Cellular entered into multiple agreements with third parties that provide for the transfer of certain AWS and PCSspectrum licenses and approximately $30 million in cash to U.S. Cellular, in exchange for U.S. Cellular transferringcertain AWS, PCS and 700 MHz licenses to the third parties. The transactions are subject to regulatory approval andother customary closing conditions, and are expected to close in 2016. Upon closing of the transactions, U.S. Cellularexpects to recognize a gain.
Products and Services:
� U.S. Cellular continued to leverage competitive value-based pricing for its plans and services, including equipmentinstallment plan offerings. U.S. Cellular will continue to offer equipment installment plans in 2016. To the extent thatcustomers adopt these plans, U.S. Cellular expects an increase in equipment sales revenues. However, certain of theequipment installment plans provide the customer with a reduction in the monthly access charge for the device; thus,to the extent that existing customers adopt such plans, U.S. Cellular expects a reduction in retail service revenues andARPU.
� U.S. Cellular launched iconic Samsung and Apple devices and expanded the portfolio of tablets and connecteddevices in line with the strategic initiative to increase gross additions, reduce churn, and increase data usage.
� U.S. Cellular continued to expand distribution through third-party national and on-line retailers. As a growing base ofcustomers purchase wireless service outside of corporate and agent owned locations, U.S. Cellular will continue toexplore new relationships with additional third-party retailers as part of the strategy to expand distribution.
� U.S. Cellular also expanded its solutions available to business and government customers, including a growing suiteof machine-to-machine solutions across various categories. U.S. Cellular will continue to enhance its advancedwireless services and connected solutions for consumer, business and government customers.
10
MANAGEMENT’S DISCUSSION AND ANALYSIS OF FINANCIAL CONDITION AND RESULTS OF OPERATIONS

12MAR201609462001
11MAR201618514709
OPERATIONAL OVERVIEW
2013 2014 2015
Gross Additions 697,000 940,000 831,000
Net Additions (Losses) (325,000) 31,000 111,000
Churn 1.8% 1.8% 1.4%
Postpaid customers –end of period
4,267,000 4,298,000 4,409,000
8%
Postpaid
Prepaid
92%
2015-2014 Commentary 2014-2013 Commentary
Postpaid customers comprised approximately 92% of Postpaid customers comprised approximately 93% ofU.S. Cellular’s retail customers at December 31, 2015. U.S. Cellular’s retail customers at December 31, 2014.U.S. Cellular believes the increase in net additions in Postpaid churn in 2013 and the first half of 2014 was2015 is a result of competitive products and services adversely affected by the billing system conversion inpriced to offer the best value to customers, improved 2013; however it improved over the course of 2014.speed to market for product offerings, and expandedequipment installment plan offerings. U.S. Cellular alsobelieves postpaid churn continued to decline from 2014levels due to an improved customer experience andstrong retention programs. Total retail customers at theperiod ended December 31, 2015, 2014 and 2013 were4,796,000, 4,646,000 and 4,610,000, respectively.
11
MANAGEMENT’S DISCUSSION AND ANALYSIS OF FINANCIAL CONDITION AND RESULTS OF OPERATIONS
Retail Customer CompositionDecember 31, 2015 Postpaid Customer Results
11MAR201618514433
11MAR201618515001
2.50%
2.00%
1.73%
2.03%1.91%
2.29%
1.73%1.59%
1.48%1.41%
1.31%1.34%
1.60%1.71%
1.50%
1.00%
0.50%
0.00%
3/31
/201
3
6/30
/201
3
9/30
/201
3
12/3
1/20
13
3/31
/201
4
6/30
/201
4
9/30
/201
4
12/3
1/20
14
3/31
/201
5
6/30
/201
5
9/30
/201
5
12/3
1/20
15
2015-2014 Commentary
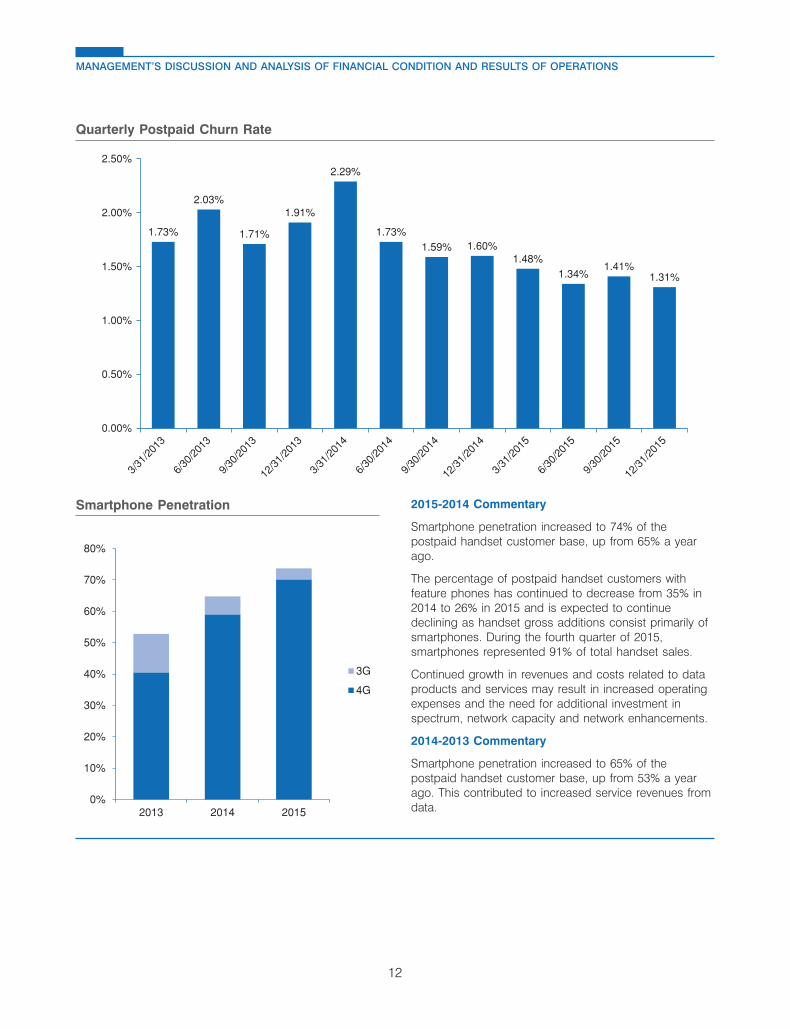
Smartphone penetration increased to 74% of thepostpaid handset customer base, up from 65% a yearago.
The percentage of postpaid handset customers withfeature phones has continued to decrease from 35% in2014 to 26% in 2015 and is expected to continuedeclining as handset gross additions consist primarily ofsmartphones. During the fourth quarter of 2015,smartphones represented 91% of total handset sales.
Continued growth in revenues and costs related to dataproducts and services may result in increased operatingexpenses and the need for additional investment inspectrum, network capacity and network enhancements.
2014-2013 Commentary
Smartphone penetration increased to 65% of thepostpaid handset customer base, up from 53% a yearago. This contributed to increased service revenues fromdata.
0%
10%
20%
30%
40%
50%
60%
70%
80%
2013 2014 2015
3G
4G
12
MANAGEMENT’S DISCUSSION AND ANALYSIS OF FINANCIAL CONDITION AND RESULTS OF OPERATIONS
Quarterly Postpaid Churn Rate
Smartphone Penetration
14MAR20160223173914MAR201602231864
$120.92
$133.19
$136.90$135.61
$150.07
$118
$122
$126
$130
$134
$138
$142
$146
$150
$154
2013 2014 2015
PostpaidARPA
PostpaidABPA$54.31
$56.75
$54.50
$57.78
$59.74
$51
$52
$53
$54
$55
$56
$57
$58
$59
$60
$61
2013 2014 2015
PostpaidARPU
PostpaidABPU
2015-2014 Commentary
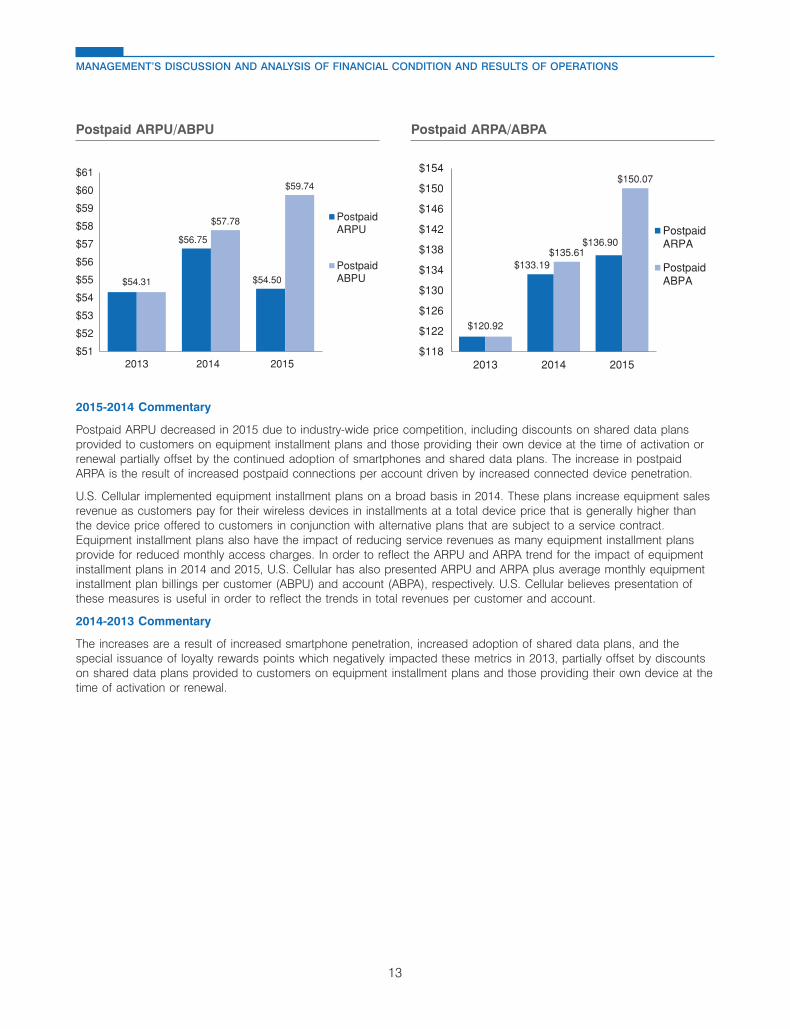
Postpaid ARPU decreased in 2015 due to industry-wide price competition, including discounts on shared data plansprovided to customers on equipment installment plans and those providing their own device at the time of activation orrenewal partially offset by the continued adoption of smartphones and shared data plans. The increase in postpaidARPA is the result of increased postpaid connections per account driven by increased connected device penetration.
U.S. Cellular implemented equipment installment plans on a broad basis in 2014. These plans increase equipment salesrevenue as customers pay for their wireless devices in installments at a total device price that is generally higher thanthe device price offered to customers in conjunction with alternative plans that are subject to a service contract.Equipment installment plans also have the impact of reducing service revenues as many equipment installment plansprovide for reduced monthly access charges. In order to reflect the ARPU and ARPA trend for the impact of equipmentinstallment plans in 2014 and 2015, U.S. Cellular has also presented ARPU and ARPA plus average monthly equipmentinstallment plan billings per customer (ABPU) and account (ABPA), respectively. U.S. Cellular believes presentation ofthese measures is useful in order to reflect the trends in total revenues per customer and account.
2014-2013 Commentary
The increases are a result of increased smartphone penetration, increased adoption of shared data plans, and thespecial issuance of loyalty rewards points which negatively impacted these metrics in 2013, partially offset by discountson shared data plans provided to customers on equipment installment plans and those providing their own device at thetime of activation or renewal.
13
MANAGEMENT’S DISCUSSION AND ANALYSIS OF FINANCIAL CONDITION AND RESULTS OF OPERATIONS
Postpaid ARPU/ABPU Postpaid ARPA/ABPA
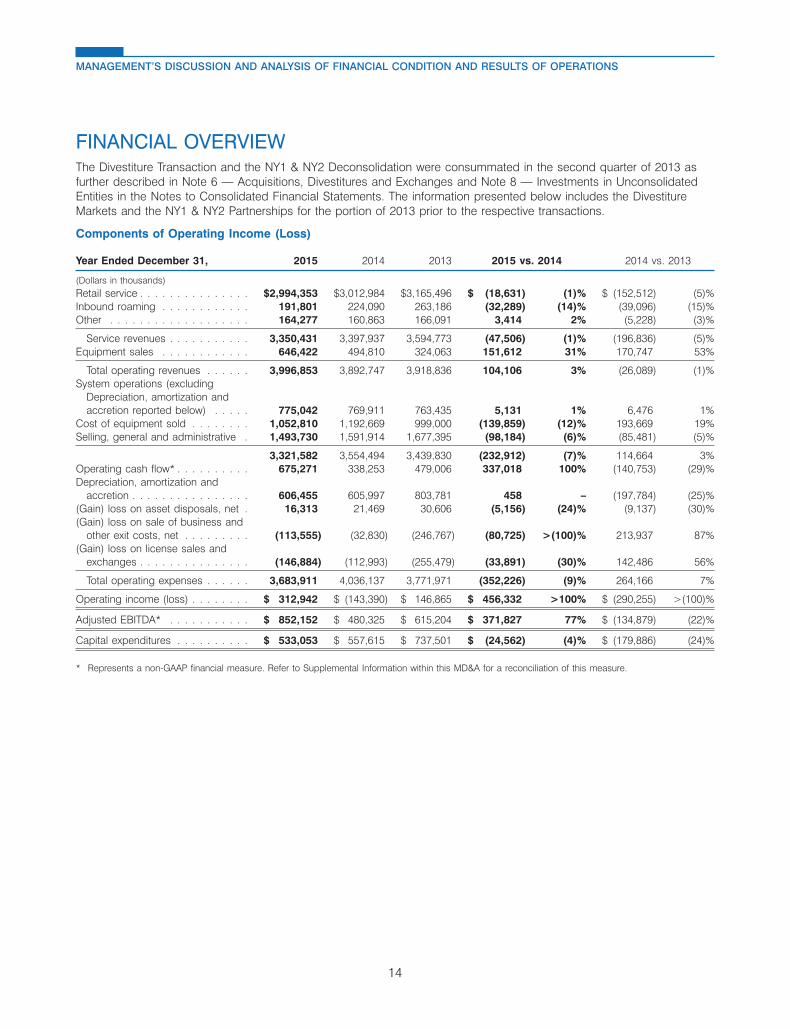
FINANCIAL OVERVIEWThe Divestiture Transaction and the NY1 & NY2 Deconsolidation were consummated in the second quarter of 2013 asfurther described in Note 6 — Acquisitions, Divestitures and Exchanges and Note 8 — Investments in UnconsolidatedEntities in the Notes to Consolidated Financial Statements. The information presented below includes the DivestitureMarkets and the NY1 & NY2 Partnerships for the portion of 2013 prior to the respective transactions.
Components of Operating Income (Loss)
Year Ended December 31, 2015 2014 2013 2015 vs. 2014 2014 vs. 2013
(Dollars in thousands)Retail service . . . . . . . . . . . . . . . $2,994,353 $3,012,984 $3,165,496 $ (18,631) (1)% $ (152,512) (5)%Inbound roaming . . . . . . . . . . . . 191,801 224,090 263,186 (32,289) (14)% (39,096) (15)%Other . . . . . . . . . . . . . . . . . . . 164,277 160,863 166,091 3,414 2% (5,228) (3)%
Service revenues . . . . . . . . . . . 3,350,431 3,397,937 3,594,773 (47,506) (1)% (196,836) (5)%Equipment sales . . . . . . . . . . . . 646,422 494,810 324,063 151,612 31% 170,747 53%
Total operating revenues . . . . . . 3,996,853 3,892,747 3,918,836 104,106 3% (26,089) (1)%System operations (excluding
Depreciation, amortization andaccretion reported below) . . . . . 775,042 769,911 763,435 5,131 1% 6,476 1%
Cost of equipment sold . . . . . . . . 1,052,810 1,192,669 999,000 (139,859) (12)% 193,669 19%Selling, general and administrative . 1,493,730 1,591,914 1,677,395 (98,184) (6)% (85,481) (5)%
3,321,582 3,554,494 3,439,830 (232,912) (7)% 114,664 3%Operating cash flow* . . . . . . . . . . 675,271 338,253 479,006 337,018 100% (140,753) (29)%Depreciation, amortization and
accretion . . . . . . . . . . . . . . . . 606,455 605,997 803,781 458 – (197,784) (25)%(Gain) loss on asset disposals, net . 16,313 21,469 30,606 (5,156) (24)% (9,137) (30)%(Gain) loss on sale of business and
other exit costs, net . . . . . . . . . (113,555) (32,830) (246,767) (80,725) >(100)% 213,937 87%(Gain) loss on license sales and
exchanges . . . . . . . . . . . . . . . (146,884) (112,993) (255,479) (33,891) (30)% 142,486 56%
Total operating expenses . . . . . . 3,683,911 4,036,137 3,771,971 (352,226) (9)% 264,166 7%
Operating income (loss) . . . . . . . . $ 312,942 $ (143,390) $ 146,865 $ 456,332 >100% $ (290,255) >(100)%
Adjusted EBITDA* . . . . . . . . . . . $ 852,152 $ 480,325 $ 615,204 $ 371,827 77% $ (134,879) (22)%
Capital expenditures . . . . . . . . . . $ 533,053 $ 557,615 $ 737,501 $ (24,562) (4)% $ (179,886) (24)%
* Represents a non-GAAP financial measure. Refer to Supplemental Information within this MD&A for a reconciliation of this measure.
14
MANAGEMENT’S DISCUSSION AND ANALYSIS OF FINANCIAL CONDITION AND RESULTS OF OPERATIONS
30MAR201620541628
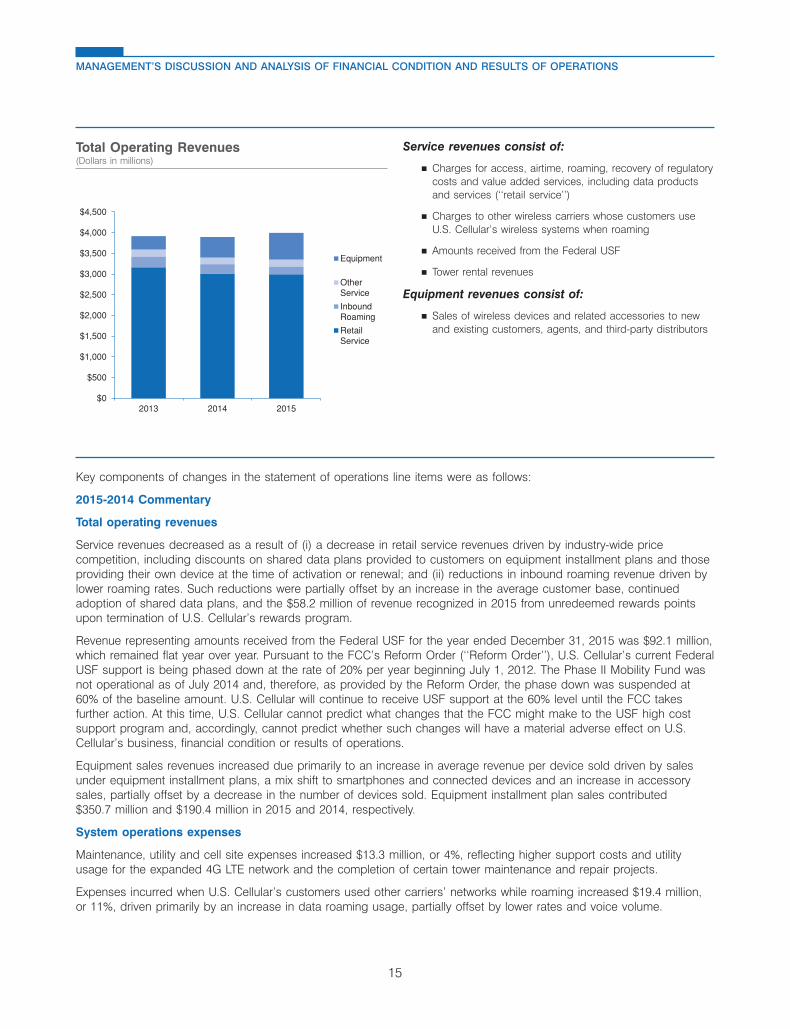
Service revenues consist of:
� Charges for access, airtime, roaming, recovery of regulatorycosts and value added services, including data productsand services (‘‘retail service’’)
� Charges to other wireless carriers whose customers useU.S. Cellular’s wireless systems when roaming
� Amounts received from the Federal USF
� Tower rental revenues
Equipment revenues consist of:
� Sales of wireless devices and related accessories to newand existing customers, agents, and third-party distributors
$0
$500
$1,000
$1,500
$2,000
$2,500
$3,000
$3,500
$4,000
$4,500
2013 2014 2015
Equipment
OtherService
InboundRoaming
RetailService
Key components of changes in the statement of operations line items were as follows:
2015-2014 Commentary
Total operating revenues
Service revenues decreased as a result of (i) a decrease in retail service revenues driven by industry-wide pricecompetition, including discounts on shared data plans provided to customers on equipment installment plans and thoseproviding their own device at the time of activation or renewal; and (ii) reductions in inbound roaming revenue driven bylower roaming rates. Such reductions were partially offset by an increase in the average customer base, continuedadoption of shared data plans, and the $58.2 million of revenue recognized in 2015 from unredeemed rewards pointsupon termination of U.S. Cellular’s rewards program.
Revenue representing amounts received from the Federal USF for the year ended December 31, 2015 was $92.1 million,which remained flat year over year. Pursuant to the FCC’s Reform Order (‘‘Reform Order’’), U.S. Cellular’s current FederalUSF support is being phased down at the rate of 20% per year beginning July 1, 2012. The Phase II Mobility Fund wasnot operational as of July 2014 and, therefore, as provided by the Reform Order, the phase down was suspended at60% of the baseline amount. U.S. Cellular will continue to receive USF support at the 60% level until the FCC takesfurther action. At this time, U.S. Cellular cannot predict what changes that the FCC might make to the USF high costsupport program and, accordingly, cannot predict whether such changes will have a material adverse effect on U.S.Cellular’s business, financial condition or results of operations.
Equipment sales revenues increased due primarily to an increase in average revenue per device sold driven by salesunder equipment installment plans, a mix shift to smartphones and connected devices and an increase in accessorysales, partially offset by a decrease in the number of devices sold. Equipment installment plan sales contributed$350.7 million and $190.4 million in 2015 and 2014, respectively.
System operations expenses
Maintenance, utility and cell site expenses increased $13.3 million, or 4%, reflecting higher support costs and utilityusage for the expanded 4G LTE network and the completion of certain tower maintenance and repair projects.
Expenses incurred when U.S. Cellular’s customers used other carriers’ networks while roaming increased $19.4 million,or 11%, driven primarily by an increase in data roaming usage, partially offset by lower rates and voice volume.
15
MANAGEMENT’S DISCUSSION AND ANALYSIS OF FINANCIAL CONDITION AND RESULTS OF OPERATIONS
Total Operating Revenues(Dollars in millions)
Customer usage expenses decreased $27.6 million, or 13%, driven by lower fees for platform and content providers, adecrease in long distance charges driven by rate reductions, and a decrease in circuit costs from the migration to LTE.
U.S. Cellular expects system operations expenses to increase in the future to support the continued growth in cell sitesand other network facilities as it continues to add capacity, enhance quality and deploy new technologies as well as tosupport increases in total customer usage, particularly data usage. However, these increases are expected to be offsetto some extent by cost savings generated by shifting data traffic to the 4G LTE network from the 3G network.
Cost of equipment sold
The decrease in Cost of equipment sold is a result of an 11% reduction in devices sold and a decrease in the averagecost per device sold driven by the lower cost of smartphones and connected devices. Cost of equipment sold in 2015included $448.7 million related to equipment installment plan sales compared to $280.3 million in 2014. Loss onequipment was $406.4 million and $697.9 million for 2015 and 2014, respectively.
Selling, general and administrative expenses
Selling expenses decreased $20.5 million, or 3%, due primarily to lower agent and retail commission expenses driven byfewer activations and renewals, partially offset by increased advertising expenses.
General and administrative expenses decreased $77.7 million, or 9%, due primarily to lower consulting expenses relatedto the billing system and customer service operations, and lower rates for roamer administration.
Depreciation, amortization and accretion expense
Depreciation, amortization and accretion expense remained relatively flat year over year.
(Gain) loss on asset disposals, net
The decrease in Loss on asset disposals was due primarily to fewer write-offs and disposals of certain network assets.
(Gain) loss on sale of business and other exit costs, net
The net gain in 2015 was due primarily to a $108.2 million gain recognized on the Tower Sale. The net gain in 2014 wasdue primarily to $29.3 million of gain related to the continuing impact of the Divestiture Transaction. See Note 6 —Acquisitions, Divestitures and Exchanges in the Notes to Consolidated Financial Statements for additional information.
(Gain) loss on license sales and exchanges, net
The net gains in 2015 and 2014 were due to license sales and exchanges with third parties. See Note 6 — Acquisitions,Divestitures and Exchanges in the Notes to Consolidated Financial Statements for additional information.
2014-2013 Commentary
Total operating revenues
Service revenues decreased as a result of a decrease in the average customer base (including the reductions causedby the Divestiture Transaction and NY1 and NY2 Deconsolidation) and a reduction in revenues from the Federal USF. Adecrease in Inbound roaming revenues caused by reductions in inbound roaming rates and voice volumes partiallyoffset by higher inbound roaming data usage further contributed to the decrease in service revenues.
Such reductions were partially offset by increased revenues as a result of higher smartphone penetration and towerrental revenues.
Equipment sales revenues increased due to an increase in the average revenue per device sold due primarily to theimplementation of equipment installment plans on a broad basis in 2014, and increases in the sales of connecteddevices and accessories. This increase is partially offset by a decrease in sales of other device categories, primarily thefeature phone category, and the effects of the Divestiture Transaction and the NY1 & NY2 Deconsolidation. Equipmentinstallment plan sales contributed $190.4 million and $0.8 million in 2014 and 2013, respectively.
System operations expenses
Maintenance, utility and cell site expenses increased $26.6 million, or 8%, reflecting higher support costs for theexpanded 4G LTE network and completion of certain maintenance projects, partially offset by the impacts of theDivestiture Transaction and NY1 & NY2 Deconsolidation.
16
MANAGEMENT’S DISCUSSION AND ANALYSIS OF FINANCIAL CONDITION AND RESULTS OF OPERATIONS
Expenses incurred when U.S. Cellular’s customers used other carriers’ networks while roaming increased $5.8 million, or3%, driven primarily by an increase in data roaming usage, partially offset by lower rates, lower voice usage, and theimpacts of the Divestiture Transaction and NY1 & NY2 Deconsolidation.
Customer usage expenses decreased $25.9 million, or 11%, driven by impacts of the Divestiture Transaction and NY1 &NY2 Deconsolidation, by lower fees for platform and content providers, a decrease in long distance charges driven byrate reductions, and a decrease in circuit costs from LTE migration.
Cost of equipment sold
The increase in Cost of equipment sold was the result of a 22% increase in the average cost per device sold, whichmore than offset the impact of selling fewer devices. Average cost per device sold increased due to general customerpreference for higher priced 4G LTE smartphones and tablets. Cost of equipment sold in 2014 includes $280.3 millionrelated to equipment installment plan sales compared to $0.8 million in 2013. Loss on equipment was $697.9 million and$674.9 million for 2014 and 2013, respectively.
Selling, general and administrative expenses
Selling, general and administrative expenses decreased $85.5 million, or 5%, in 2014 due to the impacts of theDivestiture Transaction, NY1 & NY2 Deconsolidation and lower consulting expenses in 2014 related to the billing systemconversion in the prior year.
Depreciation, amortization and accretion expense
Depreciation, amortization and accretion decreased due to acceleration of Depreciation, amortization and accretionresulting from the Divestiture Transaction. Accelerated depreciation resulting from the Divestiture Transaction was$13.1 million and $158.5 million in 2014 and 2013, respectively.
(Gain) loss on asset disposals, net
The decrease in Loss on asset disposals was due primarily to fewer write-offs and disposals of certain network assets.
(Gain) loss on sale of business and other exit costs, net
The net gain in 2014 and 2013 was due primarily to $29.3 million and $248.4 million of gain recognized related to theDivestiture Transaction. See Note 6 — Acquisitions, Divestitures and Exchanges in the Notes to Consolidated FinancialStatements for additional information.
(Gain) loss on license sales and exchanges
The net gain in 2014 and 2013 was due to license sales and exchanges with third parties. See Note 6 — Acquisitions,Divestitures and Exchanges in the Notes to Consolidated Financial Statements for additional information.
17
MANAGEMENT’S DISCUSSION AND ANALYSIS OF FINANCIAL CONDITION AND RESULTS OF OPERATIONS

12MAR201602143799
13MAR201603225344
BUSINESS OVERVIEWTDS Telecom operates in three reportable segments: Wireline, Cable and HMS. The overall strategy for the Wireline andCable businesses is to own the best pipe in the market in order to capitalize on data growth and the need for higherbroadband speeds. In addition, through its HMS business, TDS Telecom provides a wide range of InformationTechnology (‘‘IT’’) services including colocation, dedicated hosting, hosted application management, cloud computingservices and planning, engineering, procurement, installation, sales and management of IT infrastructure hardwaresolutions.
TDS Telecom headquarters, Madison, WI
Wireline operations
Cable operations
HMS operations
� Wireline and Cable serve approximately 1.2 million broadband, video and voice connections in 34 states.
� Wireline operates 105 incumbent local exchange carriers (‘‘ILEC’’) in 25 states and competitive local exchange carriers(‘‘CLEC’’) in 4 states.
� Cable operates primarily in Colorado, New Mexico, Texas, Utah and Oregon.
� HMS operates a total of eight data centers. It owns two data centers in Iowa, one each in Minnesota, Wisconsin,Colorado and Oregon and it leases two data centers in Arizona.
18
MANAGEMENT’S DISCUSSION AND ANALYSIS OF FINANCIAL CONDITION AND RESULTS OF OPERATIONS
TDS TELECOM OPERATIONS
OPERATIONS
SIGNIFICANT TRENDS AND DEVELOPMENTSAcquisition/ Divestiture:
� TDS Telecom entered the cable business with the acquisition of substantially all of the assets of Baja Broadband, LLC(‘‘Baja’’) on August 1, 2013, which operates cable systems in markets primarily in Colorado, New Mexico, Texas, andUtah. Baja was rebranded as TDS in 2015. On September 1, 2014, TDS Telecom expanded it cable operations withthe acquisition of substantially all of the assets of a group of companies operating as BendBroadband(‘‘BendBroadband’’), headquartered in Bend, Oregon. As part of the agreement, a Tier III data center providingcolocation and managed services and a cable advertising and broadcast business were also acquired. The operationsof the data center are included in the HMS segment. The operations of the cable and the advertising and broadcastbusinesses are included in the Cable segment. Through its Cable operations, TDS Telecom is expanding broadbandservices while leveraging its core competencies in network management and customer focus. Additionally, TDSTelecom will continue to pursue cable acquisitions that meet its criteria of having favorable competitive environments,attractive market demographics and the ability to grow broadband penetration.
� As a result of continually reviewing all of its operations, in 2015 and 2014, TDS Telecom divested certain ILEC marketsthat it considered non-strategic. On an annualized basis these ILEC divestitures collectively represented approximately1% of TDS Telecom 2015 Total operating revenues.
� In 2013, TDS Telecom acquired 100% of the outstanding shares of MSN Communications, Inc. (‘‘MSN’’) for$43.6 million in cash. MSN is an information technology solutions provider whose service offerings complement theHMS portfolio of products.
Technology & Support Systems:
� TDS Telecom’s Wireline segment continued to upgrade and expand its network to respond to the needs of itscustomers for greater bandwidth and advanced technologies. Where economically feasible, TDS Telecom is deployingfiber technology to provide internet speeds of up to 1 Gigabits per second (‘‘Gbps’’). In non-fiber markets, TDSTelecom offers speeds reaching up to 50 Megabits per second (‘‘Mbps’’) using a bonded product.
� TDS Telecom launched ARRIS’ Whole Home Solution branded as CatchTV, and TV Everywhere, and successfullytrialed managedIP services in certain cable markets. TDS Telecom has continued to make capacity investments in itscable markets in line with its strategy to increase broadband penetration in those markets.
� Beginning in 2014 TDS Telecom was able to offer a full suite of end-to-end IT solutions through its OneNeck ITSolutions unified brand. These integration efforts continued in 2015 across all markets.
� TDS Telecom launched a data center in Colorado and completed a Madison data center expansion in 2015. TDSTelecom will continue to explore additional facility expansion, reconfiguration, and development opportunities in 2016and beyond.
Products and Services:
� In 2015, TDS Telecom continued rolling out IPTV, branded as TDS TV, to new markets in order to leverage itshigh-speed network. TDS TV provides customers with connected-home DVRs, video-on-demand (‘‘VOD’’) and TVEverywhere. TDS Telecom has now launched TDS TV in 27 markets, enabling 167,000 service addresses, which isroughly 23% of its service addresses. Where TDS TV is not available, TDS Telecom partners with a satellite TV providerto allow for triple or double play bundling.
� TDS Telecom strives to be the preferred broadband provider in its ILEC residential markets. As such, TDS Telecomcontinues to invest to offer higher speed data service. As of December 31, 2015, TDS Telecom was able to providebroadband service to 94% of its ILEC physical access lines. At December 31, 2015, 65% of the service addresses inits ILEC markets had 10 Mbps or faster service available and 36% of the service addresses in its ILEC markets had25 Mbps or faster service available.
� TDS Telecom continues to focus its commercial sales on managedIP. TDS managedIP is available in Wireline marketsthat cover 88% of all commercial customers at December 31, 2015 and is also available in certain cable markets.
19
MANAGEMENT’S DISCUSSION AND ANALYSIS OF FINANCIAL CONDITION AND RESULTS OF OPERATIONS

11MAR201618465276
FINANCIAL OVERVIEWComponents of Operating Income (Loss)
Year Ended December 31, 2015 2014 2013 2015 vs. 2014 2014 vs. 2013
(Dollars in thousands)Operating revenues
Wireline . . . . . . . . . . . . . . . . $ 700,903 $ 716,422 $ 726,567 $ (15,519) (2)% $ (10,145) (1)%Cable . . . . . . . . . . . . . . . . . . 174,966 116,855 35,883 58,111 50% 80,972 >100%HMS . . . . . . . . . . . . . . . . . . 286,795 258,732 185,616 28,063 11% 73,116 39%Intra-company elimination . . . . . (4,621) (3,697) (1,063) (924) (25)% (2,634) >(100)
TDS Telecom operatingrevenues . . . . . . . . . . . . . 1,158,043 1,088,312 947,003 69,731 6% 141,309 15%
Operating expensesWireline . . . . . . . . . . . . . . . . 612,346 617,948 661,561 (5,602) (1)% (43,613) (7)%Cable . . . . . . . . . . . . . . . . . . 168,627 116,565 35,927 52,062 45% 80,638 >100%HMS . . . . . . . . . . . . . . . . . . 302,231 367,867 205,746 (65,636) (18)% 162,121 79%Intra-company elimination . . . . . (4,621) (3,697) (1,063) (924) (25)% (2,634) >(100)
TDS Telecom operatingexpenses . . . . . . . . . . . . . 1,078,583 1,098,683 902,171 (20,100) (2)% 196,512 22%
TDS Telecom operating income(loss) . . . . . . . . . . . . . . . . . . $ 79,460 $ (10,371) $ 44,832 $ 89,831 >100% $ (55,203) >(100)%
Adjusted EBITDA* . . . . . . . . . . . $ 306,029 $ 298,042 $ 249,474 $ 7,987 3% $ 48,568 19%
Capital expenditures . . . . . . . . . . $ 219,065 $ 208,063 $ 164,858 $ 11,002 5% $ 43,205 26%
* Represents a non-GAAP financial measure. Refer to Supplemental Information within this MD&A for a reconciliation of this measure.
Operating Revenues(Dollars in millions)
$0
$200
$400
$600
$800
$1,000
$1,200
$1,400
2013 2014 2015
HMS
Cable
Wireline
Key components of changes in the statement of operations items were as follows:
2015-2014 Commentary
Total operating revenues
Operating revenues increased in 2015 due to $55.5 million from Cable acquisitions, offset by declines in Wirelinecommercial and wholesale revenues of $19.3 million. HMS equipment sales increased $21.0 million.
20
MANAGEMENT’S DISCUSSION AND ANALYSIS OF FINANCIAL CONDITION AND RESULTS OF OPERATIONS

Total operating expenses
Operating expenses decreased in 2015 due to the impact of an $84.0 million non-cash goodwill impairment loss in 2014offset by a $43.8 million increase from Cable acquisitions. HMS equipment cost of goods sold increased $16.6 million.
2014-2013 Commentary
Total operating revenues
Operating revenues increased in 2014 due primarily to $164.5 million from Cable and HMS acquisitions.
Total operating expenses
Operating expenses increased in 2014 due primarily to $160.6 million from Cable and HMS acquisitions and an$84.0 million non-cash goodwill impairment loss, which was partially offset by a $43.6 million decrease in Wirelineexpenses.
An $84.0 million loss on impairment of goodwill was recognized in the HMS segment during the quarter endedSeptember 30, 2014. See Note 7 — Intangible Assets in the Notes to Consolidated Financial Statements for moreinformation related to this impairment.
21
MANAGEMENT’S DISCUSSION AND ANALYSIS OF FINANCIAL CONDITION AND RESULTS OF OPERATIONS
12MAR201602143799
12MAR201601532774 12MAR201601533250
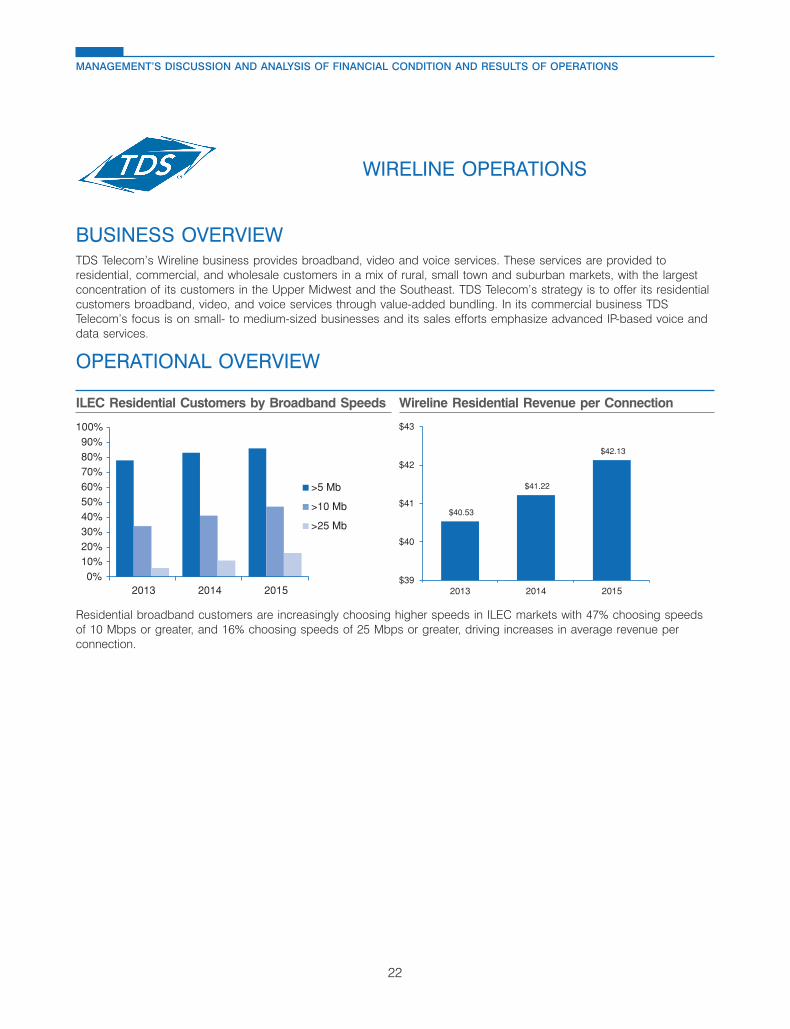
BUSINESS OVERVIEWTDS Telecom’s Wireline business provides broadband, video and voice services. These services are provided toresidential, commercial, and wholesale customers in a mix of rural, small town and suburban markets, with the largestconcentration of its customers in the Upper Midwest and the Southeast. TDS Telecom’s strategy is to offer its residentialcustomers broadband, video, and voice services through value-added bundling. In its commercial business TDSTelecom’s focus is on small- to medium-sized businesses and its sales efforts emphasize advanced IP-based voice anddata services.
OPERATIONAL OVERVIEW
0%10%20%30%40%50%60%70%80%90%
100%
2013 2014 2015
>5 Mb
>10 Mb
>25 Mb$40.53
$41.22
$42.13
$39
$40
$41
$42
$43
2013 2014 2015
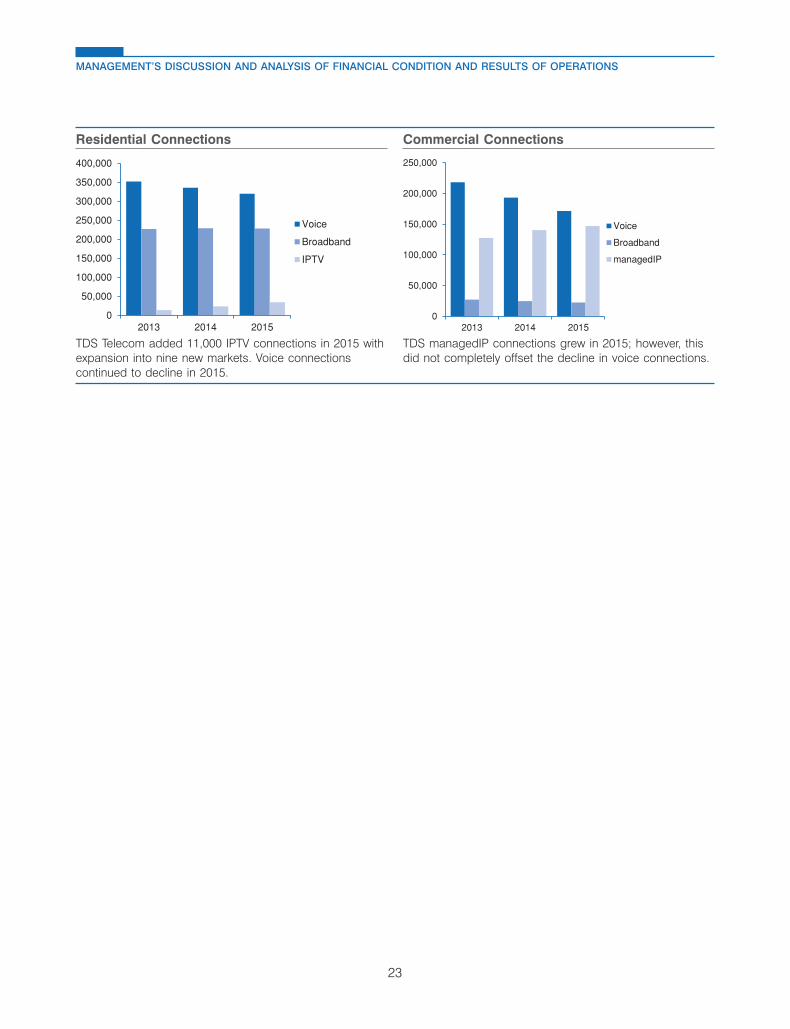
Residential broadband customers are increasingly choosing higher speeds in ILEC markets with 47% choosing speedsof 10 Mbps or greater, and 16% choosing speeds of 25 Mbps or greater, driving increases in average revenue perconnection.
22
MANAGEMENT’S DISCUSSION AND ANALYSIS OF FINANCIAL CONDITION AND RESULTS OF OPERATIONS
WIRELINE OPERATIONS
ILEC Residential Customers by Broadband Speeds Wireline Residential Revenue per Connection
12MAR201601532646 12MAR2016015322380
50,000
100,000
150,000
200,000
250,000
300,000
350,000
400,000
2013 2014 2015
Voice
Broadband
IPTV
0
50,000
100,000
150,000
200,000
250,000
2013 2014 2015
Voice
Broadband
managedIP
TDS Telecom added 11,000 IPTV connections in 2015 with TDS managedIP connections grew in 2015; however, thisexpansion into nine new markets. Voice connections did not completely offset the decline in voice connections.continued to decline in 2015.
23
MANAGEMENT’S DISCUSSION AND ANALYSIS OF FINANCIAL CONDITION AND RESULTS OF OPERATIONS
Residential Connections Commercial Connections

FINANCIAL OVERVIEW — WIRELINEComponents of Operating Income (Loss)
Year Ended December 31, 2015 2014 2013 2015 vs. 2014 2014 vs. 2013
(Dollars in thousands)Service revenues
Residential . . . . . . . . . . . . . . . $ 296,943 $ 293,304 $ 293,217 $ 3,639 1% $ 87 –Commercial . . . . . . . . . . . . . . 220,643 229,306 229,715 (8,663) (4)% (409) –Wholesale . . . . . . . . . . . . . . . 181,352 191,976 200,440 (10,624) (6)% (8,464) (4)%
Total service revenues . . . . . . 698,938 714,586 723,372 (15,648) (2)% (8,786) (1)%Equipment and product sales . . . . 1,965 1,836 3,195 129 7% (1,359) (43)%
Total operating revenues . . . 700,903 716,422 726,567 (15,519) (2)% (10,145) (1)%Cost of services (excluding
depreciation, amortization andaccretion reported below) . . . . . 254,879 256,878 266,635 (1,999) (1)% (9,757) (4)%
Cost of equipment and products . . 2,212 2,336 3,831 (124) (5)% (1,495) (39)%Selling, general and administrative . 193,850 189,956 220,097 3,894 2% (30,141) (14)%
450,941 449,170 490,563 1,771 – (41,393) (8)%Operating cash flow* . . . . . . . . . . 249,962 267,252 236,004 (17,290) (6)% 31,248 13%Depreciation, amortization and
accretion . . . . . . . . . . . . . . . . 165,841 169,044 170,868 (3,203) (2)% (1,824) (1)%(Gain) loss on asset disposals, net . 5,094 2,091 130 3,003 >100% 1,961 >100%(Gain) loss on sale of business and
other exit costs, net . . . . . . . . . (9,530) (2,357) – (7,173) >(100)% (2,357) N/M
Total operating expenses . . . 612,346 617,948 661,561 (5,602) (1)% (43,613) (7)%
Total operating income . . . . . . . . . $ 88,557 $ 98,474 $ 65,006 $ (9,917) (10)% $ 33,468 51%
Adjusted EBITDA* . . . . . . . . . . . $ 252,150 $ 269,624 $ 237,568 $ (17,474) (6)% $ 32,056 13%
Capital expenditures . . . . . . . . . . $ 140,433 $ 135,805 $ 140,009 $ 4,628 3% $ (4,204) (3)%
N/M – Not meaningful
* Represents a non-GAAP financial measure. Refer to Supplemental Information within this MD&A for a reconciliation of this measure.
24
MANAGEMENT’S DISCUSSION AND ANALYSIS OF FINANCIAL CONDITION AND RESULTS OF OPERATIONS
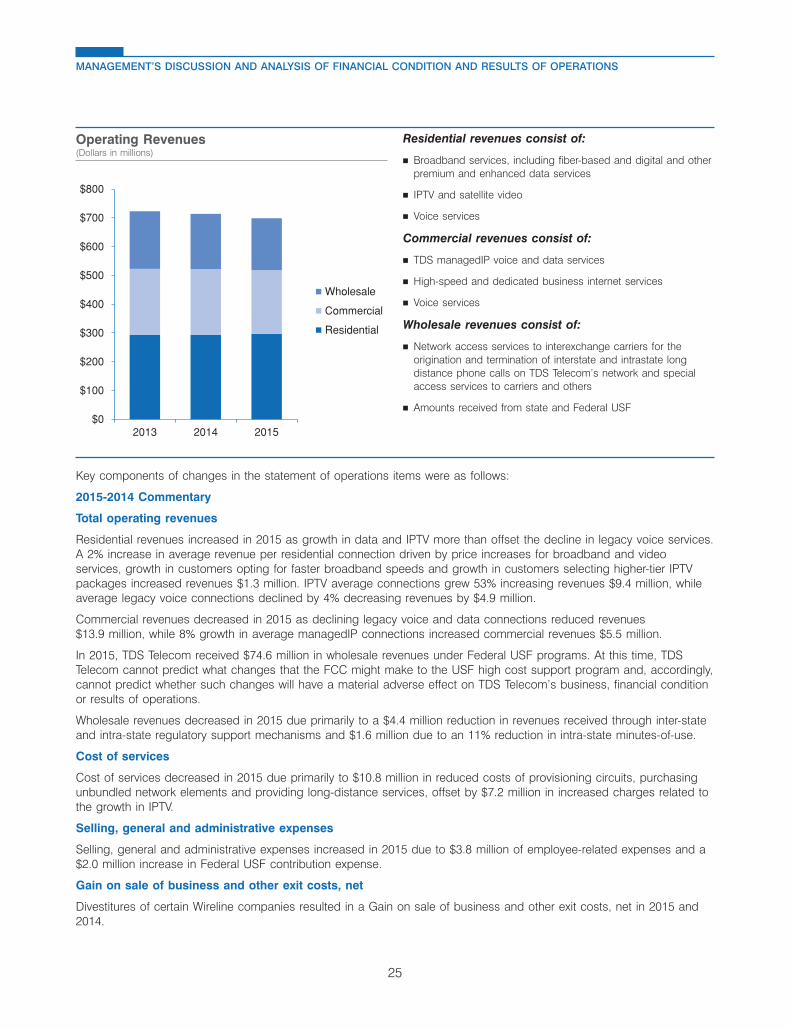
13MAR201603060553
Residential revenues consist of:
� Broadband services, including fiber-based and digital and otherpremium and enhanced data services
� IPTV and satellite video
� Voice services
Commercial revenues consist of:
� TDS managedIP voice and data services
� High-speed and dedicated business internet services
� Voice services
Wholesale revenues consist of:
� Network access services to interexchange carriers for theorigination and termination of interstate and intrastate longdistance phone calls on TDS Telecom’s network and specialaccess services to carriers and others
� Amounts received from state and Federal USF$0
$100
$200
$300
$400
$500
$600
$700
$800
2013 2014 2015
Wholesale
Commercial
Residential
Key components of changes in the statement of operations items were as follows:
2015-2014 Commentary
Total operating revenues
Residential revenues increased in 2015 as growth in data and IPTV more than offset the decline in legacy voice services.A 2% increase in average revenue per residential connection driven by price increases for broadband and videoservices, growth in customers opting for faster broadband speeds and growth in customers selecting higher-tier IPTVpackages increased revenues $1.3 million. IPTV average connections grew 53% increasing revenues $9.4 million, whileaverage legacy voice connections declined by 4% decreasing revenues by $4.9 million.
Commercial revenues decreased in 2015 as declining legacy voice and data connections reduced revenues$13.9 million, while 8% growth in average managedIP connections increased commercial revenues $5.5 million.
In 2015, TDS Telecom received $74.6 million in wholesale revenues under Federal USF programs. At this time, TDSTelecom cannot predict what changes that the FCC might make to the USF high cost support program and, accordingly,cannot predict whether such changes will have a material adverse effect on TDS Telecom’s business, financial conditionor results of operations.
Wholesale revenues decreased in 2015 due primarily to a $4.4 million reduction in revenues received through inter-stateand intra-state regulatory support mechanisms and $1.6 million due to an 11% reduction in intra-state minutes-of-use.
Cost of services
Cost of services decreased in 2015 due primarily to $10.8 million in reduced costs of provisioning circuits, purchasingunbundled network elements and providing long-distance services, offset by $7.2 million in increased charges related tothe growth in IPTV.
Selling, general and administrative expenses
Selling, general and administrative expenses increased in 2015 due to $3.8 million of employee-related expenses and a$2.0 million increase in Federal USF contribution expense.
Gain on sale of business and other exit costs, net
Divestitures of certain Wireline companies resulted in a Gain on sale of business and other exit costs, net in 2015 and2014.
25
MANAGEMENT’S DISCUSSION AND ANALYSIS OF FINANCIAL CONDITION AND RESULTS OF OPERATIONS
Operating Revenues(Dollars in millions)
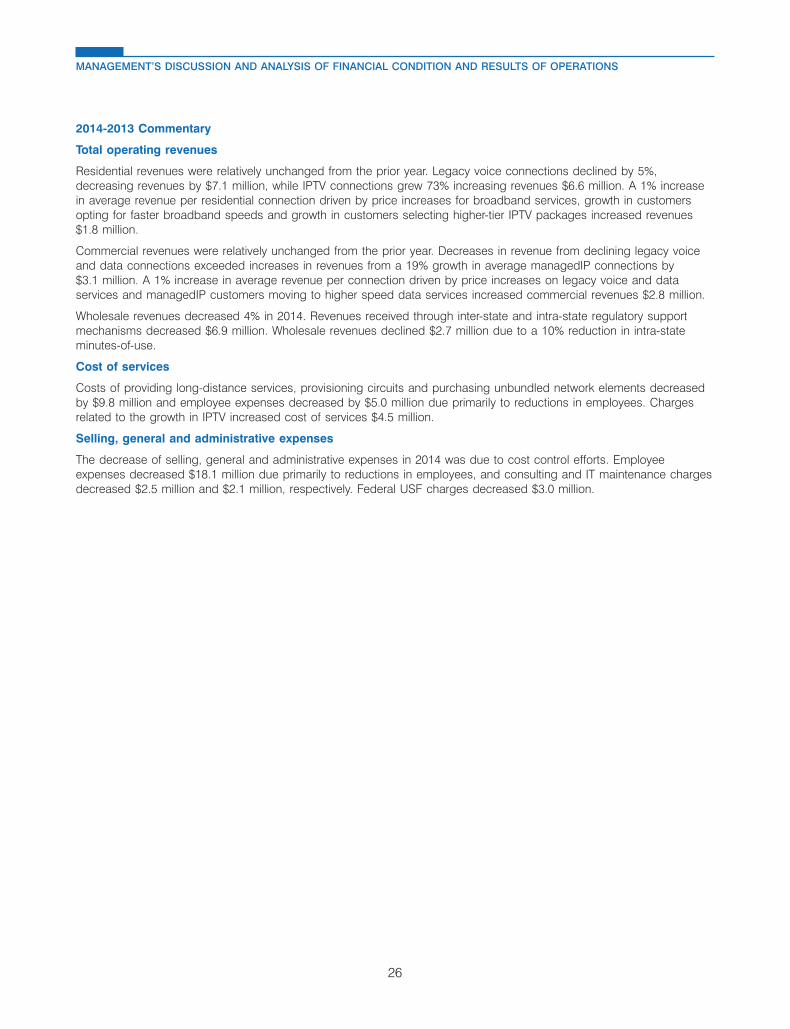
2014-2013 Commentary
Total operating revenues
Residential revenues were relatively unchanged from the prior year. Legacy voice connections declined by 5%,decreasing revenues by $7.1 million, while IPTV connections grew 73% increasing revenues $6.6 million. A 1% increasein average revenue per residential connection driven by price increases for broadband services, growth in customersopting for faster broadband speeds and growth in customers selecting higher-tier IPTV packages increased revenues$1.8 million.
Commercial revenues were relatively unchanged from the prior year. Decreases in revenue from declining legacy voiceand data connections exceeded increases in revenues from a 19% growth in average managedIP connections by$3.1 million. A 1% increase in average revenue per connection driven by price increases on legacy voice and dataservices and managedIP customers moving to higher speed data services increased commercial revenues $2.8 million.
Wholesale revenues decreased 4% in 2014. Revenues received through inter-state and intra-state regulatory supportmechanisms decreased $6.9 million. Wholesale revenues declined $2.7 million due to a 10% reduction in intra-stateminutes-of-use.
Cost of services
Costs of providing long-distance services, provisioning circuits and purchasing unbundled network elements decreasedby $9.8 million and employee expenses decreased by $5.0 million due primarily to reductions in employees. Chargesrelated to the growth in IPTV increased cost of services $4.5 million.
Selling, general and administrative expenses
The decrease of selling, general and administrative expenses in 2014 was due to cost control efforts. Employeeexpenses decreased $18.1 million due primarily to reductions in employees, and consulting and IT maintenance chargesdecreased $2.5 million and $2.1 million, respectively. Federal USF charges decreased $3.0 million.
26
MANAGEMENT’S DISCUSSION AND ANALYSIS OF FINANCIAL CONDITION AND RESULTS OF OPERATIONS
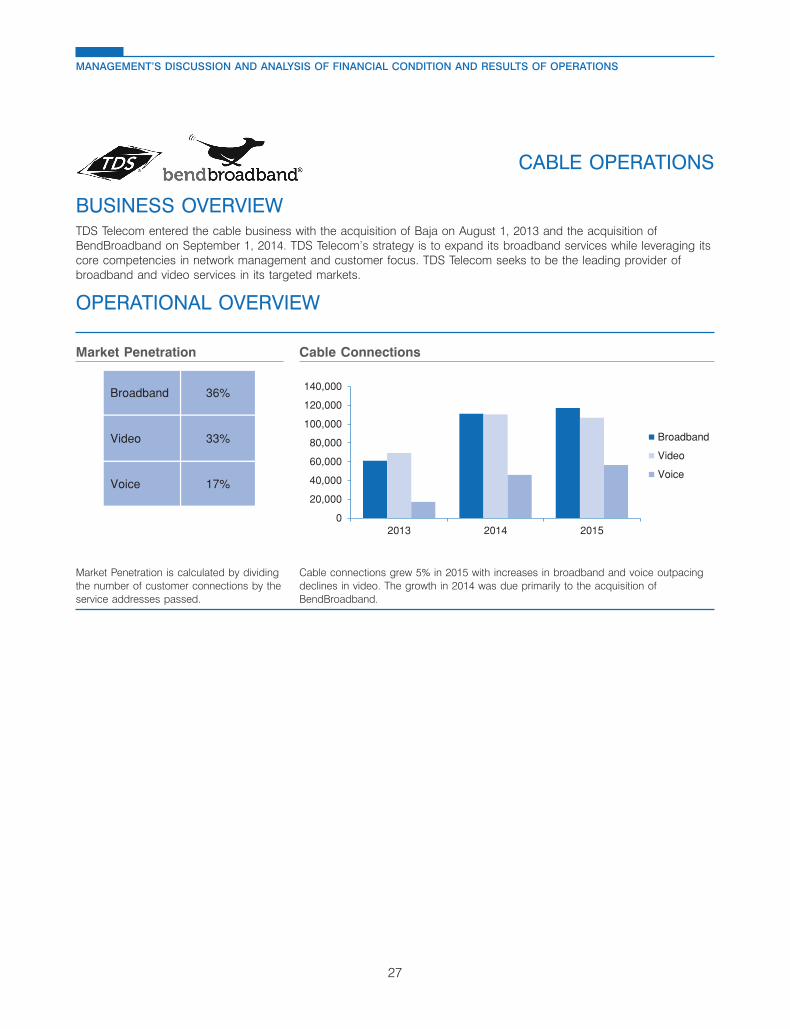
31MAR201601464080
11MAR201618514268
11MAR201618514135
BUSINESS OVERVIEWTDS Telecom entered the cable business with the acquisition of Baja on August 1, 2013 and the acquisition ofBendBroadband on September 1, 2014. TDS Telecom’s strategy is to expand its broadband services while leveraging itscore competencies in network management and customer focus. TDS Telecom seeks to be the leading provider ofbroadband and video services in its targeted markets.
OPERATIONAL OVERVIEW
Broadband 36%
Video 33%
Voice 17%
0
20,000
40,000
60,000
80,000
100,000
120,000
140,000
2013 2014 2015
Broadband
Video
Voice
Market Penetration is calculated by dividing Cable connections grew 5% in 2015 with increases in broadband and voice outpacingthe number of customer connections by the declines in video. The growth in 2014 was due primarily to the acquisition ofservice addresses passed. BendBroadband.
27
MANAGEMENT’S DISCUSSION AND ANALYSIS OF FINANCIAL CONDITION AND RESULTS OF OPERATIONS
CABLE OPERATIONS
Market Penetration Cable Connections
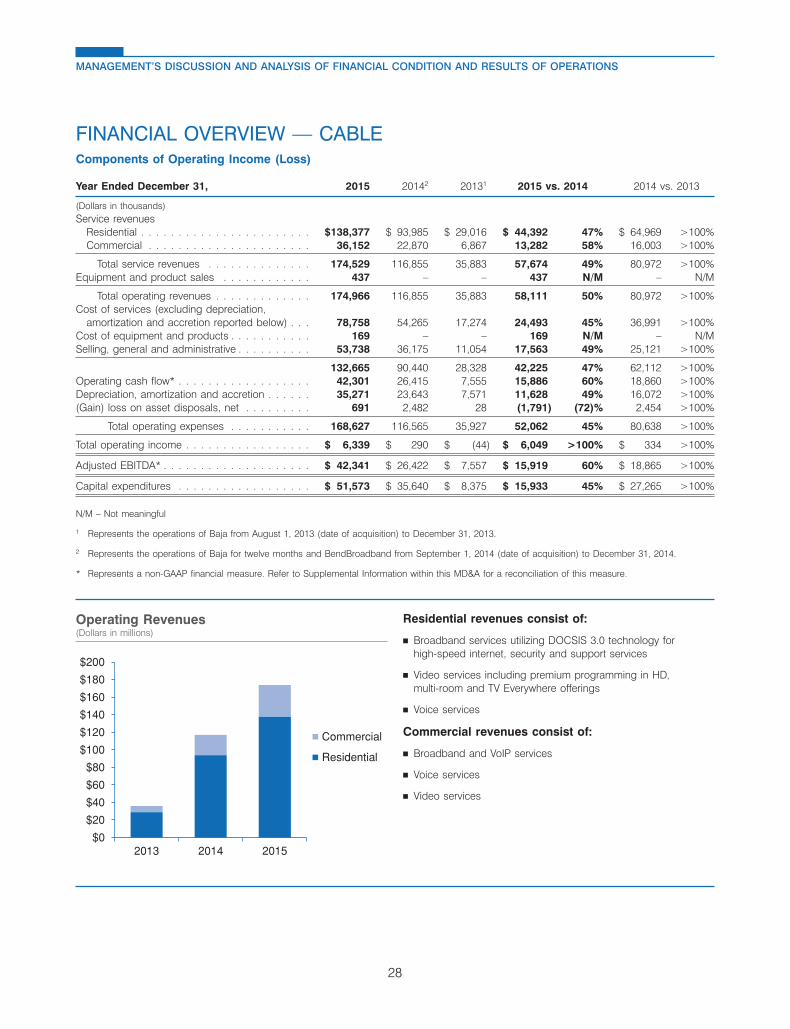
11MAR201618514574
FINANCIAL OVERVIEW — CABLEComponents of Operating Income (Loss)
Year Ended December 31, 2015 20142 20131 2015 vs. 2014 2014 vs. 2013
(Dollars in thousands)Service revenues
Residential . . . . . . . . . . . . . . . . . . . . . . . $138,377 $ 93,985 $ 29,016 $ 44,392 47% $ 64,969 >100%Commercial . . . . . . . . . . . . . . . . . . . . . . 36,152 22,870 6,867 13,282 58% 16,003 >100%
Total service revenues . . . . . . . . . . . . . . 174,529 116,855 35,883 57,674 49% 80,972 >100%Equipment and product sales . . . . . . . . . . . . 437 – – 437 N/M – N/M
Total operating revenues . . . . . . . . . . . . . 174,966 116,855 35,883 58,111 50% 80,972 >100%Cost of services (excluding depreciation,
amortization and accretion reported below) . . . 78,758 54,265 17,274 24,493 45% 36,991 >100%Cost of equipment and products . . . . . . . . . . . 169 – – 169 N/M – N/MSelling, general and administrative . . . . . . . . . . 53,738 36,175 11,054 17,563 49% 25,121 >100%
132,665 90,440 28,328 42,225 47% 62,112 >100%Operating cash flow* . . . . . . . . . . . . . . . . . . 42,301 26,415 7,555 15,886 60% 18,860 >100%Depreciation, amortization and accretion . . . . . . 35,271 23,643 7,571 11,628 49% 16,072 >100%(Gain) loss on asset disposals, net . . . . . . . . . 691 2,482 28 (1,791) (72)% 2,454 >100%
Total operating expenses . . . . . . . . . . . 168,627 116,565 35,927 52,062 45% 80,638 >100%
Total operating income . . . . . . . . . . . . . . . . . $ 6,339 $ 290 $ (44) $ 6,049 >100% $ 334 >100%
Adjusted EBITDA* . . . . . . . . . . . . . . . . . . . . $ 42,341 $ 26,422 $ 7,557 $ 15,919 60% $ 18,865 >100%
Capital expenditures . . . . . . . . . . . . . . . . . . $ 51,573 $ 35,640 $ 8,375 $ 15,933 45% $ 27,265 >100%
N/M – Not meaningful
1 Represents the operations of Baja from August 1, 2013 (date of acquisition) to December 31, 2013.
2 Represents the operations of Baja for twelve months and BendBroadband from September 1, 2014 (date of acquisition) to December 31, 2014.
* Represents a non-GAAP financial measure. Refer to Supplemental Information within this MD&A for a reconciliation of this measure.
Residential revenues consist of:
� Broadband services utilizing DOCSIS 3.0 technology forhigh-speed internet, security and support services
� Video services including premium programming in HD,multi-room and TV Everywhere offerings
� Voice services
Commercial revenues consist of:
� Broadband and VoIP services
� Voice services
� Video services
$0
$20
$40
$60
$80
$100
$120
$140
$160
$180
$200
2013 2014 2015
Commercial
Residential
28
MANAGEMENT’S DISCUSSION AND ANALYSIS OF FINANCIAL CONDITION AND RESULTS OF OPERATIONS
Operating Revenues(Dollars in millions)

Key components of changes in the statement of operations items were as follows:
2015-2014 Commentary
Changes in operating revenues and operating expenses in 2015 are due primarily to acquisitions. Acquisitionscontributed $55.5 million to operating revenues. Cable revenues grew 2% excluding acquisitions due primarily to anincrease in broadband and voice connections. Acquisitions contributed $43.8 million to operating expenses. Theremaining increase is due to higher advertising, plant maintenance and programming content costs.
2014-2013 Commentary
Changes in operating revenues and operating expenses in 2014 are due primarily to acquisitions. Acquisitionscontributed $79.4 million to operating revenues. Cable revenues grew 5% excluding acquisitions. Acquisitions contributed$75.5 million to operating expenses. The remaining increase is due to higher programming content costs.
29
MANAGEMENT’S DISCUSSION AND ANALYSIS OF FINANCIAL CONDITION AND RESULTS OF OPERATIONS
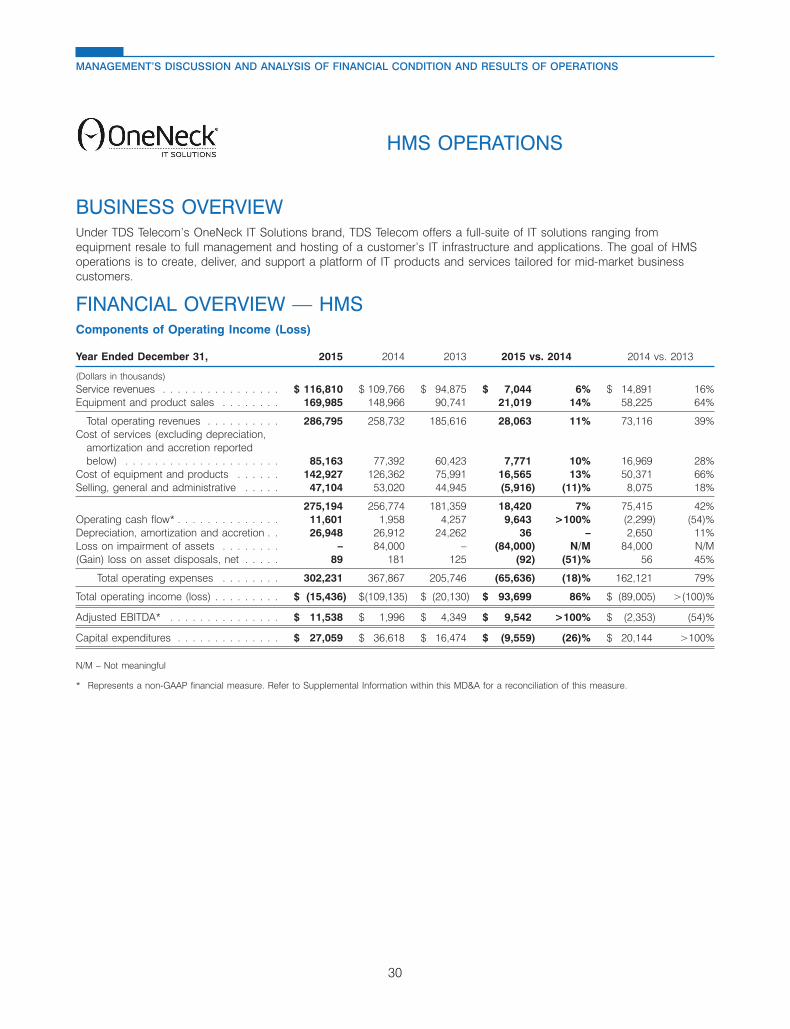
12MAR201610541045
BUSINESS OVERVIEWUnder TDS Telecom’s OneNeck IT Solutions brand, TDS Telecom offers a full-suite of IT solutions ranging fromequipment resale to full management and hosting of a customer’s IT infrastructure and applications. The goal of HMSoperations is to create, deliver, and support a platform of IT products and services tailored for mid-market businesscustomers.
FINANCIAL OVERVIEW — HMSComponents of Operating Income (Loss)
Year Ended December 31, 2015 2014 2013 2015 vs. 2014 2014 vs. 2013
(Dollars in thousands)Service revenues . . . . . . . . . . . . . . . . $ 116,810 $ 109,766 $ 94,875 $ 7,044 6% $ 14,891 16%Equipment and product sales . . . . . . . . 169,985 148,966 90,741 21,019 14% 58,225 64%
Total operating revenues . . . . . . . . . . 286,795 258,732 185,616 28,063 11% 73,116 39%Cost of services (excluding depreciation,
amortization and accretion reportedbelow) . . . . . . . . . . . . . . . . . . . . . 85,163 77,392 60,423 7,771 10% 16,969 28%
Cost of equipment and products . . . . . . 142,927 126,362 75,991 16,565 13% 50,371 66%Selling, general and administrative . . . . . 47,104 53,020 44,945 (5,916) (11)% 8,075 18%
275,194 256,774 181,359 18,420 7% 75,415 42%Operating cash flow* . . . . . . . . . . . . . . 11,601 1,958 4,257 9,643 >100% (2,299) (54)%Depreciation, amortization and accretion . . 26,948 26,912 24,262 36 – 2,650 11%Loss on impairment of assets . . . . . . . . – 84,000 – (84,000) N/M 84,000 N/M(Gain) loss on asset disposals, net . . . . . 89 181 125 (92) (51)% 56 45%
Total operating expenses . . . . . . . . 302,231 367,867 205,746 (65,636) (18)% 162,121 79%
Total operating income (loss) . . . . . . . . . $ (15,436) $(109,135) $ (20,130) $ 93,699 86% $ (89,005) >(100)%
Adjusted EBITDA* . . . . . . . . . . . . . . . $ 11,538 $ 1,996 $ 4,349 $ 9,542 >100% $ (2,353) (54)%
Capital expenditures . . . . . . . . . . . . . . $ 27,059 $ 36,618 $ 16,474 $ (9,559) (26)% $ 20,144 >100%
N/M – Not meaningful
* Represents a non-GAAP financial measure. Refer to Supplemental Information within this MD&A for a reconciliation of this measure.
30
MANAGEMENT’S DISCUSSION AND ANALYSIS OF FINANCIAL CONDITION AND RESULTS OF OPERATIONS
HMS OPERATIONS

12MAR201601532511
Service revenues consist of:
� Cloud and hosting solutions
� Managed services
� Enterprise Resource Planning (‘‘ERP’’) applicationmanagement
� Professional services
� Co-location services
� IT hardware maintenance services
Equipment revenues consist of:
� IT hardware sales
$0
$50
$100
$150
$200
$250
$300
$350
2013 2014 2015
Equipment
Service
Key components of changes in the statement of operations items were as follows:
2015-2014 Commentary
Growth in recurring services and increases in professional services and maintenance resulted in an increase in Servicerevenues in 2015. Equipment and product sales revenues from sales of IT infrastructure hardware solutions increased in2015 due primarily to higher spending by existing customers. There was a corresponding increase in Cost of equipmentand products and Cost of services needed to support revenue growth. Selling, general and administrative expensesdecreased due to efficiency improvements.
2014-2013 Commentary
Increases in operating revenues and operating expenses in 2014 are due primarily to acquisitions. Acquisitionscontributed $85.1 million to operating revenues. Increases in Equipment and product sales revenues were partially offsetby $15.4 million in lower spending by existing customers. Acquisitions contributed $85.1 million to operating expenses.Increases in Cost of equipment and products were partially offset by $12.2 million reduced spending on equipment byexisting customers.
As a result of interim testing performed during the third quarter of 2014, TDS determined the carrying value of the HMSgoodwill exceeded the implied fair value of HMS goodwill. As a result, an $84.0 million impairment loss was recognized.
31
MANAGEMENT’S DISCUSSION AND ANALYSIS OF FINANCIAL CONDITION AND RESULTS OF OPERATIONS
Operating Revenues(Dollars in millions)
LIQUIDITY AND CAPITAL RESOURCESSources of Liquidity
TDS believes that existing cash and investment balances, funds available under its revolving credit facilities, andexpected cash flows from operating and investing activities provide liquidity for TDS to meet its normal day-to-dayoperating needs and debt service requirements for the coming year.
TDS and its subsidiaries operate capital-intensive businesses. TDS has used internally-generated funds and also hasobtained substantial funds from external sources for general corporate purposes. In the past, TDS’ existing cash andinvestment balances, funds available under its revolving credit facilities, funds from other financing sources, including aterm loan and other long-term debt, and cash flows from operating, investing and financing activities, including sales ofassets or businesses, provided sufficient liquidity and financial flexibility for TDS to meet its normal day-to-day operatingneeds and debt service requirements, to finance the build-out and enhancement of markets and to fund acquisitions.There is no assurance that this will be the case in the future. It may be necessary from time to time to increase the sizeof the existing revolving credit facilities, to put in place new credit facilities, or to obtain other forms of financing in orderto fund potential expenditures. TDS’ liquidity would be adversely affected if, among other things, TDS is unable to obtainshort or long-term financing on acceptable terms, TDS makes spectrum license purchases in FCC auctions or fromother parties, the LA Partnership does not resume or reduces distributions compared to prior historical levels and/or ETCand/or other regulatory support payments continue to decline. In addition, although sales of assets or businesses byTDS have been an important source of liquidity for TDS in recent periods, TDS does not expect a similar level of suchsales in the future, which will reduce a source of liquidity for TDS. In recent years, TDS’ credit rating has declined tosub-investment grade.
In certain recent periods, TDS has incurred negative free cash flow (defined as Cash flows from operating activities lessCash used for additions to property, plant and equipment) and this will continue in the future if operating results do notimprove. TDS currently expects to have negative free cash flow in 2016. TDS may require substantial additional capitalfor, among other uses, funding day-to-day operating needs, working capital, acquisitions of providers of wireless orwireline telecommunications services, cable markets, IT services or other businesses, spectrum license or systemacquisitions, system development and network capacity expansion, debt service requirements, the repurchase of shares,the payment of dividends, or making additional investments. There can be no assurance that sufficient funds willcontinue to be available to TDS or its subsidiaries on terms or at prices acceptable to TDS. Insufficient cash flows fromoperating activities, changes in its credit ratings, defaults of the terms of debt or credit agreements, uncertainty ofaccess to capital, deterioration in the capital markets, reduced regulatory capital at banks which in turn limits their abilityto borrow and lend, other changes in the performance of TDS or in market conditions or other factors could limit orrestrict the availability of financing on terms and prices acceptable to TDS, which could require TDS to reduce itsacquisition, capital expenditure and business development programs, reduce the acquisition of spectrum licenses,and/or reduce or cease share repurchases and/or the payment of dividends. TDS cannot provide assurances thatcircumstances that could have a material adverse effect on its liquidity or capital resources will not occur. Any of theforegoing would have an adverse impact on TDS’ businesses, financial condition or results of operations.
Cash and Cash Equivalents
Cash and cash equivalents include cash and money market investments. The primary objective of TDS’ Cash and cashequivalents investment activities is to preserve principal. Cash held by U.S. Cellular is for its operational needs andacquisition, capital expenditure and business development programs. TDS does not have direct access to U.S. Cellularcash unless U.S. Cellular pays a dividend on its common stock. U.S. Cellular has no current intention to pay a dividendto its shareholders.
32
MANAGEMENT’S DISCUSSION AND ANALYSIS OF FINANCIAL CONDITION AND RESULTS OF OPERATIONS
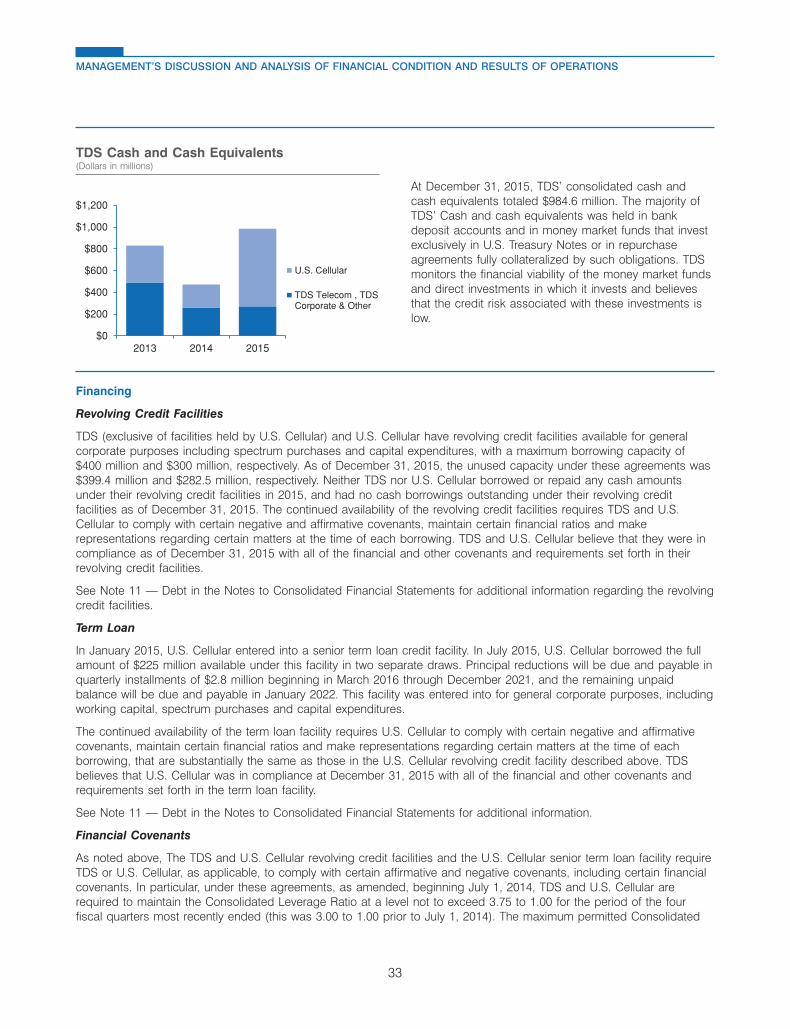
12MAR201601533026
At December 31, 2015, TDS’ consolidated cash andcash equivalents totaled $984.6 million. The majority ofTDS’ Cash and cash equivalents was held in bankdeposit accounts and in money market funds that investexclusively in U.S. Treasury Notes or in repurchaseagreements fully collateralized by such obligations. TDSmonitors the financial viability of the money market fundsand direct investments in which it invests and believesthat the credit risk associated with these investments islow.
$0
$200
$400
$600
$800
$1,000
$1,200
2013 2014 2015
U.S. Cellular
TDS Telecom , TDSCorporate & Other
Financing
Revolving Credit Facilities
TDS (exclusive of facilities held by U.S. Cellular) and U.S. Cellular have revolving credit facilities available for generalcorporate purposes including spectrum purchases and capital expenditures, with a maximum borrowing capacity of$400 million and $300 million, respectively. As of December 31, 2015, the unused capacity under these agreements was$399.4 million and $282.5 million, respectively. Neither TDS nor U.S. Cellular borrowed or repaid any cash amountsunder their revolving credit facilities in 2015, and had no cash borrowings outstanding under their revolving creditfacilities as of December 31, 2015. The continued availability of the revolving credit facilities requires TDS and U.S.Cellular to comply with certain negative and affirmative covenants, maintain certain financial ratios and makerepresentations regarding certain matters at the time of each borrowing. TDS and U.S. Cellular believe that they were incompliance as of December 31, 2015 with all of the financial and other covenants and requirements set forth in theirrevolving credit facilities.
See Note 11 — Debt in the Notes to Consolidated Financial Statements for additional information regarding the revolvingcredit facilities.
Term Loan
In January 2015, U.S. Cellular entered into a senior term loan credit facility. In July 2015, U.S. Cellular borrowed the fullamount of $225 million available under this facility in two separate draws. Principal reductions will be due and payable inquarterly installments of $2.8 million beginning in March 2016 through December 2021, and the remaining unpaidbalance will be due and payable in January 2022. This facility was entered into for general corporate purposes, includingworking capital, spectrum purchases and capital expenditures.
The continued availability of the term loan facility requires U.S. Cellular to comply with certain negative and affirmativecovenants, maintain certain financial ratios and make representations regarding certain matters at the time of eachborrowing, that are substantially the same as those in the U.S. Cellular revolving credit facility described above. TDSbelieves that U.S. Cellular was in compliance at December 31, 2015 with all of the financial and other covenants andrequirements set forth in the term loan facility.
See Note 11 — Debt in the Notes to Consolidated Financial Statements for additional information.
Financial Covenants
As noted above, The TDS and U.S. Cellular revolving credit facilities and the U.S. Cellular senior term loan facility requireTDS or U.S. Cellular, as applicable, to comply with certain affirmative and negative covenants, including certain financialcovenants. In particular, under these agreements, as amended, beginning July 1, 2014, TDS and U.S. Cellular arerequired to maintain the Consolidated Leverage Ratio at a level not to exceed 3.75 to 1.00 for the period of the fourfiscal quarters most recently ended (this was 3.00 to 1.00 prior to July 1, 2014). The maximum permitted Consolidated
33
MANAGEMENT’S DISCUSSION AND ANALYSIS OF FINANCIAL CONDITION AND RESULTS OF OPERATIONS
TDS Cash and Cash Equivalents(Dollars in millions)

Leverage Ratio decreases beginning January 1, 2016 from 3.75 to 3.50, with further decreases effective July 1, 2016 andJanuary 1, 2017 (and will return to 3.00 to 1.00 at that time). TDS and U.S. Cellular believe they were in compliance atDecember 31, 2015 with all such covenants. However, depending on TDS and U.S. Cellular’s future financialperformance, there is a risk that TDS and/or U.S. Cellular could fail to satisfy the financial covenants in the future. If TDSor U.S. Cellular breach a financial or other covenant of any of these agreements, it would result in a default under thatagreement, and could involve a cross-default under other debt instruments. This could in turn cause the affected lendersto accelerate the repayment of principal and accrued interest on any outstanding debt under such agreements and, ifthey choose, terminate the facility. If appropriate, TDS and U.S. Cellular may request the applicable lender for anamendment of financial covenants in the TDS and U.S. Cellular revolving credit facility and the U.S. Cellular term loanfacility, in order to provide additional financial flexibility to TDS and U.S. Cellular, and may also seek other changes tosuch facilities. There is no assurance that the lenders will agree to any amendments. If the lenders agree toamendments, this may result in additional payments or higher interest rates payable to the lenders and/or additionalrestrictions. Restrictions in such debt instruments may limit TDS’ operating and financial flexibility.
Other Long-Term Financing
TDS and U.S. Cellular each have an effective shelf registration statement on Form S-3 to issue senior or subordinateddebt securities. The proceeds from any such issuances may be used for general corporate purposes including: thepossible reduction of other short-term or long-term debt, spectrum purchases, and capital expenditures; in connectionwith acquisition, construction and development programs; for working capital; to provide additional investments insubsidiaries; or the repurchase of shares. The TDS shelf registration permits TDS to issue at any time and from time totime senior or subordinated debt securities in one or more offerings in an indeterminate amount. The U.S. Cellular shelfregistration statement permits U.S. Cellular to issue at any time and from time to time senior or subordinated debtsecurities in one or more offerings, up to the amount registered. The ability of TDS or U.S. Cellular to complete anoffering pursuant to such shelf registration statements is subject to market conditions and other factors at the time.
In November 2015, U.S. Cellular issued $300 million of 7.25% Senior Notes due in 2064 for general corporate purposesincluding spectrum purchases, reducing the available amount on U.S. Cellular’s shelf registration statement from$500 million to $200 million. U.S. Cellular has the authority to replenish this shelf registration statement back to$500 million.
TDS believes that it and its subsidiaries were in compliance as of December 31, 2015 with all covenants and otherrequirements set forth in its long-term debt indentures. TDS and U.S. Cellular have not failed to make nor do they expectto fail to make any scheduled payment of principal or interest under such indentures.
The long-term debt principal payments due for the next five years represent less than 3% of the total gross long-termdebt obligation at December 31, 2015. Refer to Market Risk — Long-Term Debt for additional information regardingrequired principal payments and the weighted average interest rates related to TDS’ Long-term debt.
TDS and U.S. Cellular, at their discretion, may from time to time seek to retire or purchase their outstanding debt throughcash purchases and/or exchanges for other securities, in open market purchases, privately negotiated transactions,tender offers, exchange offers or otherwise. Such repurchases or exchanges, if any, will depend on prevailing marketconditions, liquidity requirements, contractual restrictions and other factors. The amounts involved may be material.
See Note 11 — Debt in the Notes to Consolidated Financial Statements for additional information on long-termfinancing.
Credit Ratings
In certain circumstances, TDS’ and U.S. Cellular’s interest cost on their various facilities may be subject to increase iftheir current credit ratings from nationally recognized credit rating agencies are lowered, and may be subject todecrease if the ratings are raised. The facilities do not cease to be available nor do the maturity dates accelerate solelyas a result of a downgrade in TDS’ or U.S. Cellular’s credit rating. However, downgrades in TDS’ or U.S. Cellular’s creditrating could adversely affect their ability to renew the facilities or obtain access to other credit facilities in the future.
34
MANAGEMENT’S DISCUSSION AND ANALYSIS OF FINANCIAL CONDITION AND RESULTS OF OPERATIONS
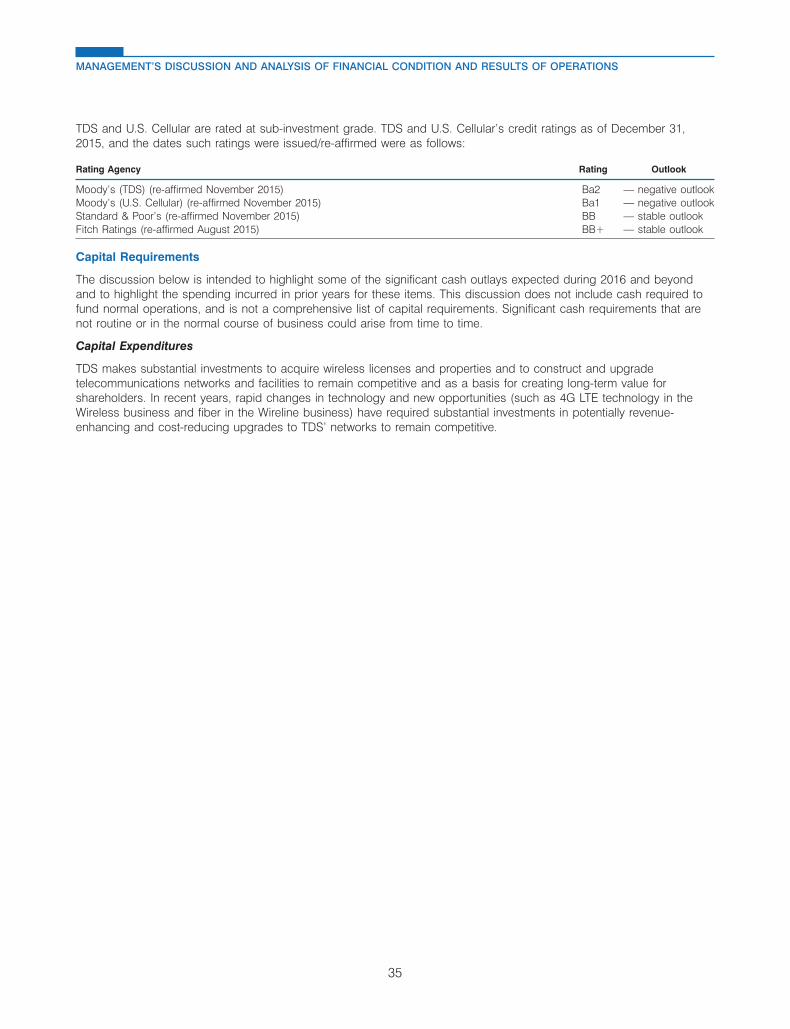
TDS and U.S. Cellular are rated at sub-investment grade. TDS and U.S. Cellular’s credit ratings as of December 31,2015, and the dates such ratings were issued/re-affirmed were as follows:
Rating Agency Rating Outlook
Moody’s (TDS) (re-affirmed November 2015) Ba2 — negative outlookMoody’s (U.S. Cellular) (re-affirmed November 2015) Ba1 — negative outlookStandard & Poor’s (re-affirmed November 2015) BB — stable outlookFitch Ratings (re-affirmed August 2015) BB+ — stable outlook
Capital Requirements
The discussion below is intended to highlight some of the significant cash outlays expected during 2016 and beyondand to highlight the spending incurred in prior years for these items. This discussion does not include cash required tofund normal operations, and is not a comprehensive list of capital requirements. Significant cash requirements that arenot routine or in the normal course of business could arise from time to time.
Capital Expenditures
TDS makes substantial investments to acquire wireless licenses and properties and to construct and upgradetelecommunications networks and facilities to remain competitive and as a basis for creating long-term value forshareholders. In recent years, rapid changes in technology and new opportunities (such as 4G LTE technology in theWireless business and fiber in the Wireline business) have required substantial investments in potentially revenue-enhancing and cost-reducing upgrades to TDS’ networks to remain competitive.
35
MANAGEMENT’S DISCUSSION AND ANALYSIS OF FINANCIAL CONDITION AND RESULTS OF OPERATIONS

31MAR201601273856
Capital expenditures (i.e., additions to property, plant and equipment and system development expenditures), whichinclude the effects of accruals and capitalized interest, in 2015, 2014 and 2013 were as follows:
In 2015, U.S. Cellular completed its deployment of 4GLTE technology in certain markets and TDS Telecomcontinued its fiber deployment and completed itsexpansion of certain HMS data center facilities.
U.S. Cellular’s capital expenditures for 2016 are expectedto be approximately $500 million. These expenditures areexpected to be for the following general purposes:
� Expand and enhance network coverage, includingconstruction of a new regional connectivity center andproviding additional capacity to accommodateincreased network usage, principally data usage, bycurrent customers;
� Deploy VoLTE technology in certain markets;
� Expand and enhance the retail store network; and
� Develop and enhance office systems.
TDS Telecom’s capital expenditures for 2016 areexpected to be approximately $180 million. Theseexpenditures are expected to be for the following generalpurposes:
� Maintain and enhance existing infrastructure atWireline, Cable and HMS;
� Complete planned fiber expansion in Wireline andCable markets to support IPTV and super high-speeddata; and
$0
$100
$200
$300
$400
$500
$600
$700
$800
$900
$1,000
2013 2014 2015
Corporateand Other
HMS
Cable
Wireline
U.S. Cellular
� Success-based spending to sustain managedIP, IPTV,Cable and HMS growth.
TDS plans to finance its capital expenditures program for 2016 using primarily Cash flows from operating activities,existing cash balances, borrowings under its revolving credit agreements and/or other long-term debt.
Acquisitions, Divestitures and Exchanges
TDS may be engaged from time to time in negotiations relating to the acquisition, divestiture or exchange of companies,properties, wireless spectrum and other possible businesses. In general, TDS may not disclose such transactions until
36
MANAGEMENT’S DISCUSSION AND ANALYSIS OF FINANCIAL CONDITION AND RESULTS OF OPERATIONS
Capital Expenditures(Dollars in millions)
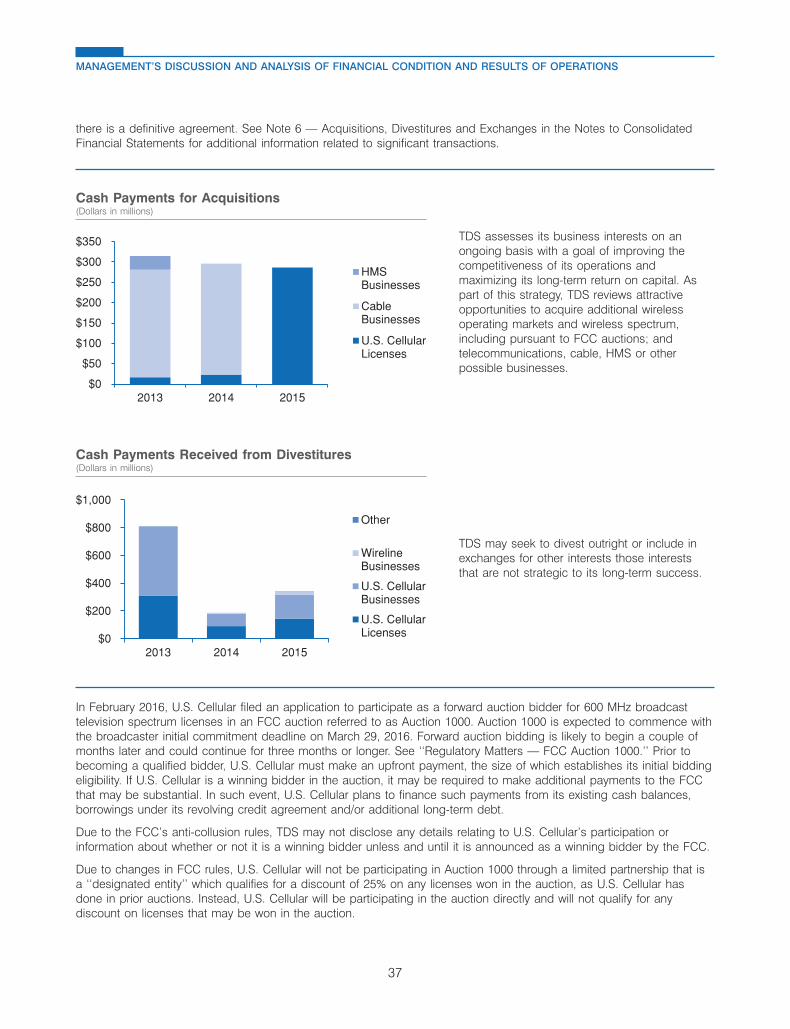
31MAR201601273985
31MAR201601274111
there is a definitive agreement. See Note 6 — Acquisitions, Divestitures and Exchanges in the Notes to ConsolidatedFinancial Statements for additional information related to significant transactions.
TDS assesses its business interests on anongoing basis with a goal of improving thecompetitiveness of its operations andmaximizing its long-term return on capital. Aspart of this strategy, TDS reviews attractiveopportunities to acquire additional wirelessoperating markets and wireless spectrum,including pursuant to FCC auctions; andtelecommunications, cable, HMS or otherpossible businesses.
$0
$50
$100
$150
$200
$250
$300
$350
2013 2014 2015
HMSBusinesses
CableBusinesses
U.S. CellularLicenses
TDS may seek to divest outright or include inexchanges for other interests those intereststhat are not strategic to its long-term success.
$0
$200
$400
$600
$800
$1,000
2013 2014 2015
Other
WirelineBusinesses
U.S. CellularBusinesses
U.S. CellularLicenses
In February 2016, U.S. Cellular filed an application to participate as a forward auction bidder for 600 MHz broadcasttelevision spectrum licenses in an FCC auction referred to as Auction 1000. Auction 1000 is expected to commence withthe broadcaster initial commitment deadline on March 29, 2016. Forward auction bidding is likely to begin a couple ofmonths later and could continue for three months or longer. See ‘‘Regulatory Matters — FCC Auction 1000.’’ Prior tobecoming a qualified bidder, U.S. Cellular must make an upfront payment, the size of which establishes its initial biddingeligibility. If U.S. Cellular is a winning bidder in the auction, it may be required to make additional payments to the FCCthat may be substantial. In such event, U.S. Cellular plans to finance such payments from its existing cash balances,borrowings under its revolving credit agreement and/or additional long-term debt.
Due to the FCC’s anti-collusion rules, TDS may not disclose any details relating to U.S. Cellular’s participation orinformation about whether or not it is a winning bidder unless and until it is announced as a winning bidder by the FCC.
Due to changes in FCC rules, U.S. Cellular will not be participating in Auction 1000 through a limited partnership that isa ‘‘designated entity’’ which qualifies for a discount of 25% on any licenses won in the auction, as U.S. Cellular hasdone in prior auctions. Instead, U.S. Cellular will be participating in the auction directly and will not qualify for anydiscount on licenses that may be won in the auction.
37
MANAGEMENT’S DISCUSSION AND ANALYSIS OF FINANCIAL CONDITION AND RESULTS OF OPERATIONS
Cash Payments for Acquisitions(Dollars in millions)
Cash Payments Received from Divestitures(Dollars in millions)

To the extent that existing competitors or new entrants acquire low-band (600 MHz) spectrum in U.S. Cellular markets inAuction 1000, U.S. Cellular could face increased competition over time from competitors that hold more efficient andsuperior low-band spectrum, which would have an adverse effect on TDS’ wireless competitive position.
In January 2016, TDS entered into an agreement to purchase a 700 MHz A Block license for $36.0 million. In February2016, TDS entered into multiple agreements with third parties that provide for the transfer of certain AWS and PCSspectrum licenses and approximately $30 million in cash to U.S. Cellular, in exchange for U.S. Cellular transferringcertain AWS, PCS and 700 MHz licenses to the third parties.
Variable Interest Entities
TDS consolidates certain entities because they are ‘‘variable interest entities’’ under GAAP. See Note 14 — VariableInterest Entities in the Notes to Consolidated Financial Statements for additional information related to these variableinterest entities. TDS may elect to make additional capital contributions and/or advances to these variable interestentities in future periods in order to fund their operations.
Common Share Repurchase Programs
In 2013, the Board of Directors of TDS authorized a $250 million stock repurchase program for the purchase of TDSCommon Shares from time to time. The maximum dollar value of shares that may yet be purchased under this programwas $201.2 million as of December 31, 2015. This authorization does not have an expiration date.
In 2009, the Board of Directors of U.S. Cellular authorized the repurchase from time to time of up to 1,300,000 CommonShares on an annual basis beginning in 2009 and continuing each year thereafter, on a cumulative basis. As ofDecember 31, 2015, there were 4,755,298 U.S. Cellular Common Shares available for purchase under this program,which increased by 1,300,000 Common Shares on January 1, 2016. This authorization does not have an expiration date.
There were no TDS and limited U.S. Cellular share repurchases in 2015. Depending on their future financial performance,construction, development or acquisition programs, and available sources of financing, TDS and U.S. Cellular may nothave sufficient liquidity or capital resources to make significant share repurchases. Therefore, there is no assurance thatTDS or U.S. Cellular will make any significant amount of share repurchases in the future.
For additional information related to the current TDS and U.S. Cellular repurchase authorizations and repurchases madeduring 2015, 2014 and 2013, see Note 16 — Common Shareholders’ Equity in the Notes to Consolidated FinancialStatements.
Off-Balance Sheet Arrangements
TDS had no transactions, agreements or other contractual arrangements with unconsolidated entities involving‘‘off-balance sheet arrangements,’’ as defined by SEC rules, that had or are reasonably likely to have a material currentor future effect on its financial condition, results of operations, liquidity, capital expenditures or capital resources.
Dividends
TDS paid quarterly dividends per outstanding share of $0.1410 in 2015, $0.1340 in 2014 and $0.1275 in 2013. TDSincreased the dividend per share to $0.1480 in the first quarter of 2016. See Note 16 — Common Shareholders’ Equityin the Notes to Consolidated Financial Statements for additional information. TDS has no current plans to change itspolicy of paying dividends.
38
MANAGEMENT’S DISCUSSION AND ANALYSIS OF FINANCIAL CONDITION AND RESULTS OF OPERATIONS

CONTRACTUAL AND OTHER OBLIGATIONSAt December 31, 2015, the resources required for contractual obligations were as follows:
Payments Due by Period
Less Than More ThanTotal 1 Year 1 - 3 Years 3 - 5 Years 5 Years
(Dollars in millions)Long-term debt obligations1 . . . . . . . . . . . . . . $ 2,527.2 $ 14.2 $ 23.3 $ 22.6 $ 2,467.1Interest payments on long-term debt obligations . . 6,176.8 164.9 329.6 329.6 5,352.7Operating leases2 . . . . . . . . . . . . . . . . . . . . . 1,324.0 156.9 254.0 188.9 724.2Capital leases . . . . . . . . . . . . . . . . . . . . . . . 5.0 0.3 0.7 0.7 3.3Purchase obligations3 . . . . . . . . . . . . . . . . . . 1,306.1 663.9 408.6 164.9 68.7
$ 11,339.1 $ 1,000.2 $ 1,016.2 $ 706.7 $ 8,616.0
1 Includes current and long-term portions of debt obligations. The total long-term debt obligation differs from Long-term debt in the Consolidated BalanceSheet due to capital leases, debt issuance costs and the unamortized discount related to U.S. Cellular’s 6.7% Senior Notes. See Note 11 — Debt in theNotes to Consolidated Financial Statements for additional information.
2 Includes future lease costs related to telecommunications plant facilities, office space, retail sites, cell sites, data centers and equipment. SeeNote 13 — Commitments and Contingencies in the Notes to Consolidated Financial Statements for additional information.
3 Includes obligations payable under non-cancellable contracts, commitments for network facilities and transport services, agreements for softwarelicensing, long-term marketing programs, and agreements with Apple to purchase certain minimum quantities of Apple iPhone products and fundmarketing programs related to the Apple iPhone and iPad products.
The table above excludes liabilities related to ‘‘unrecognized tax benefits’’ as defined by GAAP because TDS is unableto predict the period of settlement of such liabilities. Such unrecognized tax benefits were $38.9 million at December 31,2015. See Note 4 — Income Taxes in the Notes to Consolidated Financial Statements for additional information onunrecognized tax benefits.
See Note 13 — Commitments and Contingencies in the Notes to Consolidated Financial Statements for additionalinformation.
CONSOLIDATED CASH FLOWSTDS operates a capital- and marketing-intensive business. TDS utilizes cash on hand, cash from operating activities,cash proceeds from divestitures and disposition of investments, short-term credit facilities and long-term debt financingto fund its acquisitions (including licenses), construction costs, operating expenses and share repurchases. Cash flowsmay fluctuate from quarter to quarter and year to year due to seasonality, the timing of acquisitions and divestitures,capital expenditures and other factors. The following discussion summarizes TDS’ cash flow activities in 2015, 2014 and2013.
2015 Commentary
Cash Flows from Operating Activities
Cash flows from operating activities were $789.7 million in 2015. An increase in cash flows from operating activities wasdue primarily to improved net income and working capital factors. In 2015, increased receivables related to equipmentinstallment plans decreased cash flows from operating activities. In the near term and as the popularity of equipmentinstallment plans increases, TDS expects this trend to continue.
In December 2015, as part of the Protecting Americans from Tax Hikes Act of 2015, bonus depreciation was enactedwhich allowed TDS to accelerate deductions for depreciation, resulting in an overpayment of estimated tax amounts paidduring 2015. Primarily as a result of this overpayment, TDS has recorded $70.1 million of Income taxes receivable atDecember 31, 2015. TDS paid income taxes, net of refunds, of $57.4 million in 2015.
Future cash flows from operating activities may be impacted by distributions from investments in unconsolidated entities.Distributions from unconsolidated entities in 2015, 2014 and 2013 were $60.1 million, $112.3 million and $127.9 million,respectively. U.S. Cellular holds a 5.5% ownership interest in the LA Partnership. In 2014 and 2013, U.S. Cellular receivedcash distributions of $60.5 million and $71.5 million, respectively, from the LA Partnership. U.S. Cellular did not receive
39
MANAGEMENT’S DISCUSSION AND ANALYSIS OF FINANCIAL CONDITION AND RESULTS OF OPERATIONS
any cash distributions in 2015 from the LA Partnership as U.S. Cellular was informed by the general partner that, inconnection with the acquisition of a spectrum license covering the LA Partnership’s market in FCC Auction 97, the LAPartnership would not make a cash distribution in 2015. This spectrum license will enhance the value of U.S. Cellular’sinterest in the LA Partnership. Notwithstanding the lack of a cash distribution in 2015, U.S. Cellular will be obligated tomake tax payments on its share of any taxable income reported by the LA Partnership in 2015 and beyond. The amountof future cash distributions from the LA Partnership are uncertain, and could be impacted by future spectrum purchasesby the LA Partnership.
Cash Flows from Investing Activities
Cash flows used for investing activities were $737.7 million in 2015. TDS makes substantial investments to acquirewireless licenses and properties and to construct and upgrade telecommunications networks and facilities as a basis forcreating long-term value for shareholders. In recent years, rapid changes in technology and new opportunities haverequired substantial investments in potentially revenue-enhancing and cost-reducing upgrades to TDS’ networks. Cashused for additions to property, plant and equipment totaled $800.6 million in 2015.
During 2015, a $278.3 million payment was made by Advantage Spectrum L.P. to the FCC for licenses for which it wasthe provisional winning bidder. See Note 6 — Acquisitions, Divestitures and Exchanges and Note 14 — Variable InterestEntities in the Notes to Consolidated Financial Statements for additional information.
Cash Flows from Financing Activities
Cash flows from financing activities were $460.7 million in 2015. In July 2015, U.S. Cellular borrowed $225 million on itsTerm Loan. In November 2015, U.S. Cellular issued $300 million of 7.25% Senior Notes due 2064.
2014 Commentary
Cash Flows from Operating Activities
Cash flows from operating activities were $394.8 million in 2014. Working capital factors which significantly decreasedcash flows from operating activities included changes in accounts payable levels as a result of timing differences relatedto operating expenses and device purchases. In 2014, increased receivables related to equipment installment plansdecreased cash flows from operating activities.
In December 2014, as part of the Tax Increase Prevention Act of 2014, bonus depreciation was enacted which allowedTDS to accelerate deductions for depreciation resulting in a federal taxable loss in 2014. Primarily as a result of thisfederal income tax carryback, TDS recorded $113.7 million of Income taxes receivable at December 31, 2014. TDS paidincome taxes, net of refunds, of $48.9 million in 2014.
Cash Flows from Investing Activities
Cash flows used for investing activities were $909.7 million in 2014. Cash used for additions to property, plant andequipment totaled $799.5 million in 2014. Cash paid for acquisitions and licenses in 2014 was $295.3 million whichincludes $272.8 million related to Cable acquisitions and $22.9 million related to Licenses. Cash received fromdivestitures in 2014 was $187.6 million which includes $91.8 million related to Licenses and $71.1 million related to theDivestiture Transaction. See Note 6 — Acquisitions, Divestitures and Exchanges in the Notes to Consolidated FinancialStatements for additional information related to these acquisitions and divestitures. TDS realized cash proceeds of$50.0 million in 2014 related to the maturities of its investments in U.S. Treasury Notes and corporate notes. In 2014,cash used for investing activities includes a $60.0 million deposit made by Advantage Spectrum, L.P., a variable interestentity consolidated by U.S. Cellular, to the FCC for its participation in Auction 97. See Note 14 — Variable InterestEntities in the Notes to Consolidated Financial Statements for additional information.
Cash Flows from Financing Activities
Cash flows from financing activities were $156.8 million in 2014. In December 2014, U.S. Cellular issued $275 million of7.25% Senior Notes due 2063.
40
MANAGEMENT’S DISCUSSION AND ANALYSIS OF FINANCIAL CONDITION AND RESULTS OF OPERATIONS
2013 Commentary
Cash Flows from Operating Activities
Cash flows from operating activities were $494.6 million in 2013. Accounts receivable grew substantially due primarily tobilling delays encountered during the conversion to a new U.S. Cellular billing system in the third quarter of 2013. TDSpaid income taxes, net of refunds, of $175.6 million in 2013. The change in inventory was due primarily to higher costsper unit related to 4G LTE smartphones.
Cash Flows from Investing Activities
Cash flows used for investing activities were $260.7 million in 2013. Cash used for additions to property, plant andequipment totaled $883.8 million in 2013. Cash paid for acquisitions and licenses in 2013 was $314.6 million whichincludes $264.1 million related to a Cable acquisition, $34.0 million related to an HMS acquisition and $16.5 millionrelated to FCC licenses. Cash received from divestitures in 2013 was $811.1 million which includes $490.6 million relatedto the Divestiture Transaction and $312.0 million related to Licenses. See Note 6 — Acquisitions, Divestitures andExchanges in the Notes to Consolidated Financial Statements for additional information related to these acquisitions anddivestitures.
TDS realized cash proceeds of $115.0 million in 2013 related to the maturities of its investments in U.S. Treasury Notes,corporate notes and certificates of deposit.
Cash Flows from Financing Activities
Cash flows used for financing activities were $144.4 million in 2013. On June 25, 2013, U.S. Cellular paid a special cashdividend of $5.75 per share, for an aggregate amount of $482.3 million, to all holders of U.S. Cellular Common Sharesand Series A Common Shares as of June 11, 2013. Of the $482.3 million paid, TDS received $407.1 million whilenoncontrolling public shareholders received $75.2 million. The cash paid to noncontrolling public shareholders ispresented as U.S. Cellular dividends paid to noncontrolling public shareholders on the Consolidated Statement of CashFlows.
CONSOLIDATED BALANCE SHEET ANALYSISThe following discussion addresses certain captions in the consolidated balance sheet and changes therein. Thisdiscussion is intended to highlight the significant changes and is not intended to fully reconcile the changes. Changes infinancial condition during 2015 are as follows:
Cash and cash equivalents
Cash and cash equivalents increased $512.7 million driven primarily by proceeds received from U.S. Cellular’s issuanceof $300 million 7.25% Senior Notes and U.S. Cellular’s $225 million draw on the Term Loan. Cash flow from operatingactivities less cash used for additions to property, plant and equipment yielded a net cash reduction of $10.9 million.Cash received from divestitures also exceeded Cash paid for acquisitions and licenses by $56.0 million.
Accounts receivable, net
Accounts receivable, net increased $119.2 million primarily as a result of the $136.7 million increase attributable toequipment installment plans. U.S. Cellular implemented equipment installment plans on a broad basis in 2014.
Inventory, net
Inventory, net decreased $115.5 million due primarily to selling inventory on hand at December 31, 2014 and bettermanagement of purchasing and overall inventory levels based upon anticipated demand and promotional activities.
41
MANAGEMENT’S DISCUSSION AND ANALYSIS OF FINANCIAL CONDITION AND RESULTS OF OPERATIONS

Net deferred income tax asset
Net deferred income tax asset decreased $107.7 million as a result of the early adoption of ASU 2015-17 as ofDecember 31, 2015. The previously identified Net current deferred tax asset is now grouped with non-current deferredincome tax liability in accordance with ASU 2015-17. See Note 4 — Income Taxes in the Notes to Consolidated FinancialStatements for more information on ASU 2015-17.
Assets held for sale
Assets held for sale decreased $103.3 million due the closing of the Tower Sale ($38.4 million), two license exchanges($56.8 million), and the sale of certain ILEC markets ($8.2 million). No assets were held for sale as of December 31,2015. For information on the Tower Sale, see Note 6 — Acquisitions, Divestitures and Exchanges in the Notes toConsolidated Financial Statements.
Licenses
Licenses increased $390.8 million due primarily to an aggregate winning bid of $338.3 million in FCC Auction 97 byAdvantage Spectrum and other license purchases and exchanges resulting in a net increase of $51.0 million. Auction 97licenses won by Advantage Spectrum have not yet been granted. See Note 6 — Acquisitions, Divestitures andExchanges in the Notes to Consolidated Financial Statements for more information about these transactions.
Long-term debt, net
Long-term debt, net increased $498.8 million due primarily to U.S. Cellular’s $300 million 7.25% Senior Notes issued inNovember 2015 and $225 million Term Loan draw in July 2015. See Note 11 — Debt for additional information.
APPLICATION OF CRITICAL ACCOUNTING POLICIES AND ESTIMATESTDS prepares its consolidated financial statements in accordance with GAAP. TDS’ significant accounting policies arediscussed in detail in Note 1 — Summary of Significant Accounting Policies and Recent Accounting Pronouncements inthe Notes to Consolidated Financial Statements.
Management believes the application of the following critical accounting policies and the estimates required by suchapplication reflect its most significant judgments and estimates used in the preparation of TDS’ consolidated financialstatements. Management has discussed the development and selection of each of the following accounting policies andrelated estimates and disclosures with the Audit Committee of TDS’ Board of Directors.
Intangible Asset Impairment
Licenses, Goodwill and Franchise rights represent a significant component of TDS’ consolidated assets. These assetsare considered to be indefinite lived assets and are therefore not amortized but tested annually for impairment. TDSperforms annual impairment testing of Licenses, Goodwill and Franchise rights as of November 1 of each year or morefrequently if triggering events are present. Significant negative events, such as changes in any of the assumptionsdescribed below as well as decreases in forecasted cash flows, could result in an impairment in future periods.
See Note 7 — Intangible Assets in the Notes to Consolidated Financial Statements for information related to Licenses,Goodwill and Franchise rights activity in 2015 and 2014.
Wireless Licenses – U.S. Cellular
Prior to the fourth quarter of 2015, U.S. Cellular separated its FCC licenses into eleven units of accounting based ongeographic service areas. The eleven units of accounting consisted of four geographic units of accounting for developedoperating market licenses (‘‘built licenses’’) and seven geographic non-operating market licenses (‘‘unbuilt licenses’’). Aspart of the current year annual impairment evaluation, U.S. Cellular evaluated the aggregation criteria based on howsuch licenses are deployed and provide value in U.S. Cellular’s operations, and current industry and market factors. Itwas determined that the built licenses should be aggregated into one unit of accounting. The unbuilt licenses continuedto be separated into seven geographic units of accounting.
As of November 1, 2015, U.S. Cellular performed a qualitative impairment assessment to determine whether it was morelikely than not that the fair value of the licenses exceeded their carrying value. Given the change in the reporting units forbuilt licenses, the qualitative assessment was performed for the following units of accounting: historical four units of
42
MANAGEMENT’S DISCUSSION AND ANALYSIS OF FINANCIAL CONDITION AND RESULTS OF OPERATIONS

accounting for built licenses, newly defined one unit of accounting for built licenses, and seven unbuilt licenses. As partof the assessment, U.S. Cellular considered several qualitative factors, including analysts’ estimates of license values,recent spectrum auction results, recent U.S. Cellular transactions and other industry and market factors. Based on thisassessment, U.S. Cellular concluded that it was more likely than not that the fair value of the licenses in each unit ofaccounting exceeded the respective carrying values. Therefore, no impairment of licenses existed and no Step 1impairment evaluation was completed.
Goodwill – U.S. Cellular
U.S. Cellular has recorded Goodwill as a result of the acquisition of wireless companies. Prior to the fourth quarter of2015, U.S. Cellular was comprised of four reporting units based on geographic service areas. Due to the evolution of thebusiness and the extent to which U.S. Cellular has similar customers, products and services, and operations across allgeographic regions, and also operates one interdependent network, U.S. Cellular determined that it had one reportingunit as of November 1, 2015. The change in reporting units required U.S. Cellular to perform an impairment test for boththe previous four reporting units and one new reporting unit as of November 1, 2015. The newly defined one reportingunit hereafter is referred to as U.S. Cellular.
Based on the results of the annual Goodwill impairment assessment performed as of November 1, 2015, the fair valueof each of the historical four and U.S. Cellular reporting units exceeded their respective carrying values. Therefore, noimpairment of Goodwill existed.
A discounted cash flow approach was used to value each reporting unit, using value drivers and risks specific to theindustry and current economic factors. The cash flow estimates incorporated assumptions that market participants woulduse in their estimates of fair value and may not be indicative of U.S. Cellular specific assumptions. However, thediscount rate used in the analysis accounts for any additional risk a market participant might place on integrating U.S.Cellular into its operations at the level of cash flows assumed under this approach. The most significant assumptionsmade in this process were the revenue growth rate (shown as a compound annual growth rate in the table below), theterminal revenue growth rate and the discount rate. There are uncertainties associated with these key assumptions andpotential events and/or circumstances that could have a negative effect on these key assumptions described below.
Key Assumptions As of November 1, 2015
Revenue growth rate1 . . . . . . . . . . . . . . . . . . . . . . . . . . . . . . . . . . . . . . . . . . . . . . . . . . . . . 2.3%Terminal revenue growth rate1 . . . . . . . . . . . . . . . . . . . . . . . . . . . . . . . . . . . . . . . . . . . . . . . 2.0%Discount rate2 . . . . . . . . . . . . . . . . . . . . . . . . . . . . . . . . . . . . . . . . . . . . . . . . . . . . . . . . . 9.5%
1 There are risks that could negatively impact the projected revenue growth rates, including, but not limited to: the success of new and existing products/services, competition, operational difficulties and customer churn.
2 The discount rate of each reporting unit was computed by calculating the weighted average cost of capital of market participants with businessesreasonably comparable to U.S. Cellular. The discount rate is dependent upon the cost of capital of other industry market participants and the companyspecific risk. To the extent that the weighted average cost of capital of industry participants increases or U.S. Cellular’s risk in relation to its peersincreases, this would decrease the estimated fair value of the reporting units. The weighted average cost of capital may increase if borrowing costs rise,market participants weight more of their capital structure towards equity vs. debt, or other elements affecting the estimated cost of equity increase.
Provided all other assumptions remained the same, for the historical four reporting units, the discount rate would have toincrease to a range of 9.5% to 11.0% to yield an estimated fair value of reporting units that equal their respectivecarrying values at November 1, 2015. Further, assuming all other assumptions remained the same, for the historical fourreporting units, the terminal growth rate assumptions would need to decrease to amounts ranging from negative 1.5% topositive 2.0% to yield an estimated fair value equal to the carrying values of the respective reporting unit at November 1,2015.
Provided all other assumptions remained the same, for the U.S. Cellular reporting unit, the discount rate would have toincrease to 10.6% to yield an estimated fair value of the reporting unit that equals its carrying value at November 1,2015. Further, assuming all other assumptions remained the same, for the U.S. Cellular reporting unit, the terminalgrowth rate assumption would need to decrease to negative 0.6% to yield an estimated fair value equal to the carryingvalue of the reporting unit at November 1, 2015.
43
MANAGEMENT’S DISCUSSION AND ANALYSIS OF FINANCIAL CONDITION AND RESULTS OF OPERATIONS

The Goodwill balance of U.S. Cellular and of each prior reporting unit at TDS as of November 1, 2015 and thepercentage by which the estimated fair value of the corresponding reporting units exceeded the carrying values, as apercentage of carrying value, was as follows:
Goodwill balance at Excess of estimated FairReporting Unit TDS1 Value over Carrying Value
(Dollars in thousands)Prior Reporting Units:
Central Region . . . . . . . . . . . . . . . . . . . . . . . . . . . . . . . . . . . . . $ 68,511 32.0%Mid-Atlantic Region . . . . . . . . . . . . . . . . . . . . . . . . . . . . . . . . . . $ 114,351 0.6%New England Region . . . . . . . . . . . . . . . . . . . . . . . . . . . . . . . . . $ 17,473 20.8%Northwest Region . . . . . . . . . . . . . . . . . . . . . . . . . . . . . . . . . . . $ 26,516 32.1%
New Single Reporting Unit:U.S. Cellular . . . . . . . . . . . . . . . . . . . . . . . . . . . . . . . . . . . . . . . $ 226,851 24.0%
1 Previously under GAAP, TDS accounted for U.S. Cellular’s share repurchases as step acquisitions, allocating a portion of the share repurchase value toTDS’ Goodwill. This resulted in a difference between U.S. Cellular’s Goodwill on a stand-alone basis and the TDS consolidated Goodwill related to U.S.Cellular. TDS recorded subsequent activities relating to Goodwill, including impairments and divestiture activities, for both entities based on theirrespective balances.
Goodwill – TDS Telecom
TDS Telecom has recorded Goodwill as a result of the acquisition of wireline, cable and HMS businesses. For purposesof the 2015 and 2014 Goodwill impairment tests, TDS Telecom had three reporting units: Wireline, Cable and HMS.
Based on the results of the TDS Telecom annual Goodwill impairment assessment performed as of November 1, 2015,the fair values of the Wireline, Cable and HMS reporting units exceeded their carrying values. Therefore, no impairmentof Goodwill existed for the reporting units.
The discounted cash flow approach and guideline public company method were used to value the Wireline, Cable andHMS reporting units. The discounted cash flow approach uses value drivers and risks specific to the industry andcurrent economic factors. The most significant assumptions made in this process were the revenue growth rate (shownas a compound annual growth rate in the table below), the terminal revenue growth rate and the discount rate. Theguideline public company method develops an indication of fair value by calculating average market pricing multiples forselected publicly-traded companies. The developed multiples were applied to applicable financial measures of therespective reporting unit to determine fair value. The discounted cash flow approach and guideline public companymethod were weighted to arrive at the total fair value used for impairment testing. The weighting of methods wasconsistently applied in both 2015 and 2014.
For purposes of the discounted cash flow approach, the following table represents key assumptions used in estimatingthe fair value of the Wireline, Cable and HMS reporting units as of the testing date. There are uncertainties associatedwith these key assumptions and potential events and/or circumstances that could have a negative effect on the keyassumptions described below.
As of November 1, 2015
Key Assumptions Wireline Cable HMS
Revenue growth rate1 . . . . . . . . . . . . . . . . . . . . . . . . . . . . . . . . . . . . . . . . (2.3)% 8.3% 4.8%Terminal revenue growth rate1 . . . . . . . . . . . . . . . . . . . . . . . . . . . . . . . . . . . 0.0% 2.5% 2.5%Discount rate2 . . . . . . . . . . . . . . . . . . . . . . . . . . . . . . . . . . . . . . . . . . . . 6.5% 9.5% 11.5%
1 There are risks that could negatively impact the projected revenue growth rates, including, but not limited to: the success of new and existing products/services, competition, and operational difficulties. TDS Telecom’s reporting units use internally generated forecasts to develop such rates. Theseinternally generated forecasts consider such things as observed demand, market factors and competitive knowledge.
2 The discount rate is dependent upon the cost of capital of other industry market participants and company specific risk. To the extent that the weightedaverage cost of capital of industry participants increases, this would decrease the estimated fair value of the reporting units. The weighted average costof capital may increase if borrowing costs rise, market participants weight more of their capital structure towards equity vs. debt, Wireline, Cable orHMS’ risk in relation to its peers increases or other elements affecting the estimated cost of equity increase.
44
MANAGEMENT’S DISCUSSION AND ANALYSIS OF FINANCIAL CONDITION AND RESULTS OF OPERATIONS

Provided all other assumptions remained the same, the Wireline, Cable and HMS discount rates would have to increaseto 7.3%, 10.0% and 13.3%, respectively, to yield estimated fair values equal to their respective carrying values atNovember 1, 2015. Further, provided all other assumptions remained the same, the Wireline, Cable and HMS terminalrevenue growth rate assumptions would need to decrease to negative 1.2%, positive 1.6% and negative 2.1%,respectively, to yield an estimate of fair value equal to the carrying value of the respective reporting units at November 1,2015.
The Goodwill balances of the reporting units tested for impairment as of November 1, 2015 and the percentage bywhich the estimated fair value of the corresponding reporting units exceeded their carrying values, as a percentage ofcarrying value, was as follows:
Excess of estimated FairReporting unit Goodwill balance Value over Carrying Value
(Dollars in thousands)Wireline1 . . . . . . . . . . . . . . . . . . . . . . . . . . . . . . . . . . . . . . . . . . . . $ 408,770 5.9%Cable . . . . . . . . . . . . . . . . . . . . . . . . . . . . . . . . . . . . . . . . . . . . . $ 95,322 7.5%HMS . . . . . . . . . . . . . . . . . . . . . . . . . . . . . . . . . . . . . . . . . . . . . . $ 34,830 32.3%
1 Between the November 1, 2015 impairment date and the December 31, 2015 Consolidated Balance Sheet date, TDS recorded an immaterial adjustmentto the Goodwill balance related to the divestiture of certain Wireline markets.
Franchise Rights – TDS Telecom
TDS Telecom has recorded Franchise rights as a result of acquisitions of cable businesses. TDS Telecom testsFranchise rights for impairment at a level of reporting referred to as a unit of accounting. For purposes of its impairmenttesting of Franchise rights, TDS Telecom had one unit of accounting: Cable.
TDS Telecom applied the build-out (or Greenfield) method to estimate the fair value of Franchise rights in 2015 and2014. Based on the results of this assessment, the estimated fair value of the Franchise rights exceeded their carryingvalue.
The following table represents key assumptions used in estimating the fair value of the Franchise rights using thebuild-out method. There are uncertainties associated with these key assumptions and potential events and/orcircumstances that could have a negative effect on the key assumptions are described below.
Key Assumptions As of November 1, 2015
Build-out period1 . . . . . . . . . . . . . . . . . . . . . . . . . . . . . . . . . . . . . . . . . . . . . . . . . . . . . . . 2 yearsDiscount rate2 . . . . . . . . . . . . . . . . . . . . . . . . . . . . . . . . . . . . . . . . . . . . . . . . . . . . . . . . . 8.0%Terminal revenue growth rate3 . . . . . . . . . . . . . . . . . . . . . . . . . . . . . . . . . . . . . . . . . . . . . . . 2.5%
1 The build-out period represents the estimated time to perform a hypothetical build of the network. Changes in the estimated build-out period can occuras a result of changes in resources and technology. Such changes could negatively or positively impact the results.
2 The discount rate used in the valuation of Franchise rights is less than the discount rate used in the valuation of the Cable reporting unit for purposes ofGoodwill impairment testing. The discount rate used for Franchise rights includes a reduced company-specific risk premium as it is assumed a marketparticipant starting a cable network build would construct and operate its network in an optimal manner and would not be constrained by the currentnetwork and operations associated with a mature cable company. The discount rate is estimated based on the overall risk-free interest rate adjusted forindustry participant information, such as a typical capital structure (i.e., debt-equity ratio), the after-tax cost of debt, and the cost of equity. The cost ofequity takes into consideration the average risk specific to individual market participants. The weighted average cost of capital may increase if borrowingcosts rise, market participants weight more of their capital structure towards equity vs. debt, or other elements affecting the estimated cost of equityincrease.
3 There are risks that could negatively impact the projected revenue growth rates, including, but not limited to: the success of new and existing products/services, competition, network buildout costs and operational difficulties. TDS Telecom’s reporting units use internally generated forecasts to developsuch rates. These internally generated forecasts consider such things as observed demand, market factors and competitive knowledge.
As of November 1, 2015, the fair value of the franchise rights exceeded its carrying value by 34.8%. Provided all otherassumptions remained the same, the discount rate would have to increase to 8.5% to yield an estimated fair value of theFranchise rights that equals the carrying value at November 1, 2015. Further, provided all other assumptions remainedthe same, the terminal revenue growth rate assumption would need to decrease to 1.6% to yield an estimate of fairvalue equal to the carrying value of the Franchise rights at November 1, 2015.
45
MANAGEMENT’S DISCUSSION AND ANALYSIS OF FINANCIAL CONDITION AND RESULTS OF OPERATIONS
Income Taxes
The amounts of income tax assets and liabilities, the related income tax provision and the amount of unrecognized taxbenefits are critical accounting estimates because such amounts are significant to TDS’ financial condition and results ofoperations.
The preparation of the consolidated financial statements requires TDS to calculate a provision for income taxes. Thisprocess involves estimating the actual current income tax liability together with assessing temporary differences resultingfrom the different treatment of items for tax purposes. These temporary differences result in deferred income tax assetsand liabilities, which are included in TDS’ Consolidated Balance Sheet. TDS must then assess the likelihood thatdeferred income tax assets will be realized based on future taxable income and, to the extent management believes thatrealization is not likely, establish a valuation allowance. Management’s judgment is required in determining the provisionfor income taxes, deferred income tax assets and liabilities and any valuation allowance that is established for deferredincome tax assets.
TDS recognizes the tax benefit from an uncertain tax position only if it is more likely than not that the tax position will besustained on examination by the taxing authorities based on the technical merits of the position. The tax benefitsrecognized in the financial statements from such a position are measured based on management’s judgment as to thepossible outcome that has a greater than 50% cumulative likelihood of being realized upon ultimate resolution.
See Note 4 — Income Taxes in the Notes to Consolidated Financial Statements for details regarding TDS’ income taxprovision, deferred income taxes and liabilities, valuation allowances and unrecognized tax benefits, including informationregarding estimates that impact income taxes.
Equipment Installment Plans
TDS offers customers, through its owned and agent distribution channels, the option to purchase certain devices underinstallment contracts over a specified time period and, under certain of these plans, offers the customer a trade-in right.Customers on an installment contract who elect to trade-in the device will receive a credit in the amount of theoutstanding balance of the installment contract, provided the customer trades-in an eligible used device in good workingcondition and purchases a new device from TDS. Equipment revenue under these contracts is recognized at the timethe device is delivered to the end-user customer for the selling price of the device, net of any deferred imputed interestand the value of the trade-in right, if applicable.
Trade-In Right
TDS values the trade-in right as a guarantee liability. This liability is initially measured at fair value and is determinedbased on assumptions including the probability and timing of the customer upgrading to a new device and theestimated fair value of the used device eligible for trade-in. TDS reevaluates its estimate of the guarantee liability at eachreporting date. A significant change in any of the aforementioned assumptions used to compute the guarantee liabilitywould impact the amount of revenue recognized under these plans and the timing thereof. In 2015 and 2014, TDSassumed the earliest contractual time of trade-in, or the minimum amount of payments as specified in the deviceinstallment contract, for all customers on installment contracts with trade-in rights.
When a customer exercises the trade-in option, the difference between the outstanding receivable balance forgiven andthe fair value of the used device is recorded as a reduction to the guarantee liability. If the customer does not exercisethe trade-in option at the time he or she is eligible, TDS begins amortizing the liability and records this amortization asadditional operating revenue.
Interest
TDS equipment installment plans do not provide for explicit interest charges. For equipment installment plans with aduration of greater than twelve months, TDS imputes interest using a market rate and recognizes such interest incomeover the duration of the plan as a component of Interest and dividend income. Changes in the imputed interest ratewould impact the amount of revenue recognized under these plans.
Allowance for doubtful accounts
TDS maintains an allowance for doubtful accounts for estimated losses that result from the failure of its customers tomake payments due under the equipment installment plans. The allowance is estimated based on historical experience,account aging and other factors that could affect collectability. When it is probable that an account balance will not be
46
MANAGEMENT’S DISCUSSION AND ANALYSIS OF FINANCIAL CONDITION AND RESULTS OF OPERATIONS

collected, the account balance is charged against the allowance for doubtful accounts. To the extent that actual lossexperience differs significantly from historical trends, the required allowance amounts could differ from the originalestimates.
OTHER ITEMSInflation
Management believes that inflation affects TDS’ business to no greater or lesser extent than the general economy.
Seasonality
U.S. Cellular’s profitability historically has been lower in the fourth quarter as a result of significant marketing andpromotional activity during the holiday season.
Recently Issued Accounting Pronouncements
See Note 1 — Summary of Significant Accounting Policies and Recent Accounting Pronouncements in the Notes toConsolidated Financial Statements for information on recently issued accounting pronouncements.
Certain Relationships and Related Transactions
See Note 20 — Certain Relationships and Related Transactions in the Notes to Consolidated Financial Statements.
REGULATORY MATTERSFCC Net Neutrality Order
In February 2015, the FCC adopted an Open Internet Order relating to new net neutrality rules. The rules becameeffective in June 2015. The order reclassified high-speed, or broadband, internet access service as a‘‘telecommunication service,’’ making it subject to common carrier regulation under Title II of the Communications Act of1934. The order applies equally to fixed and wireless broadband internet service providers and thus applies to internetbroadband services provided by telephone, cable and wireless providers.
The rules prohibit (i) blocking (broadband providers may not block access to legal content, applications, services, ornon-harmful devices); (ii) throttling (broadband providers may not impair or degrade lawful Internet traffic on the basis ofcontent, applications, services, or non-harmful devices); and (iii) paid prioritization (broadband providers may not favorsome lawful internet traffic over other lawful traffic in exchange for consideration, i.e., internet ‘‘fast lanes’’ are prohibited).Also, internet service providers may not prioritize content and services of their affiliates. In addition, the FCC has nowasserted jurisdiction over internet traffic exchange, so interconnection arrangements will now be subject to a statutoryrequirement that all charges, practices, classifications, and regulations for and related to interconnection must be justand reasonable. The rules also include a general conduct standard that will be applied on a case-by-case basis toaddress questionable practices as they occur that unreasonably interfere with or unreasonably disadvantage lawfulcontent, applications, services, or devices to be used by end users (individuals or entities that use a broadband internetaccess service), or made available by edge providers (individuals or entities that provide any content, application, orservice over the internet, and any individual or entity that provides a device used for accessing any content, application,or service over the internet). Although broadband internet access providers will be allowed to engage in reasonablenetwork management practices, it is uncertain what practices will be permitted by the FCC. The order also expands theFCC’s current internet transparency rules.
All of these requirements will be subject to FCC enforcement and potential third-party claims for damages or equitablerelief. Under Title II, the FCC will have broad regulatory authority over internet services and internet service providers.Although the FCC indicated that it will forbear from a number of utility-style regulations, such as rate regulation, tariffs,and unbundling requirements, the FCC could decide to apply such regulations and requirements in the future. Also, it isuncertain if internet services may be subject to the Federal USF contributions or taxation in the future as a result of thereclassification under Title II. Lawsuits have been filed challenging the net neutrality rules and the FCC’s decision toreclassify broadband internet access service under Title II. TDS cannot predict the outcome of these proceedings or theimpact on its business.
47
MANAGEMENT’S DISCUSSION AND ANALYSIS OF FINANCIAL CONDITION AND RESULTS OF OPERATIONS
Changes to FCC’s Designated Entity Rules
U.S. Cellular participated in certain prior FCC spectrum auctions through limited partnerships that qualified as‘‘designated entities’’ under FCC rules and, as such, were eligible for bid credit discounts of 25% with respect tolicenses won in the auctions. U.S. Cellular participated in Auction 97 indirectly through its interest in AdvantageSpectrum. Advantage Spectrum applied as a ‘‘designated entity’’ and expects to receive bid credits resulting in a 25%discount with respect to spectrum purchased in Auction 97. In July 2015, the FCC adopted a Report and Order thatamended the FCC’s designated entity rules. The amended rules include caps on bid credits that designated entitiesmay receive in future auctions and modify the attribution rules. The amended rules also restrict certain joint biddingagreements but permit certain other arrangements involving more than one party. The FCC also has adopted a rulewhich would enable the FCC to recoup some or all of the bidding credits granted to any designated entity, on a licenseby license basis, which allowed a 10 percent or greater non-controlling interest holder in the designated entity to use25 percent or more of its spectrum capacity during the first five years of the license term. Additionally, the amendedrules make certain other changes to the FCC’s competitive bidding rules.
Due to the changes in FCC rules, U.S. Cellular will not be participating in Auction 1000 (discussed below) through alimited partnership that is a ‘‘designated entity’’ which qualifies for a discount of 25% on any licenses won in the auction,as U.S. Cellular has done in prior auctions. Instead, U.S. Cellular will be participating in the auction directly and will notqualify for any discount on licenses that may be won in the auction.
FCC Auction 1000
The FCC has scheduled an auction of 600 MHz spectrum licenses, referred to as Auction 1000. Auction 1000 involves:(1) a ‘‘reverse auction’’ in which broadcast television licensees submit bids to voluntarily relinquish spectrum usagerights in exchange for payments; (2) a ‘‘repacking’’ of the broadcast television bands in order to free up certainbroadcast spectrum for other uses; and (3) a ‘‘forward auction’’ of licenses for spectrum cleared through this process tobe used for wireless communications. Interested broadcasters filed their applications by January 12, 2016 and forwardauction bidders, including U.S. Cellular, filed applications prior to February 10, 2016. U.S. Cellular evaluates opportunitiesto acquire additional spectrum in FCC auctions and thus plans to participate in the forward auction. Auction 1000 isexpected to commence with the broadcaster initial commitment deadline on March 29, 2016. Forward auction bidding islikely to begin a couple of months later, and could continue for three months or longer. The FCC anti-collusion rulesplace certain restrictions on public disclosures and business communications with other companies relating to U.S.Cellular’s participation until the down payment deadline for Auction 1000, which will be ten business days after releaseof the FCC’s Channel Reassignment Public Notice, following the end of the forward auction. These anti-collusion rules,which could last six months or more from February 10, 2016, may restrict the conduct of certain U.S. Cellular activitieswith other applicants in Auction 1000 as well as with nationwide providers of wireless services which are not applicantsin Auction 1000. The restrictions could have an adverse effect on U.S. Cellular’s business, financial condition or resultsof operations.
48
MANAGEMENT’S DISCUSSION AND ANALYSIS OF FINANCIAL CONDITION AND RESULTS OF OPERATIONS

PRIVATE SECURITIES LITIGATION REFORM ACT OF 1995 SAFEHARBOR CAUTIONARY STATEMENTThis Management’s Discussion and Analysis of Financial Condition and Results of Operations and other sections of thisAnnual Report contain statements that are not based on historical facts, including the words ‘‘believes,’’ ‘‘anticipates,’’‘‘intends,’’ ‘‘expects’’ and similar words. These statements constitute and represent ‘‘forward-looking statements’’ as thisterm is defined in the Private Securities Litigation Reform Act of 1995. Such forward-looking statements involve knownand unknown risks, uncertainties and other factors that may cause actual results, events or developments to besignificantly different from any future results, events or developments expressed or implied by such forward-lookingstatements. Such risks, uncertainties and other factors include, but are not limited to, the following risks:
� Intense competition in the markets in which TDS operates could adversely affect TDS’ revenues or increase its costs tocompete.
� A failure by TDS to successfully execute its business strategy (including planned acquisitions, divestitures andexchanges) or allocate resources or capital could have an adverse effect on TDS’ business, financial condition orresults of operations.
� Uncertainty in TDS’ future cash flow and liquidity or in the ability to access capital, deterioration in the capital markets,other changes in TDS’ performance or market conditions, changes in TDS’ credit ratings or other factors could limit orrestrict the availability of financing on terms and prices acceptable to TDS, which could require TDS to reduce itsconstruction, development or acquisition programs, reduce the acquisition of spectrum licenses, and/or reduce orcease share repurchases and/or the payment of dividends.
� TDS has a significant amount of indebtedness which could adversely affect its financial performance and in turnadversely affect its ability to make payments on its indebtedness, comply with terms of debt covenants and incuradditional debt.
� Changes in roaming practices or other factors could cause TDS’ roaming revenues to decline from current levels,roaming expenses to increase from current levels and/or impact TDS’ ability to service its customers in geographicareas where TDS does not have its own network, which could have an adverse effect on TDS’ business, financialcondition or results of operations.
� A failure by TDS to obtain access to adequate radio spectrum to meet current or anticipated future needs and/or toaccurately predict future needs for radio spectrum could have an adverse effect on TDS’ business, financial condition orresults of operations.
� To the extent conducted by the FCC, TDS may participate in FCC auctions of additional spectrum in the future directlyor indirectly and, during certain periods, will be subject to the FCC’s anti-collusion rules, which could have an adverseeffect on TDS.
� Changes in the regulatory environment or a failure by TDS to timely or fully comply with any applicable regulatoryrequirements could adversely affect TDS’ business, financial condition or results of operations.
� An inability to attract people of outstanding potential, to develop their potential through education and assignments, andto retain them by keeping them engaged, challenged and properly rewarded could have an adverse effect on TDS’business, financial condition or results of operations.
� TDS’ assets are concentrated primarily in the U.S. telecommunications industry. Consequently, its operating results mayfluctuate based on factors related primarily to conditions in this industry.
� TDS’ smaller scale relative to larger competitors that may have much greater financial and other resources than TDScould cause TDS to be unable to compete successfully, which could adversely affect its business, financial condition orresults of operations.
� Changes in various business factors, including changes in demand, customer preferences and perceptions, pricecompetition, churn from customer switching activity and other factors, could have an adverse effect on TDS’ business,financial condition or results of operations.
49
MANAGEMENT’S DISCUSSION AND ANALYSIS OF FINANCIAL CONDITION AND RESULTS OF OPERATIONS

� Advances or changes in technology could render certain technologies used by TDS obsolete, could put TDS at acompetitive disadvantage, could reduce TDS’ revenues or could increase its costs of doing business.
� Complexities associated with deploying new technologies present substantial risk and TDS’ investments in unproventechnologies may not produce the benefits that TDS expects.
� TDS receives regulatory support and is subject to numerous surcharges and fees from federal, state and localgovernments, and the applicability and the amount of the support and fees are subject to great uncertainty.
� Performance under device purchase agreements could have a material adverse impact on TDS’ business, financialcondition or results of operations.
� Changes in TDS’ enterprise value, changes in the market supply or demand for wireless licenses, wireline or cablemarkets or IT service providers, adverse developments in the businesses or the industries in which TDS is involvedand/or other factors could require TDS to recognize impairments in the carrying value of its licenses, goodwill, franchiserights and/or physical assets.
� Costs, integration problems or other factors associated with acquisitions, divestitures or exchanges of properties orlicenses and/or expansion of TDS’ businesses could have an adverse effect on TDS’ business, financial condition orresults of operations.
� TDS offers customers the option to purchase certain devices under installment contracts which, compared to fixed-termservice contracts, includes risks that TDS may possibly incur greater churn, lower cash flows, increased costs and/orincreased bad debts expense due to differences in contract terms, which could have an adverse impact on TDS’financial condition or results of operations.
� A failure by TDS to complete significant network construction and systems implementation activities as part of its plansto improve the quality, coverage, capabilities and capacity of its networks and support systems could have an adverseeffect on its operations.
� Difficulties involving third parties with which TDS does business, including changes in TDS’ relationships with orfinancial or operational difficulties of key suppliers or independent agents and third party national retailers who marketTDS’ services, could adversely affect TDS’ business, financial condition or results of operations.
� TDS has significant investments in entities that it does not control. Losses in the value of such investments could havean adverse effect on TDS’ financial condition or results of operations.
� A failure by TDS to maintain flexible and capable telecommunication networks or information technology, or a materialdisruption thereof, could have an adverse effect on TDS’ business, financial condition or results of operations.
� TDS has experienced and, in the future, expects to experience cyber-attacks or other breaches of network orinformation technology security of varying degrees on a regular basis, which could have an adverse effect on TDS’business, financial condition or results of operations.
� The market price of TDS’ Common Shares is subject to fluctuations due to a variety of factors.
� Changes in facts or circumstances, including new or additional information, could require TDS to record charges inexcess of amounts accrued in the financial statements, which could have an adverse effect on TDS’ business, financialcondition or results of operations.
� Disruption in credit or other financial markets, a deterioration of U.S. or global economic conditions or other eventscould, among other things, impede TDS’ access to or increase the cost of financing its operating and investmentactivities and/or result in reduced revenues and lower operating income and cash flows, which would have an adverseeffect on TDS’ business, financial condition or results of operations.
� Settlements, judgments, restraints on its current or future manner of doing business and/or legal costs resulting frompending and future litigation could have an adverse effect on TDS’ business, financial condition or results of operations.
� The possible development of adverse precedent in litigation or conclusions in professional studies to the effect thatradio frequency emissions from wireless devices and/or cell sites cause harmful health consequences, including canceror tumors, or may interfere with various electronic medical devices such as pacemakers, could have an adverse effecton TDS’ wireless business, financial condition or results of operations.
50
MANAGEMENT’S DISCUSSION AND ANALYSIS OF FINANCIAL CONDITION AND RESULTS OF OPERATIONS

31MAR201601274243
� Claims of infringement of intellectual property and proprietary rights of others, primarily involving patent infringementclaims, could prevent TDS from using necessary technology to provide products or services or subject TDS toexpensive intellectual property litigation or monetary penalties, which could have an adverse effect on TDS’ business,financial condition or results of operations.
� Certain matters, such as control by the TDS Voting Trust and provisions in the TDS Restated Certificate of Incorporation,may serve to discourage or make more difficult a change in control of TDS.
� Any of the foregoing events or other events could cause revenues, earnings, capital expenditures and/or any otherfinancial or statistical information to vary from TDS’ forward-looking estimates by a material amount.
TDS undertakes no obligation to update publicly any forward-looking statements whether as a result of new information,future events or otherwise. Readers should evaluate any statements in light of these important factors.
MARKET RISKLong-Term Debt
As of December 31, 2015, the majority of TDS’ long-term debt was in the form of fixed-rate notes with maturities rangingup to 49 years. Fluctuations in market interest rates can lead to significant fluctuations in the fair value of these fixed-ratenotes.
The following chart presents the scheduled principal payments on long-term debt by maturity dates at December 31,2015:
$-
$100
$200
$300
$400
$500
$600
$700
2016
2018
2020
2022
2024
2026
2028
2030
2032
2034
2036
2038
2040
2042
2044
2046
2048
2050
2052
2054
2056
2058
2060
2062
2064
5.875% - TDS - Retail (TDA) 6.625% - TDS - Retail (TDI)6.875% - TDS - Retail (TDE) 7.0% - TDS - Retail (TDJ)6.7% - U.S. Cellular - Institutional 6.95% - U.S. Cellular - Retail (UZA)7.25% - U.S. Cellular - Retail (UZB) 7.25% - U.S. Cellular - Retail (UZC)U.S. Cellular Term Loan
51
MANAGEMENT’S DISCUSSION AND ANALYSIS OF FINANCIAL CONDITION AND RESULTS OF OPERATIONS

The following table presents the scheduled principal payments on long-term debt and capital lease obligations, and therelated weighted average interest rates by maturity dates at December 31, 2015:
Principal Payments Due by Period
Weighted-Avg. InterestLong-Term Debt Rates on Long-Term
Obligations1 Debt Obligations2
(Dollars in millions)2016 . . . . . . . . . . . . . . . . . . . . . . . . . . . . . . . . . . . . . . . . . . . . . . . . . $ 14.3 3.3%2017 . . . . . . . . . . . . . . . . . . . . . . . . . . . . . . . . . . . . . . . . . . . . . . . . . 12.1 3.2%2018 . . . . . . . . . . . . . . . . . . . . . . . . . . . . . . . . . . . . . . . . . . . . . . . . . 11.4 3.3%2019 . . . . . . . . . . . . . . . . . . . . . . . . . . . . . . . . . . . . . . . . . . . . . . . . . 11.4 3.3%2020 . . . . . . . . . . . . . . . . . . . . . . . . . . . . . . . . . . . . . . . . . . . . . . . . . 11.4 3.3%After 5 years . . . . . . . . . . . . . . . . . . . . . . . . . . . . . . . . . . . . . . . . . . . . 2,469.4 6.6%
Total . . . . . . . . . . . . . . . . . . . . . . . . . . . . . . . . . . . . . . . . . . . . . . . . . $ 2,530.0 6.5%
1 The total long-term debt obligation differs from Long-term debt in the Consolidated Balance Sheet due to unamortized debt issuance costs on allnon-revolving debt instruments and unamortized discount related to U.S. Cellular’s 6.7% Senior Notes. See Note 11 — Debt in the Notes toConsolidated Financial Statements for additional information.
2 Represents the weighted average interest rates at December 31, 2015 for debt maturing in the respective periods.
Fair Value of Long-Term Debt
At December 31, 2015 and 2014, the estimated fair value of long-term debt obligations, excluding capital leaseobligations and the current portion of such long-term debt, was $2,483.2 million and $1,932.4 million, respectively. SeeNote 2 — Fair Value Measurements in the Notes to Consolidated Financial Statements for additional information.
Other Market Risk Sensitive Instruments
The substantial majority of TDS’ other market risk sensitive instruments (as defined in item 305 of SEC Regulation S-K)are short-term, including Cash and cash equivalents. Accordingly, TDS believes that a significant change in interest rateswould not have a material effect on such other market risk sensitive instruments.
52
MANAGEMENT’S DISCUSSION AND ANALYSIS OF FINANCIAL CONDITION AND RESULTS OF OPERATIONS
SUPPLEMENTAL INFORMATIONTDS sometimes uses information derived from consolidated financial information but not presented in its financialstatements prepared in accordance with U.S. GAAP to evaluate the performance of its business. Certain of thesemeasures are considered ‘‘non-GAAP financial measures’’ under U.S. Securities and Exchange Commission Rules.Specifically, TDS has referred to the following measures in this Form 10-K Report:
� Adjusted EBITDA
� Operating Cash Flow
� Free Cash Flow
� Adjusted Free Cash Flow
Below is a reconciliation of each of these measures:
Adjusted EBITDA and Operating Cash Flow
Adjusted EBITDA (earnings before interest, taxes, depreciation, amortization and accretion), is defined as net incomeadjusted for the items set forth in the reconciliation. Operating cash flow is defined as net income adjusted for the itemsset forth in the reconciliation. Adjusted EBITDA and Operating cash flow exclude these items in order to show operatingresults on a more comparable basis from period to period. From time to time, TDS may exclude other items fromAdjusted EBITDA and/or Operating cash flow if such items help reflect operating results on a more comparable basis.TDS does not intend to imply that any such items that are excluded are non-recurring, infrequent or unusual; such itemsmay occur in the future. Adjusted EBITDA and Operating cash flow are not measures of financial performance underGAAP and should not be considered as alternatives to net income as indicators of the company’s operatingperformance or as alternatives to cash flows from operating activities, determined in accordance with GAAP, asindicators of cash flows or as measures of liquidity. TDS believes Adjusted EBITDA and Operating cash flow are useful
53
MANAGEMENT’S DISCUSSION AND ANALYSIS OF FINANCIAL CONDITION AND RESULTS OF OPERATIONS
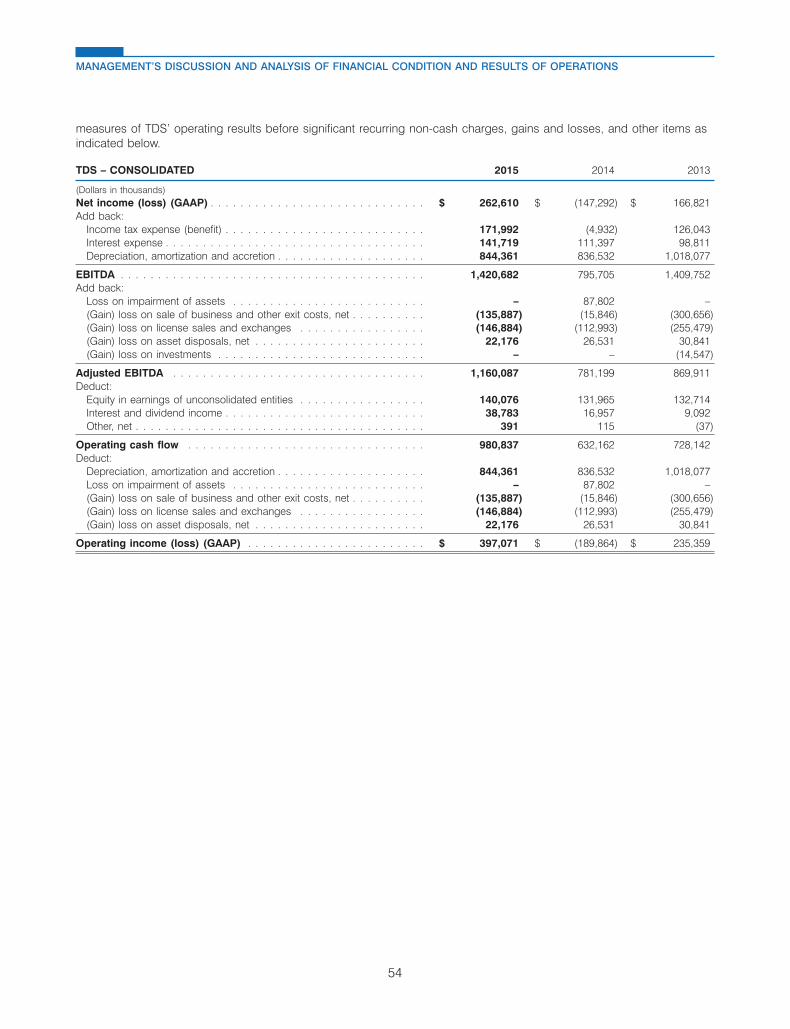
measures of TDS’ operating results before significant recurring non-cash charges, gains and losses, and other items asindicated below.
TDS – CONSOLIDATED 2015 2014 2013
(Dollars in thousands)Net income (loss) (GAAP) . . . . . . . . . . . . . . . . . . . . . . . . . . . . . $ 262,610 $ (147,292) $ 166,821Add back:
Income tax expense (benefit) . . . . . . . . . . . . . . . . . . . . . . . . . . . 171,992 (4,932) 126,043Interest expense . . . . . . . . . . . . . . . . . . . . . . . . . . . . . . . . . . . 141,719 111,397 98,811Depreciation, amortization and accretion . . . . . . . . . . . . . . . . . . . . 844,361 836,532 1,018,077
EBITDA . . . . . . . . . . . . . . . . . . . . . . . . . . . . . . . . . . . . . . . . . 1,420,682 795,705 1,409,752Add back:
Loss on impairment of assets . . . . . . . . . . . . . . . . . . . . . . . . . . – 87,802 –(Gain) loss on sale of business and other exit costs, net . . . . . . . . . . (135,887) (15,846) (300,656)(Gain) loss on license sales and exchanges . . . . . . . . . . . . . . . . . (146,884) (112,993) (255,479)(Gain) loss on asset disposals, net . . . . . . . . . . . . . . . . . . . . . . . 22,176 26,531 30,841(Gain) loss on investments . . . . . . . . . . . . . . . . . . . . . . . . . . . . – – (14,547)
Adjusted EBITDA . . . . . . . . . . . . . . . . . . . . . . . . . . . . . . . . . . 1,160,087 781,199 869,911Deduct:
Equity in earnings of unconsolidated entities . . . . . . . . . . . . . . . . . 140,076 131,965 132,714Interest and dividend income . . . . . . . . . . . . . . . . . . . . . . . . . . . 38,783 16,957 9,092Other, net . . . . . . . . . . . . . . . . . . . . . . . . . . . . . . . . . . . . . . . 391 115 (37)
Operating cash flow . . . . . . . . . . . . . . . . . . . . . . . . . . . . . . . . 980,837 632,162 728,142Deduct:
Depreciation, amortization and accretion . . . . . . . . . . . . . . . . . . . . 844,361 836,532 1,018,077Loss on impairment of assets . . . . . . . . . . . . . . . . . . . . . . . . . . – 87,802 –(Gain) loss on sale of business and other exit costs, net . . . . . . . . . . (135,887) (15,846) (300,656)(Gain) loss on license sales and exchanges . . . . . . . . . . . . . . . . . (146,884) (112,993) (255,479)(Gain) loss on asset disposals, net . . . . . . . . . . . . . . . . . . . . . . . 22,176 26,531 30,841
Operating income (loss) (GAAP) . . . . . . . . . . . . . . . . . . . . . . . . $ 397,071 $ (189,864) $ 235,359
54
MANAGEMENT’S DISCUSSION AND ANALYSIS OF FINANCIAL CONDITION AND RESULTS OF OPERATIONS

U.S. CELLULAR 2015 2014 2013
(Dollars in thousands)Net income (loss) (GAAP) . . . . . . . . . . . . . . . . . . . . . . . . . . . . . $ 247,295 $ (46,922) $ 144,522Add back:
Income tax expense (benefit) . . . . . . . . . . . . . . . . . . . . . . . . . . . 156,334 (11,782) 113,134Interest expense . . . . . . . . . . . . . . . . . . . . . . . . . . . . . . . . . . . 86,194 57,386 43,963Depreciation, amortization and accretion . . . . . . . . . . . . . . . . . . . . 606,455 605,997 803,781
EBITDA . . . . . . . . . . . . . . . . . . . . . . . . . . . . . . . . . . . . . . . . . 1,096,278 604,679 1,105,400Add back:
(Gain) loss on sale of business and other exit costs, net . . . . . . . . . . (113,555) (32,830) (246,767)(Gain) loss on license sales and exchanges . . . . . . . . . . . . . . . . . (146,884) (112,993) (255,479)(Gain) loss on asset disposals, net . . . . . . . . . . . . . . . . . . . . . . . 16,313 21,469 30,606(Gain) loss on investments . . . . . . . . . . . . . . . . . . . . . . . . . . . . – – (18,556)
Adjusted EBITDA . . . . . . . . . . . . . . . . . . . . . . . . . . . . . . . . . . 852,152 480,325 615,204Deduct:
Equity in earnings of unconsolidated entities . . . . . . . . . . . . . . . . . 140,083 129,764 131,949Interest and dividend income . . . . . . . . . . . . . . . . . . . . . . . . . . . 36,332 12,148 3,961Other, net . . . . . . . . . . . . . . . . . . . . . . . . . . . . . . . . . . . . . . . 466 160 288
Operating cash flow . . . . . . . . . . . . . . . . . . . . . . . . . . . . . . . . 675,271 338,253 479,006Deduct:
Depreciation, amortization and accretion . . . . . . . . . . . . . . . . . . . . 606,455 605,997 803,781(Gain) loss on sale of business and other exit costs, net . . . . . . . . . . (113,555) (32,830) (246,767)(Gain) loss on license sales and exchanges . . . . . . . . . . . . . . . . . (146,884) (112,993) (255,479)(Gain) loss on asset disposals, net . . . . . . . . . . . . . . . . . . . . . . . 16,313 21,469 30,606
Operating income (loss) (GAAP) . . . . . . . . . . . . . . . . . . . . . . . . $ 312,942 $ (143,390) $ 146,865
TDS TELECOM 2015 2014 2013
(Dollars in thousands)Net income (loss) (GAAP) . . . . . . . . . . . . . . . . . . . . . . . . . . . . . $ 45,915 $ (24,356) $ 29,801Add back:
Income tax expense (benefit) . . . . . . . . . . . . . . . . . . . . . . . . . . . 34,972 17,590 19,084Interest expense . . . . . . . . . . . . . . . . . . . . . . . . . . . . . . . . . . . 738 (1,188) (1,565)Depreciation, amortization and accretion . . . . . . . . . . . . . . . . . . . . 228,060 219,599 202,701
EBITDA . . . . . . . . . . . . . . . . . . . . . . . . . . . . . . . . . . . . . . . . . 309,685 211,645 250,021Add back:
Loss on impairment of assets . . . . . . . . . . . . . . . . . . . . . . . . . . – 84,000 –(Gain) loss on sale of business and other exit costs, net . . . . . . . . . . (9,530) (2,357) –(Gain) loss on asset disposals, net . . . . . . . . . . . . . . . . . . . . . . . 5,874 4,754 283(Gain) loss on investments . . . . . . . . . . . . . . . . . . . . . . . . . . . . – – (830)
Adjusted EBITDA . . . . . . . . . . . . . . . . . . . . . . . . . . . . . . . . . . 306,029 298,042 249,474Deduct:
Equity in earnings of unconsolidated entities . . . . . . . . . . . . . . . . . 17 8 19Interest and dividend income . . . . . . . . . . . . . . . . . . . . . . . . . . . 2,265 2,430 1,824Other, net . . . . . . . . . . . . . . . . . . . . . . . . . . . . . . . . . . . . . . . (117) (21) (185)
Operating cash flow . . . . . . . . . . . . . . . . . . . . . . . . . . . . . . . . 303,864 295,625 247,816Deduct:
Depreciation, amortization and accretion . . . . . . . . . . . . . . . . . . . . 228,060 219,599 202,701Loss on impairment of assets . . . . . . . . . . . . . . . . . . . . . . . . . . – 84,000 –(Gain) loss on sale of business and other exit costs, net . . . . . . . . . . (9,530) (2,357) –(Gain) loss on asset disposals, net . . . . . . . . . . . . . . . . . . . . . . . 5,874 4,754 283
Operating income (loss) (GAAP) . . . . . . . . . . . . . . . . . . . . . . . . $ 79,460 $ (10,371) $ 44,832
55
MANAGEMENT’S DISCUSSION AND ANALYSIS OF FINANCIAL CONDITION AND RESULTS OF OPERATIONS

WIRELINE 2015 2014 2013
(Dollars in thousands)Income (loss) before income taxes (GAAP)1 . . . . . . . . . . . . . . . . $ 91,878 $ 103,541 $ 70,665Add back:
Interest expense . . . . . . . . . . . . . . . . . . . . . . . . . . . . . . . . . . . (1,133) (2,695) (3,265)Depreciation, amortization and accretion . . . . . . . . . . . . . . . . . . . . 165,841 169,044 170,868
EBITDA . . . . . . . . . . . . . . . . . . . . . . . . . . . . . . . . . . . . . . . . . 256,586 269,890 238,268Add back:
(Gain) loss on sale of business and other exit costs, net . . . . . . . . . . (9,530) (2,357) –(Gain) loss on asset disposals, net . . . . . . . . . . . . . . . . . . . . . . . 5,094 2,091 130(Gain) loss on investments . . . . . . . . . . . . . . . . . . . . . . . . . . . . – – (830)
Adjusted EBITDA . . . . . . . . . . . . . . . . . . . . . . . . . . . . . . . . . . 252,150 269,624 237,568Deduct:
Equity in earnings of unconsolidated entities . . . . . . . . . . . . . . . . . 17 8 19Interest and dividend income . . . . . . . . . . . . . . . . . . . . . . . . . . . 2,193 2,396 1,759Other, net . . . . . . . . . . . . . . . . . . . . . . . . . . . . . . . . . . . . . . . (22) (32) (214)
Operating cash flow . . . . . . . . . . . . . . . . . . . . . . . . . . . . . . . . 249,962 267,252 236,004Deduct:
Depreciation, amortization and accretion . . . . . . . . . . . . . . . . . . . . 165,841 169,044 170,868(Gain) loss on sale of business and other exit costs, net . . . . . . . . . . (9,530) (2,357) –(Gain) loss on asset disposals, net . . . . . . . . . . . . . . . . . . . . . . . 5,094 2,091 130
Operating income (loss) (GAAP) . . . . . . . . . . . . . . . . . . . . . . . . $ 88,557 $ 98,474 $ 65,006
CABLE 2015 2014 2013
(Dollars in thousands)Income (loss) before income taxes (GAAP)1 . . . . . . . . . . . . . . . . $ 6,837 $ 392 $ (116)Add back:
Interest expense . . . . . . . . . . . . . . . . . . . . . . . . . . . . . . . . . . . (458) (95) 74Depreciation, amortization and accretion . . . . . . . . . . . . . . . . . . . . 35,271 23,643 7,571
EBITDA . . . . . . . . . . . . . . . . . . . . . . . . . . . . . . . . . . . . . . . . . 41,650 23,940 7,529Add back:
(Gain) loss on asset disposals, net . . . . . . . . . . . . . . . . . . . . . . . 691 2,482 28
Adjusted EBITDA . . . . . . . . . . . . . . . . . . . . . . . . . . . . . . . . . . 42,341 26,422 7,557Deduct:
Interest and dividend income . . . . . . . . . . . . . . . . . . . . . . . . . . . 37 8 2Other, net . . . . . . . . . . . . . . . . . . . . . . . . . . . . . . . . . . . . . . . 3 (1) –
Operating cash flow . . . . . . . . . . . . . . . . . . . . . . . . . . . . . . . . 42,301 26,415 7,555Deduct:
Depreciation, amortization and accretion . . . . . . . . . . . . . . . . . . . . 35,271 23,643 7,571(Gain) loss on asset disposals, net . . . . . . . . . . . . . . . . . . . . . . . 691 2,482 28
Operating income (loss) (GAAP) . . . . . . . . . . . . . . . . . . . . . . . . $ 6,339 $ 290 $ (44)
56
MANAGEMENT’S DISCUSSION AND ANALYSIS OF FINANCIAL CONDITION AND RESULTS OF OPERATIONS
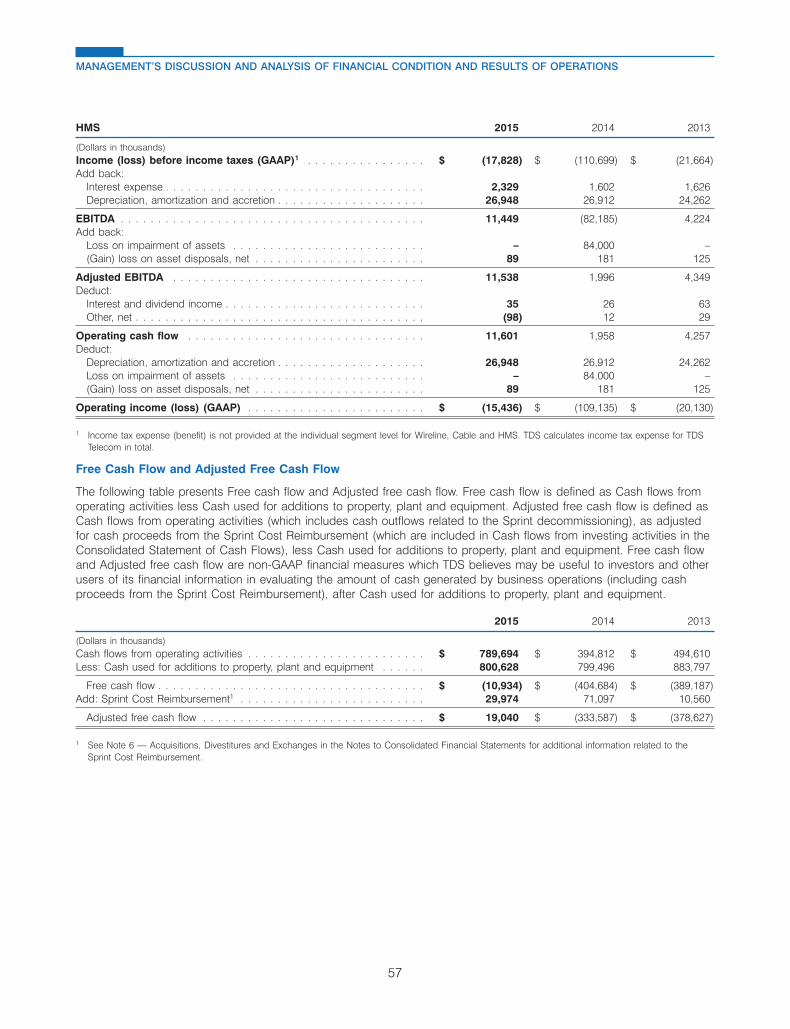
HMS 2015 2014 2013
(Dollars in thousands)Income (loss) before income taxes (GAAP)1 . . . . . . . . . . . . . . . . $ (17,828) $ (110,699) $ (21,664)Add back:
Interest expense . . . . . . . . . . . . . . . . . . . . . . . . . . . . . . . . . . . 2,329 1,602 1,626Depreciation, amortization and accretion . . . . . . . . . . . . . . . . . . . . 26,948 26,912 24,262
EBITDA . . . . . . . . . . . . . . . . . . . . . . . . . . . . . . . . . . . . . . . . . 11,449 (82,185) 4,224Add back:
Loss on impairment of assets . . . . . . . . . . . . . . . . . . . . . . . . . . – 84,000 –(Gain) loss on asset disposals, net . . . . . . . . . . . . . . . . . . . . . . . 89 181 125
Adjusted EBITDA . . . . . . . . . . . . . . . . . . . . . . . . . . . . . . . . . . 11,538 1,996 4,349Deduct:
Interest and dividend income . . . . . . . . . . . . . . . . . . . . . . . . . . . 35 26 63Other, net . . . . . . . . . . . . . . . . . . . . . . . . . . . . . . . . . . . . . . . (98) 12 29
Operating cash flow . . . . . . . . . . . . . . . . . . . . . . . . . . . . . . . . 11,601 1,958 4,257Deduct:
Depreciation, amortization and accretion . . . . . . . . . . . . . . . . . . . . 26,948 26,912 24,262Loss on impairment of assets . . . . . . . . . . . . . . . . . . . . . . . . . . – 84,000 –(Gain) loss on asset disposals, net . . . . . . . . . . . . . . . . . . . . . . . 89 181 125
Operating income (loss) (GAAP) . . . . . . . . . . . . . . . . . . . . . . . . $ (15,436) $ (109,135) $ (20,130)
1 Income tax expense (benefit) is not provided at the individual segment level for Wireline, Cable and HMS. TDS calculates income tax expense for TDSTelecom in total.
Free Cash Flow and Adjusted Free Cash Flow
The following table presents Free cash flow and Adjusted free cash flow. Free cash flow is defined as Cash flows fromoperating activities less Cash used for additions to property, plant and equipment. Adjusted free cash flow is defined asCash flows from operating activities (which includes cash outflows related to the Sprint decommissioning), as adjustedfor cash proceeds from the Sprint Cost Reimbursement (which are included in Cash flows from investing activities in theConsolidated Statement of Cash Flows), less Cash used for additions to property, plant and equipment. Free cash flowand Adjusted free cash flow are non-GAAP financial measures which TDS believes may be useful to investors and otherusers of its financial information in evaluating the amount of cash generated by business operations (including cashproceeds from the Sprint Cost Reimbursement), after Cash used for additions to property, plant and equipment.
2015 2014 2013
(Dollars in thousands)Cash flows from operating activities . . . . . . . . . . . . . . . . . . . . . . . . $ 789,694 $ 394,812 $ 494,610Less: Cash used for additions to property, plant and equipment . . . . . . 800,628 799,496 883,797
Free cash flow . . . . . . . . . . . . . . . . . . . . . . . . . . . . . . . . . . . . $ (10,934) $ (404,684) $ (389,187)Add: Sprint Cost Reimbursement1 . . . . . . . . . . . . . . . . . . . . . . . . . 29,974 71,097 10,560
Adjusted free cash flow . . . . . . . . . . . . . . . . . . . . . . . . . . . . . . $ 19,040 $ (333,587) $ (378,627)
1 See Note 6 — Acquisitions, Divestitures and Exchanges in the Notes to Consolidated Financial Statements for additional information related to theSprint Cost Reimbursement.
57
MANAGEMENT’S DISCUSSION AND ANALYSIS OF FINANCIAL CONDITION AND RESULTS OF OPERATIONS
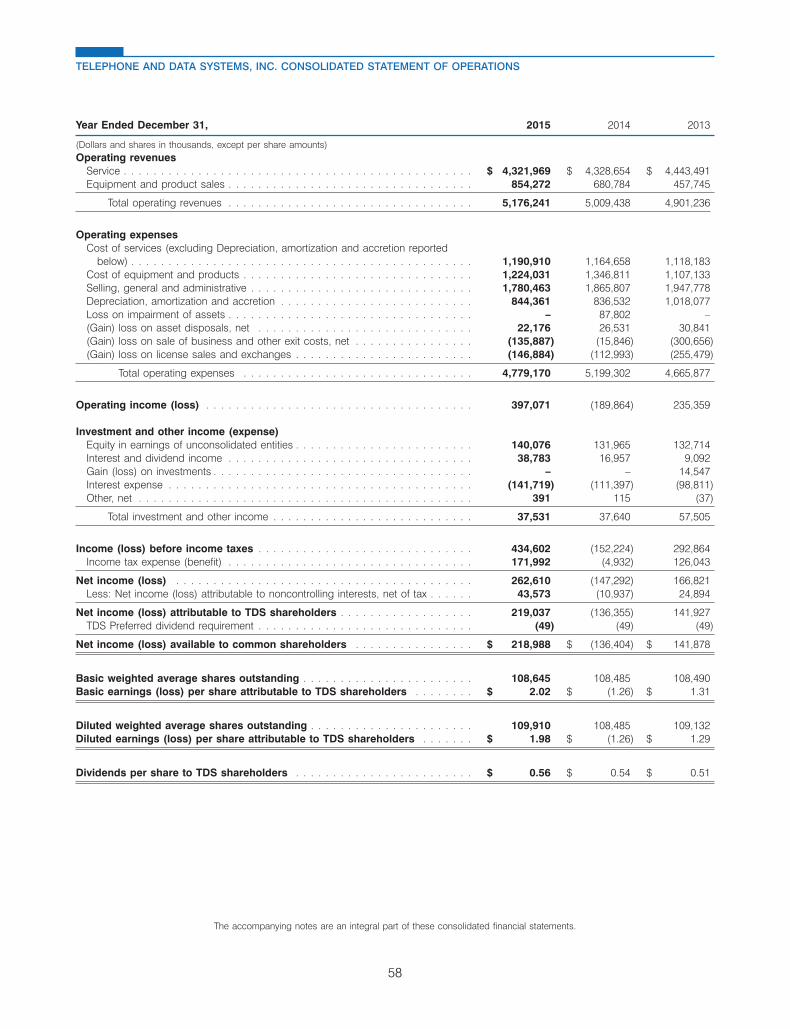
Year Ended December 31, 2015 2014 2013
(Dollars and shares in thousands, except per share amounts)Operating revenues
Service . . . . . . . . . . . . . . . . . . . . . . . . . . . . . . . . . . . . . . . . . . . . . . . $ 4,321,969 $ 4,328,654 $ 4,443,491Equipment and product sales . . . . . . . . . . . . . . . . . . . . . . . . . . . . . . . . . 854,272 680,784 457,745
Total operating revenues . . . . . . . . . . . . . . . . . . . . . . . . . . . . . . . . . 5,176,241 5,009,438 4,901,236
Operating expensesCost of services (excluding Depreciation, amortization and accretion reported
below) . . . . . . . . . . . . . . . . . . . . . . . . . . . . . . . . . . . . . . . . . . . . . . 1,190,910 1,164,658 1,118,183Cost of equipment and products . . . . . . . . . . . . . . . . . . . . . . . . . . . . . . . 1,224,031 1,346,811 1,107,133Selling, general and administrative . . . . . . . . . . . . . . . . . . . . . . . . . . . . . . 1,780,463 1,865,807 1,947,778Depreciation, amortization and accretion . . . . . . . . . . . . . . . . . . . . . . . . . . 844,361 836,532 1,018,077Loss on impairment of assets . . . . . . . . . . . . . . . . . . . . . . . . . . . . . . . . . – 87,802 –(Gain) loss on asset disposals, net . . . . . . . . . . . . . . . . . . . . . . . . . . . . . 22,176 26,531 30,841(Gain) loss on sale of business and other exit costs, net . . . . . . . . . . . . . . . . (135,887) (15,846) (300,656)(Gain) loss on license sales and exchanges . . . . . . . . . . . . . . . . . . . . . . . . (146,884) (112,993) (255,479)
Total operating expenses . . . . . . . . . . . . . . . . . . . . . . . . . . . . . . . 4,779,170 5,199,302 4,665,877
Operating income (loss) . . . . . . . . . . . . . . . . . . . . . . . . . . . . . . . . . . . . 397,071 (189,864) 235,359
Investment and other income (expense)Equity in earnings of unconsolidated entities . . . . . . . . . . . . . . . . . . . . . . . . 140,076 131,965 132,714Interest and dividend income . . . . . . . . . . . . . . . . . . . . . . . . . . . . . . . . . 38,783 16,957 9,092Gain (loss) on investments . . . . . . . . . . . . . . . . . . . . . . . . . . . . . . . . . . . – – 14,547Interest expense . . . . . . . . . . . . . . . . . . . . . . . . . . . . . . . . . . . . . . . . . (141,719) (111,397) (98,811)Other, net . . . . . . . . . . . . . . . . . . . . . . . . . . . . . . . . . . . . . . . . . . . . . 391 115 (37)
Total investment and other income . . . . . . . . . . . . . . . . . . . . . . . . . . . 37,531 37,640 57,505
Income (loss) before income taxes . . . . . . . . . . . . . . . . . . . . . . . . . . . . . 434,602 (152,224) 292,864Income tax expense (benefit) . . . . . . . . . . . . . . . . . . . . . . . . . . . . . . . . . 171,992 (4,932) 126,043
Net income (loss) . . . . . . . . . . . . . . . . . . . . . . . . . . . . . . . . . . . . . . . . 262,610 (147,292) 166,821Less: Net income (loss) attributable to noncontrolling interests, net of tax . . . . . . 43,573 (10,937) 24,894
Net income (loss) attributable to TDS shareholders . . . . . . . . . . . . . . . . . . 219,037 (136,355) 141,927TDS Preferred dividend requirement . . . . . . . . . . . . . . . . . . . . . . . . . . . . . (49) (49) (49)
Net income (loss) available to common shareholders . . . . . . . . . . . . . . . . $ 218,988 $ (136,404) $ 141,878
Basic weighted average shares outstanding . . . . . . . . . . . . . . . . . . . . . . . 108,645 108,485 108,490Basic earnings (loss) per share attributable to TDS shareholders . . . . . . . . $ 2.02 $ (1.26) $ 1.31
Diluted weighted average shares outstanding . . . . . . . . . . . . . . . . . . . . . . 109,910 108,485 109,132Diluted earnings (loss) per share attributable to TDS shareholders . . . . . . . $ 1.98 $ (1.26) $ 1.29
Dividends per share to TDS shareholders . . . . . . . . . . . . . . . . . . . . . . . . $ 0.56 $ 0.54 $ 0.51
The accompanying notes are an integral part of these consolidated financial statements.
58
TELEPHONE AND DATA SYSTEMS, INC. CONSOLIDATED STATEMENT OF OPERATIONS
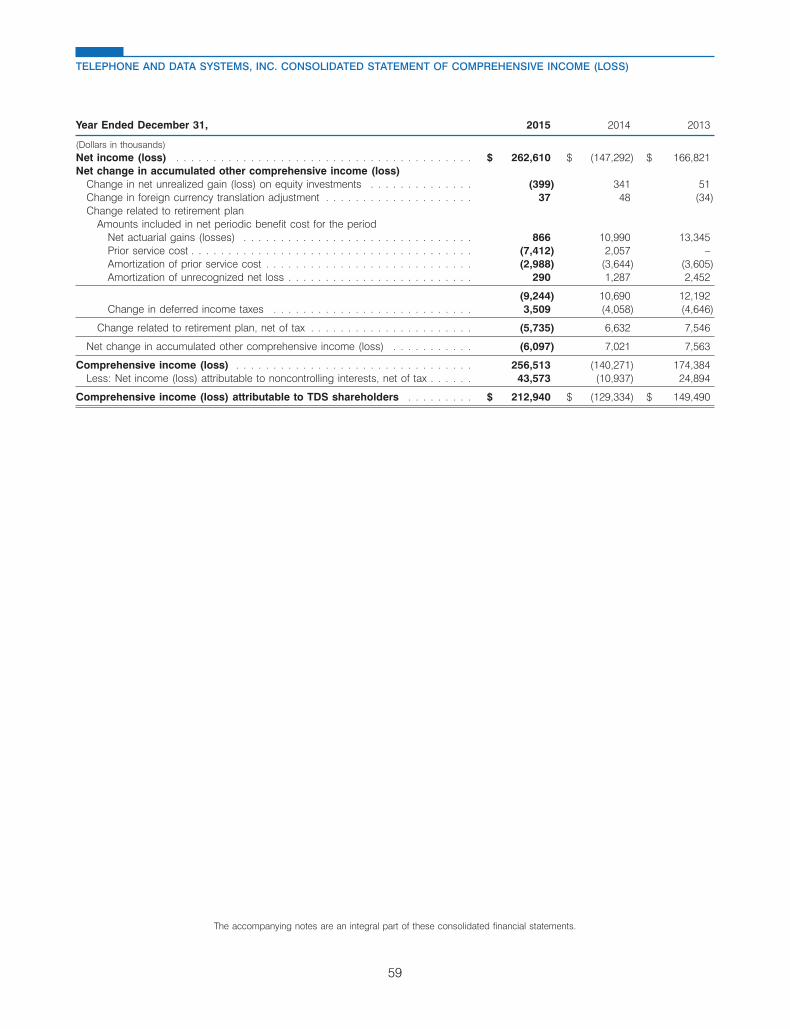
Year Ended December 31, 2015 2014 2013
(Dollars in thousands)Net income (loss) . . . . . . . . . . . . . . . . . . . . . . . . . . . . . . . . . . . . . . . . $ 262,610 $ (147,292) $ 166,821Net change in accumulated other comprehensive income (loss)
Change in net unrealized gain (loss) on equity investments . . . . . . . . . . . . . . (399) 341 51Change in foreign currency translation adjustment . . . . . . . . . . . . . . . . . . . . 37 48 (34)Change related to retirement plan
Amounts included in net periodic benefit cost for the periodNet actuarial gains (losses) . . . . . . . . . . . . . . . . . . . . . . . . . . . . . . . 866 10,990 13,345Prior service cost . . . . . . . . . . . . . . . . . . . . . . . . . . . . . . . . . . . . . . (7,412) 2,057 –Amortization of prior service cost . . . . . . . . . . . . . . . . . . . . . . . . . . . . (2,988) (3,644) (3,605)Amortization of unrecognized net loss . . . . . . . . . . . . . . . . . . . . . . . . . 290 1,287 2,452
(9,244) 10,690 12,192Change in deferred income taxes . . . . . . . . . . . . . . . . . . . . . . . . . . . 3,509 (4,058) (4,646)
Change related to retirement plan, net of tax . . . . . . . . . . . . . . . . . . . . . . (5,735) 6,632 7,546
Net change in accumulated other comprehensive income (loss) . . . . . . . . . . . (6,097) 7,021 7,563
Comprehensive income (loss) . . . . . . . . . . . . . . . . . . . . . . . . . . . . . . . . 256,513 (140,271) 174,384Less: Net income (loss) attributable to noncontrolling interests, net of tax . . . . . . 43,573 (10,937) 24,894
Comprehensive income (loss) attributable to TDS shareholders . . . . . . . . . $ 212,940 $ (129,334) $ 149,490
The accompanying notes are an integral part of these consolidated financial statements.
59
TELEPHONE AND DATA SYSTEMS, INC. CONSOLIDATED STATEMENT OF COMPREHENSIVE INCOME (LOSS)
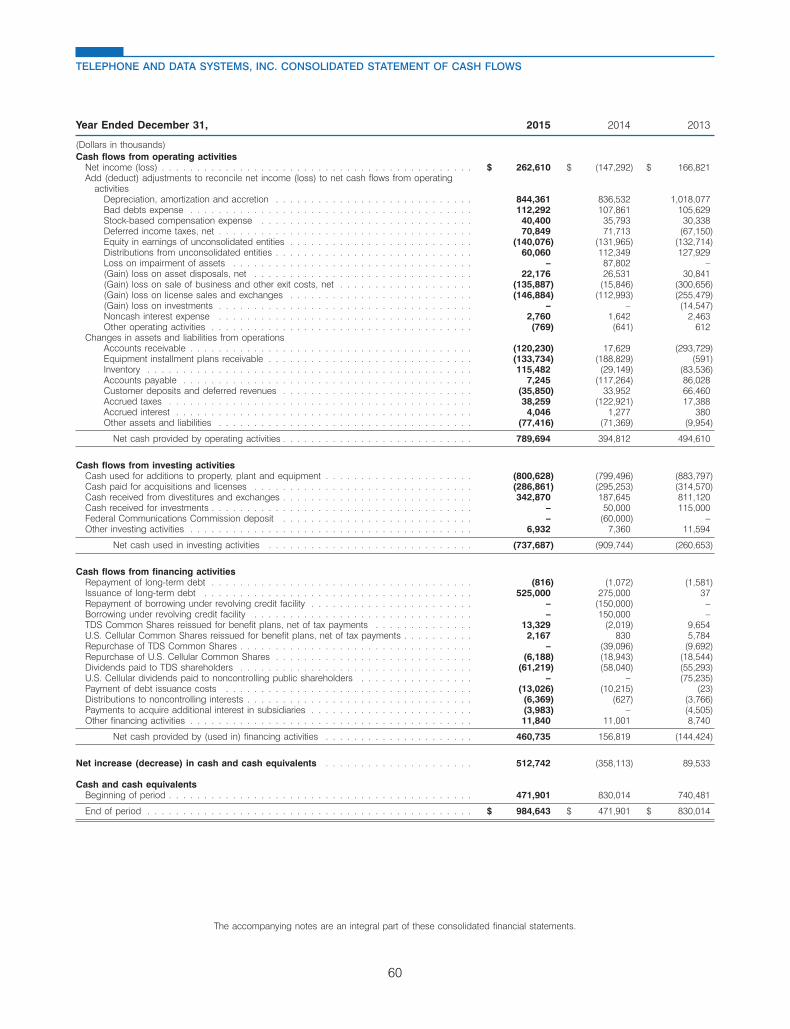
Year Ended December 31, 2015 2014 2013
(Dollars in thousands)Cash flows from operating activities
Net income (loss) . . . . . . . . . . . . . . . . . . . . . . . . . . . . . . . . . . . . . . . . . . . . $ 262,610 $ (147,292) $ 166,821Add (deduct) adjustments to reconcile net income (loss) to net cash flows from operating
activitiesDepreciation, amortization and accretion . . . . . . . . . . . . . . . . . . . . . . . . . . . . 844,361 836,532 1,018,077Bad debts expense . . . . . . . . . . . . . . . . . . . . . . . . . . . . . . . . . . . . . . . . 112,292 107,861 105,629Stock-based compensation expense . . . . . . . . . . . . . . . . . . . . . . . . . . . . . . 40,400 35,793 30,338Deferred income taxes, net . . . . . . . . . . . . . . . . . . . . . . . . . . . . . . . . . . . . 70,849 71,713 (67,150)Equity in earnings of unconsolidated entities . . . . . . . . . . . . . . . . . . . . . . . . . . (140,076) (131,965) (132,714)Distributions from unconsolidated entities . . . . . . . . . . . . . . . . . . . . . . . . . . . . 60,060 112,349 127,929Loss on impairment of assets . . . . . . . . . . . . . . . . . . . . . . . . . . . . . . . . . . – 87,802 –(Gain) loss on asset disposals, net . . . . . . . . . . . . . . . . . . . . . . . . . . . . . . . 22,176 26,531 30,841(Gain) loss on sale of business and other exit costs, net . . . . . . . . . . . . . . . . . . . (135,887) (15,846) (300,656)(Gain) loss on license sales and exchanges . . . . . . . . . . . . . . . . . . . . . . . . . . (146,884) (112,993) (255,479)(Gain) loss on investments . . . . . . . . . . . . . . . . . . . . . . . . . . . . . . . . . . . . – – (14,547)Noncash interest expense . . . . . . . . . . . . . . . . . . . . . . . . . . . . . . . . . . . . 2,760 1,642 2,463Other operating activities . . . . . . . . . . . . . . . . . . . . . . . . . . . . . . . . . . . . . (769) (641) 612
Changes in assets and liabilities from operationsAccounts receivable . . . . . . . . . . . . . . . . . . . . . . . . . . . . . . . . . . . . . . . . (120,230) 17,629 (293,729)Equipment installment plans receivable . . . . . . . . . . . . . . . . . . . . . . . . . . . . . (133,734) (188,829) (591)Inventory . . . . . . . . . . . . . . . . . . . . . . . . . . . . . . . . . . . . . . . . . . . . . . 115,482 (29,149) (83,536)Accounts payable . . . . . . . . . . . . . . . . . . . . . . . . . . . . . . . . . . . . . . . . . 7,245 (117,264) 86,028Customer deposits and deferred revenues . . . . . . . . . . . . . . . . . . . . . . . . . . . (35,850) 33,952 66,460Accrued taxes . . . . . . . . . . . . . . . . . . . . . . . . . . . . . . . . . . . . . . . . . . . 38,259 (122,921) 17,388Accrued interest . . . . . . . . . . . . . . . . . . . . . . . . . . . . . . . . . . . . . . . . . . 4,046 1,277 380Other assets and liabilities . . . . . . . . . . . . . . . . . . . . . . . . . . . . . . . . . . . . (77,416) (71,369) (9,954)
Net cash provided by operating activities . . . . . . . . . . . . . . . . . . . . . . . . . . . 789,694 394,812 494,610
Cash flows from investing activitiesCash used for additions to property, plant and equipment . . . . . . . . . . . . . . . . . . . . . (800,628) (799,496) (883,797)Cash paid for acquisitions and licenses . . . . . . . . . . . . . . . . . . . . . . . . . . . . . . . (286,861) (295,253) (314,570)Cash received from divestitures and exchanges . . . . . . . . . . . . . . . . . . . . . . . . . . . 342,870 187,645 811,120Cash received for investments . . . . . . . . . . . . . . . . . . . . . . . . . . . . . . . . . . . . . – 50,000 115,000Federal Communications Commission deposit . . . . . . . . . . . . . . . . . . . . . . . . . . . – (60,000) –Other investing activities . . . . . . . . . . . . . . . . . . . . . . . . . . . . . . . . . . . . . . . . 6,932 7,360 11,594
Net cash used in investing activities . . . . . . . . . . . . . . . . . . . . . . . . . . . . . (737,687) (909,744) (260,653)
Cash flows from financing activitiesRepayment of long-term debt . . . . . . . . . . . . . . . . . . . . . . . . . . . . . . . . . . . . . (816) (1,072) (1,581)Issuance of long-term debt . . . . . . . . . . . . . . . . . . . . . . . . . . . . . . . . . . . . . . 525,000 275,000 37Repayment of borrowing under revolving credit facility . . . . . . . . . . . . . . . . . . . . . . . – (150,000) –Borrowing under revolving credit facility . . . . . . . . . . . . . . . . . . . . . . . . . . . . . . . – 150,000 –TDS Common Shares reissued for benefit plans, net of tax payments . . . . . . . . . . . . . . 13,329 (2,019) 9,654U.S. Cellular Common Shares reissued for benefit plans, net of tax payments . . . . . . . . . . 2,167 830 5,784Repurchase of TDS Common Shares . . . . . . . . . . . . . . . . . . . . . . . . . . . . . . . . . – (39,096) (9,692)Repurchase of U.S. Cellular Common Shares . . . . . . . . . . . . . . . . . . . . . . . . . . . . (6,188) (18,943) (18,544)Dividends paid to TDS shareholders . . . . . . . . . . . . . . . . . . . . . . . . . . . . . . . . . (61,219) (58,040) (55,293)U.S. Cellular dividends paid to noncontrolling public shareholders . . . . . . . . . . . . . . . . – – (75,235)Payment of debt issuance costs . . . . . . . . . . . . . . . . . . . . . . . . . . . . . . . . . . . (13,026) (10,215) (23)Distributions to noncontrolling interests . . . . . . . . . . . . . . . . . . . . . . . . . . . . . . . . (6,369) (627) (3,766)Payments to acquire additional interest in subsidiaries . . . . . . . . . . . . . . . . . . . . . . . (3,983) – (4,505)Other financing activities . . . . . . . . . . . . . . . . . . . . . . . . . . . . . . . . . . . . . . . . 11,840 11,001 8,740
Net cash provided by (used in) financing activities . . . . . . . . . . . . . . . . . . . . . 460,735 156,819 (144,424)
Net increase (decrease) in cash and cash equivalents . . . . . . . . . . . . . . . . . . . . . 512,742 (358,113) 89,533
Cash and cash equivalentsBeginning of period . . . . . . . . . . . . . . . . . . . . . . . . . . . . . . . . . . . . . . . . . . . 471,901 830,014 740,481
End of period . . . . . . . . . . . . . . . . . . . . . . . . . . . . . . . . . . . . . . . . . . . . . . $ 984,643 $ 471,901 $ 830,014
The accompanying notes are an integral part of these consolidated financial statements.
60
TELEPHONE AND DATA SYSTEMS, INC. CONSOLIDATED STATEMENT OF CASH FLOWS
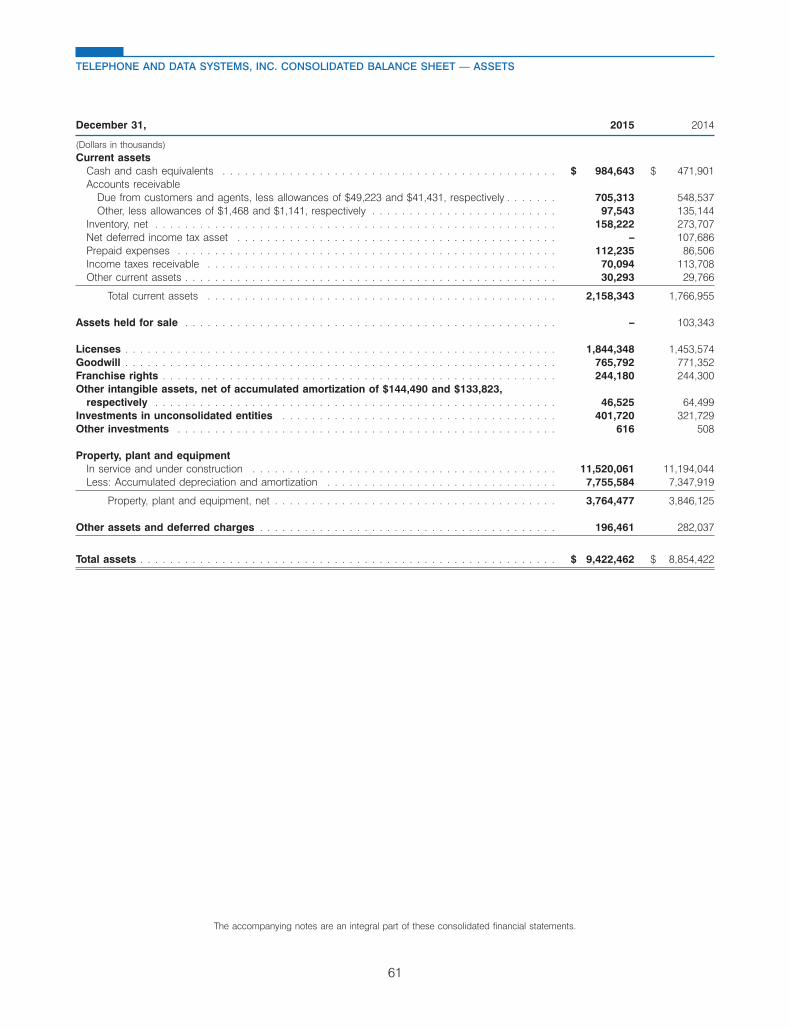
December 31, 2015 2014
(Dollars in thousands)Current assets
Cash and cash equivalents . . . . . . . . . . . . . . . . . . . . . . . . . . . . . . . . . . . . . . . . . . . . . $ 984,643 $ 471,901Accounts receivable
Due from customers and agents, less allowances of $49,223 and $41,431, respectively . . . . . . . 705,313 548,537Other, less allowances of $1,468 and $1,141, respectively . . . . . . . . . . . . . . . . . . . . . . . . . 97,543 135,144
Inventory, net . . . . . . . . . . . . . . . . . . . . . . . . . . . . . . . . . . . . . . . . . . . . . . . . . . . . . . 158,222 273,707Net deferred income tax asset . . . . . . . . . . . . . . . . . . . . . . . . . . . . . . . . . . . . . . . . . . . – 107,686Prepaid expenses . . . . . . . . . . . . . . . . . . . . . . . . . . . . . . . . . . . . . . . . . . . . . . . . . . . 112,235 86,506Income taxes receivable . . . . . . . . . . . . . . . . . . . . . . . . . . . . . . . . . . . . . . . . . . . . . . . 70,094 113,708Other current assets . . . . . . . . . . . . . . . . . . . . . . . . . . . . . . . . . . . . . . . . . . . . . . . . . . 30,293 29,766
Total current assets . . . . . . . . . . . . . . . . . . . . . . . . . . . . . . . . . . . . . . . . . . . . . . . 2,158,343 1,766,955
Assets held for sale . . . . . . . . . . . . . . . . . . . . . . . . . . . . . . . . . . . . . . . . . . . . . . . . . . – 103,343
Licenses . . . . . . . . . . . . . . . . . . . . . . . . . . . . . . . . . . . . . . . . . . . . . . . . . . . . . . . . . . 1,844,348 1,453,574Goodwill . . . . . . . . . . . . . . . . . . . . . . . . . . . . . . . . . . . . . . . . . . . . . . . . . . . . . . . . . . 765,792 771,352Franchise rights . . . . . . . . . . . . . . . . . . . . . . . . . . . . . . . . . . . . . . . . . . . . . . . . . . . . . 244,180 244,300Other intangible assets, net of accumulated amortization of $144,490 and $133,823,
respectively . . . . . . . . . . . . . . . . . . . . . . . . . . . . . . . . . . . . . . . . . . . . . . . . . . . . . . 46,525 64,499Investments in unconsolidated entities . . . . . . . . . . . . . . . . . . . . . . . . . . . . . . . . . . . . . 401,720 321,729Other investments . . . . . . . . . . . . . . . . . . . . . . . . . . . . . . . . . . . . . . . . . . . . . . . . . . . 616 508
Property, plant and equipmentIn service and under construction . . . . . . . . . . . . . . . . . . . . . . . . . . . . . . . . . . . . . . . . . 11,520,061 11,194,044Less: Accumulated depreciation and amortization . . . . . . . . . . . . . . . . . . . . . . . . . . . . . . . 7,755,584 7,347,919
Property, plant and equipment, net . . . . . . . . . . . . . . . . . . . . . . . . . . . . . . . . . . . . . . 3,764,477 3,846,125
Other assets and deferred charges . . . . . . . . . . . . . . . . . . . . . . . . . . . . . . . . . . . . . . . . 196,461 282,037
Total assets . . . . . . . . . . . . . . . . . . . . . . . . . . . . . . . . . . . . . . . . . . . . . . . . . . . . . . . . $ 9,422,462 $ 8,854,422
The accompanying notes are an integral part of these consolidated financial statements.
61
TELEPHONE AND DATA SYSTEMS, INC. CONSOLIDATED BALANCE SHEET — ASSETS

December 31, 2015 2014
(Dollars and shares in thousands)Current liabilities
Current portion of long-term debt . . . . . . . . . . . . . . . . . . . . . . . . . . . . . . . . . . . . . . . . . $ 14,306 $ 808Accounts payable . . . . . . . . . . . . . . . . . . . . . . . . . . . . . . . . . . . . . . . . . . . . . . . . . . . 348,737 387,125Customer deposits and deferred revenues . . . . . . . . . . . . . . . . . . . . . . . . . . . . . . . . . . . 288,412 324,318Accrued interest . . . . . . . . . . . . . . . . . . . . . . . . . . . . . . . . . . . . . . . . . . . . . . . . . . . . 11,962 7,919Accrued taxes . . . . . . . . . . . . . . . . . . . . . . . . . . . . . . . . . . . . . . . . . . . . . . . . . . . . . 40,569 46,734Accrued compensation . . . . . . . . . . . . . . . . . . . . . . . . . . . . . . . . . . . . . . . . . . . . . . . 113,375 114,549Other current liabilities . . . . . . . . . . . . . . . . . . . . . . . . . . . . . . . . . . . . . . . . . . . . . . . . 127,023 181,803
Total current liabilities . . . . . . . . . . . . . . . . . . . . . . . . . . . . . . . . . . . . . . . . . . . . . . . 944,384 1,063,256
Liabilities held for sale . . . . . . . . . . . . . . . . . . . . . . . . . . . . . . . . . . . . . . . . . . . . . . . . – 21,643
Deferred liabilities and creditsNet deferred income tax liability . . . . . . . . . . . . . . . . . . . . . . . . . . . . . . . . . . . . . . . . . . 900,054 941,519Other deferred liabilities and credits . . . . . . . . . . . . . . . . . . . . . . . . . . . . . . . . . . . . . . . . 432,949 430,774
Long-term debt, net . . . . . . . . . . . . . . . . . . . . . . . . . . . . . . . . . . . . . . . . . . . . . . . . . . 2,439,827 1,941,069
Commitments and contingencies . . . . . . . . . . . . . . . . . . . . . . . . . . . . . . . . . . . . . . . . . – –
Noncontrolling interests with redemption features . . . . . . . . . . . . . . . . . . . . . . . . . . . . . 1,097 1,150
EquityTDS shareholders’ equity
Series A Common and Common SharesAuthorized 290,000 shares (25,000 Series A Common and 265,000 Common Shares)Issued 132,782 shares (7,211 Series A Common and 125,571 Common Shares) and 132,749
shares (7,179 Series A Common, and 125,570 Common Shares), respectivelyOutstanding 108,966 shares (7,211 Series A Common and 101,755 Common Shares) and
107,899 shares (7,179 Series A Common, and 100,720 Common Shares), respectivelyPar Value ($.01 per share) of $1,328 ($72 Series A Common and $1,256 Common Shares)
and of $1,327 ($72 Series A Common and $1,255 Common Shares), respectively . . . . . . . 1,328 1,327Capital in excess of par value . . . . . . . . . . . . . . . . . . . . . . . . . . . . . . . . . . . . . . . . . . 2,363,558 2,336,511Treasury shares at cost:
23,816 and 24,850 Common Shares, respectively . . . . . . . . . . . . . . . . . . . . . . . . . . . . (727,182) (748,199)Accumulated other comprehensive income . . . . . . . . . . . . . . . . . . . . . . . . . . . . . . . . . . 355 6,452Retained earnings . . . . . . . . . . . . . . . . . . . . . . . . . . . . . . . . . . . . . . . . . . . . . . . . . 2,487,491 2,330,187
Total TDS shareholders’ equity . . . . . . . . . . . . . . . . . . . . . . . . . . . . . . . . . . . . . . . 4,125,550 3,926,278
Preferred shares . . . . . . . . . . . . . . . . . . . . . . . . . . . . . . . . . . . . . . . . . . . . . . . . . . . . 824 824Noncontrolling interests . . . . . . . . . . . . . . . . . . . . . . . . . . . . . . . . . . . . . . . . . . . . . . . 577,777 527,909
Total equity . . . . . . . . . . . . . . . . . . . . . . . . . . . . . . . . . . . . . . . . . . . . . . . . . . . . . 4,704,151 4,455,011
Total liabilities and equity . . . . . . . . . . . . . . . . . . . . . . . . . . . . . . . . . . . . . . . . . . . . . . $ 9,422,462 $ 8,854,422
The accompanying notes are an integral part of these consolidated financial statements.
62
TELEPHONE AND DATA SYSTEMS, INC. CONSOLIDATED BALANCE SHEET — LIABILITIES AND EQUITY

63
TDS
Shar
ehol
ders
Serie
s A
Com
mon
Accu
mul
ated
and
Cap
ital i
not
her
Tota
l TD
SC
omm
onex
cess
of
Trea
sury
com
preh
ensi
veR
etai
ned
shar
ehol
ders
’Pr
efer
red
Non
cont
rolli
ngsh
ares
par
valu
esh
ares
inco
me
(loss
)ea
rnin
gseq
uity
shar
esin
tere
sts
Tota
l equ
ity
(Dol
lars
in t
hous
ands
)D
ecem
ber
31,
2014
..
..
..
..
..
..
..
..
..
$1,
327
$2,
336,
511
$(7
48,1
99)
$6,
452
$2,
330,
187
$3,
926,
278
$82
4$
527,
909
$4,
455,
011
Add
(D
educ
t)N
et in
com
e at
tribu
tabl
e to
TD
S sh
areh
olde
rs.
..
––
––
219,
037
219,
037
––
219,
037
Net
inco
me
attri
buta
ble
to n
onco
ntro
lling
inte
rest
scl
assi
fied
as e
quity
..
..
..
..
..
..
..
..
.–
––
––
––
37,9
6637
,966
Oth
er c
ompr
ehen
sive
inco
me
..
..
..
..
..
..
––
–(6
,097
)–
(6,0
97)
––
(6,0
97)
TDS
Com
mon
and
Ser
ies
A C
omm
on s
hare
divi
dend
s.
..
..
..
..
..
..
..
..
..
..
..
––
––
(61,
170)
(61,
170)
––
(61,
170)
TDS
Pref
erre
d di
vide
nd r
equi
rem
ent.
..
..
..
..
––
––
(49)
(49)
––
(49)
Div
iden
d re
inve
stm
ent
plan
..
..
..
..
..
..
..
13,
069
8,60
7–
–11
,677
––
11,6
77In
cent
ive
and
com
pens
atio
n pl
ans
..
..
..
..
..
–1,
672
12,4
10–
(514
)13
,568
––
13,5
68A
djus
t in
vest
men
t in
sub
sidi
arie
s fo
r re
purc
hase
s,is
suan
ces
and
othe
r co
mpe
nsat
ion
plan
s.
..
.–
6,11
5–
––
6,11
5–
12,6
1018
,725
Stoc
k-ba
sed
com
pens
atio
n aw
ards
..
..
..
..
.–
16,0
74–
––
16,0
74–
–16
,074
Tax
win
dfal
l (sh
ortfa
ll) f
rom
sto
ck a
war
ds.
..
..
.–
117
––
–11
7–
–11
7D
istri
butio
ns t
o no
ncon
trolli
ng in
tere
sts
..
..
..
.–
––
––
––
(708
)(7
08)
Dec
embe
r 31
, 20
15.
..
..
..
..
..
..
..
..
.$
1,32
8$
2,36
3,55
8$
(727
,182
)$
355
$2,
487,
491
$4,
125,
550
$82
4$
577,
777
$4,
704,
151
The
acco
mpa
nyin
g no
tes
are
an in
tegr
al p
art
of t
hese
con
solid
ated
fin
anci
al s
tate
men
ts.
TELE
PH
ON
E A
ND
DA
TA S
YS
TEM
S,
INC
. C
ON
SO
LID
ATE
D S
TATE
ME
NT
OF
CH
AN
GE
S I
N E
QU
ITY

64
TDS
Shar
ehol
ders
Serie
s A
Com
mon
Accu
mul
ated
and
Cap
ital i
not
her
Tota
l TD
SC
omm
onex
cess
of
Trea
sury
com
preh
ensi
veR
etai
ned
shar
ehol
ders
’Pr
efer
red
Non
cont
rolli
ngsh
ares
par
valu
esh
ares
inco
me
(loss
)ea
rnin
gseq
uity
shar
esin
tere
sts
Tota
l equ
ity
(Dol
lars
in t
hous
ands
)D
ecem
ber
31,
2013
..
..
..
..
..
..
..
..
..
$1,
327
$2,
308,
807
$(7
21,3
54)
$(5
69)
$2,
529,
626
$4,
117,
837
$82
4$
551,
436
$4,
670,
097
Add
(D
educ
t)N
et lo
ss a
ttrib
utab
le t
o TD
S sh
areh
olde
rs.
..
..
––
––
(136
,355
)(1
36,3
55)
––
(136
,355
)N
et lo
ss a
ttrib
utab
le t
o no
ncon
trolli
ng in
tere
sts
clas
sifie
d as
equ
ity.
..
..
..
..
..
..
..
..
––
––
––
–(1
1,61
4)(1
1,61
4)O
ther
com
preh
ensi
ve in
com
e.
..
..
..
..
..
.–
––
7,02
1–
7,02
1–
–7,
021
TDS
Com
mon
and
Ser
ies
A C
omm
on S
hare
divi
dend
s.
..
..
..
..
..
..
..
..
..
..
..
––
––
(57,
991)
(57,
991)
––
(57,
991)
TDS
Pref
erre
d di
vide
nd r
equi
rem
ent.
..
..
..
..
––
––
(49)
(49)
––
(49)
Rep
urch
ase
of C
omm
on S
hare
s.
..
..
..
..
..
––
(39,
096)
––
(39,
096)
––
(39,
096)
Div
iden
d re
inve
stm
ent
plan
..
..
..
..
..
..
..
–2,
702
7,09
3–
–9,
795
––
9,79
5In
cent
ive
and
com
pens
atio
n pl
ans
..
..
..
..
..
–(1
,580
)5,
158
–(5
,044
)(1
,466
)–
–(1
,466
)A
djus
t in
vest
men
t in
sub
sidi
arie
s fo
r re
purc
hase
s,is
suan
ces
and
othe
r co
mpe
nsat
ion
plan
s.
..
.–
12,0
72–
––
12,0
72–
(11,
349)
723
Stoc
k-ba
sed
com
pens
atio
n aw
ards
..
..
..
..
.–
14,1
82–
––
14,1
82–
–14
,182
Tax
win
dfal
l (sh
ortfa
ll) f
rom
sto
ck a
war
ds.
..
..
.–
328
––
–32
8–
–32
8D
istri
butio
ns t
o no
ncon
trolli
ng in
tere
sts
..
..
..
.–
––
––
––
(564
)(5
64)
Dec
embe
r 31
, 20
14.
..
..
..
..
..
..
..
..
.$
1,32
7$
2,33
6,51
1$
(748
,199
)$
6,45
2$
2,33
0,18
7$
3,92
6,27
8$
824
$52
7,90
9$
4,45
5,01
1
The
acco
mpa
nyin
g no
tes
are
an in
tegr
al p
art
of t
hese
con
solid
ated
fin
anci
al s
tate
men
ts.
TELE
PH
ON
E A
ND
DA
TA S
YS
TEM
S,
INC
. C
ON
SO
LID
ATE
D S
TATE
ME
NT
OF
CH
AN
GE
S I
N E
QU
ITY
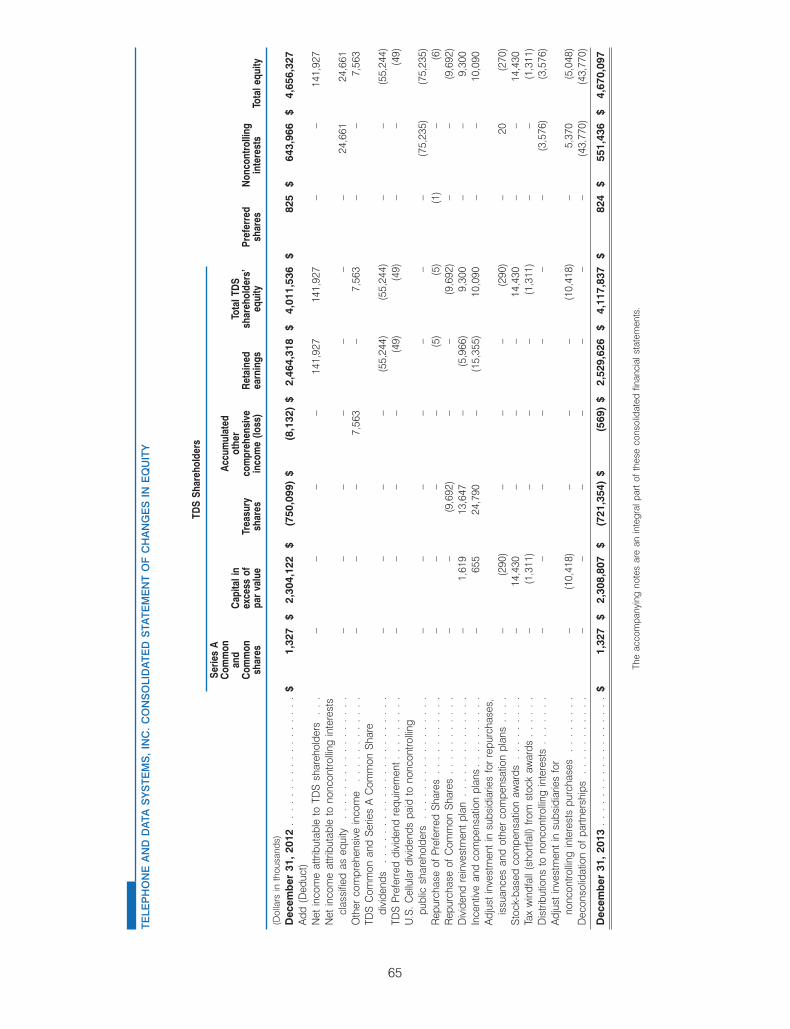
65
TDS
Shar
ehol
ders
Serie
s A
Com
mon
Accu
mul
ated
and
Cap
ital i
not
her
Tota
l TD
SC
omm
onex
cess
of
Trea
sury
com
preh
ensi
veR
etai
ned
shar
ehol
ders
’Pr
efer
red
Non
cont
rolli
ngsh
ares
par
valu
esh
ares
inco
me
(loss
)ea
rnin
gseq
uity
shar
esin
tere
sts
Tota
l equ
ity
(Dol
lars
in t
hous
ands
)D
ecem
ber
31,
2012
..
..
..
..
..
..
..
..
..
$1,
327
$2,
304,
122
$(7
50,0
99)
$(8
,132
)$
2,46
4,31
8$
4,01
1,53
6$
825
$64
3,96
6$
4,65
6,32
7A
dd (
Ded
uct)
Net
inco
me
attri
buta
ble
to T
DS
shar
ehol
ders
..
.–
––
–14
1,92
714
1,92
7–
–14
1,92
7N
et in
com
e at
tribu
tabl
e to
non
cont
rolli
ng in
tere
sts
clas
sifie
d as
equ
ity.
..
..
..
..
..
..
..
..
––
––
––
–24
,661
24,6
61O
ther
com
preh
ensi
ve in
com
e.
..
..
..
..
..
.–
––
7,56
3–
7,56
3–
–7,
563
TDS
Com
mon
and
Ser
ies
A C
omm
on S
hare
divi
dend
s.
..
..
..
..
..
..
..
..
..
..
..
––
––
(55,
244)
(55,
244)
––
(55,
244)
TDS
Pref
erre
d di
vide
nd r
equi
rem
ent.
..
..
..
..
––
––
(49)
(49)
––
(49)
U.S
. C
ellu
lar
divi
dend
s pa
id t
o no
ncon
trolli
ngpu
blic
sha
reho
lder
s.
..
..
..
..
..
..
..
..
––
––
––
–(7
5,23
5)(7
5,23
5)R
epur
chas
e of
Pre
ferre
d Sh
ares
..
..
..
..
..
.–
––
–(5
)(5
)(1
)–
(6)
Rep
urch
ase
of C
omm
on S
hare
s.
..
..
..
..
..
––
(9,6
92)
––
(9,6
92)
––
(9,6
92)
Div
iden
d re
inve
stm
ent
plan
..
..
..
..
..
..
..
–1,
619
13,6
47–
(5,9
66)
9,30
0–
–9,
300
Ince
ntiv
e an
d co
mpe
nsat
ion
plan
s.
..
..
..
..
.–
655
24,7
90–
(15,
355)
10,0
90–
–10
,090
Adj
ust
inve
stm
ent
in s
ubsi
diar
ies
for
repu
rcha
ses,
issu
ance
s an
d ot
her
com
pens
atio
n pl
ans
..
..
–(2
90)
––
–(2
90)
–20
(270
)St
ock-
base
d co
mpe
nsat
ion
awar
ds.
..
..
..
..
–14
,430
––
–14
,430
––
14,4
30Ta
x w
indf
all (
shor
tfall)
fro
m s
tock
aw
ards
..
..
..
–(1
,311
)–
––
(1,3
11)
––
(1,3
11)
Dis
tribu
tions
to
nonc
ontro
lling
inte
rest
s.
..
..
..
––
––
––
–(3
,576
)(3
,576
)A
djus
t in
vest
men
t in
sub
sidi
arie
s fo
rno
ncon
trolli
ng in
tere
sts
purc
hase
s.
..
..
..
.–
(10,
418)
––
–(1
0,41
8)–
5,37
0(5
,048
)D
econ
solid
atio
n of
par
tner
ship
s.
..
..
..
..
..
––
––
––
–(4
3,77
0)(4
3,77
0)
Dec
embe
r 31
, 20
13.
..
..
..
..
..
..
..
..
.$
1,32
7$
2,30
8,80
7$
(721
,354
)$
(569
)$
2,52
9,62
6$
4,11
7,83
7$
824
$55
1,43
6$
4,67
0,09
7
The
acco
mpa
nyin
g no
tes
are
an in
tegr
al p
art
of t
hese
con
solid
ated
fin
anci
al s
tate
men
ts.
TELE
PH
ON
E A
ND
DA
TA S
YS
TEM
S,
INC
. C
ON
SO
LID
ATE
D S
TATE
ME
NT
OF
CH
AN
GE
S I
N E
QU
ITY

NOTE 1 SUMMARY OF SIGNIFICANT ACCOUNTING POLICIES ANDRECENT ACCOUNTING PRONOUNCEMENTSNature of Operations
Telephone and Data Systems, Inc. (‘‘TDS’’) is a diversified telecommunications company providing high-quality servicesto approximately 4.9 million wireless customers and 1.2 million wireline and cable connections at December 31, 2015.TDS conducts all of its wireless operations through its 84%-owned subsidiary, United States Cellular Corporation (‘‘U.S.Cellular’’). TDS provides broadband, video, voice and hosted and managed services through its wholly-ownedsubsidiary, TDS Telecommunications Corporation (‘‘TDS Telecom’’).
TDS has the following reportable segments: U.S. Cellular, Wireline, Cable, and Hosted and Managed Services (‘‘HMS’’)operations. TDS’ non-reportable other business activities are presented as ‘‘Corporate, Eliminations and Other’’. Thisincludes the operations of TDS’ wholly-owned subsidiary Suttle-Straus, Inc. (‘‘Suttle-Straus’’). Suttle-Straus’ financialresults were not significant to TDS’ operations. All of TDS’ segments operate only in the United States, except for HMS,which includes an insignificant foreign operation. See Note 18 — Business Segment Information for summary financialinformation on each business segment.
Principles of Consolidation
The accounting policies of TDS conform to accounting principles generally accepted in the United States of America(‘‘GAAP’’) as set forth in the Financial Accounting Standards Board (‘‘FASB’’) Accounting Standards Codification(‘‘ASC’’). Unless otherwise specified, references to accounting provisions and GAAP in these notes refer to therequirements of the FASB ASC. The consolidated financial statements include the accounts of TDS, its majority-ownedsubsidiaries, general partnerships in which it has a majority partnership interest and variable interest entities (‘‘VIEs’’) inwhich TDS is the primary beneficiary. Both VIE and primary beneficiary represent terms defined by GAAP.
Intercompany accounts and transactions have been eliminated.
Reclassifications
Certain prior year amounts have been reclassified to conform to the 2015 financial statement presentation. In the fourthquarter of 2015, TDS adopted, on a retrospective basis, Accounting Standards Update 2015-03, Simplifying thePresentation of Debt Issuance Costs (‘‘ASU 2015-03’’). See discussion of ASU 2015-03 below under Debt IssuanceCosts.
Use of Estimates
The preparation of consolidated financial statements in conformity with GAAP requires management to make estimatesand assumptions that affect (a) the reported amounts of assets and liabilities and disclosure of contingent assets andliabilities at the date of the financial statements and (b) the reported amounts of revenues and expenses during thereported period. Actual results could differ from those estimates. Significant estimates are involved in accounting forgoodwill and indefinite-lived intangible assets, income taxes and equipment installment plans.
Cash and Cash Equivalents
Cash and cash equivalents include cash and highly liquid investments with original maturities of three months or less.
Accounts Receivable and Allowance for Doubtful Accounts
U.S. Cellular’s accounts receivable consist primarily of amounts owed by customers for wireless services and equipmentsales, including sales of certain devices under equipment installment plans through its owned and agent distributionchannels, by agents for sales of equipment to them and by other wireless carriers whose customers have used U.S.Cellular’s wireless systems.
TDS Telecom’s accounts receivable primarily consist of amounts owed by customers for services and products provided,by interexchange carriers for long-distance traffic which TDS Telecom carries on its network, and by interstate andintrastate revenue pools that distribute access charges.
The allowance for doubtful accounts is the best estimate of the amount of probable credit losses related to existingbilled and unbilled accounts receivable. The allowance is estimated based on historical experience, account aging and
66
TELEPHONE AND DATA SYSTEMS, INC. NOTES TO CONSOLIDATED FINANCIAL STATEMENTS

other factors that could affect collectability. Accounts receivable balances are reviewed on either an aggregate orindividual basis for collectability depending on the type of receivable. When it is probable that an account balance willnot be collected, the account balance is charged against the allowance for doubtful accounts. TDS does not have anyoff-balance sheet credit exposure related to its customers.
The changes in the allowance for doubtful accounts during 2015, 2014 and 2013 were as follows:
2015 2014 2013
(Dollars in thousands)Balance at beginning of year . . . . . . . . . . . . . . . . . . . . . . . . . . . . . . . . . . . $ 48,637 $ 65,604 $ 33,415
Additions, net of recoveries . . . . . . . . . . . . . . . . . . . . . . . . . . . . . . . . . . 112,292 107,861 105,629Deductions . . . . . . . . . . . . . . . . . . . . . . . . . . . . . . . . . . . . . . . . . . . . (104,701) (124,828) (73,440)
Balance at end of year1 . . . . . . . . . . . . . . . . . . . . . . . . . . . . . . . . . . . . . . $ 56,228 $ 48,637 $ 65,604
1 In 2015 and 2014, balance includes an allowance of $5.5 million and $6.1 million, respectively, related to the long-term portion of unbilled equipmentinstallment plan receivables.
Inventory
Inventory consists primarily of wireless devices stated at the lower of cost or market, with cost determined using thefirst-in, first-out method and market determined by replacement cost or estimated net realizable value.
Licenses
Licenses consist of direct and incremental costs incurred in acquiring Federal Communications Commission (‘‘FCC’’)licenses to provide wireless service.
TDS has determined that wireless licenses are indefinite-lived intangible assets and, therefore, not subject toamortization based on the following factors:
� Radio spectrum is not a depleting asset.
� The ability to use radio spectrum is not limited to any one technology.
� TDS and its consolidated subsidiaries are licensed to use radio spectrum through the FCC licensing process, whichenables licensees to utilize specified portions of the spectrum for the provision of wireless service.
� TDS and its consolidated subsidiaries are required to renew their FCC licenses every ten years or, in some cases,every fifteen years. To date, all of TDS’ license renewal applications have been granted by the FCC. Generally, licenserenewal applications filed by licensees otherwise in compliance with FCC regulations are routinely granted. If, however,a license renewal application is challenged either by a competing applicant for the license or by a petition to deny therenewal application, the license will be renewed if the licensee can demonstrate its entitlement to a ‘‘renewalexpectancy.’’ Licensees are entitled to such an expectancy if they can demonstrate to the FCC that they haveprovided ‘‘substantial service’’ during their license term and have ‘‘substantially complied’’ with FCC rules and policies.TDS believes that it is probable that its future license renewal applications will be granted.
U.S. Cellular performs its annual impairment assessment of Licenses as of November 1 of each year or more frequentlyif there are events or circumstances that cause U.S. Cellular to believe the carrying value of Licenses exceeds their fairvalue on a more likely than not basis. Prior to the fourth quarter of 2015, U.S. Cellular separated its FCC licenses intoeleven units of accounting based on geographic service areas. The eleven units of accounting consisted of fourgeographic units of accounting for developed operating market licenses (‘‘built licenses’’) and seven geographicnon-operating market licenses (‘‘unbuilt licenses’’). As part of the current year annual impairment evaluation, U.S. Cellularevaluated the aggregation criteria based on how such licenses are deployed and provide value in U.S. Cellular’soperations, and current industry and market factors. It was determined the built licenses should be aggregated into oneunit of accounting. The unbuilt licenses continued to be separated into seven geographic units of accounting.
As of November 1, 2015, U.S. Cellular performed a qualitative impairment assessment to determine whether it was morelikely than not that the fair value of the built and unbuilt licenses exceed their carrying value. In 2014, U.S. Cellularestimated the fair value of built licenses for purposes of impairment testing using the build-out method. The build-outmethod estimates the fair value of Licenses by discounting to present value the future cash flows calculated based on ahypothetical cost to build-out U.S. Cellular’s network. For units of accounting which consist of unbuilt licenses, the fair
67
TELEPHONE AND DATA SYSTEMS, INC. NOTES TO CONSOLIDATED FINANCIAL STATEMENTS

value of the unbuilt licenses is assumed to change by the same percentage, and in the same direction, that the fairvalue of built licenses measured using the build-out method changed during the period. Based on the impairmentassessments performed, U.S. Cellular did not have an impairment of its Licenses in 2015 or 2014.
See Note 7 — Intangible Assets for additional details related to Licenses.
Goodwill
TDS has Goodwill as a result of its acquisition of wireless, wireline, cable and HMS companies and, under previousbusiness combination guidance in effect prior to 2009, step acquisitions related to U.S. Cellular’s repurchase of itscommon shares. Such Goodwill represents the excess of the total purchase price over the fair value of net assetsacquired in these transactions. TDS performs its annual impairment assessment of Goodwill as of November 1 of eachyear or more frequently if there are events or circumstances that cause TDS to believe the carrying value of individualreporting units exceeds their respective fair values on a more likely than not basis.
See Note 7 — Intangible Assets for additional details related to Goodwill.
U.S. Cellular
For purposes of conducting its annual Goodwill impairment test as of November 1, 2015, U.S. Cellular identified onereporting unit. In 2014, U.S. Cellular identified four reporting units based on four geographic groupings of operatingmarkets, representing four geographic service areas. Due to the evolution of the business and the extent to which U.S.Cellular has similar customers, products and services, and operations across all geographic regions, and also operatesone interdependent network, U.S. Cellular determined it had one reporting unit as of November 1, 2015. The change inreporting units required U.S. Cellular to perform an impairment test for both the previous four reporting units and onenew reporting unit as of November 1, 2015. A discounted cash flow approach was used to value each reporting unit forpurposes of the Goodwill impairment review. Based upon the impairment assessments performed, U.S. Cellular did nothave an impairment of its Goodwill in 2015 or 2014.
TDS Telecom
For purposes of conducting its annual Goodwill impairment test as of the November 1, 2015 and 2014, TDS Telecomhas identified three reporting units: Wireline, Cable and HMS. The discounted cash flow approach and guideline publiccompany method were used to value the Wireline and Cable reporting units for the 2015 and 2014 annual impairmenttests and the HMS reporting unit for the 2015 impairment test. For the 2014 annual impairment test, TDS Telecomperformed a qualitative assessment of the HMS reporting unit due to the interim impairment test performed on the HMSreporting unit during the third quarter of 2014. Based on the impairment assessments performed, Wireline and Cable didnot have an impairment of their Goodwill in 2015 or 2014. HMS also did not have an impairment of its Goodwill in 2015;however, HMS recognized a loss on impairment in 2014 as described in Note 7 — Intangible Assets.
Franchise Rights
TDS Telecom has Franchise rights as a result of acquisitions of cable businesses. Franchise rights are intangible assetsthat provide their holder with the right to operate a business in a certain geographical location as sanctioned by thefranchiser, usually a government agency. TDS has determined that Franchise rights are indefinite-lived intangible assetsand, therefore, not subject to amortization because TDS expects both the renewal by the granting authorities and thecash flows generated from the Franchise rights to continue indefinitely. Cable Franchise rights are generally granted forten year periods and may be renewed for additional terms upon approval by the granting authority. TDS anticipates thatfuture renewals of its Franchise rights will be granted.
TDS Telecom performs its annual impairment assessment of Franchise rights as of November 1 of each year or morefrequently if there are events or circumstances that cause TDS Telecom to believe the carrying value of Franchise rightsexceeds their fair value on a more likely than not basis. TDS Telecom tests Franchise rights for impairment at a unit ofaccounting level for which one unit of accounting was identified. TDS Telecom estimates the fair value of franchise rightsfor purposes of impairment testing using the build-out method. Based on the impairment assessments performed, TDSTelecom did not have an impairment of Franchise rights in 2015 or 2014.
See Note 7 — Intangible Assets for additional details related to Franchise rights.
68
TELEPHONE AND DATA SYSTEMS, INC. NOTES TO CONSOLIDATED FINANCIAL STATEMENTS

Investments in Unconsolidated Entities
For its equity method investments for which financial information is readily available, TDS records its equity in theearnings of the entity in the current period. For its equity method investments for which financial information is not readilyavailable, TDS records its equity in the earnings of the entity on a one quarter lag basis.
Property, Plant and Equipment
Property, plant and equipment is stated at the original cost of construction or purchase including capitalized costs ofcertain taxes, payroll-related expenses, interest and estimated costs to remove the assets.
Expenditures that enhance the productive capacity of assets in service or extend their useful lives are capitalized anddepreciated. Expenditures for maintenance and repairs of assets in service are charged to Cost of services or Selling,general and administrative expense, as applicable. Retirements and disposals of assets are recorded by removing theoriginal cost of the asset (along with the related accumulated depreciation) from plant in service and charging it,together with net removal costs (removal costs less an applicable accrued asset retirement obligation and salvage valuerealized), to (Gain) loss on asset disposals, net.
TDS capitalizes certain costs of developing new information systems.
Depreciation and Amortization
Depreciation is provided using the straight-line method over the estimated useful life of the related asset, except forcertain Wireline segment assets, which use the group depreciation method. The group depreciation method develops adepreciation rate based on the average useful life of a specific group of assets, rather than each asset individually. TDSdepreciates leasehold improvement assets associated with leased properties over periods ranging from one to thirtyyears; such periods approximate the shorter of the assets’ economic lives or the specific lease terms.
Useful lives of specific assets are reviewed throughout the year to determine if changes in technology or other businesschanges would warrant accelerating the depreciation of those specific assets. Due to the Divestiture Transaction morefully described in Note 6 — Acquisitions, Divestitures and Exchanges, U.S. Cellular changed the useful lives of certainassets in 2013. Other than the Divestiture Transaction, there were no material changes to useful lives of property, plantand equipment in 2015, 2014 or 2013. See Note 9 — Property, Plant and Equipment for additional details related touseful lives.
Impairment of Long-Lived Assets
TDS reviews long-lived assets for impairment whenever events or changes in circumstances indicate that the assetsmight be impaired.
U.S. Cellular has one asset group for purposes of assessing property, plant and equipment for impairment based on thefact that the individual operating markets are reliant on centrally operated data centers, mobile telephone switchingoffices and a network operations center. U.S. Cellular operates a single integrated national wireless network, and thelowest level for which identifiable cash flows are largely independent of the cash flows of other groups of assets andliabilities represent cash flows generated by this single interdependent network.
TDS Telecom has three asset groups of Wireline, Cable and HMS for purposes of assessing property, plant andequipment for impairment based on their integrated network, assets and operations. The cash flows generated by eachof these groups is the lowest level for which identifiable cash flows are largely independent of the cash flows of othergroups of assets and liabilities.
Agent Liabilities
U.S. Cellular has relationships with agents, which are independent businesses that obtain customers for U.S. Cellular. AtDecember 31, 2015 and 2014, U.S. Cellular had accrued $75.7 million and $95.3 million, respectively, for amounts dueto agents. These amounts are included in Other current liabilities in the Consolidated Balance Sheet.
69
TELEPHONE AND DATA SYSTEMS, INC. NOTES TO CONSOLIDATED FINANCIAL STATEMENTS
Debt Issuance Costs
Debt issuance costs include underwriters’ and legal fees and other charges related to issuing various borrowinginstruments and other long-term agreements, and are amortized over the respective term of each instrument. TDS earlyadopted ASU 2015-03 using the retrospective method as of December 31, 2015. ASU 2015-03 requires certain debtissuance costs to be presented in the balance sheet as an offset to the related debt obligation. Debt issuance costsrelated to TDS and U.S. Cellular’s revolving credit facilities are excluded from the scope of ASU 2015-03 and arerecorded in Other assets and deferred charges in the Consolidated Balance Sheet. As a result of the retrospectiveadoption, TDS reclassified unamortized debt issuance costs of $52.5 million as of December 31, 2014 from Other assetsand deferred charges to Long-term debt, net in the Consolidated Balance Sheet. Other than this reclassification, theadoption of ASU 2015-03 did not have an impact on TDS’ consolidated financial statements.
Asset Retirement Obligations
TDS accounts for asset retirement obligations by recording the fair value of a liability for legal obligations associated withan asset retirement in the period in which the obligations are incurred. At the time the liability is incurred, TDS records aliability equal to the net present value of the estimated cost of the asset retirement obligation and increases the carryingamount of the related long-lived asset by an equal amount. Until the obligation is fulfilled, TDS updates its estimatesrelating to cash flows required and timing of settlement. TDS records the present value of the changes in the futurevalue as an increase or decrease to the liability and the related carrying amount of the long-lived asset. The liability isaccreted to future value over a period ending with the estimated settlement date of the respective asset retirementobligation. The carrying amount of the long-lived asset is depreciated over the useful life of the related asset. Uponsettlement of the obligation, any difference between the cost to retire the asset and the recorded liability is recognized inthe Consolidated Statement of Operations.
Treasury Shares
Common Shares repurchased by TDS are recorded at cost as treasury shares and result in a reduction of equity. Whentreasury shares are reissued, TDS determines the cost using the first-in, first-out cost method. The difference betweenthe cost of the treasury shares and reissuance price is included in Capital in excess of par value or Retained earnings.
Revenue Recognition
Revenues related to services are recognized as services are rendered. Revenues billed in advance or in arrears of theservices being provided are estimated and deferred or accrued, as appropriate.
Revenues from sales of equipment, products and accessories are recognized when TDS no longer has anyrequirements to perform, when title has passed and when the products are accepted by the customer.
Multiple Deliverable Arrangements
U.S. Cellular and TDS Telecom sell multiple element service and equipment offerings. In these instances, revenues areallocated using the relative selling price method. Under this method, arrangement consideration is allocated to eachelement on the basis of its relative selling price. Revenue recognized for the delivered items is limited to the amount duefrom the customer that is not contingent upon the delivery of additional products or services.
Loyalty Reward Program
In March 2015, U.S. Cellular announced that it would discontinue its loyalty reward program effective September 1, 2015.All unredeemed reward points expired at that time and the deferred revenue balance of $58.2 million related to suchexpired points was recognized as service revenues. At December 31, 2014, U.S. Cellular had deferred revenue related toloyalty reward points outstanding of $94.6 million.
U.S. Cellular followed the deferred revenue method of accounting for its loyalty reward program. Under this method,revenue allocated to loyalty reward points was deferred. The amount allocated to the loyalty points was based on theestimated retail price of the products and services for which points may be redeemed divided by the number of loyaltypoints required to receive such products and services. This was calculated on a weighted average basis and requiredU.S. Cellular to estimate the percentage of loyalty points that would be redeemed for each product or service.
Revenue was recognized at the time of customer redemption or when such points were depleted via an accountmaintenance charge. U.S. Cellular employed the proportional model to recognize revenues associated with breakage.
70
TELEPHONE AND DATA SYSTEMS, INC. NOTES TO CONSOLIDATED FINANCIAL STATEMENTS

Under the proportional model, U.S. Cellular allocated a portion of the estimated future breakage to each redemption andrecorded revenue proportionally.
In the fourth quarter of 2013, U.S. Cellular issued loyalty reward points with a value of $43.5 million as a loyalty bonus inrecognition of the inconvenience experienced by customers during U.S. Cellular’s billing system conversion in 2013. Thevalue of the loyalty bonus reduced Service revenues in the Consolidated Statement of Operations in 2013.
Equipment Installment Plans
U.S. Cellular equipment revenue under equipment installment plan contracts is recognized at the time the device isdelivered to the end-user customer for the selling price of the device, net of any deferred imputed interest or trade-inright, if applicable. Imputed interest is reflected as a reduction to the receivable balance and recognized over theduration of the plan as a component of Interest and dividend income. See Note 3 — Equipment Installment Plans foradditional information.
Incentives
Discounts and incentives that are deemed cash are recognized as a reduction of Operating revenues concurrently withthe associated revenue.
U.S. Cellular issues rebates to its agents and end customers. These incentives are recognized as a reduction to revenueat the time the wireless device sale to the customer occurs. The total potential rebates and incentives are reduced byU.S. Cellular’s estimate of rebates that will not be redeemed by customers based on historical experience of suchredemptions.
Activation Fees
TDS charges its end customers activation fees in connection with the sale of certain services and equipment. Activationfees charged by TDS Telecom in conjunction with a service offering are deferred and recognized over the averagecustomer’s service period. Device activation fees charged at U.S. Cellular agent locations in connection with subsidizeddevice sales are deferred and recognized over a period that corresponds with the length of the customer’s servicecontract. Device activation fees charged at U.S. Cellular company-owned retail stores in connection with subsidizeddevice sales are recognized at the time the device is delivered to the customer. Device activation fees charged at bothagent locations and U.S. Cellular company-owned retail stores in connection with equipment installment plan devicetransactions are deferred and recognized over a period that corresponds with the equipment upgrade eligibility datebased on the contract terms.
Amounts Collected from Customers and Remitted to Governmental Authorities – Gross vs. Net
TDS records amounts collected from customers and remitted to governmental authorities net within a tax liability accountif the tax is assessed upon the customer and TDS merely acts as an agent in collecting the tax on behalf of theimposing governmental authority. If the tax is assessed upon TDS, then amounts collected from customers as recoveryof the tax are recorded in Service revenues and amounts remitted to governmental authorities are recorded in Selling,general and administrative expenses in the Consolidated Statement of Operations. The amounts recorded gross inrevenues that are billed to customers and remitted to governmental authorities totaled $95.3 million, $113.5 million and$131.0 million for 2015, 2014 and 2013, respectively.
Wholesale Revenues
TDS Telecom earns wholesale revenues in its Wireline segment as a result of its participation in revenue pools with othertelephone companies for interstate revenue and for certain intrastate revenue. Such pools are funded by long distancerevenue and/or access charges within state jurisdictions and by access charges in the interstate jurisdiction. Wholesalerevenues earned through the various pooling processes are recorded based on estimates following the NationalExchange Carrier Association’s rules as approved by the FCC.
Eligible Telecommunications Carrier (‘‘ETC’’) Revenues
Telecommunications companies may be designated by states, or in some cases by the FCC, as an ETC to receivesupport payments from the Universal Service Fund if they provide specified services in ‘‘high cost’’ areas. ETC revenuesrecognized in the reporting period represent the amounts which U.S. Cellular is entitled to receive for such period, asdetermined and approved in connection with U.S. Cellular’s designation as an ETC in various states.
71
TELEPHONE AND DATA SYSTEMS, INC. NOTES TO CONSOLIDATED FINANCIAL STATEMENTS
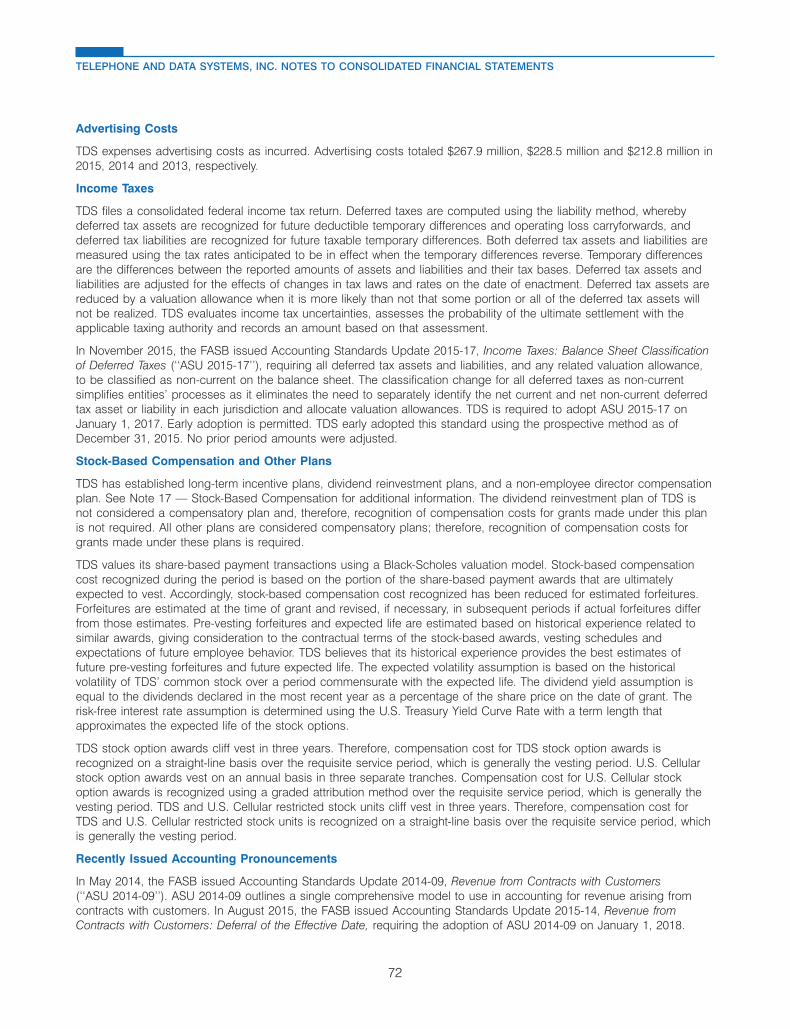
Advertising Costs
TDS expenses advertising costs as incurred. Advertising costs totaled $267.9 million, $228.5 million and $212.8 million in2015, 2014 and 2013, respectively.
Income Taxes
TDS files a consolidated federal income tax return. Deferred taxes are computed using the liability method, wherebydeferred tax assets are recognized for future deductible temporary differences and operating loss carryforwards, anddeferred tax liabilities are recognized for future taxable temporary differences. Both deferred tax assets and liabilities aremeasured using the tax rates anticipated to be in effect when the temporary differences reverse. Temporary differencesare the differences between the reported amounts of assets and liabilities and their tax bases. Deferred tax assets andliabilities are adjusted for the effects of changes in tax laws and rates on the date of enactment. Deferred tax assets arereduced by a valuation allowance when it is more likely than not that some portion or all of the deferred tax assets willnot be realized. TDS evaluates income tax uncertainties, assesses the probability of the ultimate settlement with theapplicable taxing authority and records an amount based on that assessment.
In November 2015, the FASB issued Accounting Standards Update 2015-17, Income Taxes: Balance Sheet Classificationof Deferred Taxes (‘‘ASU 2015-17’’), requiring all deferred tax assets and liabilities, and any related valuation allowance,to be classified as non-current on the balance sheet. The classification change for all deferred taxes as non-currentsimplifies entities’ processes as it eliminates the need to separately identify the net current and net non-current deferredtax asset or liability in each jurisdiction and allocate valuation allowances. TDS is required to adopt ASU 2015-17 onJanuary 1, 2017. Early adoption is permitted. TDS early adopted this standard using the prospective method as ofDecember 31, 2015. No prior period amounts were adjusted.
Stock-Based Compensation and Other Plans
TDS has established long-term incentive plans, dividend reinvestment plans, and a non-employee director compensationplan. See Note 17 — Stock-Based Compensation for additional information. The dividend reinvestment plan of TDS isnot considered a compensatory plan and, therefore, recognition of compensation costs for grants made under this planis not required. All other plans are considered compensatory plans; therefore, recognition of compensation costs forgrants made under these plans is required.
TDS values its share-based payment transactions using a Black-Scholes valuation model. Stock-based compensationcost recognized during the period is based on the portion of the share-based payment awards that are ultimatelyexpected to vest. Accordingly, stock-based compensation cost recognized has been reduced for estimated forfeitures.Forfeitures are estimated at the time of grant and revised, if necessary, in subsequent periods if actual forfeitures differfrom those estimates. Pre-vesting forfeitures and expected life are estimated based on historical experience related tosimilar awards, giving consideration to the contractual terms of the stock-based awards, vesting schedules andexpectations of future employee behavior. TDS believes that its historical experience provides the best estimates offuture pre-vesting forfeitures and future expected life. The expected volatility assumption is based on the historicalvolatility of TDS’ common stock over a period commensurate with the expected life. The dividend yield assumption isequal to the dividends declared in the most recent year as a percentage of the share price on the date of grant. Therisk-free interest rate assumption is determined using the U.S. Treasury Yield Curve Rate with a term length thatapproximates the expected life of the stock options.
TDS stock option awards cliff vest in three years. Therefore, compensation cost for TDS stock option awards isrecognized on a straight-line basis over the requisite service period, which is generally the vesting period. U.S. Cellularstock option awards vest on an annual basis in three separate tranches. Compensation cost for U.S. Cellular stockoption awards is recognized using a graded attribution method over the requisite service period, which is generally thevesting period. TDS and U.S. Cellular restricted stock units cliff vest in three years. Therefore, compensation cost forTDS and U.S. Cellular restricted stock units is recognized on a straight-line basis over the requisite service period, whichis generally the vesting period.
Recently Issued Accounting Pronouncements
In May 2014, the FASB issued Accounting Standards Update 2014-09, Revenue from Contracts with Customers(‘‘ASU 2014-09’’). ASU 2014-09 outlines a single comprehensive model to use in accounting for revenue arising fromcontracts with customers. In August 2015, the FASB issued Accounting Standards Update 2015-14, Revenue fromContracts with Customers: Deferral of the Effective Date, requiring the adoption of ASU 2014-09 on January 1, 2018.
72
TELEPHONE AND DATA SYSTEMS, INC. NOTES TO CONSOLIDATED FINANCIAL STATEMENTS

Early adoption as of January 1, 2017 is permitted; however, TDS does not intend to adopt early. TDS is evaluating theeffects that adoption of ASU 2014-09 will have on its financial position, results of operations, and disclosures.
In August 2014, the FASB issued Accounting Standards Update 2014-15, Disclosure of Uncertainties about an Entity’sAbility to Continue as a Going Concern (‘‘ASU 2014-15’’). ASU 2014-15 requires TDS to assess its ability to continue asa going concern each interim and annual reporting period and provide certain disclosures if there is substantial doubtabout the entity’s ability to continue as a going concern, including management’s plan to alleviate the substantial doubt.TDS is required to adopt the provisions of ASU 2014-15 for the annual period ending December 31, 2016, but earlyadoption is permitted. The adoption of ASU 2014-15 will not impact TDS’ financial position or results of operations butmay impact future disclosures.
In February 2015, the FASB issued Accounting Standards Update 2015-02, Consolidation: Amendments to theConsolidation Analysis (‘‘ASU 2015-02’’). ASU 2015-02 simplifies consolidation accounting by reducing the number ofconsolidation models. Additionally, ASU 2015-02 changes certain criteria for identifying variable interest entities. TDSadopted the provisions of this standard as of January 1, 2016. TDS expects that certain consolidated subsidiaries thatare not defined as variable interest entities under current accounting guidance will be defined as variable interest entitiesunder the provisions of ASU 2015-02. However, TDS’ adoption of ASU 2015-02 will not change the group of entitieswhich TDS is required to consolidate in its financial statements. Accordingly, the adoption of ASU 2015-02 will notimpact its financial position or results of operations.
In July 2015, the FASB issued Accounting Standards Update 2015-11, Inventory: Simplifying the Measurement ofInventory (‘‘ASU 2015-11’’), which requires inventory to be measured at the lower of cost or net realizable value. TDS isrequired to adopt ASU 2015-11 on January 1, 2017. Early adoption is permitted. TDS is evaluating the effects thatadoption of ASU 2015-11 will have on its financial position and results of operations.
In September 2015, the FASB issued Accounting Standards Update 2015-16, Business Combinations: Simplifying theAccounting for Measurement-Period Adjustments (‘‘ASU 2015-16’’). ASU 2015-16 simplifies how adjustments are made toprovisional amounts recognized in a business combination during the measurement period. TDS adopted ASU 2015-16on January 1, 2016. There will be no immediate impacts to TDS’ financial position, results of operations, anddisclosures.
In January 2016, the FASB issued Accounting Standards Update 2016-01, Financial Instruments – Overall: Recognitionand Measurement of Financial Assets and Financial Liabilities (‘‘ASU 2016-01’’). This ASU introduces changes to currentaccounting for equity investments and financial liabilities under the fair value option and the presentation and disclosurerequirements for financial instruments. TDS is required to adopt ASU 2016-01 on January 1, 2018. Certain provisions areeligible for early adoption. TDS is evaluating the effects that adoption of ASU 2016-01 will have on its financial positionand results of operations.
NOTE 2 FAIR VALUE MEASUREMENTSAs of December 31, 2015 and 2014, TDS did not have any financial or nonfinancial assets or liabilities that were requiredto be recorded at fair value in its Consolidated Balance Sheet in accordance with GAAP.
The provisions of GAAP establish a fair value hierarchy that contains three levels for inputs used in fair valuemeasurements. Level 1 inputs include quoted market prices for identical assets or liabilities in active markets. Level 2inputs include quoted market prices for similar assets and liabilities in active markets or quoted market prices foridentical assets and liabilities in inactive markets. Level 3 inputs are unobservable. A financial instrument’s level withinthe fair value hierarchy is based on the lowest level of any input that is significant to the fair value measurement. Afinancial instrument’s level within the fair value hierarchy is not representative of its expected performance or its overallrisk profile and, therefore, Level 3 assets are not necessarily higher risk than Level 2 assets or Level 1 assets.
73
TELEPHONE AND DATA SYSTEMS, INC. NOTES TO CONSOLIDATED FINANCIAL STATEMENTS
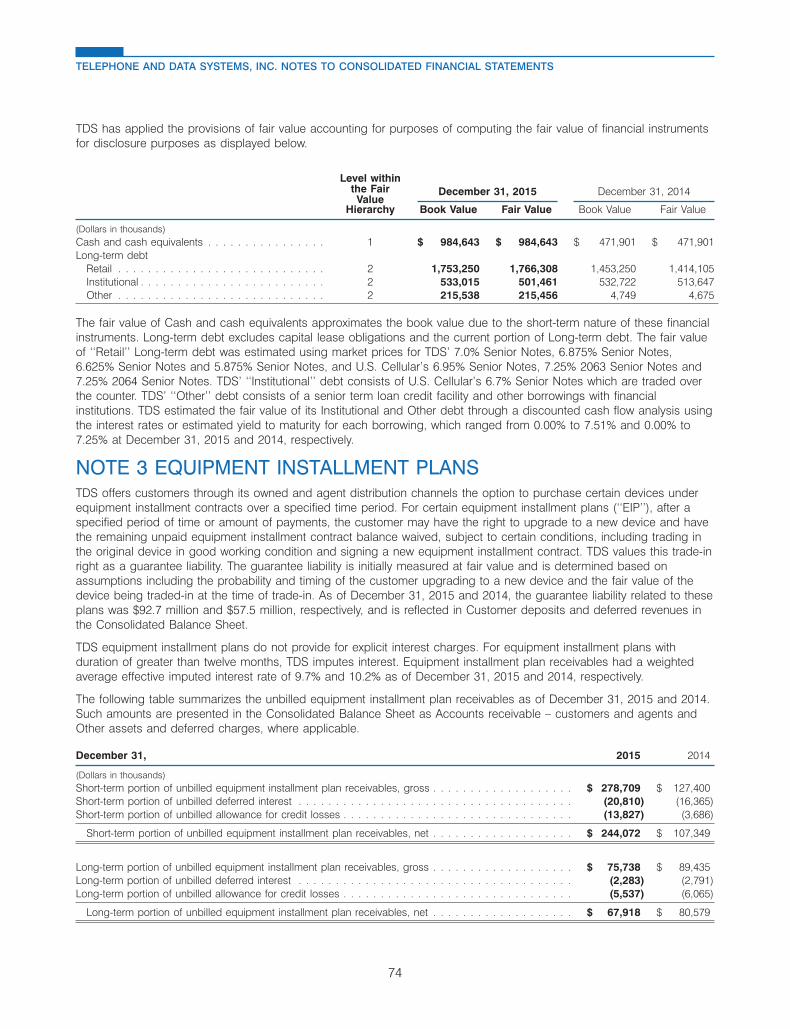
TDS has applied the provisions of fair value accounting for purposes of computing the fair value of financial instrumentsfor disclosure purposes as displayed below.
Level withinthe FairValue
December 31, 2015 December 31, 2014
Hierarchy Book Value Fair Value Book Value Fair Value
(Dollars in thousands)Cash and cash equivalents . . . . . . . . . . . . . . . . 1 $ 984,643 $ 984,643 $ 471,901 $ 471,901Long-term debt
Retail . . . . . . . . . . . . . . . . . . . . . . . . . . . . 2 1,753,250 1,766,308 1,453,250 1,414,105Institutional . . . . . . . . . . . . . . . . . . . . . . . . . 2 533,015 501,461 532,722 513,647Other . . . . . . . . . . . . . . . . . . . . . . . . . . . . 2 215,538 215,456 4,749 4,675
The fair value of Cash and cash equivalents approximates the book value due to the short-term nature of these financialinstruments. Long-term debt excludes capital lease obligations and the current portion of Long-term debt. The fair valueof ‘‘Retail’’ Long-term debt was estimated using market prices for TDS’ 7.0% Senior Notes, 6.875% Senior Notes,6.625% Senior Notes and 5.875% Senior Notes, and U.S. Cellular’s 6.95% Senior Notes, 7.25% 2063 Senior Notes and7.25% 2064 Senior Notes. TDS’ ‘‘Institutional’’ debt consists of U.S. Cellular’s 6.7% Senior Notes which are traded overthe counter. TDS’ ‘‘Other’’ debt consists of a senior term loan credit facility and other borrowings with financialinstitutions. TDS estimated the fair value of its Institutional and Other debt through a discounted cash flow analysis usingthe interest rates or estimated yield to maturity for each borrowing, which ranged from 0.00% to 7.51% and 0.00% to7.25% at December 31, 2015 and 2014, respectively.
NOTE 3 EQUIPMENT INSTALLMENT PLANSTDS offers customers through its owned and agent distribution channels the option to purchase certain devices underequipment installment contracts over a specified time period. For certain equipment installment plans (‘‘EIP’’), after aspecified period of time or amount of payments, the customer may have the right to upgrade to a new device and havethe remaining unpaid equipment installment contract balance waived, subject to certain conditions, including trading inthe original device in good working condition and signing a new equipment installment contract. TDS values this trade-inright as a guarantee liability. The guarantee liability is initially measured at fair value and is determined based onassumptions including the probability and timing of the customer upgrading to a new device and the fair value of thedevice being traded-in at the time of trade-in. As of December 31, 2015 and 2014, the guarantee liability related to theseplans was $92.7 million and $57.5 million, respectively, and is reflected in Customer deposits and deferred revenues inthe Consolidated Balance Sheet.
TDS equipment installment plans do not provide for explicit interest charges. For equipment installment plans withduration of greater than twelve months, TDS imputes interest. Equipment installment plan receivables had a weightedaverage effective imputed interest rate of 9.7% and 10.2% as of December 31, 2015 and 2014, respectively.
The following table summarizes the unbilled equipment installment plan receivables as of December 31, 2015 and 2014.Such amounts are presented in the Consolidated Balance Sheet as Accounts receivable – customers and agents andOther assets and deferred charges, where applicable.
December 31, 2015 2014
(Dollars in thousands)Short-term portion of unbilled equipment installment plan receivables, gross . . . . . . . . . . . . . . . . . . . $ 278,709 $ 127,400Short-term portion of unbilled deferred interest . . . . . . . . . . . . . . . . . . . . . . . . . . . . . . . . . . . . . (20,810) (16,365)Short-term portion of unbilled allowance for credit losses . . . . . . . . . . . . . . . . . . . . . . . . . . . . . . . (13,827) (3,686)
Short-term portion of unbilled equipment installment plan receivables, net . . . . . . . . . . . . . . . . . . . $ 244,072 $ 107,349
Long-term portion of unbilled equipment installment plan receivables, gross . . . . . . . . . . . . . . . . . . . $ 75,738 $ 89,435Long-term portion of unbilled deferred interest . . . . . . . . . . . . . . . . . . . . . . . . . . . . . . . . . . . . . (2,283) (2,791)Long-term portion of unbilled allowance for credit losses . . . . . . . . . . . . . . . . . . . . . . . . . . . . . . . (5,537) (6,065)
Long-term portion of unbilled equipment installment plan receivables, net . . . . . . . . . . . . . . . . . . . $ 67,918 $ 80,579
74
TELEPHONE AND DATA SYSTEMS, INC. NOTES TO CONSOLIDATED FINANCIAL STATEMENTS

TDS assesses the collectability of the equipment installment plan receivables based on historical payment experience,account aging and other qualitative factors and provides an allowance for estimated losses. The credit profiles of TDScustomers on equipment installment plans are similar to those of TDS customers with traditional subsidized plans.Customers with a higher risk credit profile are required to make a deposit for equipment purchased through aninstallment contract.
TDS recorded out-of-period adjustments in 2015 due to errors related to equipment installment plan transactions thatwere attributable to 2014. TDS has determined that these adjustments were not material to prior annual periods, andalso were not material to the current year results. These equipment installment plan adjustments had the impact ofreducing Equipment sales revenues by $6.2 million and Income before income taxes by $5.8 million in 2015.
NOTE 4 INCOME TAXESTDS’ current income taxes balances at December 31, 2015 and 2014 were as follows:
December 31, 2015 2014
(Dollars in thousands)Federal income taxes receivable . . . . . . . . . . . . . . . . . . . . . . . . . . . . . . . . . . . . . . . . . . . . . . $ 66,785 $ 108,820Net state income taxes receivable . . . . . . . . . . . . . . . . . . . . . . . . . . . . . . . . . . . . . . . . . . . . . 3,309 4,391
Income tax expense (benefit) is summarized as follows:
Year Ended December 31, 2015 2014 2013
(Dollars in thousands)Current
Federal . . . . . . . . . . . . . . . . . . . . . . . . . . . . . . . . . . . . . . . . . . . . . . . . . . . $ 92,887 $ (87,736) $ 181,579State . . . . . . . . . . . . . . . . . . . . . . . . . . . . . . . . . . . . . . . . . . . . . . . . . . . . 8,256 11,091 11,614
DeferredFederal . . . . . . . . . . . . . . . . . . . . . . . . . . . . . . . . . . . . . . . . . . . . . . . . . . . 60,939 41,851 (65,970)Federal – valuation allowance adjustment . . . . . . . . . . . . . . . . . . . . . . . . . . . . . – (10,816) –State . . . . . . . . . . . . . . . . . . . . . . . . . . . . . . . . . . . . . . . . . . . . . . . . . . . . 9,910 2,208 (1,180)State – valuation allowance adjustment . . . . . . . . . . . . . . . . . . . . . . . . . . . . . . . – 38,470 –
$ 171,992 $ (4,932) $ 126,043
A reconciliation of TDS’ income tax expense computed at the statutory rate to the reported income tax expense, and thestatutory federal income tax expense rate to TDS’ effective income tax expense rate is as follows:
2015 2014 2013
Year Ended December 31, Amount Rate Amount Rate Amount Rate
(Dollars in thousands)Statutory federal income tax expense and rate . . . . . $ 152,111 35.0% $ (53,278) 35.0% $ 102,502 35.0%State income taxes, net of federal benefit1 . . . . . . . . 11,002 2.5 42,834 (28.1) 10,548 3.6Effect of noncontrolling interests . . . . . . . . . . . . . . 2,791 0.6 (5,777) 3.8 (1,034) (0.4)Gains (losses) on investments and sale of assets2 . . . – – – – 14,949 5.1Change in federal valuation allowance3 . . . . . . . . . . 2,022 0.5 (8,697) 5.7 – –Goodwill impairment4 . . . . . . . . . . . . . . . . . . . . . – – 18,260 (12.0) – –Other differences, net . . . . . . . . . . . . . . . . . . . . . 4,066 1.0 1,726 (1.2) (922) (0.3)
Total income tax expense (benefit) and rate . . . . . . . $ 171,992 39.6% $ (4,932) 3.2% $ 126,043 43.0%
1 State income taxes, net of federal benefit, include changes in unrecognized tax benefits as well as adjustments to the valuation allowance. During thethird quarter of 2014 TDS recorded a $38.5 million increase to income tax expense related to a valuation allowance recorded against certain statedeferred tax assets.
2 Gains (losses) on investments and sale of assets represents 2013 tax expense related to the NY1 & NY2 Deconsolidation and the DivestitureTransaction. See Note 6 — Acquisitions, Divestitures and Exchanges and Note 8 — Investments in Unconsolidated Entities for additional information.
3 Change in federal valuation allowance in 2015 relates primarily to losses incurred by certain entities where realization of deferred tax assets is not ‘‘morelikely than not.’’ The decrease to income tax expense in 2014 was due to a valuation allowance reduction for federal net operating losses previouslylimited under loss utilization rules.
4 Goodwill impairment reflects an adjustment to increase income tax expense by $18.3 million related to a portion of the goodwill impairment of Suttle-Straus and the HMS reporting unit recorded in 2014 which is nondeductible for income tax purposes. See Note 7 — Intangible Assets for additionalinformation related to the goodwill impairment.
75
TELEPHONE AND DATA SYSTEMS, INC. NOTES TO CONSOLIDATED FINANCIAL STATEMENTS
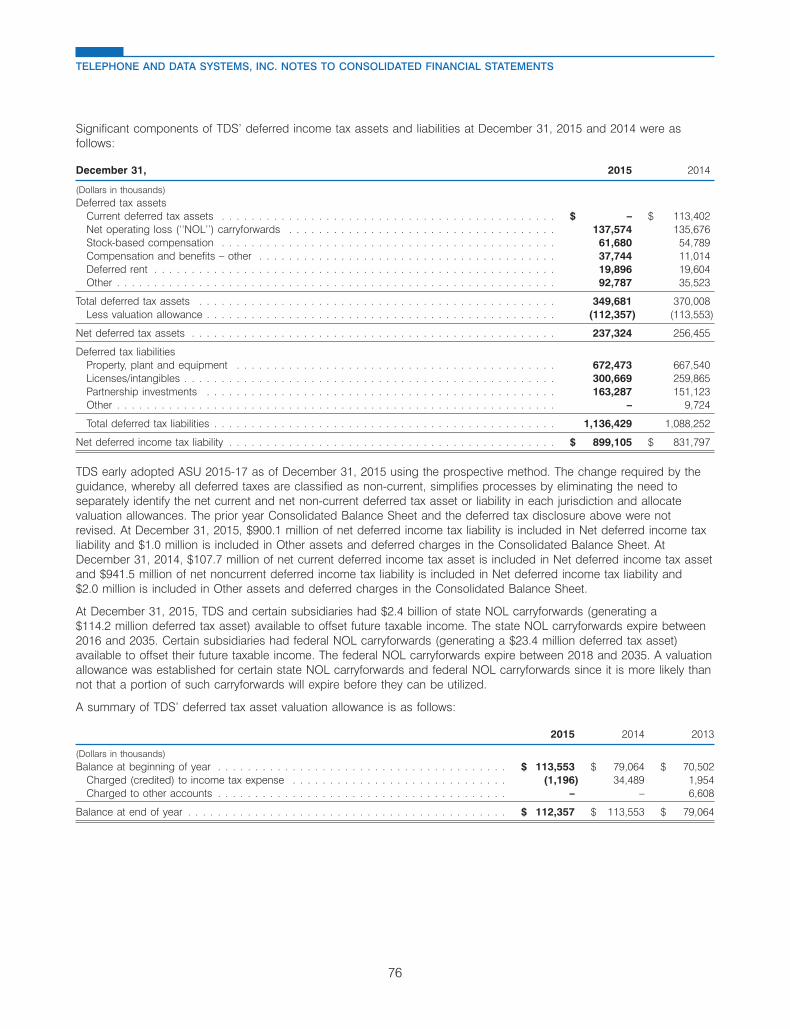
Significant components of TDS’ deferred income tax assets and liabilities at December 31, 2015 and 2014 were asfollows:
December 31, 2015 2014
(Dollars in thousands)Deferred tax assets
Current deferred tax assets . . . . . . . . . . . . . . . . . . . . . . . . . . . . . . . . . . . . . . . . . . . . . $ – $ 113,402Net operating loss (‘‘NOL’’) carryforwards . . . . . . . . . . . . . . . . . . . . . . . . . . . . . . . . . . . . 137,574 135,676Stock-based compensation . . . . . . . . . . . . . . . . . . . . . . . . . . . . . . . . . . . . . . . . . . . . . 61,680 54,789Compensation and benefits – other . . . . . . . . . . . . . . . . . . . . . . . . . . . . . . . . . . . . . . . . 37,744 11,014Deferred rent . . . . . . . . . . . . . . . . . . . . . . . . . . . . . . . . . . . . . . . . . . . . . . . . . . . . . . 19,896 19,604Other . . . . . . . . . . . . . . . . . . . . . . . . . . . . . . . . . . . . . . . . . . . . . . . . . . . . . . . . . . . 92,787 35,523
Total deferred tax assets . . . . . . . . . . . . . . . . . . . . . . . . . . . . . . . . . . . . . . . . . . . . . . . . 349,681 370,008Less valuation allowance . . . . . . . . . . . . . . . . . . . . . . . . . . . . . . . . . . . . . . . . . . . . . . . (112,357) (113,553)
Net deferred tax assets . . . . . . . . . . . . . . . . . . . . . . . . . . . . . . . . . . . . . . . . . . . . . . . . . 237,324 256,455
Deferred tax liabilitiesProperty, plant and equipment . . . . . . . . . . . . . . . . . . . . . . . . . . . . . . . . . . . . . . . . . . . 672,473 667,540Licenses/intangibles . . . . . . . . . . . . . . . . . . . . . . . . . . . . . . . . . . . . . . . . . . . . . . . . . . 300,669 259,865Partnership investments . . . . . . . . . . . . . . . . . . . . . . . . . . . . . . . . . . . . . . . . . . . . . . . 163,287 151,123Other . . . . . . . . . . . . . . . . . . . . . . . . . . . . . . . . . . . . . . . . . . . . . . . . . . . . . . . . . . . – 9,724
Total deferred tax liabilities . . . . . . . . . . . . . . . . . . . . . . . . . . . . . . . . . . . . . . . . . . . . . . 1,136,429 1,088,252
Net deferred income tax liability . . . . . . . . . . . . . . . . . . . . . . . . . . . . . . . . . . . . . . . . . . . . $ 899,105 $ 831,797
TDS early adopted ASU 2015-17 as of December 31, 2015 using the prospective method. The change required by theguidance, whereby all deferred taxes are classified as non-current, simplifies processes by eliminating the need toseparately identify the net current and net non-current deferred tax asset or liability in each jurisdiction and allocatevaluation allowances. The prior year Consolidated Balance Sheet and the deferred tax disclosure above were notrevised. At December 31, 2015, $900.1 million of net deferred income tax liability is included in Net deferred income taxliability and $1.0 million is included in Other assets and deferred charges in the Consolidated Balance Sheet. AtDecember 31, 2014, $107.7 million of net current deferred income tax asset is included in Net deferred income tax assetand $941.5 million of net noncurrent deferred income tax liability is included in Net deferred income tax liability and$2.0 million is included in Other assets and deferred charges in the Consolidated Balance Sheet.
At December 31, 2015, TDS and certain subsidiaries had $2.4 billion of state NOL carryforwards (generating a$114.2 million deferred tax asset) available to offset future taxable income. The state NOL carryforwards expire between2016 and 2035. Certain subsidiaries had federal NOL carryforwards (generating a $23.4 million deferred tax asset)available to offset their future taxable income. The federal NOL carryforwards expire between 2018 and 2035. A valuationallowance was established for certain state NOL carryforwards and federal NOL carryforwards since it is more likely thannot that a portion of such carryforwards will expire before they can be utilized.
A summary of TDS’ deferred tax asset valuation allowance is as follows:
2015 2014 2013
(Dollars in thousands)Balance at beginning of year . . . . . . . . . . . . . . . . . . . . . . . . . . . . . . . . . . . . . . . $ 113,553 $ 79,064 $ 70,502
Charged (credited) to income tax expense . . . . . . . . . . . . . . . . . . . . . . . . . . . . . (1,196) 34,489 1,954Charged to other accounts . . . . . . . . . . . . . . . . . . . . . . . . . . . . . . . . . . . . . . . – – 6,608
Balance at end of year . . . . . . . . . . . . . . . . . . . . . . . . . . . . . . . . . . . . . . . . . . . $ 112,357 $ 113,553 $ 79,064
76
TELEPHONE AND DATA SYSTEMS, INC. NOTES TO CONSOLIDATED FINANCIAL STATEMENTS
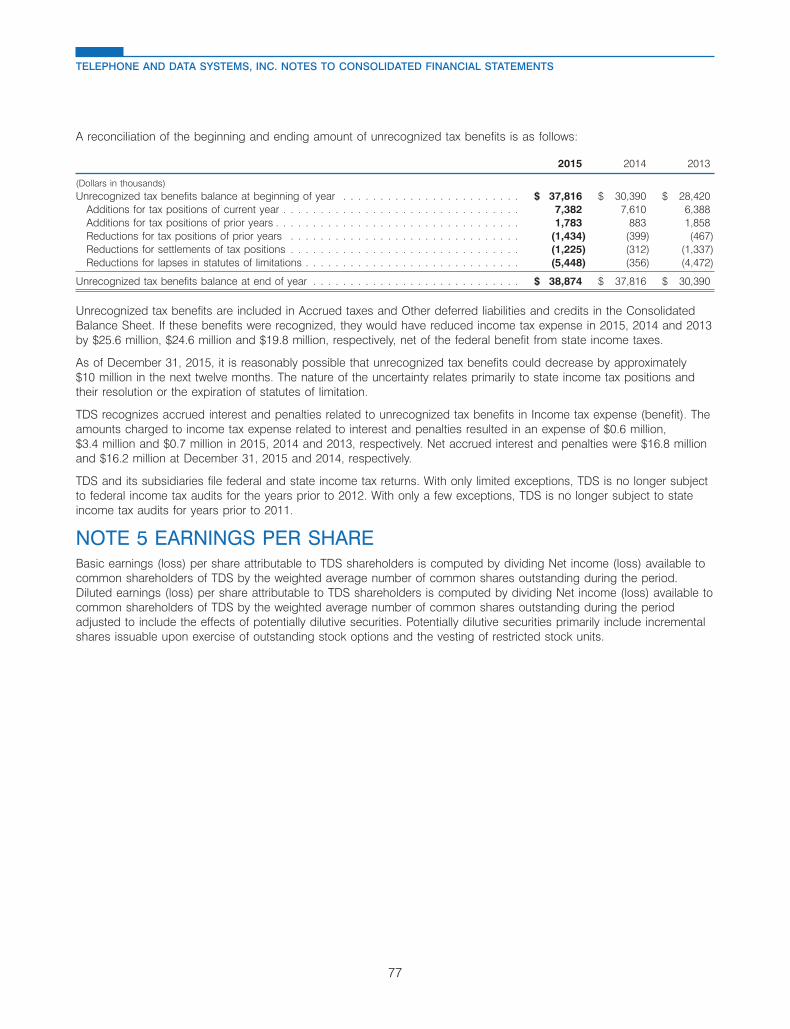
A reconciliation of the beginning and ending amount of unrecognized tax benefits is as follows:
2015 2014 2013
(Dollars in thousands)Unrecognized tax benefits balance at beginning of year . . . . . . . . . . . . . . . . . . . . . . . . $ 37,816 $ 30,390 $ 28,420
Additions for tax positions of current year . . . . . . . . . . . . . . . . . . . . . . . . . . . . . . . . 7,382 7,610 6,388Additions for tax positions of prior years . . . . . . . . . . . . . . . . . . . . . . . . . . . . . . . . . 1,783 883 1,858Reductions for tax positions of prior years . . . . . . . . . . . . . . . . . . . . . . . . . . . . . . . (1,434) (399) (467)Reductions for settlements of tax positions . . . . . . . . . . . . . . . . . . . . . . . . . . . . . . . (1,225) (312) (1,337)Reductions for lapses in statutes of limitations . . . . . . . . . . . . . . . . . . . . . . . . . . . . . (5,448) (356) (4,472)
Unrecognized tax benefits balance at end of year . . . . . . . . . . . . . . . . . . . . . . . . . . . . $ 38,874 $ 37,816 $ 30,390
Unrecognized tax benefits are included in Accrued taxes and Other deferred liabilities and credits in the ConsolidatedBalance Sheet. If these benefits were recognized, they would have reduced income tax expense in 2015, 2014 and 2013by $25.6 million, $24.6 million and $19.8 million, respectively, net of the federal benefit from state income taxes.
As of December 31, 2015, it is reasonably possible that unrecognized tax benefits could decrease by approximately$10 million in the next twelve months. The nature of the uncertainty relates primarily to state income tax positions andtheir resolution or the expiration of statutes of limitation.
TDS recognizes accrued interest and penalties related to unrecognized tax benefits in Income tax expense (benefit). Theamounts charged to income tax expense related to interest and penalties resulted in an expense of $0.6 million,$3.4 million and $0.7 million in 2015, 2014 and 2013, respectively. Net accrued interest and penalties were $16.8 millionand $16.2 million at December 31, 2015 and 2014, respectively.
TDS and its subsidiaries file federal and state income tax returns. With only limited exceptions, TDS is no longer subjectto federal income tax audits for the years prior to 2012. With only a few exceptions, TDS is no longer subject to stateincome tax audits for years prior to 2011.
NOTE 5 EARNINGS PER SHAREBasic earnings (loss) per share attributable to TDS shareholders is computed by dividing Net income (loss) available tocommon shareholders of TDS by the weighted average number of common shares outstanding during the period.Diluted earnings (loss) per share attributable to TDS shareholders is computed by dividing Net income (loss) available tocommon shareholders of TDS by the weighted average number of common shares outstanding during the periodadjusted to include the effects of potentially dilutive securities. Potentially dilutive securities primarily include incrementalshares issuable upon exercise of outstanding stock options and the vesting of restricted stock units.
77
TELEPHONE AND DATA SYSTEMS, INC. NOTES TO CONSOLIDATED FINANCIAL STATEMENTS
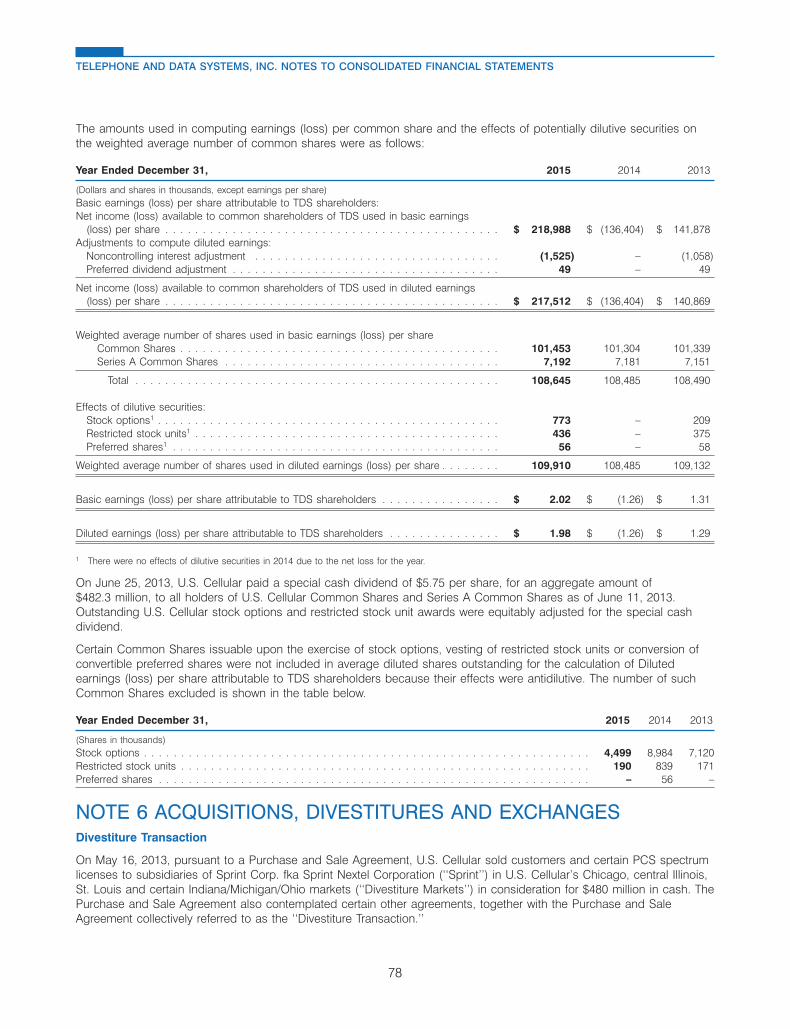
The amounts used in computing earnings (loss) per common share and the effects of potentially dilutive securities onthe weighted average number of common shares were as follows:
Year Ended December 31, 2015 2014 2013
(Dollars and shares in thousands, except earnings per share)Basic earnings (loss) per share attributable to TDS shareholders:Net income (loss) available to common shareholders of TDS used in basic earnings
(loss) per share . . . . . . . . . . . . . . . . . . . . . . . . . . . . . . . . . . . . . . . . . . . . . $ 218,988 $ (136,404) $ 141,878Adjustments to compute diluted earnings:
Noncontrolling interest adjustment . . . . . . . . . . . . . . . . . . . . . . . . . . . . . . . . . (1,525) – (1,058)Preferred dividend adjustment . . . . . . . . . . . . . . . . . . . . . . . . . . . . . . . . . . . . 49 – 49
Net income (loss) available to common shareholders of TDS used in diluted earnings(loss) per share . . . . . . . . . . . . . . . . . . . . . . . . . . . . . . . . . . . . . . . . . . . . . $ 217,512 $ (136,404) $ 140,869
Weighted average number of shares used in basic earnings (loss) per shareCommon Shares . . . . . . . . . . . . . . . . . . . . . . . . . . . . . . . . . . . . . . . . . . . 101,453 101,304 101,339Series A Common Shares . . . . . . . . . . . . . . . . . . . . . . . . . . . . . . . . . . . . . 7,192 7,181 7,151
Total . . . . . . . . . . . . . . . . . . . . . . . . . . . . . . . . . . . . . . . . . . . . . . . . . 108,645 108,485 108,490
Effects of dilutive securities:Stock options1 . . . . . . . . . . . . . . . . . . . . . . . . . . . . . . . . . . . . . . . . . . . . . . 773 – 209Restricted stock units1 . . . . . . . . . . . . . . . . . . . . . . . . . . . . . . . . . . . . . . . . . 436 – 375Preferred shares1 . . . . . . . . . . . . . . . . . . . . . . . . . . . . . . . . . . . . . . . . . . . . 56 – 58
Weighted average number of shares used in diluted earnings (loss) per share . . . . . . . . 109,910 108,485 109,132
Basic earnings (loss) per share attributable to TDS shareholders . . . . . . . . . . . . . . . . $ 2.02 $ (1.26) $ 1.31
Diluted earnings (loss) per share attributable to TDS shareholders . . . . . . . . . . . . . . . $ 1.98 $ (1.26) $ 1.29
1 There were no effects of dilutive securities in 2014 due to the net loss for the year.
On June 25, 2013, U.S. Cellular paid a special cash dividend of $5.75 per share, for an aggregate amount of$482.3 million, to all holders of U.S. Cellular Common Shares and Series A Common Shares as of June 11, 2013.Outstanding U.S. Cellular stock options and restricted stock unit awards were equitably adjusted for the special cashdividend.
Certain Common Shares issuable upon the exercise of stock options, vesting of restricted stock units or conversion ofconvertible preferred shares were not included in average diluted shares outstanding for the calculation of Dilutedearnings (loss) per share attributable to TDS shareholders because their effects were antidilutive. The number of suchCommon Shares excluded is shown in the table below.
Year Ended December 31, 2015 2014 2013
(Shares in thousands)Stock options . . . . . . . . . . . . . . . . . . . . . . . . . . . . . . . . . . . . . . . . . . . . . . . . . . . . . . . . . . . . 4,499 8,984 7,120Restricted stock units . . . . . . . . . . . . . . . . . . . . . . . . . . . . . . . . . . . . . . . . . . . . . . . . . . . . . . . 190 839 171Preferred shares . . . . . . . . . . . . . . . . . . . . . . . . . . . . . . . . . . . . . . . . . . . . . . . . . . . . . . . . . . – 56 –
NOTE 6 ACQUISITIONS, DIVESTITURES AND EXCHANGESDivestiture Transaction
On May 16, 2013, pursuant to a Purchase and Sale Agreement, U.S. Cellular sold customers and certain PCS spectrumlicenses to subsidiaries of Sprint Corp. fka Sprint Nextel Corporation (‘‘Sprint’’) in U.S. Cellular’s Chicago, central Illinois,St. Louis and certain Indiana/Michigan/Ohio markets (‘‘Divestiture Markets’’) in consideration for $480 million in cash. ThePurchase and Sale Agreement also contemplated certain other agreements, together with the Purchase and SaleAgreement collectively referred to as the ‘‘Divestiture Transaction.’’
78
TELEPHONE AND DATA SYSTEMS, INC. NOTES TO CONSOLIDATED FINANCIAL STATEMENTS
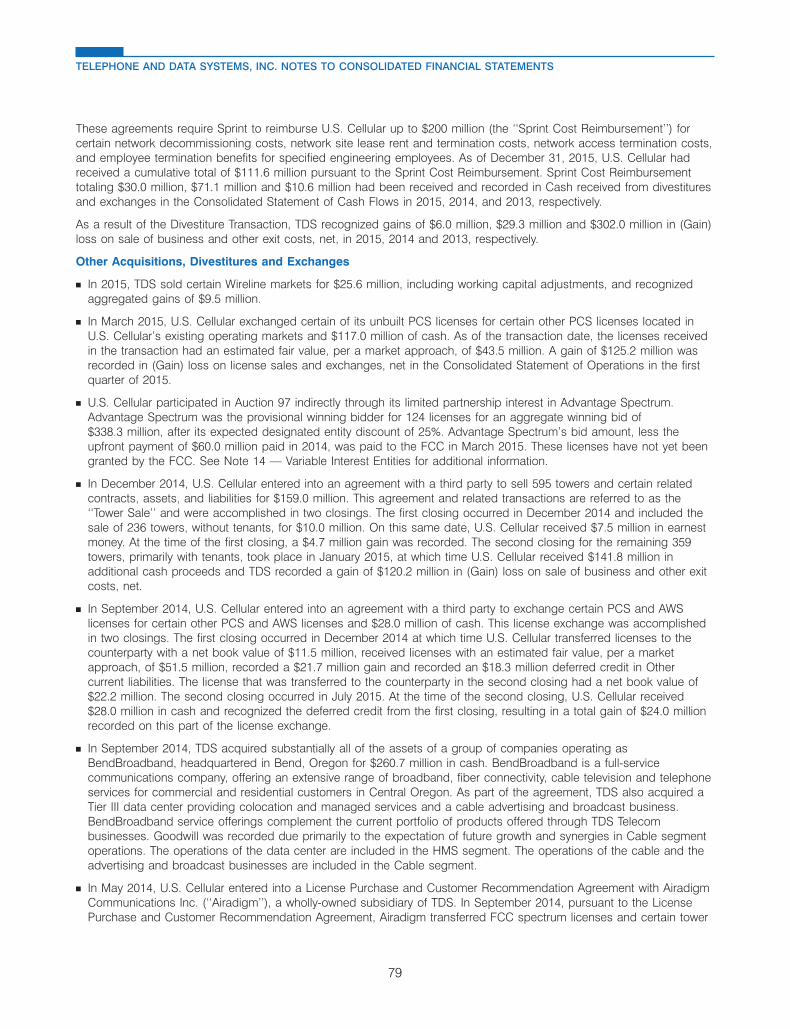
These agreements require Sprint to reimburse U.S. Cellular up to $200 million (the ‘‘Sprint Cost Reimbursement’’) forcertain network decommissioning costs, network site lease rent and termination costs, network access termination costs,and employee termination benefits for specified engineering employees. As of December 31, 2015, U.S. Cellular hadreceived a cumulative total of $111.6 million pursuant to the Sprint Cost Reimbursement. Sprint Cost Reimbursementtotaling $30.0 million, $71.1 million and $10.6 million had been received and recorded in Cash received from divestituresand exchanges in the Consolidated Statement of Cash Flows in 2015, 2014, and 2013, respectively.
As a result of the Divestiture Transaction, TDS recognized gains of $6.0 million, $29.3 million and $302.0 million in (Gain)loss on sale of business and other exit costs, net, in 2015, 2014 and 2013, respectively.
Other Acquisitions, Divestitures and Exchanges
� In 2015, TDS sold certain Wireline markets for $25.6 million, including working capital adjustments, and recognizedaggregated gains of $9.5 million.
� In March 2015, U.S. Cellular exchanged certain of its unbuilt PCS licenses for certain other PCS licenses located inU.S. Cellular’s existing operating markets and $117.0 million of cash. As of the transaction date, the licenses receivedin the transaction had an estimated fair value, per a market approach, of $43.5 million. A gain of $125.2 million wasrecorded in (Gain) loss on license sales and exchanges, net in the Consolidated Statement of Operations in the firstquarter of 2015.
� U.S. Cellular participated in Auction 97 indirectly through its limited partnership interest in Advantage Spectrum.Advantage Spectrum was the provisional winning bidder for 124 licenses for an aggregate winning bid of$338.3 million, after its expected designated entity discount of 25%. Advantage Spectrum’s bid amount, less theupfront payment of $60.0 million paid in 2014, was paid to the FCC in March 2015. These licenses have not yet beengranted by the FCC. See Note 14 — Variable Interest Entities for additional information.
� In December 2014, U.S. Cellular entered into an agreement with a third party to sell 595 towers and certain relatedcontracts, assets, and liabilities for $159.0 million. This agreement and related transactions are referred to as the‘‘Tower Sale’’ and were accomplished in two closings. The first closing occurred in December 2014 and included thesale of 236 towers, without tenants, for $10.0 million. On this same date, U.S. Cellular received $7.5 million in earnestmoney. At the time of the first closing, a $4.7 million gain was recorded. The second closing for the remaining 359towers, primarily with tenants, took place in January 2015, at which time U.S. Cellular received $141.8 million inadditional cash proceeds and TDS recorded a gain of $120.2 million in (Gain) loss on sale of business and other exitcosts, net.
� In September 2014, U.S. Cellular entered into an agreement with a third party to exchange certain PCS and AWSlicenses for certain other PCS and AWS licenses and $28.0 million of cash. This license exchange was accomplishedin two closings. The first closing occurred in December 2014 at which time U.S. Cellular transferred licenses to thecounterparty with a net book value of $11.5 million, received licenses with an estimated fair value, per a marketapproach, of $51.5 million, recorded a $21.7 million gain and recorded an $18.3 million deferred credit in Othercurrent liabilities. The license that was transferred to the counterparty in the second closing had a net book value of$22.2 million. The second closing occurred in July 2015. At the time of the second closing, U.S. Cellular received$28.0 million in cash and recognized the deferred credit from the first closing, resulting in a total gain of $24.0 millionrecorded on this part of the license exchange.
� In September 2014, TDS acquired substantially all of the assets of a group of companies operating asBendBroadband, headquartered in Bend, Oregon for $260.7 million in cash. BendBroadband is a full-servicecommunications company, offering an extensive range of broadband, fiber connectivity, cable television and telephoneservices for commercial and residential customers in Central Oregon. As part of the agreement, TDS also acquired aTier III data center providing colocation and managed services and a cable advertising and broadcast business.BendBroadband service offerings complement the current portfolio of products offered through TDS Telecombusinesses. Goodwill was recorded due primarily to the expectation of future growth and synergies in Cable segmentoperations. The operations of the data center are included in the HMS segment. The operations of the cable and theadvertising and broadcast businesses are included in the Cable segment.
� In May 2014, U.S. Cellular entered into a License Purchase and Customer Recommendation Agreement with AiradigmCommunications Inc. (‘‘Airadigm’’), a wholly-owned subsidiary of TDS. In September 2014, pursuant to the LicensePurchase and Customer Recommendation Agreement, Airadigm transferred FCC spectrum licenses and certain tower
79
TELEPHONE AND DATA SYSTEMS, INC. NOTES TO CONSOLIDATED FINANCIAL STATEMENTS
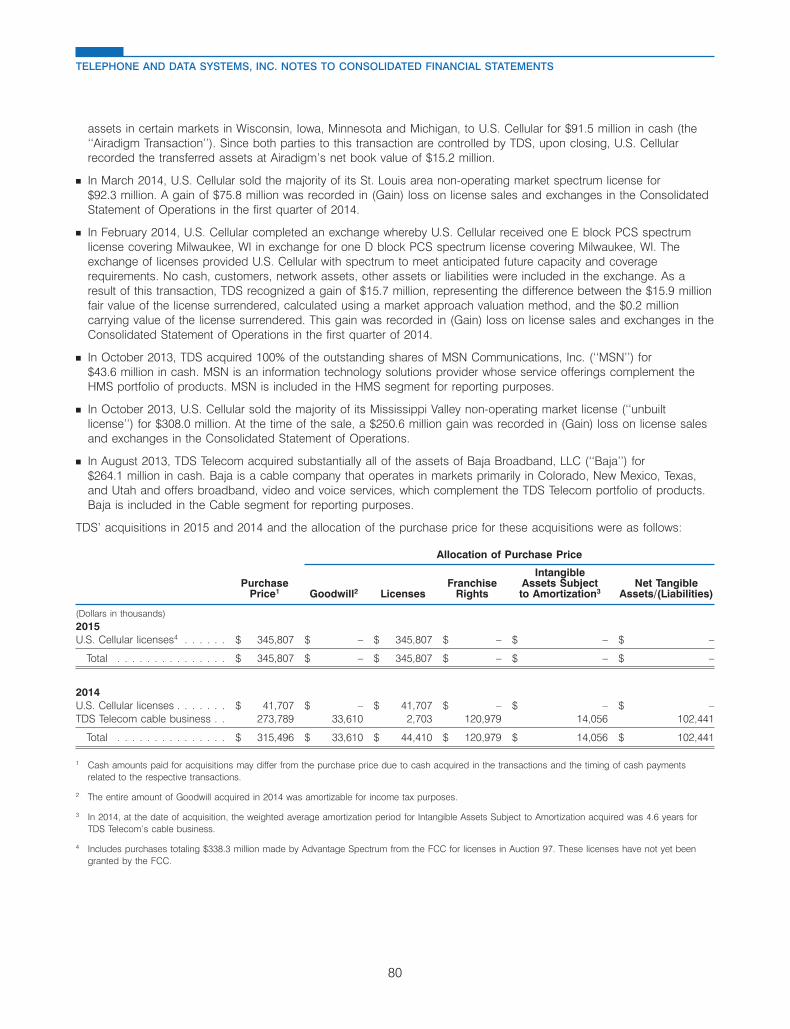
assets in certain markets in Wisconsin, Iowa, Minnesota and Michigan, to U.S. Cellular for $91.5 million in cash (the‘‘Airadigm Transaction’’). Since both parties to this transaction are controlled by TDS, upon closing, U.S. Cellularrecorded the transferred assets at Airadigm’s net book value of $15.2 million.
� In March 2014, U.S. Cellular sold the majority of its St. Louis area non-operating market spectrum license for$92.3 million. A gain of $75.8 million was recorded in (Gain) loss on license sales and exchanges in the ConsolidatedStatement of Operations in the first quarter of 2014.
� In February 2014, U.S. Cellular completed an exchange whereby U.S. Cellular received one E block PCS spectrumlicense covering Milwaukee, WI in exchange for one D block PCS spectrum license covering Milwaukee, WI. Theexchange of licenses provided U.S. Cellular with spectrum to meet anticipated future capacity and coveragerequirements. No cash, customers, network assets, other assets or liabilities were included in the exchange. As aresult of this transaction, TDS recognized a gain of $15.7 million, representing the difference between the $15.9 millionfair value of the license surrendered, calculated using a market approach valuation method, and the $0.2 millioncarrying value of the license surrendered. This gain was recorded in (Gain) loss on license sales and exchanges in theConsolidated Statement of Operations in the first quarter of 2014.
� In October 2013, TDS acquired 100% of the outstanding shares of MSN Communications, Inc. (‘‘MSN’’) for$43.6 million in cash. MSN is an information technology solutions provider whose service offerings complement theHMS portfolio of products. MSN is included in the HMS segment for reporting purposes.
� In October 2013, U.S. Cellular sold the majority of its Mississippi Valley non-operating market license (‘‘unbuiltlicense’’) for $308.0 million. At the time of the sale, a $250.6 million gain was recorded in (Gain) loss on license salesand exchanges in the Consolidated Statement of Operations.
� In August 2013, TDS Telecom acquired substantially all of the assets of Baja Broadband, LLC (‘‘Baja’’) for$264.1 million in cash. Baja is a cable company that operates in markets primarily in Colorado, New Mexico, Texas,and Utah and offers broadband, video and voice services, which complement the TDS Telecom portfolio of products.Baja is included in the Cable segment for reporting purposes.
TDS’ acquisitions in 2015 and 2014 and the allocation of the purchase price for these acquisitions were as follows:
Allocation of Purchase Price
IntangiblePurchase Franchise Assets Subject Net Tangible
Price1 Goodwill2 Licenses Rights to Amortization3 Assets/(Liabilities)
(Dollars in thousands)2015U.S. Cellular licenses4 . . . . . . $ 345,807 $ – $ 345,807 $ – $ – $ –
Total . . . . . . . . . . . . . . . $ 345,807 $ – $ 345,807 $ – $ – $ –
2014U.S. Cellular licenses . . . . . . . $ 41,707 $ – $ 41,707 $ – $ – $ –TDS Telecom cable business . . 273,789 33,610 2,703 120,979 14,056 102,441
Total . . . . . . . . . . . . . . . $ 315,496 $ 33,610 $ 44,410 $ 120,979 $ 14,056 $ 102,441
1 Cash amounts paid for acquisitions may differ from the purchase price due to cash acquired in the transactions and the timing of cash paymentsrelated to the respective transactions.
2 The entire amount of Goodwill acquired in 2014 was amortizable for income tax purposes.
3 In 2014, at the date of acquisition, the weighted average amortization period for Intangible Assets Subject to Amortization acquired was 4.6 years forTDS Telecom’s cable business.
4 Includes purchases totaling $338.3 million made by Advantage Spectrum from the FCC for licenses in Auction 97. These licenses have not yet beengranted by the FCC.
80
TELEPHONE AND DATA SYSTEMS, INC. NOTES TO CONSOLIDATED FINANCIAL STATEMENTS
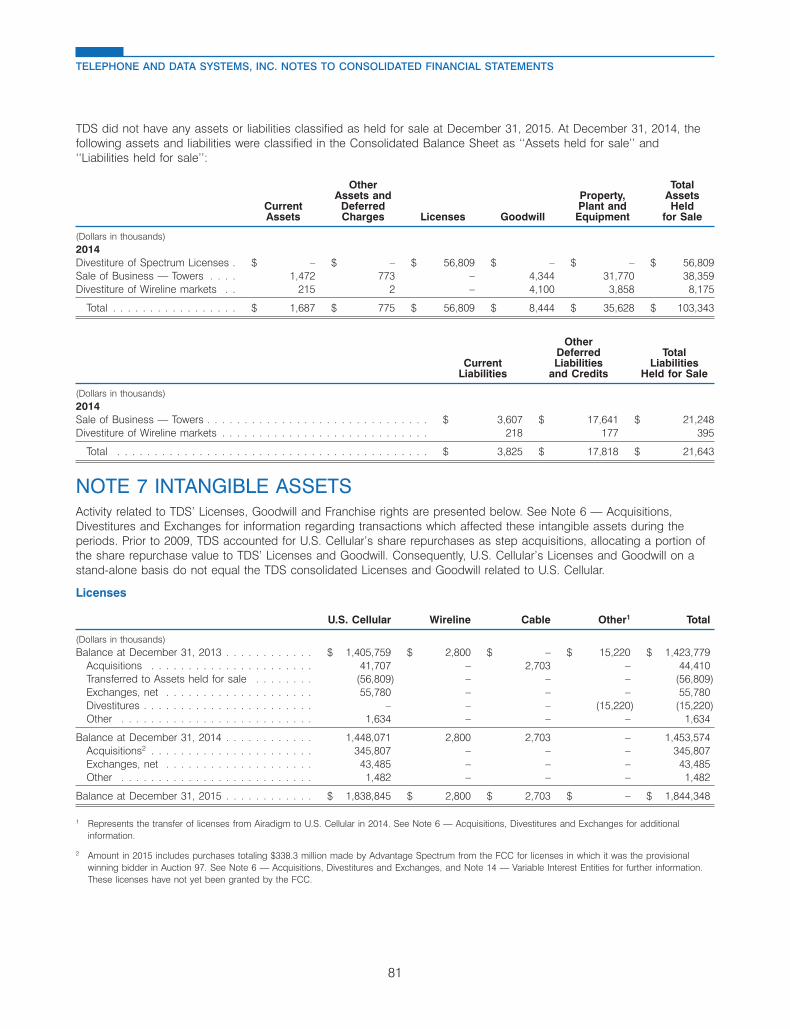
TDS did not have any assets or liabilities classified as held for sale at December 31, 2015. At December 31, 2014, thefollowing assets and liabilities were classified in the Consolidated Balance Sheet as ‘‘Assets held for sale’’ and‘‘Liabilities held for sale’’:
Other TotalAssets and Property, Assets
Current Deferred Plant and HeldAssets Charges Licenses Goodwill Equipment for Sale
(Dollars in thousands)2014Divestiture of Spectrum Licenses . $ – $ – $ 56,809 $ – $ – $ 56,809Sale of Business — Towers . . . . 1,472 773 – 4,344 31,770 38,359Divestiture of Wireline markets . . 215 2 – 4,100 3,858 8,175
Total . . . . . . . . . . . . . . . . . $ 1,687 $ 775 $ 56,809 $ 8,444 $ 35,628 $ 103,343
OtherDeferred Total
Current Liabilities LiabilitiesLiabilities and Credits Held for Sale
(Dollars in thousands)2014Sale of Business — Towers . . . . . . . . . . . . . . . . . . . . . . . . . . . . . . $ 3,607 $ 17,641 $ 21,248Divestiture of Wireline markets . . . . . . . . . . . . . . . . . . . . . . . . . . . . 218 177 395
Total . . . . . . . . . . . . . . . . . . . . . . . . . . . . . . . . . . . . . . . . . . $ 3,825 $ 17,818 $ 21,643
NOTE 7 INTANGIBLE ASSETSActivity related to TDS’ Licenses, Goodwill and Franchise rights are presented below. See Note 6 — Acquisitions,Divestitures and Exchanges for information regarding transactions which affected these intangible assets during theperiods. Prior to 2009, TDS accounted for U.S. Cellular’s share repurchases as step acquisitions, allocating a portion ofthe share repurchase value to TDS’ Licenses and Goodwill. Consequently, U.S. Cellular’s Licenses and Goodwill on astand-alone basis do not equal the TDS consolidated Licenses and Goodwill related to U.S. Cellular.
Licenses
U.S. Cellular Wireline Cable Other1 Total
(Dollars in thousands)Balance at December 31, 2013 . . . . . . . . . . . . $ 1,405,759 $ 2,800 $ – $ 15,220 $ 1,423,779
Acquisitions . . . . . . . . . . . . . . . . . . . . . . 41,707 – 2,703 – 44,410Transferred to Assets held for sale . . . . . . . . (56,809) – – – (56,809)Exchanges, net . . . . . . . . . . . . . . . . . . . . 55,780 – – – 55,780Divestitures . . . . . . . . . . . . . . . . . . . . . . . – – – (15,220) (15,220)Other . . . . . . . . . . . . . . . . . . . . . . . . . . 1,634 – – – 1,634
Balance at December 31, 2014 . . . . . . . . . . . . 1,448,071 2,800 2,703 – 1,453,574Acquisitions2 . . . . . . . . . . . . . . . . . . . . . . 345,807 – – – 345,807Exchanges, net . . . . . . . . . . . . . . . . . . . . 43,485 – – – 43,485Other . . . . . . . . . . . . . . . . . . . . . . . . . . 1,482 – – – 1,482
Balance at December 31, 2015 . . . . . . . . . . . . $ 1,838,845 $ 2,800 $ 2,703 $ – $ 1,844,348
1 Represents the transfer of licenses from Airadigm to U.S. Cellular in 2014. See Note 6 — Acquisitions, Divestitures and Exchanges for additionalinformation.
2 Amount in 2015 includes purchases totaling $338.3 million made by Advantage Spectrum from the FCC for licenses in which it was the provisionalwinning bidder in Auction 97. See Note 6 — Acquisitions, Divestitures and Exchanges, and Note 14 — Variable Interest Entities for further information.These licenses have not yet been granted by the FCC.
81
TELEPHONE AND DATA SYSTEMS, INC. NOTES TO CONSOLIDATED FINANCIAL STATEMENTS
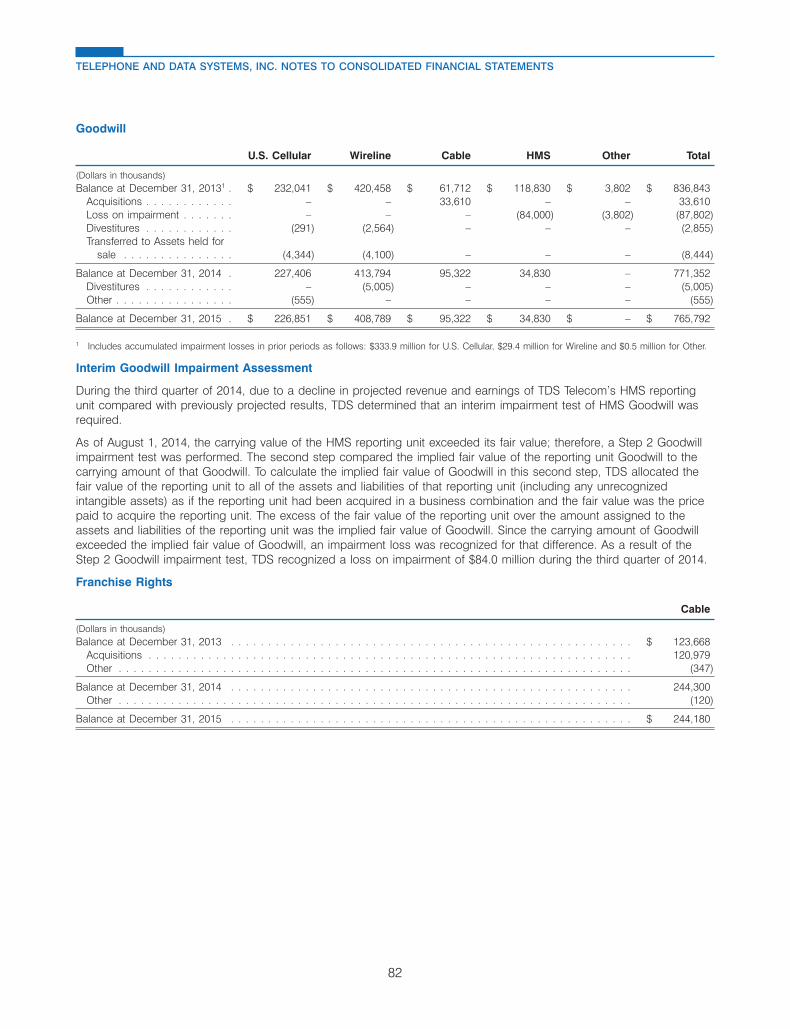
Goodwill
U.S. Cellular Wireline Cable HMS Other Total
(Dollars in thousands)Balance at December 31, 20131 . $ 232,041 $ 420,458 $ 61,712 $ 118,830 $ 3,802 $ 836,843
Acquisitions . . . . . . . . . . . . – – 33,610 – – 33,610Loss on impairment . . . . . . . – – – (84,000) (3,802) (87,802)Divestitures . . . . . . . . . . . . (291) (2,564) – – – (2,855)Transferred to Assets held for
sale . . . . . . . . . . . . . . . (4,344) (4,100) – – – (8,444)
Balance at December 31, 2014 . 227,406 413,794 95,322 34,830 – 771,352Divestitures . . . . . . . . . . . . – (5,005) – – – (5,005)Other . . . . . . . . . . . . . . . . (555) – – – – (555)
Balance at December 31, 2015 . $ 226,851 $ 408,789 $ 95,322 $ 34,830 $ – $ 765,792
1 Includes accumulated impairment losses in prior periods as follows: $333.9 million for U.S. Cellular, $29.4 million for Wireline and $0.5 million for Other.
Interim Goodwill Impairment Assessment
During the third quarter of 2014, due to a decline in projected revenue and earnings of TDS Telecom’s HMS reportingunit compared with previously projected results, TDS determined that an interim impairment test of HMS Goodwill wasrequired.
As of August 1, 2014, the carrying value of the HMS reporting unit exceeded its fair value; therefore, a Step 2 Goodwillimpairment test was performed. The second step compared the implied fair value of the reporting unit Goodwill to thecarrying amount of that Goodwill. To calculate the implied fair value of Goodwill in this second step, TDS allocated thefair value of the reporting unit to all of the assets and liabilities of that reporting unit (including any unrecognizedintangible assets) as if the reporting unit had been acquired in a business combination and the fair value was the pricepaid to acquire the reporting unit. The excess of the fair value of the reporting unit over the amount assigned to theassets and liabilities of the reporting unit was the implied fair value of Goodwill. Since the carrying amount of Goodwillexceeded the implied fair value of Goodwill, an impairment loss was recognized for that difference. As a result of theStep 2 Goodwill impairment test, TDS recognized a loss on impairment of $84.0 million during the third quarter of 2014.
Franchise Rights
Cable
(Dollars in thousands)Balance at December 31, 2013 . . . . . . . . . . . . . . . . . . . . . . . . . . . . . . . . . . . . . . . . . . . . . . . . . . . . . . $ 123,668
Acquisitions . . . . . . . . . . . . . . . . . . . . . . . . . . . . . . . . . . . . . . . . . . . . . . . . . . . . . . . . . . . . . . . . . 120,979Other . . . . . . . . . . . . . . . . . . . . . . . . . . . . . . . . . . . . . . . . . . . . . . . . . . . . . . . . . . . . . . . . . . . . . (347)
Balance at December 31, 2014 . . . . . . . . . . . . . . . . . . . . . . . . . . . . . . . . . . . . . . . . . . . . . . . . . . . . . . 244,300Other . . . . . . . . . . . . . . . . . . . . . . . . . . . . . . . . . . . . . . . . . . . . . . . . . . . . . . . . . . . . . . . . . . . . . (120)
Balance at December 31, 2015 . . . . . . . . . . . . . . . . . . . . . . . . . . . . . . . . . . . . . . . . . . . . . . . . . . . . . . $ 244,180
82
TELEPHONE AND DATA SYSTEMS, INC. NOTES TO CONSOLIDATED FINANCIAL STATEMENTS

NOTE 8 INVESTMENTS IN UNCONSOLIDATED ENTITIESInvestments in unconsolidated entities consist of amounts invested in wireless and wireline entities in which TDS holds anoncontrolling interest. These investments are accounted for using either the equity or cost method as shown in thefollowing table:
December 31, 2015 2014
(Dollars in thousands)Equity method investments:
Capital contributions, loans, advances and adjustments . . . . . . . . . . . . . . . . . . . . . . . . . . . $ 123,250 $ 127,939Cumulative share of income . . . . . . . . . . . . . . . . . . . . . . . . . . . . . . . . . . . . . . . . . . . . 1,468,312 1,323,898Cumulative share of distributions . . . . . . . . . . . . . . . . . . . . . . . . . . . . . . . . . . . . . . . . . (1,205,497) (1,145,438)
386,065 306,399Cost method investments . . . . . . . . . . . . . . . . . . . . . . . . . . . . . . . . . . . . . . . . . . . . . . . 15,655 15,330
Total investments in unconsolidated entities . . . . . . . . . . . . . . . . . . . . . . . . . . . . . . . . . . . . $ 401,720 $ 321,729
The following tables, which are based on information provided in part by third parties, summarize the combined assets,liabilities and equity, and results of operations of TDS’ equity method investments:
December 31, 2015 2014
(Dollars in thousands)Assets
Current . . . . . . . . . . . . . . . . . . . . . . . . . . . . . . . . . . . . . . . . . . . . . . . . . . . . . . . . . . $ 670,723 $ 733,133Due from affiliates . . . . . . . . . . . . . . . . . . . . . . . . . . . . . . . . . . . . . . . . . . . . . . . . . . . 88,685 303,322Property and other . . . . . . . . . . . . . . . . . . . . . . . . . . . . . . . . . . . . . . . . . . . . . . . . . . . 4,604,312 2,345,562
$ 5,363,720 $ 3,382,017
Liabilities and EquityCurrent liabilities . . . . . . . . . . . . . . . . . . . . . . . . . . . . . . . . . . . . . . . . . . . . . . . . . . . . $ 810,121 $ 407,073Deferred credits . . . . . . . . . . . . . . . . . . . . . . . . . . . . . . . . . . . . . . . . . . . . . . . . . . . . 242,301 175,516Long-term liabilities . . . . . . . . . . . . . . . . . . . . . . . . . . . . . . . . . . . . . . . . . . . . . . . . . . 157,785 29,342Long-term capital lease obligations . . . . . . . . . . . . . . . . . . . . . . . . . . . . . . . . . . . . . . . . 1,539 1,722Partners’ capital and shareholders’ equity . . . . . . . . . . . . . . . . . . . . . . . . . . . . . . . . . . . . . 4,151,974 2,768,364
$ 5,363,720 $ 3,382,017
Year Ended December 31, 2015 2014 2013
(Dollars in thousands)Results of Operations
Revenues . . . . . . . . . . . . . . . . . . . . . . . . . . . . . . . . . . . . . . . . . . . . . . $ 6,979,184 $ 6,700,266 $ 6,239,200Operating expenses . . . . . . . . . . . . . . . . . . . . . . . . . . . . . . . . . . . . . . . 5,245,216 5,063,925 4,492,372
Operating income . . . . . . . . . . . . . . . . . . . . . . . . . . . . . . . . . . . . . . . . . 1,733,968 1,636,341 1,746,828Other income (expense), net . . . . . . . . . . . . . . . . . . . . . . . . . . . . . . . . . . (9,049) 6,741 4,019
Net income . . . . . . . . . . . . . . . . . . . . . . . . . . . . . . . . . . . . . . . . . . . . . $ 1,724,919 $ 1,643,082 $ 1,750,847
NY1 & NY2 Deconsolidation
U.S. Cellular holds a 60.00% interest in St. Lawrence Seaway RSA Cellular Partnership (‘‘NY1’’) and a 57.14% interest inNew York RSA 2 Cellular Partnership (‘‘NY2’’) (together with NY1, the ‘‘Partnerships’’). The remaining interests in thePartnerships are held by Cellco Partnership d/b/a Verizon Wireless (‘‘Verizon Wireless’’). Prior to April 3, 2013, becauseU.S. Cellular owned a greater than 50% interest in each of these Partnerships and based on U.S. Cellular’s rights underthe Partnership Agreements, U.S. Cellular consolidated the financial results of these Partnerships in accordance withGAAP.
83
TELEPHONE AND DATA SYSTEMS, INC. NOTES TO CONSOLIDATED FINANCIAL STATEMENTS

On April 3, 2013, U.S. Cellular entered into an agreement with Verizon Wireless relating to the Partnerships. Theagreement amends the Partnership Agreements in several ways which provide Verizon Wireless with substantiveparticipating rights that allow Verizon Wireless to make decisions that are in the ordinary course of business of thePartnerships and which are significant to directing and executing the activities of the business. Accordingly, as requiredby GAAP, TDS deconsolidated the Partnerships effective as of April 3, 2013 and thereafter reported them as equitymethod investments in its consolidated financial statements (‘‘NY1 & NY2 Deconsolidation’’). After the NY1 &NY2 Deconsolidation, U.S. Cellular retained the same ownership percentages in the Partnerships and continues to reportthe same percentages of income from the Partnerships. Effective April 3, 2013, TDS’ income from the Partnerships isreported in Equity in earnings of unconsolidated entities in the Consolidated Statement of Operations.
In accordance with GAAP, as a result of the NY1 & NY2 Deconsolidation, U.S. Cellular’s interest in the Partnerships wasreflected in Investments in unconsolidated entities at a fair value of $114.8 million as of April 3, 2013. Recording U.S.Cellular’s interest in the Partnerships required allocation of the excess of fair value over book value to customer lists,licenses, a favorable contract and goodwill of the Partnerships. Amortization expense related to customer lists and thefavorable contract will be recognized over their respective useful lives and is included in Equity in earnings ofunconsolidated entities in the Consolidated Statement of Operations. In addition, TDS recognized a non-cash pre-taxgain of $14.5 million in the second quarter of 2013. The gain was recorded in Gain (loss) on investments in theConsolidated Statement of Operations.
NOTE 9 PROPERTY, PLANT AND EQUIPMENTTDS’ Property, plant and equipment in service and under construction, and related accumulated depreciation andamortization, as of December 31, 2015 and 2014 were as follows:
Useful LivesDecember 31, (Years) 2015 2014
(Dollars in thousands)Land . . . . . . . . . . . . . . . . . . . . . . . . . . . . . . . . . . . . . . . . . . . . . . . . . N/A $ 54,567 $ 52,946Buildings . . . . . . . . . . . . . . . . . . . . . . . . . . . . . . . . . . . . . . . . . . . . . . . 5-40 506,486 480,028Leasehold and land improvements . . . . . . . . . . . . . . . . . . . . . . . . . . . . . . . 1-30 1,137,414 1,130,468Cable and wire . . . . . . . . . . . . . . . . . . . . . . . . . . . . . . . . . . . . . . . . . . . 15-35 1,688,606 1,628,782Network and switching equipment . . . . . . . . . . . . . . . . . . . . . . . . . . . . . . . 5-13 2,278,425 2,239,176Cell site equipment . . . . . . . . . . . . . . . . . . . . . . . . . . . . . . . . . . . . . . . . . 7-25 3,382,743 3,284,993Office furniture and equipment . . . . . . . . . . . . . . . . . . . . . . . . . . . . . . . . . . 3-10 586,975 634,853Other operating assets and equipment . . . . . . . . . . . . . . . . . . . . . . . . . . . . 3-12 205,132 204,625System development . . . . . . . . . . . . . . . . . . . . . . . . . . . . . . . . . . . . . . . . 1-7 1,459,437 1,319,930Work in process . . . . . . . . . . . . . . . . . . . . . . . . . . . . . . . . . . . . . . . . . . N/A 220,276 218,243
11,520,061 11,194,044Accumulated depreciation and amortization . . . . . . . . . . . . . . . . . . . . . . . . . . (7,755,584) (7,347,919)
$ 3,764,477 $ 3,846,125
Depreciation and amortization expense totaled $810.5 million, $797.6 million and $984.4 million in 2015, 2014 and 2013,respectively. In 2015, 2014 and 2013, (Gain) loss on asset disposals, net included charges of $22.2 million, $26.5 millionand $30.8 million, respectively, related to disposals of assets, trade-ins of older assets for replacement assets and otherretirements of assets from service in the normal course of business.
NOTE 10 ASSET RETIREMENT OBLIGATIONSU.S. Cellular is subject to asset retirement obligations associated with its leased cell sites, switching office sites, retailstore sites and office locations in its operating markets. Asset retirement obligations generally include obligations torestore leased land and retail store and office premises to their pre-lease conditions.
TDS Telecom owns poles, cable and wire and certain buildings and also leases data center and office space andproperty used for housing central office switching equipment and fiber cable. These assets and leases often haveremoval or remediation requirements associated with them. For example, TDS Telecom’s poles, cable and wire are oftenlocated on property that is not owned by TDS Telecom and are often subject to the provisions of easements, permits, or
84
TELEPHONE AND DATA SYSTEMS, INC. NOTES TO CONSOLIDATED FINANCIAL STATEMENTS
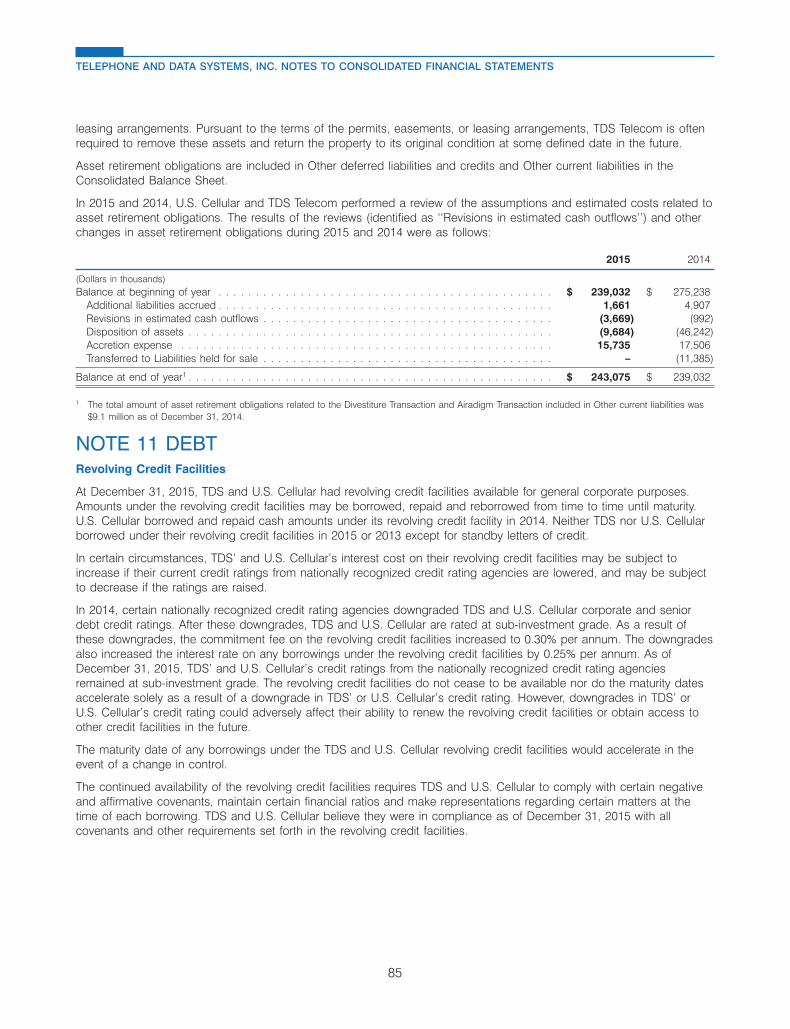
leasing arrangements. Pursuant to the terms of the permits, easements, or leasing arrangements, TDS Telecom is oftenrequired to remove these assets and return the property to its original condition at some defined date in the future.
Asset retirement obligations are included in Other deferred liabilities and credits and Other current liabilities in theConsolidated Balance Sheet.
In 2015 and 2014, U.S. Cellular and TDS Telecom performed a review of the assumptions and estimated costs related toasset retirement obligations. The results of the reviews (identified as ‘‘Revisions in estimated cash outflows’’) and otherchanges in asset retirement obligations during 2015 and 2014 were as follows:
2015 2014
(Dollars in thousands)Balance at beginning of year . . . . . . . . . . . . . . . . . . . . . . . . . . . . . . . . . . . . . . . . . . . . . $ 239,032 $ 275,238
Additional liabilities accrued . . . . . . . . . . . . . . . . . . . . . . . . . . . . . . . . . . . . . . . . . . . . . 1,661 4,907Revisions in estimated cash outflows . . . . . . . . . . . . . . . . . . . . . . . . . . . . . . . . . . . . . . . (3,669) (992)Disposition of assets . . . . . . . . . . . . . . . . . . . . . . . . . . . . . . . . . . . . . . . . . . . . . . . . . (9,684) (46,242)Accretion expense . . . . . . . . . . . . . . . . . . . . . . . . . . . . . . . . . . . . . . . . . . . . . . . . . . 15,735 17,506Transferred to Liabilities held for sale . . . . . . . . . . . . . . . . . . . . . . . . . . . . . . . . . . . . . . . – (11,385)
Balance at end of year1 . . . . . . . . . . . . . . . . . . . . . . . . . . . . . . . . . . . . . . . . . . . . . . . . . $ 243,075 $ 239,032
1 The total amount of asset retirement obligations related to the Divestiture Transaction and Airadigm Transaction included in Other current liabilities was$9.1 million as of December 31, 2014.
NOTE 11 DEBTRevolving Credit Facilities
At December 31, 2015, TDS and U.S. Cellular had revolving credit facilities available for general corporate purposes.Amounts under the revolving credit facilities may be borrowed, repaid and reborrowed from time to time until maturity.U.S. Cellular borrowed and repaid cash amounts under its revolving credit facility in 2014. Neither TDS nor U.S. Cellularborrowed under their revolving credit facilities in 2015 or 2013 except for standby letters of credit.
In certain circumstances, TDS’ and U.S. Cellular’s interest cost on their revolving credit facilities may be subject toincrease if their current credit ratings from nationally recognized credit rating agencies are lowered, and may be subjectto decrease if the ratings are raised.
In 2014, certain nationally recognized credit rating agencies downgraded TDS and U.S. Cellular corporate and seniordebt credit ratings. After these downgrades, TDS and U.S. Cellular are rated at sub-investment grade. As a result ofthese downgrades, the commitment fee on the revolving credit facilities increased to 0.30% per annum. The downgradesalso increased the interest rate on any borrowings under the revolving credit facilities by 0.25% per annum. As ofDecember 31, 2015, TDS’ and U.S. Cellular’s credit ratings from the nationally recognized credit rating agenciesremained at sub-investment grade. The revolving credit facilities do not cease to be available nor do the maturity datesaccelerate solely as a result of a downgrade in TDS’ or U.S. Cellular’s credit rating. However, downgrades in TDS’ orU.S. Cellular’s credit rating could adversely affect their ability to renew the revolving credit facilities or obtain access toother credit facilities in the future.
The maturity date of any borrowings under the TDS and U.S. Cellular revolving credit facilities would accelerate in theevent of a change in control.
The continued availability of the revolving credit facilities requires TDS and U.S. Cellular to comply with certain negativeand affirmative covenants, maintain certain financial ratios and make representations regarding certain matters at thetime of each borrowing. TDS and U.S. Cellular believe they were in compliance as of December 31, 2015 with allcovenants and other requirements set forth in the revolving credit facilities.
85
TELEPHONE AND DATA SYSTEMS, INC. NOTES TO CONSOLIDATED FINANCIAL STATEMENTS

The following table summarizes the terms of such revolving credit facilities as of December 31, 2015:
TDS U.S. Cellular
(Dollars in millions)Maximum borrowing capacity . . . . . . . . . . . . . . . . . . . . . . . . . . . . . . . . . . . . . . . . . . . . $ 400.0 $ 300.0Letters of credit outstanding . . . . . . . . . . . . . . . . . . . . . . . . . . . . . . . . . . . . . . . . . . . . . $ 0.6 $ 17.5Amount borrowed . . . . . . . . . . . . . . . . . . . . . . . . . . . . . . . . . . . . . . . . . . . . . . . . . . . $ – $ –Amount available for use . . . . . . . . . . . . . . . . . . . . . . . . . . . . . . . . . . . . . . . . . . . . . . . $ 399.4 $ 282.5Illustrative borrowing rate: One-month London Interbank Offered Rate (‘‘LIBOR’’) plus contractual
spread1 . . . . . . . . . . . . . . . . . . . . . . . . . . . . . . . . . . . . . . . . . . . . . . . . . . . . . . . . 2.18% 2.18%Illustrative LIBOR Rate . . . . . . . . . . . . . . . . . . . . . . . . . . . . . . . . . . . . . . . . . . . . . . . 0.43% 0.43%Contractual spread . . . . . . . . . . . . . . . . . . . . . . . . . . . . . . . . . . . . . . . . . . . . . . . . . 1.75% 1.75%
Commitment fees on amount available for use2 . . . . . . . . . . . . . . . . . . . . . . . . . . . . . . . . . 0.30% 0.30%
Agreement date . . . . . . . . . . . . . . . . . . . . . . . . . . . . . . . . . . . . . . . . . . . . . . . . . . . . Dec 2010 Dec 2010Maturity date . . . . . . . . . . . . . . . . . . . . . . . . . . . . . . . . . . . . . . . . . . . . . . . . . . . . . . Dec 2017 Dec 2017
Fees incurred attributable to the Revolving Credit Facility are as follows:Fees incurred as a percent of Maximum borrowing capacity for 2015 . . . . . . . . . . . . . . . . . . 0.33% 0.29%Fees incurred, amount
2015 . . . . . . . . . . . . . . . . . . . . . . . . . . . . . . . . . . . . . . . . . . . . . . . . . . . . . . . . $ 1.3 $ 0.92014 . . . . . . . . . . . . . . . . . . . . . . . . . . . . . . . . . . . . . . . . . . . . . . . . . . . . . . . . $ 0.9 $ 3.02013 . . . . . . . . . . . . . . . . . . . . . . . . . . . . . . . . . . . . . . . . . . . . . . . . . . . . . . . . $ 0.9 $ 0.8
1 Borrowings under the revolving credit facility bear interest at LIBOR plus a contractual spread based on TDS’ or U.S. Cellular’s credit rating or, at TDS’or U.S. Cellular’s option, an alternate ‘‘Base Rate’’ as defined in the revolving credit agreement. TDS and U.S. Cellular may select a borrowing period ofeither one, two, three or six months (or other period of twelve months or less if requested by TDS or U.S. Cellular and approved by the lenders).
2 The revolving credit facility has commitment fees based on the unsecured senior debt ratings assigned to TDS and U.S. Cellular by certain ratingsagencies.
In connection with U.S. Cellular’s revolving credit facility, TDS and U.S. Cellular entered into a subordination agreementdated December 17, 2010 together with the administrative agent for the lenders under U.S. Cellular’s revolving creditagreement. Pursuant to this subordination agreement, (a) any consolidated funded indebtedness from U.S. Cellular toTDS will be unsecured and (b) any (i) consolidated funded indebtedness from U.S. Cellular to TDS (other than‘‘refinancing indebtedness’’ as defined in the subordination agreement) in excess of $105 million and (ii) refinancingindebtedness in excess of $250 million will be subordinated and made junior in right of payment to the prior payment infull of obligations to the lenders under U.S. Cellular’s revolving credit agreement. As of December 31, 2015, U.S. Cellularhad no outstanding consolidated funded indebtedness or refinancing indebtedness that was subordinated to therevolving credit agreement pursuant to the subordination agreement.
In July 2014, TDS and U.S. Cellular entered into amendments to the revolving credit facilities agreements whichincreased the Consolidated Leverage Ratio (the ratio of Consolidated Funded Indebtedness to Consolidated Earningsbefore interest, taxes, depreciation and amortization) that the companies are required to maintain. Beginning July 1,2014, TDS and U.S. Cellular are required to maintain the Consolidated Leverage Ratio at a level not to exceed 3.75 to1.00 for the period of the four fiscal quarters most recently ended (this was 3.00 to 1.00 prior to July 1, 2014). The termsof the amendment decrease the maximum permitted Consolidated Leverage Ratio beginning January 1, 2016 from 3.75to 3.50, with further decreases effective July 1, 2016 and January 1, 2017 (and will return to 3.00 to 1.00 at that time).For the twelve months ended December 31, 2015, the actual Consolidated Leverage Ratio was 2.25 to 1.00. Futurechanges in TDS’ and U.S. Cellular’s financial condition could negatively impact their ability to meet the financialcovenants and requirements in their revolving credit facilities agreements. TDS also has certain other non-material creditfacilities from time to time.
At December 31, 2015, TDS had recorded $3.6 million of issuance costs related to the revolving credit facilities which isincluded in Other assets and deferred charges in the Consolidated Balance Sheet.
Term Loan
In January 2015, U.S. Cellular entered into a senior term loan credit facility. In July 2015, U.S. Cellular borrowed the fullamount of $225 million available under this facility in two separate draws. The interest rate on outstanding borrowings
86
TELEPHONE AND DATA SYSTEMS, INC. NOTES TO CONSOLIDATED FINANCIAL STATEMENTS
will be reset at three and six month intervals at a rate of LIBOR plus 250 basis points. This credit facility provides for thedraws to be continued on a long-term basis under terms that are readily determinable. U.S. Cellular has the ability andintent to carry the debt for the duration of the agreement. Principal reductions will be due and payable in quarterlyinstallments of $2.8 million beginning in March 2016 through December 2021, and the remaining unpaid balance will bedue and payable in January 2022. This facility was entered into for general corporate purposes, including workingcapital, spectrum purchases and capital expenditures.
The continued availability of the term loan facility requires U.S. Cellular to comply with certain negative and affirmativecovenants, maintain certain financial ratios and make representations regarding certain matters at the time of eachborrowing, that are substantially the same as those in the U.S. Cellular revolving credit facility described above.
In connection with U.S. Cellular’s term loan credit facility, TDS and U.S. Cellular entered into a subordination agreementdated January 21, 2015 together with the administrative agent for the lenders under U.S. Cellular’s term loan creditagreement, which is substantially the same as the subordination agreement in the U.S. Cellular revolving credit facilitydescribed above. As of December 31, 2015, U.S. Cellular had no outstanding consolidated funded indebtedness orrefinancing indebtedness that was subordinated to the term loan facility pursuant to this subordination agreement.
Other Long-Term Debt
In November 2015, U.S. Cellular issued $300 million of 7.25% Senior Notes due 2064, and received cash proceeds of$289.7 million after payment of debt issuance costs of $10.3 million. These funds will be used for general corporatepurposes, including working capital, spectrum purchases and capital expenditures.
87
TELEPHONE AND DATA SYSTEMS, INC. NOTES TO CONSOLIDATED FINANCIAL STATEMENTS

Long-term debt as of December 31, 2015 and 2014 was as follows:
December 31,
2015 2014
Less LessUnamortized Unamortized
discount discountand debt and debt
Issuance Maturity Call Principal issuance Principal issuancedate date date Amount costs Total Amount costs Total
(Dollars in thousands)TDS:
Unsecured Senior NotesMarch March March
6.625% . . . . . . . 2005 2045 2010 $ 116,250 $ 3,567 $ 112,683 $ 116,250 $ 3,604 $ 112,646Nov Nov Nov
6.875% . . . . . . . 2010 2059 2015 225,000 7,537 217,463 225,000 7,561 217,439March March March
7.000% . . . . . . . 2011 2060 2016 300,000 9,621 290,379 300,000 9,650 290,350Nov Dec Dec
5.875% . . . . . . . 2012 2061 2017 195,000 6,718 188,282 195,000 6,744 188,256Oct Oct
Purchase contract . . 2001 2021 1,097 – 1,097 1,097 – 1,097
Total Parent . . 837,347 27,443 809,904 837,347 27,559 809,788
Subsidiaries:U.S. Cellular –
Unsecured Senior NotesDec 2003
and Dec Dec6.700% . . . . . . . June 2004 2033 2003 544,000 15,247 528,753 544,000 15,656 528,344
May May May6.950% . . . . . . . 2011 2060 2016 342,000 10,905 331,095 342,000 10,937 331,063
Dec Dec Dec7.250% . . . . . . . 2014 2063 2019 275,000 9,629 265,371 275,000 9,644 265,356
Nov Nov Nov7.250% . . . . . . . 2015 2064 2020 300,000 10,316 289,684 – – –
Jan JanTerm Loan . . . . . 2015 2022 225,000 2,283 222,717 – – –Obligation on capital leases . 2,200 – 2,200 2,143 – 2,143
TDS Telecom –Rural Utilities Service (‘‘RUS’’) and other notes . 691 691 699 699Obligation on capital leases . . . . . . . . . . . . 733 – 733 767 – 767
Other –Through
Long-term notes . 2016 2,961 – 2,961 3,686 – 3,686Obligation on capital leases . 24 24 31 – 31
Total Subsidiaries . . . . . 1,692,609 48,380 1,644,229 1,168,326 36,237 1,132,089
Total long-term debt . . . . . . . . $ 2,529,956 $ 75,823 $ 2,454,133 $ 2,005,673 $ 63,796 $ 1,941,877
Long-term debt, current . . . $ 14,306 $ 808Long-term debt, noncurrent $ 2,439,827 $ 1,941,069
TDS may redeem its callable notes and U.S. Cellular may redeem its 6.95% Senior Notes, 7.25% 2063 Senior Notes and7.25% 2064 Senior Notes, in whole or in part at any time after the respective call date, at a redemption price equal to100% of the principal amount redeemed plus accrued and unpaid interest. U.S. Cellular may redeem the 6.7% SeniorNotes, in whole or in part, at any time prior to maturity at a redemption price equal to the greater of (a) 100% of theprincipal amount of such notes, plus accrued and unpaid interest, or (b) the sum of the present values of the remaining
88
TELEPHONE AND DATA SYSTEMS, INC. NOTES TO CONSOLIDATED FINANCIAL STATEMENTS

scheduled payments of principal and interest thereon discounted to the redemption date on a semi-annual basis at theTreasury Rate plus 30 basis points.
Interest on the notes is payable quarterly on Senior Notes outstanding at December 31, 2015, with the exception of U.S.Cellular’s 6.7% note in which interest is payable semi-annually.
The annual requirements for principal payments on long-term debt are approximately $14.3 million, $12.1 million,$11.4 million, $11.4 million and $11.4 million for the years 2016 through 2020, respectively.
The covenants associated with TDS and its subsidiaries’ long-term debt obligations, among other things, restrict TDS’ability, subject to certain exclusions, to incur additional liens, enter into sale and leaseback transactions, and sell,consolidate or merge assets.
TDS’ long-term debt notes do not contain any provisions resulting in acceleration of the maturities of outstanding debt inthe event of a change in TDS’ credit rating. However, a downgrade in TDS’ credit rating could adversely affect its abilityto obtain long-term debt financing in the future.
NOTE 12 EMPLOYEE BENEFIT PLANSDefined Contribution Plans
TDS sponsors a qualified noncontributory defined contribution pension plan. The plan provides benefits for certainemployees of TDS Corporate, TDS Telecom and U.S. Cellular. Under this plan, pension costs are calculated separatelyfor each participant and are funded annually. Total pension costs were $16.4 million, $16.4 million and $16.2 million in2015, 2014 and 2013, respectively. In addition, TDS sponsors a defined contribution retirement savings plan (‘‘401(k)’’)plan. Total costs incurred from TDS’ contributions to the 401(k) plan were $25.7 million, $25.3 million and $24.8 million in2015, 2014 and 2013, respectively.
TDS also sponsors an unfunded nonqualified deferred supplemental executive retirement plan for certain employees tooffset the reduction of benefits caused by the limitation on annual employee compensation under the tax laws.
Other Post-Retirement Benefits
TDS sponsors a defined benefit post-retirement plan that provides medical benefits to retirees and that covers certainemployees of TDS Corporate and TDS Telecom. The plan is contributory, with retiree contributions adjusted annually.
In August 2015, TDS approved an amendment to its defined benefit post-retirement plan. Under this plan, TDS providesa subsidy to retirees to pay for various medical plan options. The amendment increased subsidy caps and becameeffective January 1, 2016. The plan amendment, along with certain valuation assumption updates, increased the plan’sbenefit obligation by $8.6 million. This amount is included in TDS’ December 31, 2015 Accumulated othercomprehensive income (loss) as a component of Net actuarial gains (losses) and Prior service cost.
The following amounts are included in Accumulated other comprehensive income (loss) in the Consolidated BalanceSheet before affecting such amounts for income taxes:
December 31, 2015 2014
(Dollars in thousands)Net prior service costs . . . . . . . . . . . . . . . . . . . . . . . . . . . . . . . . . . . . . . . . . . . . . . . . . $ 6,846 $ 17,246Net actuarial loss . . . . . . . . . . . . . . . . . . . . . . . . . . . . . . . . . . . . . . . . . . . . . . . . . . . . (7,280) (8,436)
$ (434) $ 8,810
The estimated net actuarial loss and prior service cost gain for the postretirement benefit plans that will be amortizedfrom Accumulated other comprehensive loss into net periodic benefit cost during 2016 are $0.2 million and $2.0 million,respectively.
89
TELEPHONE AND DATA SYSTEMS, INC. NOTES TO CONSOLIDATED FINANCIAL STATEMENTS

The following table reconciles the beginning and ending balances of the benefit obligation and the fair value of planassets for the other post-retirement benefit plan.
December 31, 2015 2014
(Dollars in thousands)Change in benefit obligation
Benefit obligation at beginning of year . . . . . . . . . . . . . . . . . . . . . . . . . . . . . . . . . . $ 34,645 $ 46,142Service cost . . . . . . . . . . . . . . . . . . . . . . . . . . . . . . . . . . . . . . . . . . . . . . . . . . 549 1,018Interest cost . . . . . . . . . . . . . . . . . . . . . . . . . . . . . . . . . . . . . . . . . . . . . . . . . . 1,540 2,255Plan amendments . . . . . . . . . . . . . . . . . . . . . . . . . . . . . . . . . . . . . . . . . . . . . . 7,412 (2,057)Actuarial (gain) loss . . . . . . . . . . . . . . . . . . . . . . . . . . . . . . . . . . . . . . . . . . . . . (3,723) (10,897)Prescription drug subsidy . . . . . . . . . . . . . . . . . . . . . . . . . . . . . . . . . . . . . . . . . . 227 264Employee contribution . . . . . . . . . . . . . . . . . . . . . . . . . . . . . . . . . . . . . . . . . . . . 2,222 2,216Benefits paid . . . . . . . . . . . . . . . . . . . . . . . . . . . . . . . . . . . . . . . . . . . . . . . . . (4,101) (4,296)
Benefit obligation at end of year . . . . . . . . . . . . . . . . . . . . . . . . . . . . . . . . . . . . . . 38,771 34,645
Change in plan assetsFair value of plan assets at beginning of year . . . . . . . . . . . . . . . . . . . . . . . . . . . . . 51,324 49,743Actual return (loss) on plan assets . . . . . . . . . . . . . . . . . . . . . . . . . . . . . . . . . . . . 395 3,495Employee contribution . . . . . . . . . . . . . . . . . . . . . . . . . . . . . . . . . . . . . . . . . . . . 2,222 2,216Employer contribution . . . . . . . . . . . . . . . . . . . . . . . . . . . . . . . . . . . . . . . . . . . . 168 166Benefits paid . . . . . . . . . . . . . . . . . . . . . . . . . . . . . . . . . . . . . . . . . . . . . . . . . (4,101) (4,296)
Fair value of plan assets at end of year . . . . . . . . . . . . . . . . . . . . . . . . . . . . . . . . . 50,008 51,324
Funded status . . . . . . . . . . . . . . . . . . . . . . . . . . . . . . . . . . . . . . . . . . . . . . . . . . $ 11,237 $ 16,679
The funded status identified above is recorded as a component of Other assets and deferred charges in TDS’Consolidated Balance Sheet as of December 31, 2015 and 2014.
The following table sets forth by level within the fair value hierarchy the plans’ assets at fair value, as of December 31,2015 and 2014. A financial instrument’s level within the fair value hierarchy is based on the lowest level of any input thatis significant to the fair value measurement. A financial instrument’s level within the fair value hierarchy is notrepresentative of its expected performance or its overall risk profile, and therefore Level 3 assets are not necessarilyhigher risk than Level 2 assets or Level 1 assets. There were no Level 3 assets for any years presented.
Mutual funds are valued based on the closing price reported on the active market on which the individual securities aretraded. The bank common trust is entirely comprised of the BlackRock Intermediate Government/Credit Bond IndexFund F (‘‘BlackRock Bond Fund’’) and is valued using the market approach which values the underlying investments inthe fund using observable inputs for similar assets.
90
TELEPHONE AND DATA SYSTEMS, INC. NOTES TO CONSOLIDATED FINANCIAL STATEMENTS
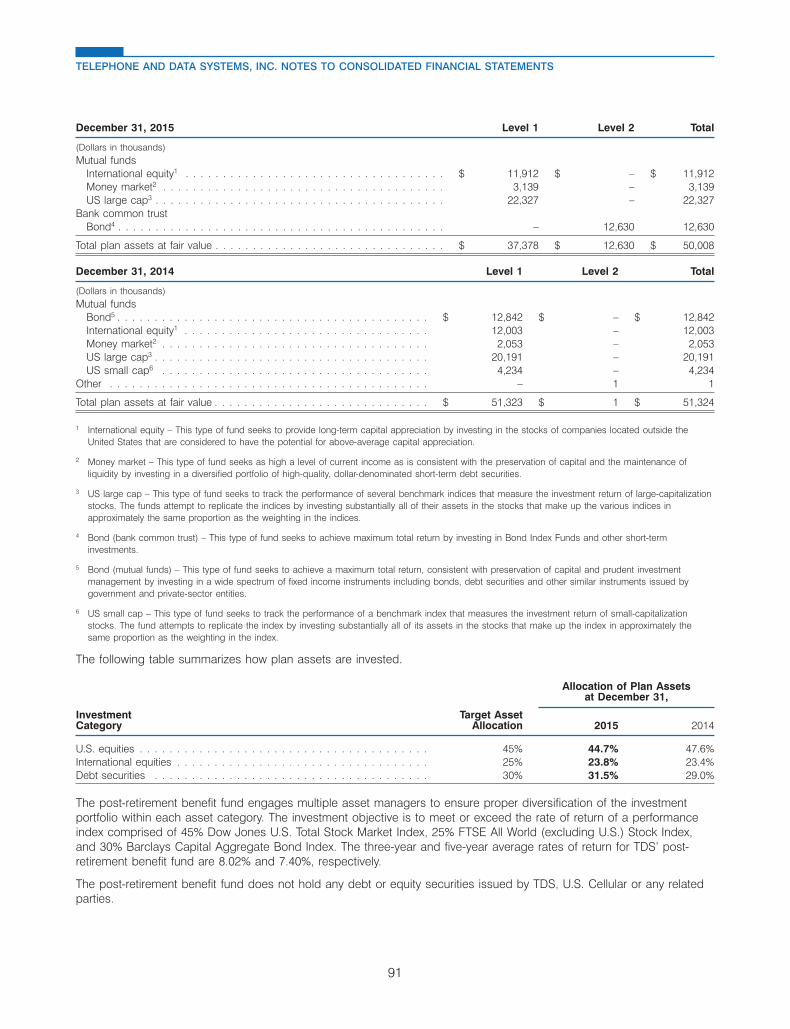
December 31, 2015 Level 1 Level 2 Total
(Dollars in thousands)Mutual funds
International equity1 . . . . . . . . . . . . . . . . . . . . . . . . . . . . . . . . . . . $ 11,912 $ – $ 11,912Money market2 . . . . . . . . . . . . . . . . . . . . . . . . . . . . . . . . . . . . . . 3,139 – 3,139US large cap3 . . . . . . . . . . . . . . . . . . . . . . . . . . . . . . . . . . . . . . . 22,327 – 22,327
Bank common trustBond4 . . . . . . . . . . . . . . . . . . . . . . . . . . . . . . . . . . . . . . . . . . . . – 12,630 12,630
Total plan assets at fair value . . . . . . . . . . . . . . . . . . . . . . . . . . . . . . . $ 37,378 $ 12,630 $ 50,008
December 31, 2014 Level 1 Level 2 Total
(Dollars in thousands)Mutual funds
Bond5 . . . . . . . . . . . . . . . . . . . . . . . . . . . . . . . . . . . . . . . . . . $ 12,842 $ – $ 12,842International equity1 . . . . . . . . . . . . . . . . . . . . . . . . . . . . . . . . . 12,003 – 12,003Money market2 . . . . . . . . . . . . . . . . . . . . . . . . . . . . . . . . . . . . 2,053 – 2,053US large cap3 . . . . . . . . . . . . . . . . . . . . . . . . . . . . . . . . . . . . . 20,191 – 20,191US small cap6 . . . . . . . . . . . . . . . . . . . . . . . . . . . . . . . . . . . . 4,234 – 4,234
Other . . . . . . . . . . . . . . . . . . . . . . . . . . . . . . . . . . . . . . . . . . . – 1 1
Total plan assets at fair value . . . . . . . . . . . . . . . . . . . . . . . . . . . . . $ 51,323 $ 1 $ 51,324
1 International equity – This type of fund seeks to provide long-term capital appreciation by investing in the stocks of companies located outside theUnited States that are considered to have the potential for above-average capital appreciation.
2 Money market – This type of fund seeks as high a level of current income as is consistent with the preservation of capital and the maintenance ofliquidity by investing in a diversified portfolio of high-quality, dollar-denominated short-term debt securities.
3 US large cap – This type of fund seeks to track the performance of several benchmark indices that measure the investment return of large-capitalizationstocks. The funds attempt to replicate the indices by investing substantially all of their assets in the stocks that make up the various indices inapproximately the same proportion as the weighting in the indices.
4 Bond (bank common trust) – This type of fund seeks to achieve maximum total return by investing in Bond Index Funds and other short-terminvestments.
5 Bond (mutual funds) – This type of fund seeks to achieve a maximum total return, consistent with preservation of capital and prudent investmentmanagement by investing in a wide spectrum of fixed income instruments including bonds, debt securities and other similar instruments issued bygovernment and private-sector entities.
6 US small cap – This type of fund seeks to track the performance of a benchmark index that measures the investment return of small-capitalizationstocks. The fund attempts to replicate the index by investing substantially all of its assets in the stocks that make up the index in approximately thesame proportion as the weighting in the index.
The following table summarizes how plan assets are invested.
Allocation of Plan Assetsat December 31,
Investment Target AssetCategory Allocation 2015 2014
U.S. equities . . . . . . . . . . . . . . . . . . . . . . . . . . . . . . . . . . . . . . . 45% 44.7% 47.6%International equities . . . . . . . . . . . . . . . . . . . . . . . . . . . . . . . . . . 25% 23.8% 23.4%Debt securities . . . . . . . . . . . . . . . . . . . . . . . . . . . . . . . . . . . . . 30% 31.5% 29.0%
The post-retirement benefit fund engages multiple asset managers to ensure proper diversification of the investmentportfolio within each asset category. The investment objective is to meet or exceed the rate of return of a performanceindex comprised of 45% Dow Jones U.S. Total Stock Market Index, 25% FTSE All World (excluding U.S.) Stock Index,and 30% Barclays Capital Aggregate Bond Index. The three-year and five-year average rates of return for TDS’ post-retirement benefit fund are 8.02% and 7.40%, respectively.
The post-retirement benefit fund does not hold any debt or equity securities issued by TDS, U.S. Cellular or any relatedparties.
91
TELEPHONE AND DATA SYSTEMS, INC. NOTES TO CONSOLIDATED FINANCIAL STATEMENTS

TDS is not required to set aside current funds for its future retiree health insurance benefits. The decision to contribute tothe plan assets is based upon several factors, including the funded status of the plan, market conditions, alternativeinvestment opportunities, tax benefits and other circumstances. In accordance with applicable income tax regulations,annual contributions to fund the costs of future retiree medical benefits may not exceed certain thresholds. TDS has notdetermined whether it will make a contribution to the plan in 2016.
Net periodic benefit cost recorded in the Consolidated Statement of Operations includes the following components:
Year Ended December 31, 2015 2014 2013
(Dollars in thousands)Service cost . . . . . . . . . . . . . . . . . . . . . . . . . . . . . . . . . . . . . . . $ 549 $ 1,018 $ 1,348Interest cost . . . . . . . . . . . . . . . . . . . . . . . . . . . . . . . . . . . . . . . 1,540 2,255 2,137Expected return on plan assets . . . . . . . . . . . . . . . . . . . . . . . . . . . (3,252) (3,402) (3,065)Amortization of prior service costs1 . . . . . . . . . . . . . . . . . . . . . . . . (2,988) (3,644) (3,605)Amortization of actuarial losses2 . . . . . . . . . . . . . . . . . . . . . . . . . . 290 1,287 2,452
Net post-retirement cost (benefit) . . . . . . . . . . . . . . . . . . . . . . . . . . $ (3,861) $ (2,486) $ (733)
1 Based on straight-line amortization over the average time remaining before active employees become fully eligible for plan benefits.
2 Based on straight-line amortization over the average time remaining before active employees retire.
The following assumptions were used to determine benefit obligations and net periodic benefit cost:
December 31, 2015 2014
Benefit obligationsDiscount rate . . . . . . . . . . . . . . . . . . . . . . . . . . . . . . . . . . . . . . . . . . . . . . . . . . . 4.40% 4.20%Net periodic benefit costDiscount rate . . . . . . . . . . . . . . . . . . . . . . . . . . . . . . . . . . . . . . . . . . . . . . . . . . . 4.20% 5.00%Expected return on plan assets . . . . . . . . . . . . . . . . . . . . . . . . . . . . . . . . . . . . . . . . 6.50% 7.00%
The discount rate for 2015 and 2014 was determined using a hypothetical Aa spot yield curve represented by a series ofannualized individual spot discount rates from six months to 99 years. The spot rate curve was derived from a directcalculation of the implied forward rate curve based on the included bond cash flows. This yield curve, when populatedwith projected cash flows that represent the expected timing and amount of TDS plan benefit payments, produces asingle effective interest discount rate that is used to measure the plan’s liabilities.
The expected rate of return was determined using the target asset allocation for the TDS plan and rate of returnexpectations for each asset class.
The measurement date for actuarial determination was December 31, 2015. For measurement purposes, the annual rateof increase in the per capita cost of covered health care benefits was assumed for 2015 to be 9.5% for plan participantsaged 65 and above, and 7.3% for participants under age 65. For all participants the 2015 annual rate of increase isexpected to decrease to 5.0% by 2024. The 2014 expected rate of increase was 7.8% for plan participants aged 65 andabove, and 7.5% for participants under age 65, decreasing to 5.0% for all participants by 2022.
A 1% increase or decrease in assumed health care cost trend rates would have the following effects as of and for theyear ended December 31, 2015:
One Percent
Increase Decrease
(Dollars in thousands)Effect on total service and interest cost components . . . . . . . . . . . . . . . . . . . . . . . . . . $ 14 $ (13)Effect on post-retirement benefit obligation . . . . . . . . . . . . . . . . . . . . . . . . . . . . . . . . $ 230 $ (202)
92
TELEPHONE AND DATA SYSTEMS, INC. NOTES TO CONSOLIDATED FINANCIAL STATEMENTS

The following estimated future benefit payments, which reflect expected future service, are expected to be paid:
Estimated FuturePost-Retirement
Year Benefit Payments
(Dollars in thousands)2016 . . . . . . . . . . . . . . . . . . . . . . . . . . . . . . . . . . . . . . . . . . . . . . . . . . . . . . . . . . . . . . . . . . . . $ 1,8232017 . . . . . . . . . . . . . . . . . . . . . . . . . . . . . . . . . . . . . . . . . . . . . . . . . . . . . . . . . . . . . . . . . . . . 1,9692018 . . . . . . . . . . . . . . . . . . . . . . . . . . . . . . . . . . . . . . . . . . . . . . . . . . . . . . . . . . . . . . . . . . . . 2,0612019 . . . . . . . . . . . . . . . . . . . . . . . . . . . . . . . . . . . . . . . . . . . . . . . . . . . . . . . . . . . . . . . . . . . . 2,1632020 . . . . . . . . . . . . . . . . . . . . . . . . . . . . . . . . . . . . . . . . . . . . . . . . . . . . . . . . . . . . . . . . . . . . 2,2572021-2025 . . . . . . . . . . . . . . . . . . . . . . . . . . . . . . . . . . . . . . . . . . . . . . . . . . . . . . . . . . . . . . . . . 12,229
NOTE 13 COMMITMENTS AND CONTINGENCIESAgreements
In November 2014, U.S. Cellular executed a Master Statement of Work and certain other documents with AmdocsSoftware Systems Limited (‘‘Amdocs’’). The agreement provides that U.S. Cellular will outsource to Amdocs certainsupport functions for its Billing and Operational Support System (‘‘B/OSS’’). Such functions include application support,billing operations and some infrastructure services. The agreement has a term through September 30, 2019, subject tofive one-year renewal periods at U.S. Cellular’s option. The estimated amount to be paid to Amdocs with respect to theagreement during the remaining term is approximately $83 million (exclusive of travel and expenses and subject tocertain potential adjustments).
During 2013, U.S. Cellular entered into agreements with Apple to purchase certain minimum quantities of Apple iPhoneproducts and fund marketing programs related to the Apple iPhone and iPad products over a three-year periodbeginning in November 2013. Based on current forecasts, TDS estimates that the remaining contractual commitment asof December 31, 2015 under these agreements is approximately $196 million. At this time, TDS expects to meet itscontractual commitments with Apple.
Lease Commitments
TDS and its subsidiaries have leases for certain plant facilities, office space, retail store sites, cell sites, data centers anddata-processing equipment which are accounted for as operating leases. Certain leases have renewal options and/orfixed rental increases. Renewal options that are reasonably assured of exercise are included in determining the leaseterm. Any rent abatements or lease incentives, in addition to fixed rental increases, are included in the calculation of rentexpense and calculated on a straight-line basis over the defined lease term.
As of December 31, 2015, future minimum rental payments required under operating leases and rental receipts expectedunder operating leases that have noncancellable lease terms in excess of one year were as follows:
Operating Leases Operating LeasesFuture Minimum Future MinimumRental Payments Rental Receipts
(Dollars in thousands)2016 . . . . . . . . . . . . . . . . . . . . . . . . . . . . . . . . . . . . . . . . . . . . . . . . . . . . . . $ 156,882 $ 48,3042017 . . . . . . . . . . . . . . . . . . . . . . . . . . . . . . . . . . . . . . . . . . . . . . . . . . . . . . 136,248 40,1802018 . . . . . . . . . . . . . . . . . . . . . . . . . . . . . . . . . . . . . . . . . . . . . . . . . . . . . . 117,806 31,9402019 . . . . . . . . . . . . . . . . . . . . . . . . . . . . . . . . . . . . . . . . . . . . . . . . . . . . . . 100,894 21,6082020 . . . . . . . . . . . . . . . . . . . . . . . . . . . . . . . . . . . . . . . . . . . . . . . . . . . . . . 87,993 10,184Thereafter . . . . . . . . . . . . . . . . . . . . . . . . . . . . . . . . . . . . . . . . . . . . . . . . . . . 724,217 1,238
Total . . . . . . . . . . . . . . . . . . . . . . . . . . . . . . . . . . . . . . . . . . . . . . . . . . . . . . $ 1,324,040 $ 153,454
For 2015, 2014 and 2013, rent expense for noncancellable long-term leases was $168.4 million, $177.0 million and$187.4 million, respectively; and rent expense under cancellable short-term leases was $10.8 million, $8.8 million and$12.5 million, respectively.
93
TELEPHONE AND DATA SYSTEMS, INC. NOTES TO CONSOLIDATED FINANCIAL STATEMENTS
Indemnifications
TDS enters into agreements in the normal course of business that provide for indemnification of counterparties. Theterms of the indemnifications vary by agreement. The events or circumstances that would require TDS to perform underthese indemnities are transaction specific; however, these agreements may require TDS to indemnify the counterparty forcosts and losses incurred from litigation or claims arising from the underlying transaction. TDS is unable to estimate themaximum potential liability for these types of indemnifications as the amounts are dependent on the outcome of futureevents, the nature and likelihood of which cannot be determined at this time. Historically, TDS has not made anysignificant indemnification payments under such agreements.
Legal Proceedings
TDS is involved or may be involved from time to time in legal proceedings before the FCC, other regulatory authorities,and/or various state and federal courts. If TDS believes that a loss arising from such legal proceedings is probable andcan be reasonably estimated, an amount is accrued in the financial statements for the estimated loss. If only a range ofloss can be determined, the best estimate within that range is accrued; if none of the estimates within that range isbetter than another, the low end of the range is accrued. The assessment of the expected outcomes of legalproceedings is a highly subjective process that requires judgments about future events. The legal proceedings arereviewed at least quarterly to determine the adequacy of accruals and related financial statement disclosures. Theultimate outcomes of legal proceedings could differ materially from amounts accrued in the financial statements.
TDS has accrued $0.5 million and $0.4 million with respect to legal proceedings and unasserted claims as ofDecember 31, 2015 and 2014, respectively. TDS has not accrued any amount for legal proceedings if it cannot estimatethe amount of the possible loss or range of loss. TDS is unable to estimate any contingent loss in excess of theamounts accrued.
NOTE 14 VARIABLE INTEREST ENTITIESTDS consolidates variable interest entities (‘‘VIEs’’) in which it has a controlling financial interest and is the primarybeneficiary. A controlling financial interest will have both of the following characteristics: (a) the power to direct the VIEactivities that most significantly impact economic performance and (b) the obligation to absorb the VIE losses and rightto receive benefits that are significant to the VIE. TDS reviews these criteria initially at the time it enters into agreementsand subsequently when reconsideration events occur.
Consolidated VIEs
As of December 31, 2015, TDS holds a variable interest in and consolidates the following VIEs under GAAP:
� Advantage Spectrum and Frequency Advantage L.P., the general partner of Advantage Spectrum;
� Aquinas Wireless L.P. (‘‘Aquinas Wireless’’); and
� King Street Wireless L.P. (‘‘King Street Wireless’’) and King Street Wireless, Inc., the general partner of King StreetWireless.
The power to direct the activities that most significantly impact the economic performance of Advantage Spectrum,Aquinas Wireless and King Street Wireless (collectively, the ‘‘limited partnerships’’) is shared. Specifically, the generalpartner of these VIEs has the exclusive right to manage, operate and control the limited partnerships and make alldecisions to carry on the business of the partnerships; however, the general partner of each partnership needs theconsent of the limited partner, a TDS subsidiary, to sell or lease certain licenses, to make certain large expenditures,admit other partners or liquidate the limited partnerships. Although the power to direct the activities of the VIEs isshared, TDS has a disproportionate level of exposure to the variability associated with the economic performance of theVIEs, indicating that TDS is the primary beneficiary of the VIEs. Accordingly, these VIEs are consolidated.
94
TELEPHONE AND DATA SYSTEMS, INC. NOTES TO CONSOLIDATED FINANCIAL STATEMENTS
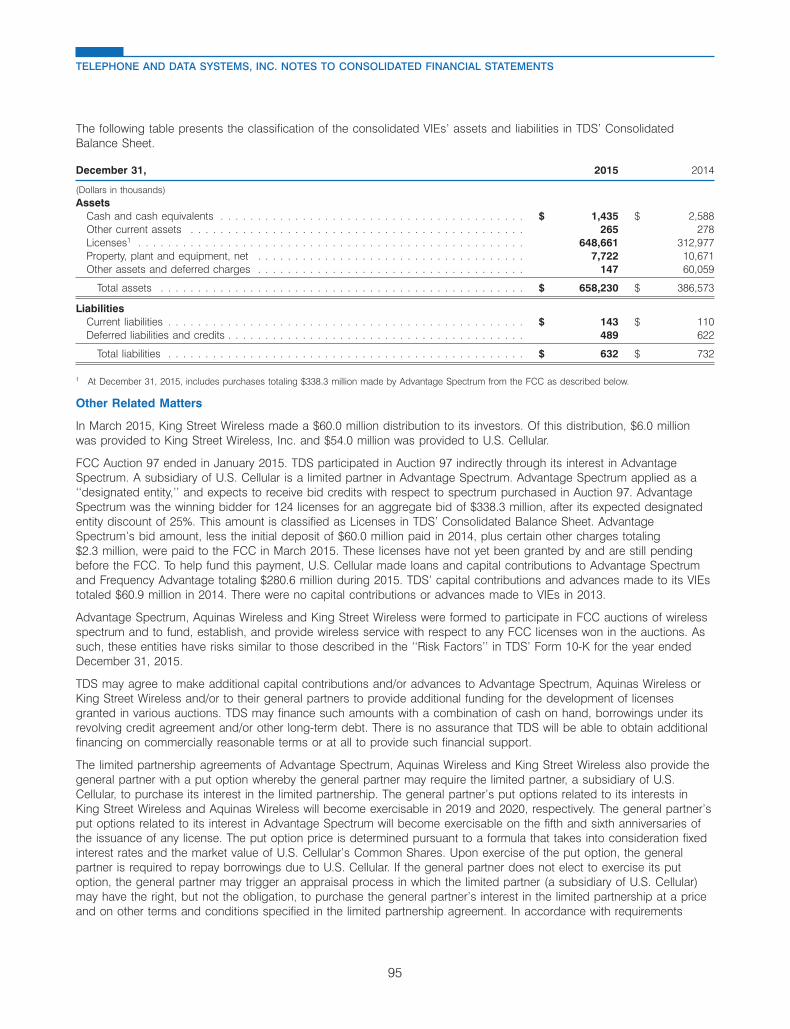
The following table presents the classification of the consolidated VIEs’ assets and liabilities in TDS’ ConsolidatedBalance Sheet.
December 31, 2015 2014
(Dollars in thousands)Assets
Cash and cash equivalents . . . . . . . . . . . . . . . . . . . . . . . . . . . . . . . . . . . . . . . . . $ 1,435 $ 2,588Other current assets . . . . . . . . . . . . . . . . . . . . . . . . . . . . . . . . . . . . . . . . . . . . . 265 278Licenses1 . . . . . . . . . . . . . . . . . . . . . . . . . . . . . . . . . . . . . . . . . . . . . . . . . . . . 648,661 312,977Property, plant and equipment, net . . . . . . . . . . . . . . . . . . . . . . . . . . . . . . . . . . . . 7,722 10,671Other assets and deferred charges . . . . . . . . . . . . . . . . . . . . . . . . . . . . . . . . . . . . 147 60,059
Total assets . . . . . . . . . . . . . . . . . . . . . . . . . . . . . . . . . . . . . . . . . . . . . . . . . $ 658,230 $ 386,573
LiabilitiesCurrent liabilities . . . . . . . . . . . . . . . . . . . . . . . . . . . . . . . . . . . . . . . . . . . . . . . . $ 143 $ 110Deferred liabilities and credits . . . . . . . . . . . . . . . . . . . . . . . . . . . . . . . . . . . . . . . . 489 622
Total liabilities . . . . . . . . . . . . . . . . . . . . . . . . . . . . . . . . . . . . . . . . . . . . . . . . $ 632 $ 732
1 At December 31, 2015, includes purchases totaling $338.3 million made by Advantage Spectrum from the FCC as described below.
Other Related Matters
In March 2015, King Street Wireless made a $60.0 million distribution to its investors. Of this distribution, $6.0 millionwas provided to King Street Wireless, Inc. and $54.0 million was provided to U.S. Cellular.
FCC Auction 97 ended in January 2015. TDS participated in Auction 97 indirectly through its interest in AdvantageSpectrum. A subsidiary of U.S. Cellular is a limited partner in Advantage Spectrum. Advantage Spectrum applied as a‘‘designated entity,’’ and expects to receive bid credits with respect to spectrum purchased in Auction 97. AdvantageSpectrum was the winning bidder for 124 licenses for an aggregate bid of $338.3 million, after its expected designatedentity discount of 25%. This amount is classified as Licenses in TDS’ Consolidated Balance Sheet. AdvantageSpectrum’s bid amount, less the initial deposit of $60.0 million paid in 2014, plus certain other charges totaling$2.3 million, were paid to the FCC in March 2015. These licenses have not yet been granted by and are still pendingbefore the FCC. To help fund this payment, U.S. Cellular made loans and capital contributions to Advantage Spectrumand Frequency Advantage totaling $280.6 million during 2015. TDS’ capital contributions and advances made to its VIEstotaled $60.9 million in 2014. There were no capital contributions or advances made to VIEs in 2013.
Advantage Spectrum, Aquinas Wireless and King Street Wireless were formed to participate in FCC auctions of wirelessspectrum and to fund, establish, and provide wireless service with respect to any FCC licenses won in the auctions. Assuch, these entities have risks similar to those described in the ‘‘Risk Factors’’ in TDS’ Form 10-K for the year endedDecember 31, 2015.
TDS may agree to make additional capital contributions and/or advances to Advantage Spectrum, Aquinas Wireless orKing Street Wireless and/or to their general partners to provide additional funding for the development of licensesgranted in various auctions. TDS may finance such amounts with a combination of cash on hand, borrowings under itsrevolving credit agreement and/or other long-term debt. There is no assurance that TDS will be able to obtain additionalfinancing on commercially reasonable terms or at all to provide such financial support.
The limited partnership agreements of Advantage Spectrum, Aquinas Wireless and King Street Wireless also provide thegeneral partner with a put option whereby the general partner may require the limited partner, a subsidiary of U.S.Cellular, to purchase its interest in the limited partnership. The general partner’s put options related to its interests inKing Street Wireless and Aquinas Wireless will become exercisable in 2019 and 2020, respectively. The general partner’sput options related to its interest in Advantage Spectrum will become exercisable on the fifth and sixth anniversaries ofthe issuance of any license. The put option price is determined pursuant to a formula that takes into consideration fixedinterest rates and the market value of U.S. Cellular’s Common Shares. Upon exercise of the put option, the generalpartner is required to repay borrowings due to U.S. Cellular. If the general partner does not elect to exercise its putoption, the general partner may trigger an appraisal process in which the limited partner (a subsidiary of U.S. Cellular)may have the right, but not the obligation, to purchase the general partner’s interest in the limited partnership at a priceand on other terms and conditions specified in the limited partnership agreement. In accordance with requirements
95
TELEPHONE AND DATA SYSTEMS, INC. NOTES TO CONSOLIDATED FINANCIAL STATEMENTS
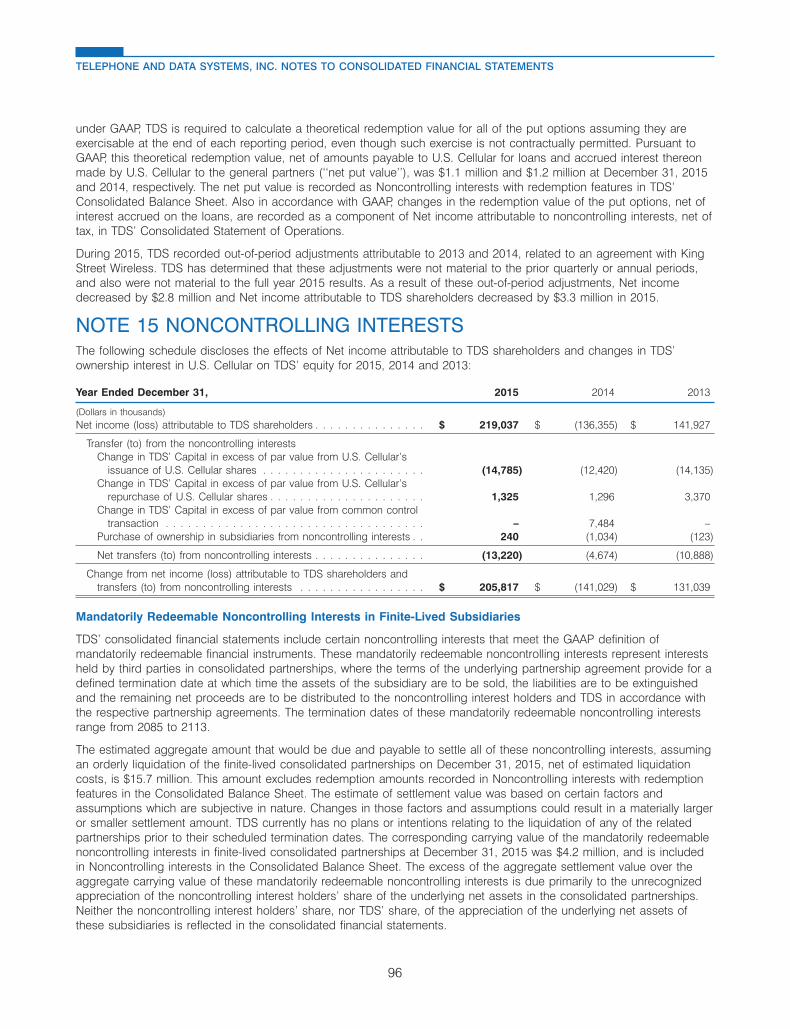
under GAAP, TDS is required to calculate a theoretical redemption value for all of the put options assuming they areexercisable at the end of each reporting period, even though such exercise is not contractually permitted. Pursuant toGAAP, this theoretical redemption value, net of amounts payable to U.S. Cellular for loans and accrued interest thereonmade by U.S. Cellular to the general partners (‘‘net put value’’), was $1.1 million and $1.2 million at December 31, 2015and 2014, respectively. The net put value is recorded as Noncontrolling interests with redemption features in TDS’Consolidated Balance Sheet. Also in accordance with GAAP, changes in the redemption value of the put options, net ofinterest accrued on the loans, are recorded as a component of Net income attributable to noncontrolling interests, net oftax, in TDS’ Consolidated Statement of Operations.
During 2015, TDS recorded out-of-period adjustments attributable to 2013 and 2014, related to an agreement with KingStreet Wireless. TDS has determined that these adjustments were not material to the prior quarterly or annual periods,and also were not material to the full year 2015 results. As a result of these out-of-period adjustments, Net incomedecreased by $2.8 million and Net income attributable to TDS shareholders decreased by $3.3 million in 2015.
NOTE 15 NONCONTROLLING INTERESTSThe following schedule discloses the effects of Net income attributable to TDS shareholders and changes in TDS’ownership interest in U.S. Cellular on TDS’ equity for 2015, 2014 and 2013:
Year Ended December 31, 2015 2014 2013
(Dollars in thousands)Net income (loss) attributable to TDS shareholders . . . . . . . . . . . . . . . $ 219,037 $ (136,355) $ 141,927
Transfer (to) from the noncontrolling interestsChange in TDS’ Capital in excess of par value from U.S. Cellular’s
issuance of U.S. Cellular shares . . . . . . . . . . . . . . . . . . . . . . (14,785) (12,420) (14,135)Change in TDS’ Capital in excess of par value from U.S. Cellular’s
repurchase of U.S. Cellular shares . . . . . . . . . . . . . . . . . . . . . 1,325 1,296 3,370Change in TDS’ Capital in excess of par value from common control
transaction . . . . . . . . . . . . . . . . . . . . . . . . . . . . . . . . . . . – 7,484 –Purchase of ownership in subsidiaries from noncontrolling interests . . 240 (1,034) (123)
Net transfers (to) from noncontrolling interests . . . . . . . . . . . . . . . (13,220) (4,674) (10,888)
Change from net income (loss) attributable to TDS shareholders andtransfers (to) from noncontrolling interests . . . . . . . . . . . . . . . . . $ 205,817 $ (141,029) $ 131,039
Mandatorily Redeemable Noncontrolling Interests in Finite-Lived Subsidiaries
TDS’ consolidated financial statements include certain noncontrolling interests that meet the GAAP definition ofmandatorily redeemable financial instruments. These mandatorily redeemable noncontrolling interests represent interestsheld by third parties in consolidated partnerships, where the terms of the underlying partnership agreement provide for adefined termination date at which time the assets of the subsidiary are to be sold, the liabilities are to be extinguishedand the remaining net proceeds are to be distributed to the noncontrolling interest holders and TDS in accordance withthe respective partnership agreements. The termination dates of these mandatorily redeemable noncontrolling interestsrange from 2085 to 2113.
The estimated aggregate amount that would be due and payable to settle all of these noncontrolling interests, assumingan orderly liquidation of the finite-lived consolidated partnerships on December 31, 2015, net of estimated liquidationcosts, is $15.7 million. This amount excludes redemption amounts recorded in Noncontrolling interests with redemptionfeatures in the Consolidated Balance Sheet. The estimate of settlement value was based on certain factors andassumptions which are subjective in nature. Changes in those factors and assumptions could result in a materially largeror smaller settlement amount. TDS currently has no plans or intentions relating to the liquidation of any of the relatedpartnerships prior to their scheduled termination dates. The corresponding carrying value of the mandatorily redeemablenoncontrolling interests in finite-lived consolidated partnerships at December 31, 2015 was $4.2 million, and is includedin Noncontrolling interests in the Consolidated Balance Sheet. The excess of the aggregate settlement value over theaggregate carrying value of these mandatorily redeemable noncontrolling interests is due primarily to the unrecognizedappreciation of the noncontrolling interest holders’ share of the underlying net assets in the consolidated partnerships.Neither the noncontrolling interest holders’ share, nor TDS’ share, of the appreciation of the underlying net assets ofthese subsidiaries is reflected in the consolidated financial statements.
96
TELEPHONE AND DATA SYSTEMS, INC. NOTES TO CONSOLIDATED FINANCIAL STATEMENTS

NOTE 16 COMMON SHAREHOLDERS’ EQUITYCommon Stock
As of December 31, 2015, Series A Common Shares were convertible, on a share for share basis, into Common Sharesand 7,211,260 Common Shares were reserved for possible issuance upon conversion of Series A Common Shares.
The following table summarizes the number of Common and Series A Common Shares issued and repurchased.
Common Series ACommon Treasury Common
Shares Shares Shares
(Shares in thousands)
Balance at December 31, 2012 . . . . . . . . . . . . . . . . . . . . . . . . . . . 125,512 24,641 7,160Repurchase of shares . . . . . . . . . . . . . . . . . . . . . . . . . . . . . . . – 339 –Conversion of Series A Common Shares . . . . . . . . . . . . . . . . . . . 33 – (33)Dividend reinvestment, incentive and compensation plans . . . . . . . . . – (1,026) 39
Balance at December 31, 2013 . . . . . . . . . . . . . . . . . . . . . . . . . . . 125,545 23,954 7,166Repurchase of shares . . . . . . . . . . . . . . . . . . . . . . . . . . . . . . . – 1,542 –Conversion of Series A Common Shares . . . . . . . . . . . . . . . . . . . 25 – (25)Dividend reinvestment, incentive and compensation plans . . . . . . . . . – (646) 38
Balance at December 31, 2014 . . . . . . . . . . . . . . . . . . . . . . . . . . . 125,570 24,850 7,179Conversion of Series A Common Shares . . . . . . . . . . . . . . . . . . . 1 – (1)Dividend reinvestment, incentive and compensation plans . . . . . . . . . – (1,034) 33
Balance at December 31, 2015 . . . . . . . . . . . . . . . . . . . . . . . . . . . 125,571 23,816 7,211
Tax-Deferred Savings Plan
TDS has reserved 90,341 Common Shares at December 31, 2015, for issuance under the TDS Tax-Deferred SavingsPlan, a qualified profit-sharing plan pursuant to Sections 401(a) and 401(k) of the Internal Revenue Code. Participatingemployees have the option of investing their contributions and TDS’ contributions in a TDS Common Share fund, a U.S.Cellular Common Share fund or certain unaffiliated funds.
Common Share Repurchases
TDS and U.S. Cellular Share Repurchases
On August 2, 2013, the Board of Directors of TDS authorized a $250 million stock repurchase program for the purchaseof TDS Common Shares from time to time pursuant to open market purchases, block transactions, private purchases orotherwise, depending on market conditions. This authorization does not have an expiration date.
On November 17, 2009, the Board of Directors of U.S. Cellular authorized the repurchase of up to 1,300,000 CommonShares on an annual basis beginning in 2009 and continuing each year thereafter, on a cumulative basis. Thesepurchases will be made pursuant to open market purchases, block purchases, private purchases, or otherwise,depending on market prices and other conditions. This authorization does not have an expiration date.
97
TELEPHONE AND DATA SYSTEMS, INC. NOTES TO CONSOLIDATED FINANCIAL STATEMENTS
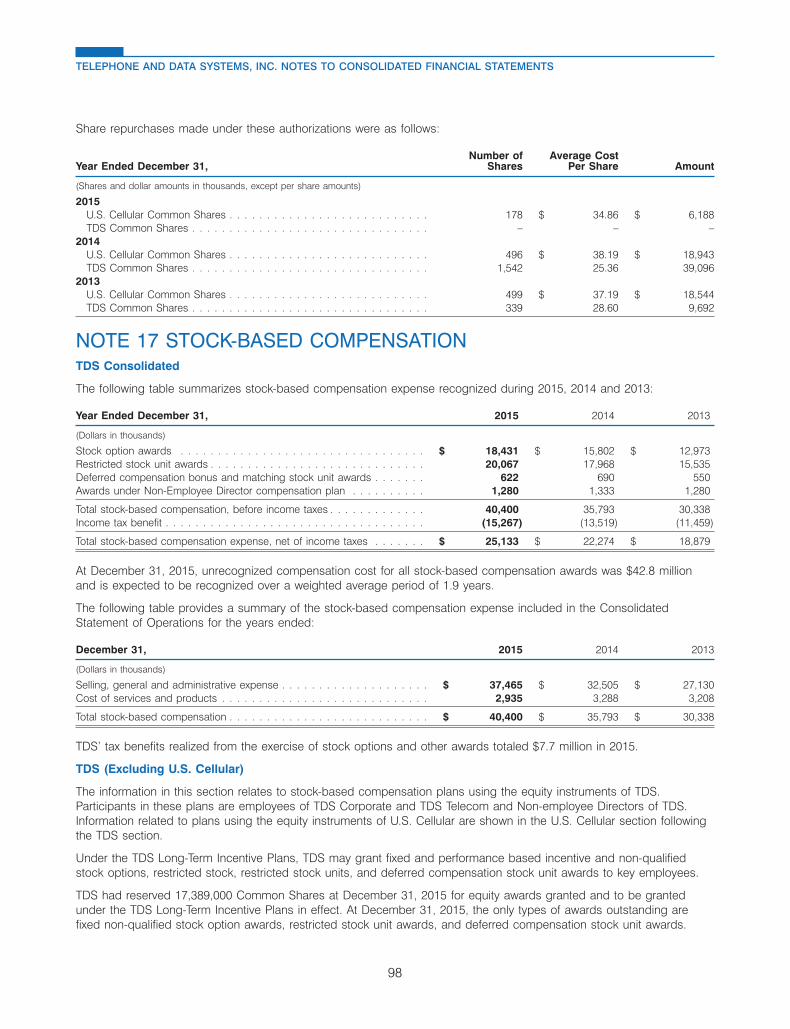
Share repurchases made under these authorizations were as follows:
Number of Average CostYear Ended December 31, Shares Per Share Amount
(Shares and dollar amounts in thousands, except per share amounts)
2015U.S. Cellular Common Shares . . . . . . . . . . . . . . . . . . . . . . . . . . . 178 $ 34.86 $ 6,188TDS Common Shares . . . . . . . . . . . . . . . . . . . . . . . . . . . . . . . . – – –
2014U.S. Cellular Common Shares . . . . . . . . . . . . . . . . . . . . . . . . . . . 496 $ 38.19 $ 18,943TDS Common Shares . . . . . . . . . . . . . . . . . . . . . . . . . . . . . . . . 1,542 25.36 39,096
2013U.S. Cellular Common Shares . . . . . . . . . . . . . . . . . . . . . . . . . . . 499 $ 37.19 $ 18,544TDS Common Shares . . . . . . . . . . . . . . . . . . . . . . . . . . . . . . . . 339 28.60 9,692
NOTE 17 STOCK-BASED COMPENSATIONTDS Consolidated
The following table summarizes stock-based compensation expense recognized during 2015, 2014 and 2013:
Year Ended December 31, 2015 2014 2013
(Dollars in thousands)
Stock option awards . . . . . . . . . . . . . . . . . . . . . . . . . . . . . . . . . $ 18,431 $ 15,802 $ 12,973Restricted stock unit awards . . . . . . . . . . . . . . . . . . . . . . . . . . . . . 20,067 17,968 15,535Deferred compensation bonus and matching stock unit awards . . . . . . . 622 690 550Awards under Non-Employee Director compensation plan . . . . . . . . . . 1,280 1,333 1,280
Total stock-based compensation, before income taxes . . . . . . . . . . . . . 40,400 35,793 30,338Income tax benefit . . . . . . . . . . . . . . . . . . . . . . . . . . . . . . . . . . . (15,267) (13,519) (11,459)
Total stock-based compensation expense, net of income taxes . . . . . . . $ 25,133 $ 22,274 $ 18,879
At December 31, 2015, unrecognized compensation cost for all stock-based compensation awards was $42.8 millionand is expected to be recognized over a weighted average period of 1.9 years.
The following table provides a summary of the stock-based compensation expense included in the ConsolidatedStatement of Operations for the years ended:
December 31, 2015 2014 2013
(Dollars in thousands)
Selling, general and administrative expense . . . . . . . . . . . . . . . . . . . . $ 37,465 $ 32,505 $ 27,130Cost of services and products . . . . . . . . . . . . . . . . . . . . . . . . . . . . 2,935 3,288 3,208
Total stock-based compensation . . . . . . . . . . . . . . . . . . . . . . . . . . . $ 40,400 $ 35,793 $ 30,338
TDS’ tax benefits realized from the exercise of stock options and other awards totaled $7.7 million in 2015.
TDS (Excluding U.S. Cellular)
The information in this section relates to stock-based compensation plans using the equity instruments of TDS.Participants in these plans are employees of TDS Corporate and TDS Telecom and Non-employee Directors of TDS.Information related to plans using the equity instruments of U.S. Cellular are shown in the U.S. Cellular section followingthe TDS section.
Under the TDS Long-Term Incentive Plans, TDS may grant fixed and performance based incentive and non-qualifiedstock options, restricted stock, restricted stock units, and deferred compensation stock unit awards to key employees.
TDS had reserved 17,389,000 Common Shares at December 31, 2015 for equity awards granted and to be grantedunder the TDS Long-Term Incentive Plans in effect. At December 31, 2015, the only types of awards outstanding arefixed non-qualified stock option awards, restricted stock unit awards, and deferred compensation stock unit awards.
98
TELEPHONE AND DATA SYSTEMS, INC. NOTES TO CONSOLIDATED FINANCIAL STATEMENTS

TDS has also established a Non-Employee Directors’ compensation plan under which it has reserved 139,000 TDSCommon Shares at December 31, 2015 for issuance as compensation to members of the Board of Directors who arenot employees of TDS.
TDS uses treasury stock to satisfy requirements for shares issued pursuant to its various stock-based compensationplans.
Long-Term Incentive Plan – Stock Options – Stock options granted to key employees are exercisable over a specifiedperiod not in excess of ten years. Stock options generally vest over periods up to three years from the date of grant.Stock options outstanding at December 31, 2015 expire between 2016 and 2025. However, vested stock optionstypically expire 30 days after the effective date of an employee’s termination of employment for reasons other thanretirement. Employees who leave at the age of retirement have 90 days (or one year if they satisfy certain requirements)within which to exercise their vested stock options. The exercise price of options equals the market value of TDScommon stock on the date of grant.
TDS estimated the fair value of stock options granted in 2015, 2014 and 2013 using the Black Scholes valuation modeland the assumptions shown in the table below:
2015 2014 2013
Expected life . . . . . . . . . . . . . . . . . . . . . . . . . . . . . . . . . . . . . . . 6.1 years 5.8 years 5.7 yearsExpected annual volatility rate . . . . . . . . . . . . . . . . . . . . . . . . . . . . 30.8% 39.6% 41.0%Dividend yield . . . . . . . . . . . . . . . . . . . . . . . . . . . . . . . . . . . . . . 1.9% 2.0% 2.3%Risk-free interest rate . . . . . . . . . . . . . . . . . . . . . . . . . . . . . . . . . . 1.8% 1.8% 1.0%Estimated annual forfeiture rate . . . . . . . . . . . . . . . . . . . . . . . . . . . 3.2% 2.9% 2.9%
A summary of TDS stock options (total and portion exercisable) and changes during 2015, is presented in the tablesand narrative below.
WeightedAverage
Weighted RemainingAverage Aggregate Contractual
Number of Exercise Intrinsic LifeCommon Share Options Options Prices Value (in years)
Outstanding at December 31, 2014 . . . . . . . . . . . . 9,140,000 $ 30.25(6,487,000 exercisable) . . . . . . . . . . . . . . . . . . . . 32.93
Granted . . . . . . . . . . . . . . . . . . . . . . . . . . . . 998,000 29.26Exercised . . . . . . . . . . . . . . . . . . . . . . . . . . . (575,000) 23.11Forfeited . . . . . . . . . . . . . . . . . . . . . . . . . . . (21,000) 26.30Expired . . . . . . . . . . . . . . . . . . . . . . . . . . . . (407,000) 37.09
Outstanding at December 31, 2015 . . . . . . . . . . . . 9,135,000 $ 30.29 $ 9,531,000 5.3(6,009,000 exercisable) . . . . . . . . . . . . . . . . . . . . $ 32.54 $ 5,548,000 3.8
The weighted average grant date fair value per share of the TDS stock options granted in 2015, 2014 and 2013 was$7.66, $8.66 and $7.01, respectively. The aggregate intrinsic value of TDS stock options exercised in 2015, 2014 and2013 was $3.8 million, $0.2 million and $2.5 million, respectively. The aggregate intrinsic value represents the totalpre-tax intrinsic value (the difference between TDS’ closing stock prices and the exercise price, multiplied by the numberof in-the-money options) that was received by the option holders upon exercise or that would have been received byoption holders had all options been exercised on December 31, 2015.
Long-Term Incentive Plans – Restricted Stock Units – TDS also grants restricted stock unit awards to key employees.Each outstanding restricted stock unit is convertible into one Common Share Award. The restricted stock unit awardscurrently outstanding were granted in 2013, 2014 and 2015 and will vest in 2016, 2017 and 2018, respectively.
TDS estimates the fair value of restricted stock units by reducing the grant-date price of TDS’ shares by the presentvalue of the dividends expected to be paid on the underlying shares during the requisite service period, discounted atthe appropriate risk-free interest rate, since employees are not entitled to dividends declared on the underlying shareswhile the restricted stock is unvested. The fair value is then recognized as compensation cost on a straight-line basisover the requisite service periods of the awards, which is generally the vesting period.
99
TELEPHONE AND DATA SYSTEMS, INC. NOTES TO CONSOLIDATED FINANCIAL STATEMENTS
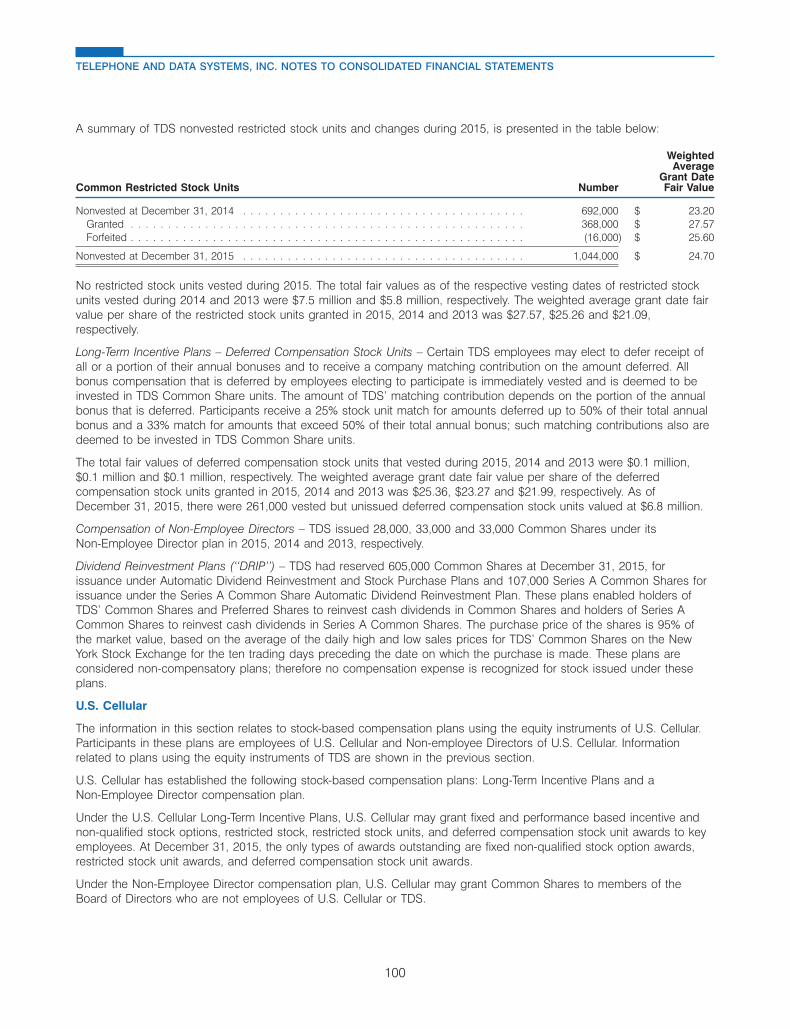
A summary of TDS nonvested restricted stock units and changes during 2015, is presented in the table below:
WeightedAverage
Grant DateCommon Restricted Stock Units Number Fair Value
Nonvested at December 31, 2014 . . . . . . . . . . . . . . . . . . . . . . . . . . . . . . . . . . . . . . 692,000 $ 23.20Granted . . . . . . . . . . . . . . . . . . . . . . . . . . . . . . . . . . . . . . . . . . . . . . . . . . . . . 368,000 $ 27.57Forfeited . . . . . . . . . . . . . . . . . . . . . . . . . . . . . . . . . . . . . . . . . . . . . . . . . . . . . (16,000) $ 25.60
Nonvested at December 31, 2015 . . . . . . . . . . . . . . . . . . . . . . . . . . . . . . . . . . . . . . 1,044,000 $ 24.70
No restricted stock units vested during 2015. The total fair values as of the respective vesting dates of restricted stockunits vested during 2014 and 2013 were $7.5 million and $5.8 million, respectively. The weighted average grant date fairvalue per share of the restricted stock units granted in 2015, 2014 and 2013 was $27.57, $25.26 and $21.09,respectively.
Long-Term Incentive Plans – Deferred Compensation Stock Units – Certain TDS employees may elect to defer receipt ofall or a portion of their annual bonuses and to receive a company matching contribution on the amount deferred. Allbonus compensation that is deferred by employees electing to participate is immediately vested and is deemed to beinvested in TDS Common Share units. The amount of TDS’ matching contribution depends on the portion of the annualbonus that is deferred. Participants receive a 25% stock unit match for amounts deferred up to 50% of their total annualbonus and a 33% match for amounts that exceed 50% of their total annual bonus; such matching contributions also aredeemed to be invested in TDS Common Share units.
The total fair values of deferred compensation stock units that vested during 2015, 2014 and 2013 were $0.1 million,$0.1 million and $0.1 million, respectively. The weighted average grant date fair value per share of the deferredcompensation stock units granted in 2015, 2014 and 2013 was $25.36, $23.27 and $21.99, respectively. As ofDecember 31, 2015, there were 261,000 vested but unissued deferred compensation stock units valued at $6.8 million.
Compensation of Non-Employee Directors – TDS issued 28,000, 33,000 and 33,000 Common Shares under itsNon-Employee Director plan in 2015, 2014 and 2013, respectively.
Dividend Reinvestment Plans (‘‘DRIP’’) – TDS had reserved 605,000 Common Shares at December 31, 2015, forissuance under Automatic Dividend Reinvestment and Stock Purchase Plans and 107,000 Series A Common Shares forissuance under the Series A Common Share Automatic Dividend Reinvestment Plan. These plans enabled holders ofTDS’ Common Shares and Preferred Shares to reinvest cash dividends in Common Shares and holders of Series ACommon Shares to reinvest cash dividends in Series A Common Shares. The purchase price of the shares is 95% ofthe market value, based on the average of the daily high and low sales prices for TDS’ Common Shares on the NewYork Stock Exchange for the ten trading days preceding the date on which the purchase is made. These plans areconsidered non-compensatory plans; therefore no compensation expense is recognized for stock issued under theseplans.
U.S. Cellular
The information in this section relates to stock-based compensation plans using the equity instruments of U.S. Cellular.Participants in these plans are employees of U.S. Cellular and Non-employee Directors of U.S. Cellular. Informationrelated to plans using the equity instruments of TDS are shown in the previous section.
U.S. Cellular has established the following stock-based compensation plans: Long-Term Incentive Plans and aNon-Employee Director compensation plan.
Under the U.S. Cellular Long-Term Incentive Plans, U.S. Cellular may grant fixed and performance based incentive andnon-qualified stock options, restricted stock, restricted stock units, and deferred compensation stock unit awards to keyemployees. At December 31, 2015, the only types of awards outstanding are fixed non-qualified stock option awards,restricted stock unit awards, and deferred compensation stock unit awards.
Under the Non-Employee Director compensation plan, U.S. Cellular may grant Common Shares to members of theBoard of Directors who are not employees of U.S. Cellular or TDS.
100
TELEPHONE AND DATA SYSTEMS, INC. NOTES TO CONSOLIDATED FINANCIAL STATEMENTS

On June 25, 2013, U.S. Cellular paid a special cash dividend to all holders of U.S. Cellular Common Shares andSeries A Common Shares as of June 11, 2013. Outstanding U.S. Cellular stock options, restricted stock unit awards anddeferred compensation stock units were equitably adjusted for the special cash dividend. The impact of suchadjustments are fully reflected for all years presented. See Note 5 — Earnings Per Share for additional information.
At December 31, 2015, U.S. Cellular had reserved 9,340,000 Common Shares for equity awards granted and to begranted under the Long-Term Incentive Plans and 183,000 Common Shares for issuance under the Non-EmployeeDirector compensation plan.
U.S. Cellular uses treasury stock to satisfy requirements for Common Shares issued pursuant to its various stock-basedcompensation plans.
Long-Term Incentive Plans – Stock Options – Stock options granted to key employees are exercisable over a specifiedperiod not in excess of ten years. Stock options generally vest over a period of three years from the date of grant. Stockoptions outstanding at December 31, 2015 expire between 2016 and 2025. However, vested stock options typicallyexpire 30 days after the effective date of an employee’s termination of employment for reasons other than retirement.Employees who leave at the age of retirement have 90 days (or one year if they satisfy certain requirements) withinwhich to exercise their vested stock options. The exercise price of options equals the market value of U.S. CellularCommon Shares on the date of grant.
U.S. Cellular estimated the fair value of stock options granted during 2015, 2014 and 2013 using the Black-Scholesvaluation model and the assumptions shown in the table below.
2015 2014 2013
Expected life . . . . . . . . . . . . . . . . . . . . . . . . . . . . . . . . . . . . . . . 4.6 years 4.5 years 4.6-9.0 yearsExpected annual volatility rate . . . . . . . . . . . . . . . . . . . . . . . . . . . . 30.1% 28.0%-28.1% 29.2%-39.6%Dividend yield . . . . . . . . . . . . . . . . . . . . . . . . . . . . . . . . . . . . . . 0% 0% 0%Risk-free interest rate . . . . . . . . . . . . . . . . . . . . . . . . . . . . . . . . . . 1.2% 1.4%-1.5% 0.7%-2.4%Estimated annual forfeiture rate . . . . . . . . . . . . . . . . . . . . . . . . . . . 9.7% 9.4% 0.0%-8.1%
The fair value of options is recognized as compensation cost using an accelerated attribution method over the requisiteservice periods of the awards, which is generally the vesting period.
A summary of U.S. Cellular stock options outstanding (total and portion exercisable) and changes during 2015, ispresented in the table below:
WeightedAverage
Weighted RemainingAverage Aggregate Contractual
Number of Exercise Intrinsic LifeCommon Share Options Options Price Value (in years)
Outstanding at December 31, 2014 . . . . . . . . . . . . 3,388,000 $ 41.51(1,586,000 exercisable) . . . . . . . . . . . . . . . . . . . . 45.28
Granted . . . . . . . . . . . . . . . . . . . . . . . . . . . . 1,279,000 36.42Exercised . . . . . . . . . . . . . . . . . . . . . . . . . . . (321,000) 32.94Forfeited . . . . . . . . . . . . . . . . . . . . . . . . . . . (110,000) 37.57Expired . . . . . . . . . . . . . . . . . . . . . . . . . . . . (134,000) 43.77
Outstanding at December 31, 2015 . . . . . . . . . . . . 4,102,000 $ 40.62 $ 11,292,000 6.8(1,849,000 exercisable) . . . . . . . . . . . . . . . . . . . . $ 44.33 $ 3,733,000 4.6
The weighted average grant date fair value per share of the U.S. Cellular stock options granted in 2015, 2014 and 2013was $9.94, $10.68 and $11.53, respectively. The aggregate intrinsic value of U.S. Cellular stock options exercised in2015, 2014 and 2013 was $2.1 million, $2.0 million and $6.8 million, respectively. The aggregate intrinsic valuerepresents the total pre-tax intrinsic value (the difference between U.S. Cellular’s closing stock price and the exerciseprice multiplied by the number of in-the-money options) that was received by the option holders upon exercise or thatwould have been received by option holders had all options been exercised on December 31, 2015.
101
TELEPHONE AND DATA SYSTEMS, INC. NOTES TO CONSOLIDATED FINANCIAL STATEMENTS
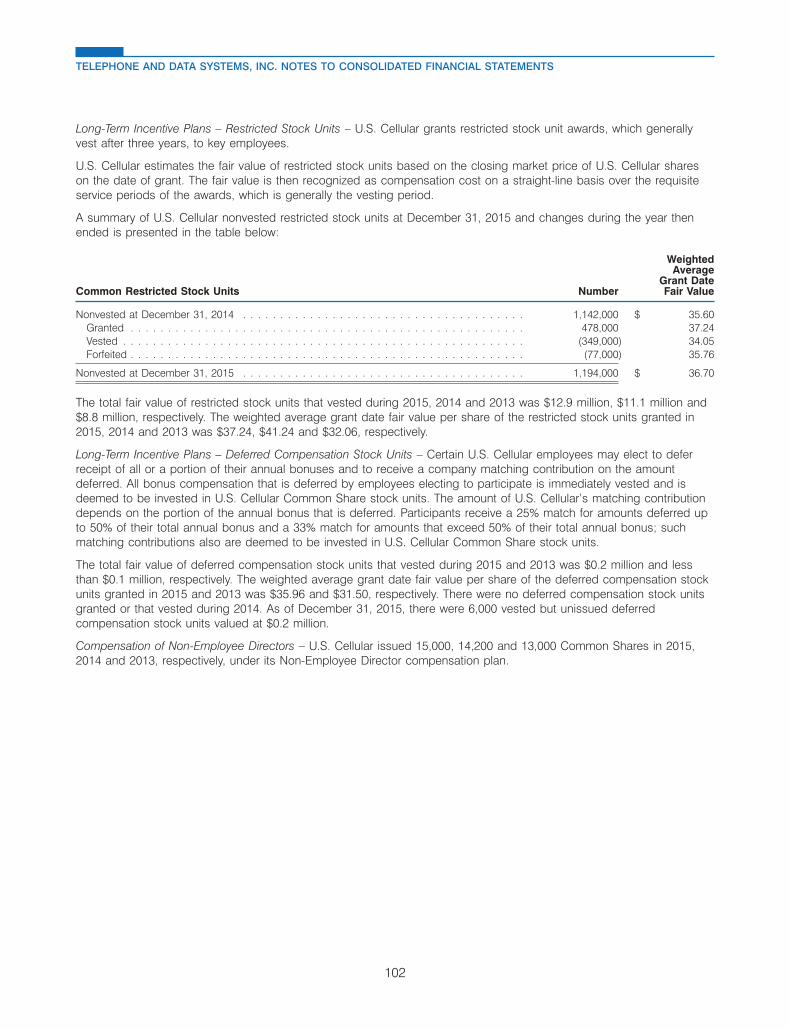
Long-Term Incentive Plans – Restricted Stock Units – U.S. Cellular grants restricted stock unit awards, which generallyvest after three years, to key employees.
U.S. Cellular estimates the fair value of restricted stock units based on the closing market price of U.S. Cellular shareson the date of grant. The fair value is then recognized as compensation cost on a straight-line basis over the requisiteservice periods of the awards, which is generally the vesting period.
A summary of U.S. Cellular nonvested restricted stock units at December 31, 2015 and changes during the year thenended is presented in the table below:
WeightedAverage
Grant DateCommon Restricted Stock Units Number Fair Value
Nonvested at December 31, 2014 . . . . . . . . . . . . . . . . . . . . . . . . . . . . . . . . . . . . . . 1,142,000 $ 35.60Granted . . . . . . . . . . . . . . . . . . . . . . . . . . . . . . . . . . . . . . . . . . . . . . . . . . . . . 478,000 37.24Vested . . . . . . . . . . . . . . . . . . . . . . . . . . . . . . . . . . . . . . . . . . . . . . . . . . . . . . (349,000) 34.05Forfeited . . . . . . . . . . . . . . . . . . . . . . . . . . . . . . . . . . . . . . . . . . . . . . . . . . . . . (77,000) 35.76
Nonvested at December 31, 2015 . . . . . . . . . . . . . . . . . . . . . . . . . . . . . . . . . . . . . . 1,194,000 $ 36.70
The total fair value of restricted stock units that vested during 2015, 2014 and 2013 was $12.9 million, $11.1 million and$8.8 million, respectively. The weighted average grant date fair value per share of the restricted stock units granted in2015, 2014 and 2013 was $37.24, $41.24 and $32.06, respectively.
Long-Term Incentive Plans – Deferred Compensation Stock Units – Certain U.S. Cellular employees may elect to deferreceipt of all or a portion of their annual bonuses and to receive a company matching contribution on the amountdeferred. All bonus compensation that is deferred by employees electing to participate is immediately vested and isdeemed to be invested in U.S. Cellular Common Share stock units. The amount of U.S. Cellular’s matching contributiondepends on the portion of the annual bonus that is deferred. Participants receive a 25% match for amounts deferred upto 50% of their total annual bonus and a 33% match for amounts that exceed 50% of their total annual bonus; suchmatching contributions also are deemed to be invested in U.S. Cellular Common Share stock units.
The total fair value of deferred compensation stock units that vested during 2015 and 2013 was $0.2 million and lessthan $0.1 million, respectively. The weighted average grant date fair value per share of the deferred compensation stockunits granted in 2015 and 2013 was $35.96 and $31.50, respectively. There were no deferred compensation stock unitsgranted or that vested during 2014. As of December 31, 2015, there were 6,000 vested but unissued deferredcompensation stock units valued at $0.2 million.
Compensation of Non-Employee Directors – U.S. Cellular issued 15,000, 14,200 and 13,000 Common Shares in 2015,2014 and 2013, respectively, under its Non-Employee Director compensation plan.
102
TELEPHONE AND DATA SYSTEMS, INC. NOTES TO CONSOLIDATED FINANCIAL STATEMENTS
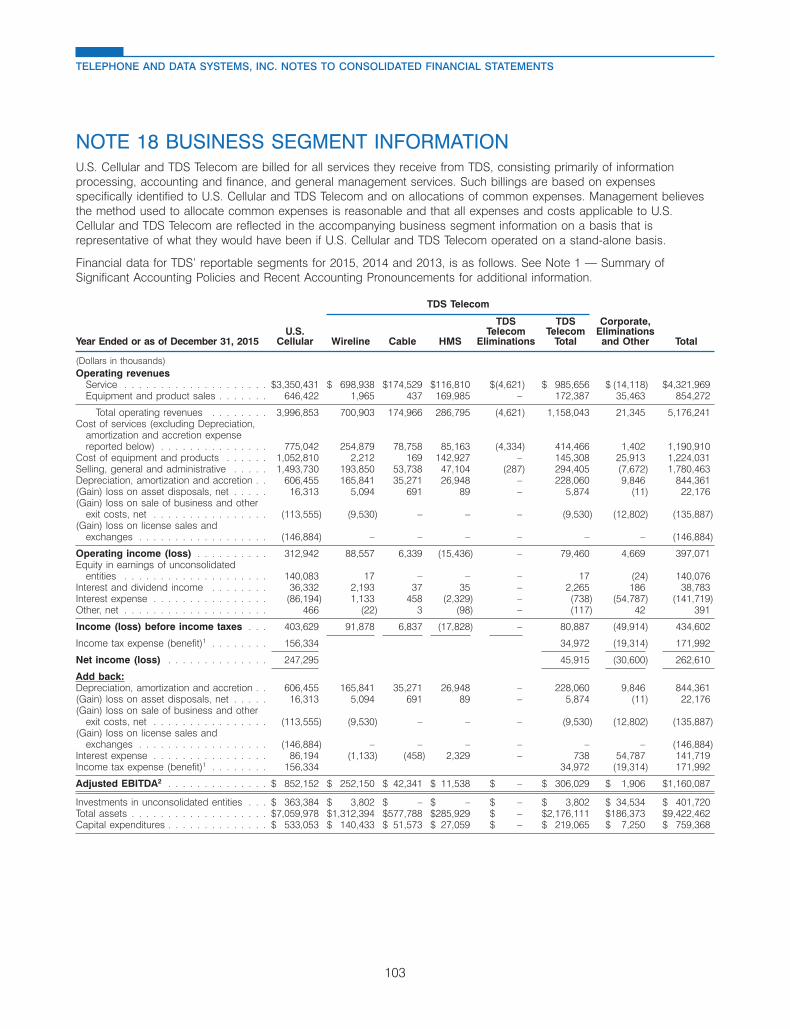
NOTE 18 BUSINESS SEGMENT INFORMATIONU.S. Cellular and TDS Telecom are billed for all services they receive from TDS, consisting primarily of informationprocessing, accounting and finance, and general management services. Such billings are based on expensesspecifically identified to U.S. Cellular and TDS Telecom and on allocations of common expenses. Management believesthe method used to allocate common expenses is reasonable and that all expenses and costs applicable to U.S.Cellular and TDS Telecom are reflected in the accompanying business segment information on a basis that isrepresentative of what they would have been if U.S. Cellular and TDS Telecom operated on a stand-alone basis.
Financial data for TDS’ reportable segments for 2015, 2014 and 2013, is as follows. See Note 1 — Summary ofSignificant Accounting Policies and Recent Accounting Pronouncements for additional information.
TDS Telecom
TDS TDS Corporate,U.S. Telecom Telecom Eliminations
Year Ended or as of December 31, 2015 Cellular Wireline Cable HMS Eliminations Total and Other Total
(Dollars in thousands)Operating revenues
Service . . . . . . . . . . . . . . . . . . . . $3,350,431 $ 698,938 $174,529 $116,810 $(4,621) $ 985,656 $ (14,118) $4,321,969Equipment and product sales . . . . . . . 646,422 1,965 437 169,985 – 172,387 35,463 854,272
Total operating revenues . . . . . . . . 3,996,853 700,903 174,966 286,795 (4,621) 1,158,043 21,345 5,176,241Cost of services (excluding Depreciation,
amortization and accretion expensereported below) . . . . . . . . . . . . . . . 775,042 254,879 78,758 85,163 (4,334) 414,466 1,402 1,190,910
Cost of equipment and products . . . . . . 1,052,810 2,212 169 142,927 – 145,308 25,913 1,224,031Selling, general and administrative . . . . . 1,493,730 193,850 53,738 47,104 (287) 294,405 (7,672) 1,780,463Depreciation, amortization and accretion . . 606,455 165,841 35,271 26,948 – 228,060 9,846 844,361(Gain) loss on asset disposals, net . . . . . 16,313 5,094 691 89 – 5,874 (11) 22,176(Gain) loss on sale of business and other
exit costs, net . . . . . . . . . . . . . . . . (113,555) (9,530) – – – (9,530) (12,802) (135,887)(Gain) loss on license sales and
exchanges . . . . . . . . . . . . . . . . . . (146,884) – – – – – – (146,884)
Operating income (loss) . . . . . . . . . . 312,942 88,557 6,339 (15,436) – 79,460 4,669 397,071Equity in earnings of unconsolidated
entities . . . . . . . . . . . . . . . . . . . . 140,083 17 – – – 17 (24) 140,076Interest and dividend income . . . . . . . . 36,332 2,193 37 35 – 2,265 186 38,783Interest expense . . . . . . . . . . . . . . . . (86,194) 1,133 458 (2,329) – (738) (54,787) (141,719)Other, net . . . . . . . . . . . . . . . . . . . . 466 (22) 3 (98) – (117) 42 391
Income (loss) before income taxes . . . 403,629 91,878 6,837 (17,828) – 80,887 (49,914) 434,602
Income tax expense (benefit)1 . . . . . . . . 156,334 34,972 (19,314) 171,992
Net income (loss) . . . . . . . . . . . . . . 247,295 45,915 (30,600) 262,610
Add back:Depreciation, amortization and accretion . . 606,455 165,841 35,271 26,948 – 228,060 9,846 844,361(Gain) loss on asset disposals, net . . . . . 16,313 5,094 691 89 – 5,874 (11) 22,176(Gain) loss on sale of business and other
exit costs, net . . . . . . . . . . . . . . . . (113,555) (9,530) – – – (9,530) (12,802) (135,887)(Gain) loss on license sales and
exchanges . . . . . . . . . . . . . . . . . . (146,884) – – – – – – (146,884)Interest expense . . . . . . . . . . . . . . . . 86,194 (1,133) (458) 2,329 – 738 54,787 141,719Income tax expense (benefit)1 . . . . . . . . 156,334 34,972 (19,314) 171,992
Adjusted EBITDA2 . . . . . . . . . . . . . . $ 852,152 $ 252,150 $ 42,341 $ 11,538 $ – $ 306,029 $ 1,906 $1,160,087
Investments in unconsolidated entities . . . $ 363,384 $ 3,802 $ – $ – $ – $ 3,802 $ 34,534 $ 401,720Total assets . . . . . . . . . . . . . . . . . . . $7,059,978 $1,312,394 $577,788 $285,929 $ – $2,176,111 $186,373 $9,422,462Capital expenditures . . . . . . . . . . . . . . $ 533,053 $ 140,433 $ 51,573 $ 27,059 $ – $ 219,065 $ 7,250 $ 759,368
103
TELEPHONE AND DATA SYSTEMS, INC. NOTES TO CONSOLIDATED FINANCIAL STATEMENTS
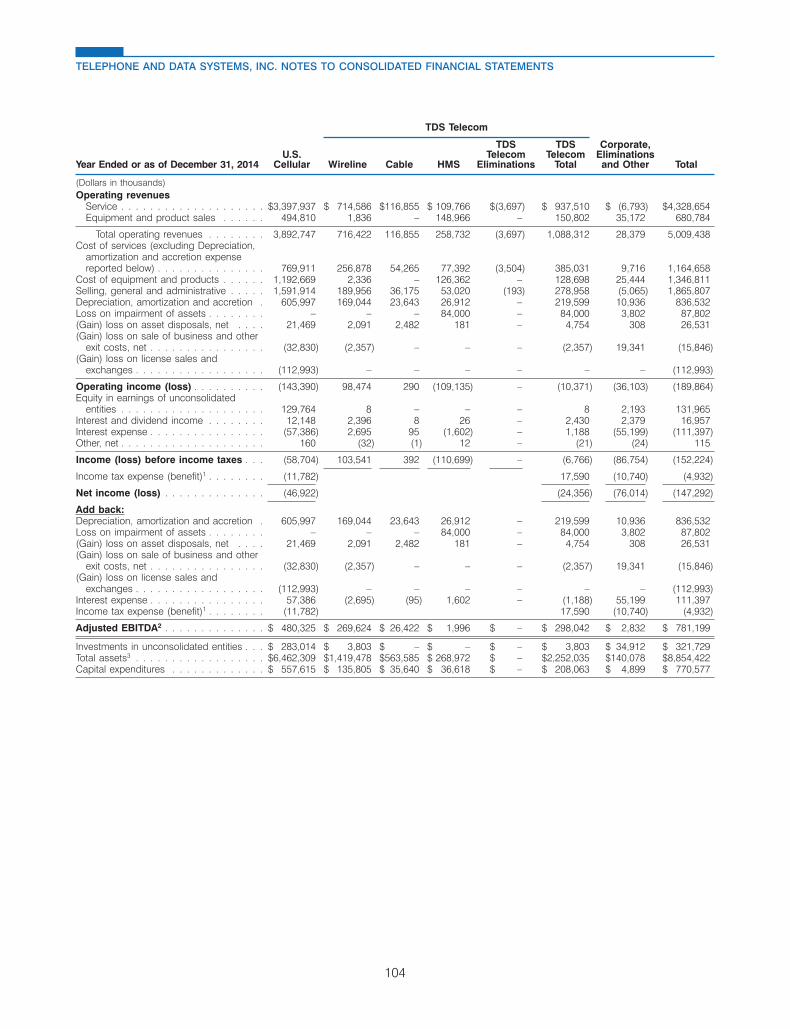
TDS Telecom
TDS TDS Corporate,U.S. Telecom Telecom Eliminations
Year Ended or as of December 31, 2014 Cellular Wireline Cable HMS Eliminations Total and Other Total
(Dollars in thousands)Operating revenues
Service . . . . . . . . . . . . . . . . . . . . $3,397,937 $ 714,586 $116,855 $ 109,766 $(3,697) $ 937,510 $ (6,793) $4,328,654Equipment and product sales . . . . . . 494,810 1,836 – 148,966 – 150,802 35,172 680,784
Total operating revenues . . . . . . . . 3,892,747 716,422 116,855 258,732 (3,697) 1,088,312 28,379 5,009,438Cost of services (excluding Depreciation,
amortization and accretion expensereported below) . . . . . . . . . . . . . . . 769,911 256,878 54,265 77,392 (3,504) 385,031 9,716 1,164,658
Cost of equipment and products . . . . . . 1,192,669 2,336 – 126,362 – 128,698 25,444 1,346,811Selling, general and administrative . . . . . 1,591,914 189,956 36,175 53,020 (193) 278,958 (5,065) 1,865,807Depreciation, amortization and accretion . 605,997 169,044 23,643 26,912 – 219,599 10,936 836,532Loss on impairment of assets . . . . . . . . – – – 84,000 – 84,000 3,802 87,802(Gain) loss on asset disposals, net . . . . 21,469 2,091 2,482 181 – 4,754 308 26,531(Gain) loss on sale of business and other
exit costs, net . . . . . . . . . . . . . . . . (32,830) (2,357) – – – (2,357) 19,341 (15,846)(Gain) loss on license sales and
exchanges . . . . . . . . . . . . . . . . . . (112,993) – – – – – – (112,993)
Operating income (loss) . . . . . . . . . . (143,390) 98,474 290 (109,135) – (10,371) (36,103) (189,864)Equity in earnings of unconsolidated
entities . . . . . . . . . . . . . . . . . . . . 129,764 8 – – – 8 2,193 131,965Interest and dividend income . . . . . . . . 12,148 2,396 8 26 – 2,430 2,379 16,957Interest expense . . . . . . . . . . . . . . . . (57,386) 2,695 95 (1,602) – 1,188 (55,199) (111,397)Other, net . . . . . . . . . . . . . . . . . . . . 160 (32) (1) 12 – (21) (24) 115
Income (loss) before income taxes . . . (58,704) 103,541 392 (110,699) – (6,766) (86,754) (152,224)
Income tax expense (benefit)1 . . . . . . . . (11,782) 17,590 (10,740) (4,932)
Net income (loss) . . . . . . . . . . . . . . (46,922) (24,356) (76,014) (147,292)
Add back:Depreciation, amortization and accretion . 605,997 169,044 23,643 26,912 – 219,599 10,936 836,532Loss on impairment of assets . . . . . . . . – – – 84,000 – 84,000 3,802 87,802(Gain) loss on asset disposals, net . . . . 21,469 2,091 2,482 181 – 4,754 308 26,531(Gain) loss on sale of business and other
exit costs, net . . . . . . . . . . . . . . . . (32,830) (2,357) – – – (2,357) 19,341 (15,846)(Gain) loss on license sales and
exchanges . . . . . . . . . . . . . . . . . . (112,993) – – – – – – (112,993)Interest expense . . . . . . . . . . . . . . . . 57,386 (2,695) (95) 1,602 – (1,188) 55,199 111,397Income tax expense (benefit)1 . . . . . . . . (11,782) 17,590 (10,740) (4,932)
Adjusted EBITDA2 . . . . . . . . . . . . . . $ 480,325 $ 269,624 $ 26,422 $ 1,996 $ – $ 298,042 $ 2,832 $ 781,199
Investments in unconsolidated entities . . . $ 283,014 $ 3,803 $ – $ – $ – $ 3,803 $ 34,912 $ 321,729Total assets3 . . . . . . . . . . . . . . . . . . $6,462,309 $1,419,478 $563,585 $ 268,972 $ – $2,252,035 $140,078 $8,854,422Capital expenditures . . . . . . . . . . . . . $ 557,615 $ 135,805 $ 35,640 $ 36,618 $ – $ 208,063 $ 4,899 $ 770,577
104
TELEPHONE AND DATA SYSTEMS, INC. NOTES TO CONSOLIDATED FINANCIAL STATEMENTS
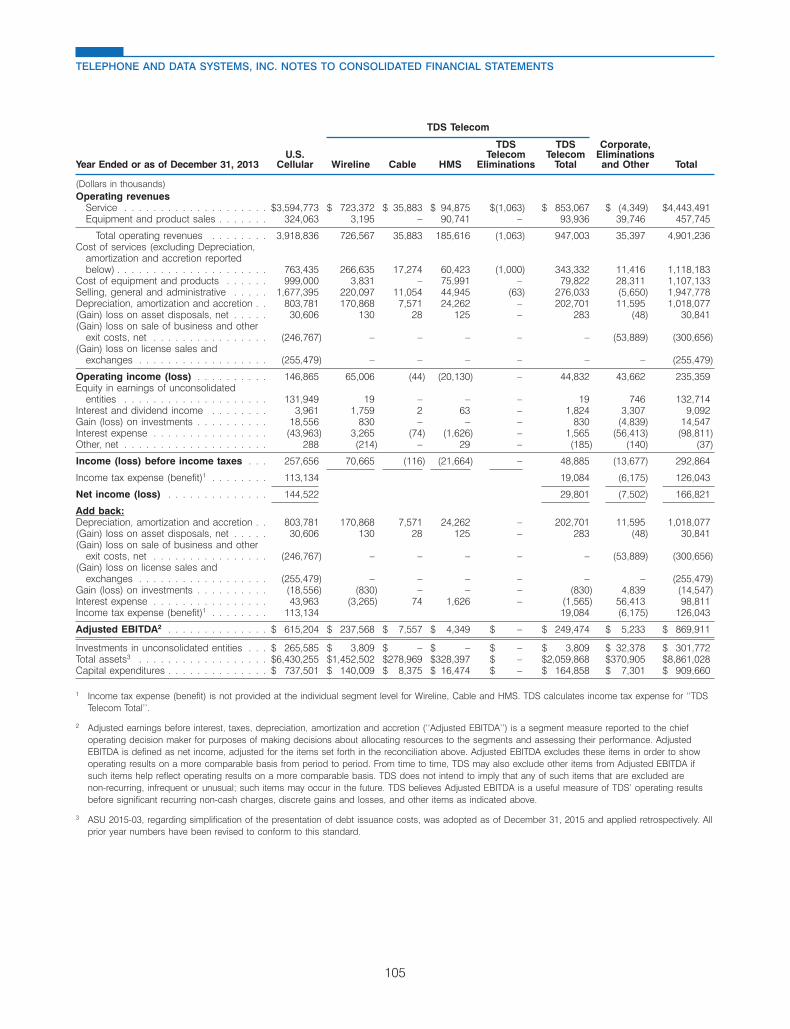
TDS Telecom
TDS TDS Corporate,U.S. Telecom Telecom Eliminations
Year Ended or as of December 31, 2013 Cellular Wireline Cable HMS Eliminations Total and Other Total
(Dollars in thousands)Operating revenues
Service . . . . . . . . . . . . . . . . . . . . $3,594,773 $ 723,372 $ 35,883 $ 94,875 $(1,063) $ 853,067 $ (4,349) $4,443,491Equipment and product sales . . . . . . . 324,063 3,195 – 90,741 – 93,936 39,746 457,745
Total operating revenues . . . . . . . . 3,918,836 726,567 35,883 185,616 (1,063) 947,003 35,397 4,901,236Cost of services (excluding Depreciation,
amortization and accretion reportedbelow) . . . . . . . . . . . . . . . . . . . . . 763,435 266,635 17,274 60,423 (1,000) 343,332 11,416 1,118,183
Cost of equipment and products . . . . . . 999,000 3,831 – 75,991 – 79,822 28,311 1,107,133Selling, general and administrative . . . . . 1,677,395 220,097 11,054 44,945 (63) 276,033 (5,650) 1,947,778Depreciation, amortization and accretion . . 803,781 170,868 7,571 24,262 – 202,701 11,595 1,018,077(Gain) loss on asset disposals, net . . . . . 30,606 130 28 125 – 283 (48) 30,841(Gain) loss on sale of business and other
exit costs, net . . . . . . . . . . . . . . . . (246,767) – – – – – (53,889) (300,656)(Gain) loss on license sales and
exchanges . . . . . . . . . . . . . . . . . . (255,479) – – – – – – (255,479)
Operating income (loss) . . . . . . . . . . 146,865 65,006 (44) (20,130) – 44,832 43,662 235,359Equity in earnings of unconsolidated
entities . . . . . . . . . . . . . . . . . . . . 131,949 19 – – – 19 746 132,714Interest and dividend income . . . . . . . . 3,961 1,759 2 63 – 1,824 3,307 9,092Gain (loss) on investments . . . . . . . . . . 18,556 830 – – – 830 (4,839) 14,547Interest expense . . . . . . . . . . . . . . . . (43,963) 3,265 (74) (1,626) – 1,565 (56,413) (98,811)Other, net . . . . . . . . . . . . . . . . . . . . 288 (214) – 29 – (185) (140) (37)
Income (loss) before income taxes . . . 257,656 70,665 (116) (21,664) – 48,885 (13,677) 292,864
Income tax expense (benefit)1 . . . . . . . . 113,134 19,084 (6,175) 126,043
Net income (loss) . . . . . . . . . . . . . . 144,522 29,801 (7,502) 166,821
Add back:Depreciation, amortization and accretion . . 803,781 170,868 7,571 24,262 – 202,701 11,595 1,018,077(Gain) loss on asset disposals, net . . . . . 30,606 130 28 125 – 283 (48) 30,841(Gain) loss on sale of business and other
exit costs, net . . . . . . . . . . . . . . . . (246,767) – – – – – (53,889) (300,656)(Gain) loss on license sales and
exchanges . . . . . . . . . . . . . . . . . . (255,479) – – – – – – (255,479)Gain (loss) on investments . . . . . . . . . . (18,556) (830) – – – (830) 4,839 (14,547)Interest expense . . . . . . . . . . . . . . . . 43,963 (3,265) 74 1,626 – (1,565) 56,413 98,811Income tax expense (benefit)1 . . . . . . . . 113,134 19,084 (6,175) 126,043
Adjusted EBITDA2 . . . . . . . . . . . . . . $ 615,204 $ 237,568 $ 7,557 $ 4,349 $ – $ 249,474 $ 5,233 $ 869,911
Investments in unconsolidated entities . . . $ 265,585 $ 3,809 $ – $ – $ – $ 3,809 $ 32,378 $ 301,772Total assets3 . . . . . . . . . . . . . . . . . . $6,430,255 $1,452,502 $278,969 $328,397 $ – $2,059,868 $370,905 $8,861,028Capital expenditures . . . . . . . . . . . . . . $ 737,501 $ 140,009 $ 8,375 $ 16,474 $ – $ 164,858 $ 7,301 $ 909,660
1 Income tax expense (benefit) is not provided at the individual segment level for Wireline, Cable and HMS. TDS calculates income tax expense for ‘‘TDSTelecom Total’’.
2 Adjusted earnings before interest, taxes, depreciation, amortization and accretion (‘‘Adjusted EBITDA’’) is a segment measure reported to the chiefoperating decision maker for purposes of making decisions about allocating resources to the segments and assessing their performance. AdjustedEBITDA is defined as net income, adjusted for the items set forth in the reconciliation above. Adjusted EBITDA excludes these items in order to showoperating results on a more comparable basis from period to period. From time to time, TDS may also exclude other items from Adjusted EBITDA ifsuch items help reflect operating results on a more comparable basis. TDS does not intend to imply that any of such items that are excluded arenon-recurring, infrequent or unusual; such items may occur in the future. TDS believes Adjusted EBITDA is a useful measure of TDS’ operating resultsbefore significant recurring non-cash charges, discrete gains and losses, and other items as indicated above.
3 ASU 2015-03, regarding simplification of the presentation of debt issuance costs, was adopted as of December 31, 2015 and applied retrospectively. Allprior year numbers have been revised to conform to this standard.
105
TELEPHONE AND DATA SYSTEMS, INC. NOTES TO CONSOLIDATED FINANCIAL STATEMENTS
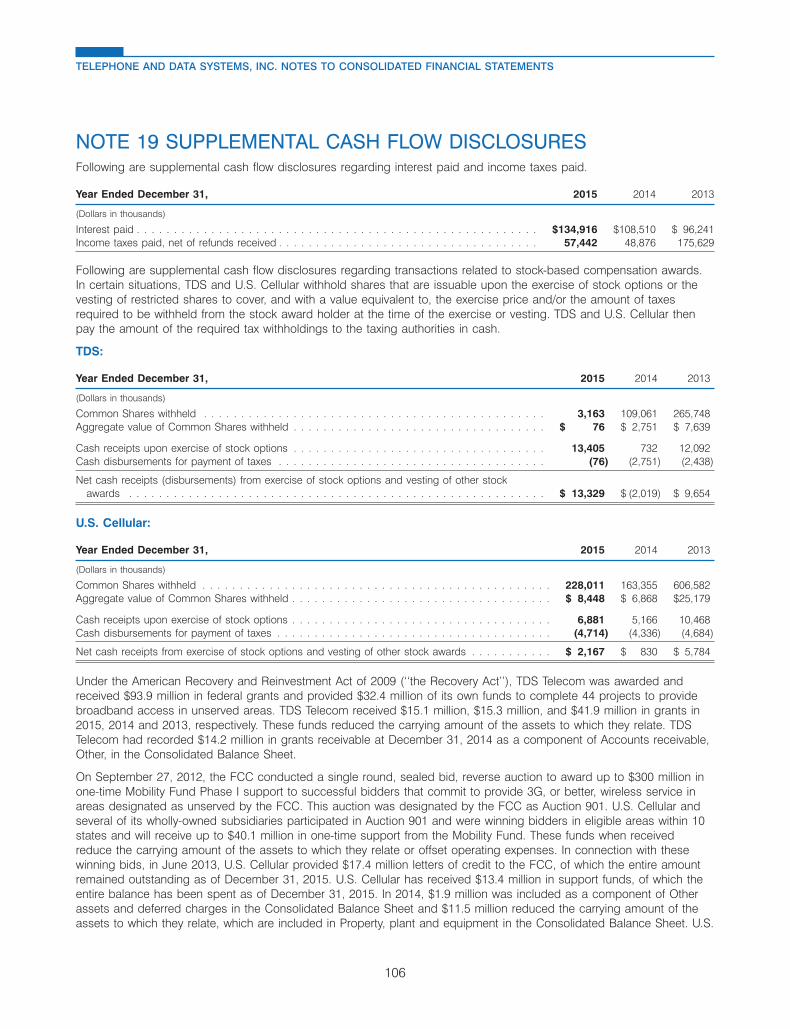
NOTE 19 SUPPLEMENTAL CASH FLOW DISCLOSURESFollowing are supplemental cash flow disclosures regarding interest paid and income taxes paid.
Year Ended December 31, 2015 2014 2013
(Dollars in thousands)
Interest paid . . . . . . . . . . . . . . . . . . . . . . . . . . . . . . . . . . . . . . . . . . . . . . . . . . . . . . $134,916 $108,510 $ 96,241Income taxes paid, net of refunds received . . . . . . . . . . . . . . . . . . . . . . . . . . . . . . . . . . . 57,442 48,876 175,629
Following are supplemental cash flow disclosures regarding transactions related to stock-based compensation awards.In certain situations, TDS and U.S. Cellular withhold shares that are issuable upon the exercise of stock options or thevesting of restricted shares to cover, and with a value equivalent to, the exercise price and/or the amount of taxesrequired to be withheld from the stock award holder at the time of the exercise or vesting. TDS and U.S. Cellular thenpay the amount of the required tax withholdings to the taxing authorities in cash.
TDS:
Year Ended December 31, 2015 2014 2013
(Dollars in thousands)
Common Shares withheld . . . . . . . . . . . . . . . . . . . . . . . . . . . . . . . . . . . . . . . . . . . . . . 3,163 109,061 265,748Aggregate value of Common Shares withheld . . . . . . . . . . . . . . . . . . . . . . . . . . . . . . . . . . $ 76 $ 2,751 $ 7,639
Cash receipts upon exercise of stock options . . . . . . . . . . . . . . . . . . . . . . . . . . . . . . . . . . 13,405 732 12,092Cash disbursements for payment of taxes . . . . . . . . . . . . . . . . . . . . . . . . . . . . . . . . . . . . (76) (2,751) (2,438)
Net cash receipts (disbursements) from exercise of stock options and vesting of other stockawards . . . . . . . . . . . . . . . . . . . . . . . . . . . . . . . . . . . . . . . . . . . . . . . . . . . . . . . . $ 13,329 $ (2,019) $ 9,654
U.S. Cellular:
Year Ended December 31, 2015 2014 2013
(Dollars in thousands)
Common Shares withheld . . . . . . . . . . . . . . . . . . . . . . . . . . . . . . . . . . . . . . . . . . . . . . . 228,011 163,355 606,582Aggregate value of Common Shares withheld . . . . . . . . . . . . . . . . . . . . . . . . . . . . . . . . . . . $ 8,448 $ 6,868 $25,179
Cash receipts upon exercise of stock options . . . . . . . . . . . . . . . . . . . . . . . . . . . . . . . . . . . 6,881 5,166 10,468Cash disbursements for payment of taxes . . . . . . . . . . . . . . . . . . . . . . . . . . . . . . . . . . . . . (4,714) (4,336) (4,684)
Net cash receipts from exercise of stock options and vesting of other stock awards . . . . . . . . . . . $ 2,167 $ 830 $ 5,784
Under the American Recovery and Reinvestment Act of 2009 (‘‘the Recovery Act’’), TDS Telecom was awarded andreceived $93.9 million in federal grants and provided $32.4 million of its own funds to complete 44 projects to providebroadband access in unserved areas. TDS Telecom received $15.1 million, $15.3 million, and $41.9 million in grants in2015, 2014 and 2013, respectively. These funds reduced the carrying amount of the assets to which they relate. TDSTelecom had recorded $14.2 million in grants receivable at December 31, 2014 as a component of Accounts receivable,Other, in the Consolidated Balance Sheet.
On September 27, 2012, the FCC conducted a single round, sealed bid, reverse auction to award up to $300 million inone-time Mobility Fund Phase I support to successful bidders that commit to provide 3G, or better, wireless service inareas designated as unserved by the FCC. This auction was designated by the FCC as Auction 901. U.S. Cellular andseveral of its wholly-owned subsidiaries participated in Auction 901 and were winning bidders in eligible areas within 10states and will receive up to $40.1 million in one-time support from the Mobility Fund. These funds when receivedreduce the carrying amount of the assets to which they relate or offset operating expenses. In connection with thesewinning bids, in June 2013, U.S. Cellular provided $17.4 million letters of credit to the FCC, of which the entire amountremained outstanding as of December 31, 2015. U.S. Cellular has received $13.4 million in support funds, of which theentire balance has been spent as of December 31, 2015. In 2014, $1.9 million was included as a component of Otherassets and deferred charges in the Consolidated Balance Sheet and $11.5 million reduced the carrying amount of theassets to which they relate, which are included in Property, plant and equipment in the Consolidated Balance Sheet. U.S.
106
TELEPHONE AND DATA SYSTEMS, INC. NOTES TO CONSOLIDATED FINANCIAL STATEMENTS

Cellular has set up a receivable in the amount of $18.4 million as of December 31, 2015 as part of Phase II of theMobility Fund.
NOTE 20 CERTAIN RELATIONSHIPS AND RELATED TRANSACTIONSThe following persons are partners of Sidley Austin LLP, the principal law firm of TDS and its subsidiaries: Walter C.D.Carlson, a trustee and beneficiary of a voting trust that controls TDS, the non-executive Chairman of the Board andmember of the Board of Directors of TDS and a director of U.S. Cellular, a subsidiary of TDS; William S. DeCarlo, theGeneral Counsel of TDS and an Assistant Secretary of TDS and certain subsidiaries of TDS; and Stephen P. Fitzell, theGeneral Counsel of U.S. Cellular and TDS Telecommunications Corporation and an Assistant Secretary of certainsubsidiaries of TDS. Walter C.D. Carlson does not provide legal services to TDS or its subsidiaries. TDS, U.S. Cellularand their subsidiaries incurred legal costs from Sidley Austin LLP of $11.9 million in 2015, $15.4 million in 2014 and$17.6 million in 2013.
The Audit Committee of the Board of Directors of TDS is responsible for the review and evaluation of all related-partytransactions as such term is defined by the rules of the New York Stock Exchange.
NOTE 21 SUBSEQUENT EVENTSIn January 2016, TDS entered into an agreement to purchase a 700 MHz A Block license for $36.0 million. Thetransaction is expected to close in the third quarter of 2016 pending regulatory approval. In February 2016, TDS enteredinto multiple agreements with third parties that provide for the transfer of certain AWS and PCS spectrum licenses andapproximately $30 million in cash to U.S. Cellular, in exchange for U.S. Cellular transferring certain AWS, PCS and 700MHz licenses to the third parties. The transactions are subject to regulatory approval and other customary closingconditions, and are expected to close in 2016. Upon closing of the transactions, TDS expects to recognize a gain.
107
TELEPHONE AND DATA SYSTEMS, INC. NOTES TO CONSOLIDATED FINANCIAL STATEMENTS
Management of Telephone and Data Systems, Inc. has the responsibility for preparing the accompanying consolidatedfinancial statements and for their integrity and objectivity. The statements were prepared in accordance with accountingprinciples generally accepted in the United States of America and, in management’s opinion, were fairly presented. Thefinancial statements included amounts that were based on management’s best estimates and judgments. Managementalso prepared the other information in the annual report and is responsible for its accuracy and consistency with thefinancial statements.
PricewaterhouseCoopers LLP, an independent registered public accounting firm, has audited these consolidated financialstatements in accordance with the standards of the Public Company Accounting Oversight Board (United States) andhas expressed herein its unqualified opinion on these financial statements.
/s/ LeRoy T. Carlson, Jr. /s/ Douglas D. Shuma
LeRoy T. Carlson, Jr. Douglas D. ShumaPresident and Senior Vice President - Finance andChief Executive Officer Chief Accounting Officer(principal executive officer) (principal financial officer and principal
accounting officer)
108
REPORTS OF MANAGEMENT
Management’s Responsibility for Financial Statements

Management is responsible for establishing and maintaining adequate internal control over financial reporting, as suchterm is defined in Rules 13a-15(f) and 15d-15(f) under the Exchange Act. TDS’ internal control over financial reporting isa process designed to provide reasonable assurance regarding the reliability of financial reporting and the preparation offinancial statements for external purposes in accordance with accounting principles generally accepted in the UnitedStates of America (‘‘GAAP’’). TDS’ internal control over financial reporting includes those policies and procedures that(i) pertain to the maintenance of records that, in reasonable detail, accurately and fairly reflect the transactions anddispositions of the assets of the issuer; (ii) provide reasonable assurance that transactions are recorded as necessary topermit preparation of financial statements in accordance with GAAP, and that receipts and expenditures of the issuer arebeing made only in accordance with authorizations of management and, where required, the Board of Directors of theissuer; and (iii) provide reasonable assurance regarding prevention or timely detection of unauthorized acquisition, use,or disposition of the issuer’s assets that could have a material effect on the interim or annual consolidated financialstatements.
Because of its inherent limitations, internal control over financial reporting may not prevent or detect misstatements. Also,projections of any evaluation of effectiveness to future periods are subject to the risk that controls may becomeinadequate because of changes in conditions, or that the degree of compliance with the policies or procedures maydeteriorate.
Under the supervision and with the participation of TDS’ management, including its principal executive officer andprincipal financial officer, TDS conducted an evaluation of the effectiveness of its internal control over financial reportingas of December 31, 2015, based on the criteria established in the 2013 version of Internal Control — IntegratedFramework issued by the Committee of Sponsoring Organizations of the Treadway Commission (COSO). Managementhas concluded that TDS maintained effective internal control over financial reporting as of December 31, 2015 based oncriteria established in the 2013 version of Internal Control — Integrated Framework issued by the COSO.
The effectiveness of TDS’ internal control over financial reporting as of December 31, 2015 has been audited byPricewaterhouseCoopers LLP, an independent registered public accounting firm, as stated in the firm’s report includedherein.
/s/ LeRoy T. Carlson, Jr. /s/ Douglas D. Shuma
LeRoy T. Carlson, Jr. Douglas D. ShumaPresident and Senior Vice President - Finance andChief Executive Officer Chief Accounting Officer(principal executive officer) (principal financial officer and principal
accounting officer)
109
REPORTS OF MANAGEMENT
Management’s Report on Internal Control Over Financial Reporting

To the Board of Directors and Shareholders of Telephone and Data Systems, Inc.:
In our opinion, based on our audits and the report of other auditors, the accompanying consolidated balance sheetsand the related consolidated statements of operations, comprehensive income (loss), changes in equity, and cash flowspresent fairly, in all material respects, the financial position of Telephone and Data Systems, Inc. and its subsidiaries atDecember 31, 2015 and 2014, and the results of their operations and their cash flows for each of the three years in theperiod ended December 31, 2015 in conformity with accounting principles generally accepted in the United States ofAmerica. Also in our opinion, based on our audit, the Company maintained, in all material respects, effective internalcontrol over financial reporting as of December 31, 2015, based on criteria established in Internal Control - IntegratedFramework (2013) issued by the Committee of Sponsoring Organizations of the Treadway Commission (COSO). TheCompany’s management is responsible for these financial statements, for maintaining effective internal control overfinancial reporting and for its assessment of the effectiveness of internal control over financial reporting, included in theaccompanying Management’s Report on Internal Control over Financial Reporting. Our responsibility is to expressopinions on these financial statements and on the Company’s internal control over financial reporting based on ourintegrated audits. We did not audit the financial statements of Los Angeles SMSA Limited Partnership and Subsidiary, a5.5% owned entity accounted for by the equity method of accounting. The consolidated financial statements ofTelephone and Data Systems, Inc. reflect an investment in this partnership of $197,600,000 and $123,600,000 as ofDecember 31, 2015 and 2014, respectively, and equity earnings of $74,000,000, $71,800,000 and $78,400,000 for eachof the three years in the period ended December 31, 2015. The financial statements of Los Angeles SMSA LimitedPartnership and Subsidiary were audited by other auditors whose report thereon has been furnished to us, and ouropinion on the financial statements expressed herein, insofar as it relates to the amounts included for Los AngelesSMSA Limited Partnership and Subsidiary, is based solely on the report of the other auditors. We conducted our auditsin accordance with the standards of the Public Company Accounting Oversight Board (United States). Those standardsrequire that we plan and perform the audits to obtain reasonable assurance about whether the financial statements arefree of material misstatement and whether effective internal control over financial reporting was maintained in all materialrespects. Our audits of the financial statements included examining, on a test basis, evidence supporting the amountsand disclosures in the financial statements, assessing the accounting principles used and significant estimates made bymanagement, and evaluating the overall financial statement presentation. Our audit of internal control over financialreporting included obtaining an understanding of internal control over financial reporting, assessing the risk that amaterial weakness exists, and testing and evaluating the design and operating effectiveness of internal control based onthe assessed risk. Our audits also included performing such other procedures as we considered necessary in thecircumstances. We believe that our audits and the report of other auditors provide a reasonable basis for our opinions.
As discussed in Note 1 to the consolidated financial statements, the Company changed the manner in which it classifiesdebt issuance costs and deferred income taxes in 2015.
A company’s internal control over financial reporting is a process designed to provide reasonable assurance regardingthe reliability of financial reporting and the preparation of financial statements for external purposes in accordance withgenerally accepted accounting principles. A company’s internal control over financial reporting includes those policiesand procedures that (i) pertain to the maintenance of records that, in reasonable detail, accurately and fairly reflect thetransactions and dispositions of the assets of the company; (ii) provide reasonable assurance that transactions arerecorded as necessary to permit preparation of financial statements in accordance with generally accepted accountingprinciples, and that receipts and expenditures of the company are being made only in accordance with authorizations ofmanagement and directors of the company; and (iii) provide reasonable assurance regarding prevention or timelydetection of unauthorized acquisition, use, or disposition of the company’s assets that could have a material effect onthe financial statements.
Because of its inherent limitations, internal control over financial reporting may not prevent or detect misstatements. Also,projections of any evaluation of effectiveness to future periods are subject to the risk that controls may becomeinadequate because of changes in conditions, or that the degree of compliance with the policies or procedures maydeteriorate.
/s/ PricewaterhouseCoopers LLP
Chicago, IllinoisFebruary 24, 2016
110
REPORT OF INDEPENDENT REGISTERED PUBLIC ACCOUNTING FIRM

Year Ended or at December 31, 2015 2014 2013 2012 2011
(Dollars and shares in thousands, except per share amounts)
Statement of Operations dataOperating revenues . . . . . . . . . . . . . . . . . . . . . $ 5,176,241 $ 5,009,438 $ 4,901,236 $ 5,345,277 $ 5,180,471Loss on impairment of assets1 . . . . . . . . . . . . . . – 87,802 – 515 –(Gain) loss on sale of business and other exit costs,
net . . . . . . . . . . . . . . . . . . . . . . . . . . . . . . (135,887) (15,846) (300,656) 21,061 –(Gain) loss on license sales and exchanges . . . . . . (146,884) (112,993) (255,479) – (11,762)Operating income (loss) . . . . . . . . . . . . . . . . . . 397,071 (189,864) 235,359 183,863 362,502Gain (loss) on investments . . . . . . . . . . . . . . . . – – 14,547 (3,718) 24,103Net income (loss) . . . . . . . . . . . . . . . . . . . . . . 262,610 (147,292) 166,821 122,653 250,242Net income (loss) attributable to noncontrolling
interests, net of tax . . . . . . . . . . . . . . . . . . . . 43,573 (10,937) 24,894 40,792 49,676Net income (loss) attributable to TDS shareholders . 219,037 (136,355) 141,927 81,861 200,566Net income (loss) available to common . . . . . . . . $ 218,988 $ (136,404) $ 141,878 $ 81,811 $ 200,516Basic weighted average shares outstanding . . . . . . 108,645 108,485 108,490 108,671 108,562Basic earnings (loss) per share attributable to TDS
shareholders . . . . . . . . . . . . . . . . . . . . . . . $ 2.02 $ (1.26) $ 1.31 $ 0.75 $ 1.85Diluted weighted average shares outstanding . . . . . 109,910 108,485 109,132 108,937 109,098Diluted earnings (loss) per share attributable to TDS
shareholders . . . . . . . . . . . . . . . . . . . . . . . $ 1.98 $ (1.26) $ 1.29 $ 0.75 $ 1.83Dividends per Common, Special Common and
Series A Common Share2 . . . . . . . . . . . . . . . $ 0.56 $ 0.54 $ 0.51 $ 0.49 $ 0.47
Balance Sheet dataCash and cash equivalents . . . . . . . . . . . . . . . . $ 984,643 $ 471,901 $ 830,014 $ 740,481 $ 563,275Property, plant and equipment, net . . . . . . . . . . . 3,764,477 3,846,125 3,878,144 3,997,266 3,784,535Total assets3 . . . . . . . . . . . . . . . . . . . . . . . . . 9,422,462 8,854,422 8,861,028 8,580,235 8,166,005Net long-term debt, excluding current portion3 . . . . 2,439,827 1,941,069 1,676,955 1,677,906 1,494,857Total TDS shareholders’ equity . . . . . . . . . . . . . . 4,125,550 3,926,278 4,117,837 4,011,536 3,962,161Capital expenditures . . . . . . . . . . . . . . . . . . . . $ 759,368 $ 770,577 $ 909,660 $ 1,004,621 $ 987,218
1 Includes Loss on Impairment of intangible assets related to Goodwill in 2014 and 2012.
2 Dividends per share reflects the amount paid per share outstanding at the date the dividend was declared and has not been retroactively adjusted toreflect the impact of the Share Consolidation Amendment approved by TDS shareholders on January 13, 2012.
3 Simplifying the Presentation of Debt Issuance Costs (‘‘ASU 2015-03’’), was adopted early as of December 31, 2015 and applied retrospectively. All prioryear numbers have been revised to conform to this standard. See Note 1 — Summary of Significant Accounting Policies and Recent AccountingPronouncements for additional information regarding ASU 2015-03.
111
TELEPHONE AND DATA SYSTEMS, INC. SELECTED CONSOLIDATED FINANCIAL DATA
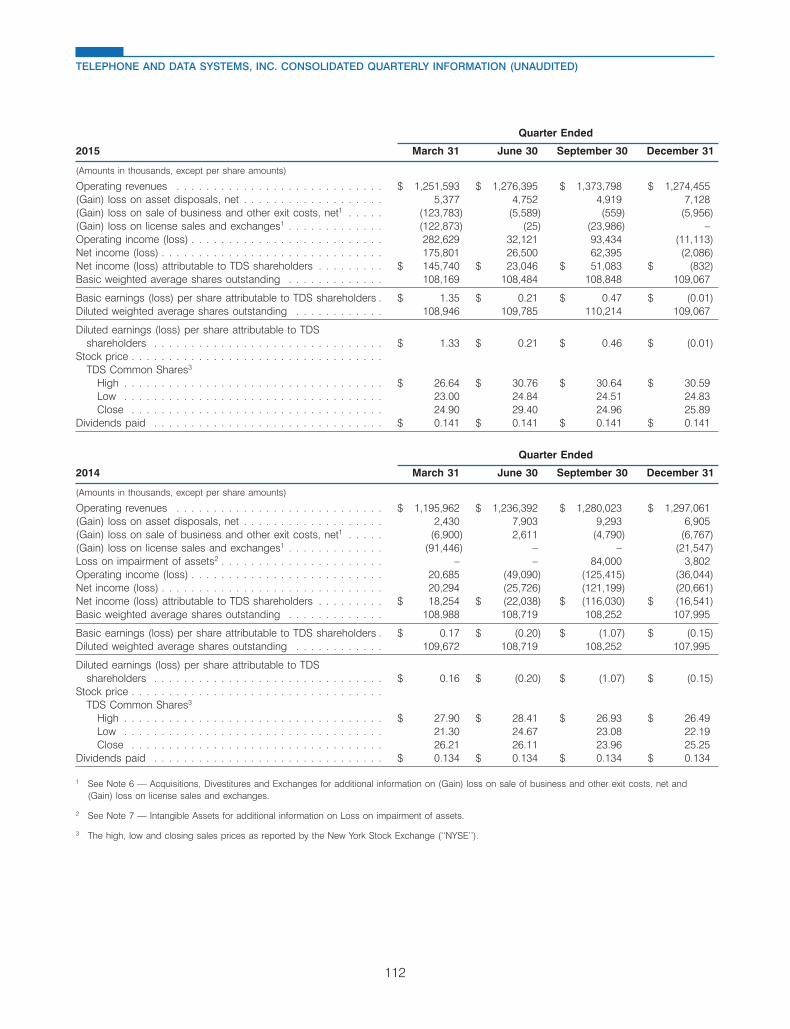
Quarter Ended
2015 March 31 June 30 September 30 December 31
(Amounts in thousands, except per share amounts)
Operating revenues . . . . . . . . . . . . . . . . . . . . . . . . . . . . $ 1,251,593 $ 1,276,395 $ 1,373,798 $ 1,274,455(Gain) loss on asset disposals, net . . . . . . . . . . . . . . . . . . . 5,377 4,752 4,919 7,128(Gain) loss on sale of business and other exit costs, net1 . . . . . (123,783) (5,589) (559) (5,956)(Gain) loss on license sales and exchanges1 . . . . . . . . . . . . . (122,873) (25) (23,986) –Operating income (loss) . . . . . . . . . . . . . . . . . . . . . . . . . . 282,629 32,121 93,434 (11,113)Net income (loss) . . . . . . . . . . . . . . . . . . . . . . . . . . . . . . 175,801 26,500 62,395 (2,086)Net income (loss) attributable to TDS shareholders . . . . . . . . . $ 145,740 $ 23,046 $ 51,083 $ (832)Basic weighted average shares outstanding . . . . . . . . . . . . . 108,169 108,484 108,848 109,067
Basic earnings (loss) per share attributable to TDS shareholders . $ 1.35 $ 0.21 $ 0.47 $ (0.01)Diluted weighted average shares outstanding . . . . . . . . . . . . 108,946 109,785 110,214 109,067
Diluted earnings (loss) per share attributable to TDSshareholders . . . . . . . . . . . . . . . . . . . . . . . . . . . . . . . $ 1.33 $ 0.21 $ 0.46 $ (0.01)
Stock price . . . . . . . . . . . . . . . . . . . . . . . . . . . . . . . . . .TDS Common Shares3
High . . . . . . . . . . . . . . . . . . . . . . . . . . . . . . . . . . . $ 26.64 $ 30.76 $ 30.64 $ 30.59Low . . . . . . . . . . . . . . . . . . . . . . . . . . . . . . . . . . . 23.00 24.84 24.51 24.83Close . . . . . . . . . . . . . . . . . . . . . . . . . . . . . . . . . . 24.90 29.40 24.96 25.89
Dividends paid . . . . . . . . . . . . . . . . . . . . . . . . . . . . . . . $ 0.141 $ 0.141 $ 0.141 $ 0.141
Quarter Ended
2014 March 31 June 30 September 30 December 31
(Amounts in thousands, except per share amounts)
Operating revenues . . . . . . . . . . . . . . . . . . . . . . . . . . . . $ 1,195,962 $ 1,236,392 $ 1,280,023 $ 1,297,061(Gain) loss on asset disposals, net . . . . . . . . . . . . . . . . . . . 2,430 7,903 9,293 6,905(Gain) loss on sale of business and other exit costs, net1 . . . . . (6,900) 2,611 (4,790) (6,767)(Gain) loss on license sales and exchanges1 . . . . . . . . . . . . . (91,446) – – (21,547)Loss on impairment of assets2 . . . . . . . . . . . . . . . . . . . . . . – – 84,000 3,802Operating income (loss) . . . . . . . . . . . . . . . . . . . . . . . . . . 20,685 (49,090) (125,415) (36,044)Net income (loss) . . . . . . . . . . . . . . . . . . . . . . . . . . . . . . 20,294 (25,726) (121,199) (20,661)Net income (loss) attributable to TDS shareholders . . . . . . . . . $ 18,254 $ (22,038) $ (116,030) $ (16,541)Basic weighted average shares outstanding . . . . . . . . . . . . . 108,988 108,719 108,252 107,995
Basic earnings (loss) per share attributable to TDS shareholders . $ 0.17 $ (0.20) $ (1.07) $ (0.15)Diluted weighted average shares outstanding . . . . . . . . . . . . 109,672 108,719 108,252 107,995
Diluted earnings (loss) per share attributable to TDSshareholders . . . . . . . . . . . . . . . . . . . . . . . . . . . . . . . $ 0.16 $ (0.20) $ (1.07) $ (0.15)
Stock price . . . . . . . . . . . . . . . . . . . . . . . . . . . . . . . . . .TDS Common Shares3
High . . . . . . . . . . . . . . . . . . . . . . . . . . . . . . . . . . . $ 27.90 $ 28.41 $ 26.93 $ 26.49Low . . . . . . . . . . . . . . . . . . . . . . . . . . . . . . . . . . . 21.30 24.67 23.08 22.19Close . . . . . . . . . . . . . . . . . . . . . . . . . . . . . . . . . . 26.21 26.11 23.96 25.25
Dividends paid . . . . . . . . . . . . . . . . . . . . . . . . . . . . . . . $ 0.134 $ 0.134 $ 0.134 $ 0.134
1 See Note 6 — Acquisitions, Divestitures and Exchanges for additional information on (Gain) loss on sale of business and other exit costs, net and(Gain) loss on license sales and exchanges.
2 See Note 7 — Intangible Assets for additional information on Loss on impairment of assets.
3 The high, low and closing sales prices as reported by the New York Stock Exchange (‘‘NYSE’’).
112
TELEPHONE AND DATA SYSTEMS, INC. CONSOLIDATED QUARTERLY INFORMATION (UNAUDITED)
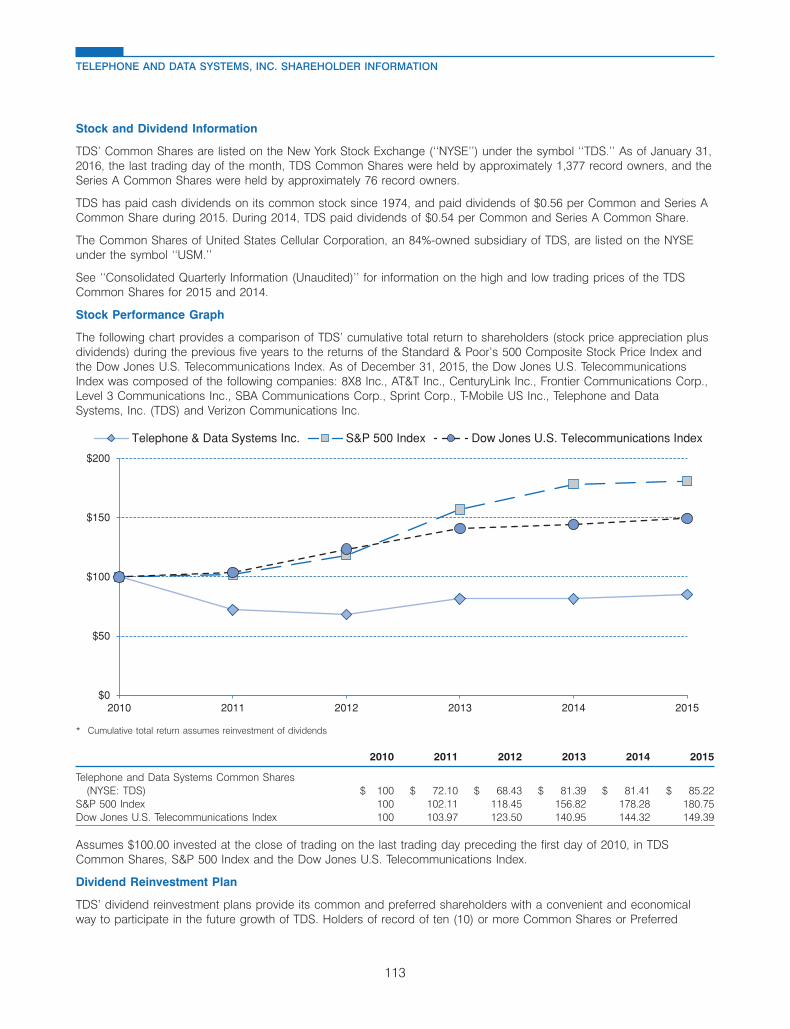
12MAR201601532903
Stock and Dividend Information
TDS’ Common Shares are listed on the New York Stock Exchange (‘‘NYSE’’) under the symbol ‘‘TDS.’’ As of January 31,2016, the last trading day of the month, TDS Common Shares were held by approximately 1,377 record owners, and theSeries A Common Shares were held by approximately 76 record owners.
TDS has paid cash dividends on its common stock since 1974, and paid dividends of $0.56 per Common and Series ACommon Share during 2015. During 2014, TDS paid dividends of $0.54 per Common and Series A Common Share.
The Common Shares of United States Cellular Corporation, an 84%-owned subsidiary of TDS, are listed on the NYSEunder the symbol ‘‘USM.’’
See ‘‘Consolidated Quarterly Information (Unaudited)’’ for information on the high and low trading prices of the TDSCommon Shares for 2015 and 2014.
Stock Performance Graph
The following chart provides a comparison of TDS’ cumulative total return to shareholders (stock price appreciation plusdividends) during the previous five years to the returns of the Standard & Poor’s 500 Composite Stock Price Index andthe Dow Jones U.S. Telecommunications Index. As of December 31, 2015, the Dow Jones U.S. TelecommunicationsIndex was composed of the following companies: 8X8 Inc., AT&T Inc., CenturyLink Inc., Frontier Communications Corp.,Level 3 Communications Inc., SBA Communications Corp., Sprint Corp., T-Mobile US Inc., Telephone and DataSystems, Inc. (TDS) and Verizon Communications Inc.
$0
$50
$100
$150
$200
2010 2011 2012 2013 2014 2015
Telephone & Data Systems Inc. S&P 500 Index Dow Jones U.S. Telecommunications Index
* Cumulative total return assumes reinvestment of dividends
2010 2011 2012 2013 2014 2015
Telephone and Data Systems Common Shares(NYSE: TDS) $ 100 $ 72.10 $ 68.43 $ 81.39 $ 81.41 $ 85.22
S&P 500 Index 100 102.11 118.45 156.82 178.28 180.75Dow Jones U.S. Telecommunications Index 100 103.97 123.50 140.95 144.32 149.39
Assumes $100.00 invested at the close of trading on the last trading day preceding the first day of 2010, in TDSCommon Shares, S&P 500 Index and the Dow Jones U.S. Telecommunications Index.
Dividend Reinvestment Plan
TDS’ dividend reinvestment plans provide its common and preferred shareholders with a convenient and economicalway to participate in the future growth of TDS. Holders of record of ten (10) or more Common Shares or Preferred
113
TELEPHONE AND DATA SYSTEMS, INC. SHAREHOLDER INFORMATION
Shares may purchase Common Shares with their reinvested dividends at a five percent discount from market price.Common Shares may also be purchased, at market price, on a monthly basis through optional cash payments byparticipants in this plan. The initial ten (10) shares cannot be purchased directly from TDS. An authorization card andprospectus will be mailed automatically by the transfer agent to all registered record holders with ten (10) or moreshares. Once enrolled in the plan, there are no brokerage commissions or service charges for purchases made underthe plan.
Investor relations
TDS’ annual report, SEC filings and news releases are available to investors, securities analysts and other members ofthe investment community. These reports are provided, without charge, upon request to our Corporate Office. Investorsmay also access these and other reports through the Investor Relations portion of the TDS website (www.tdsinc.com).
Questions regarding lost, stolen or destroyed certificates, consolidation of accounts, transferring of shares and name oraddress changes should be directed to:
Julie Mathews, Director — Investor RelationsTelephone and Data Systems, Inc.30 North LaSalle Street, Suite 4000Chicago, IL 60602312.592.5341312.630.9299 (fax)[email protected]
General inquiries by investors, securities analysts and other members of the investment community should be directed to:
Jane W. McCahon, Senior Vice President — Corporate Relations and Corporate SecretaryTelephone and Data Systems, Inc.30 North LaSalle Street, Suite 4000Chicago, IL 60602312.592.5379312.630.9299 (fax)[email protected]
Directors and executive officersSee ‘‘Election of Directors’’ and ‘‘Executive Officers’’ sections of the Proxy Statement issued in 2016 for the 2016 AnnualMeeting.
Principal counselSidley Austin LLP, Chicago, Illinois
Transfer agentComputershare Trust Company, N.A.211 Quality Circle, Suite 210College Station, TX 77845877.337.1575
Independent registered public accounting firmPricewaterhouseCoopers LLP
Visit TDS’ web site at www.tdsinc.com
114
TELEPHONE AND DATA SYSTEMS, INC. SHAREHOLDER INFORMATION

Leadership Team Board of Directors
LeRoy T. Carlson, Jr. Chairman – U.S. Cellular President and Chief Executive Officer – Telephone and Data Systems Chairman – Technology Advisory Group
James Barr III Retired President and Chief Executive Officer – TDS Telecom Member – Audit Committee
Steven T. Campbell Executive Vice President – Finance, Chief Financial Officer and Treasurer
Walter C. D. Carlson Chairman of the Board (non-executive) – Telephone and Data Systems Partner – Sidley Austin LLP
J. Samuel Crowley Former Chief Operating Officer – Gold’s Gym International Chairman – Audit Committee Member – Long-Term Incentive Compensation Committee
Ronald E. Daly Former President and Chief Executive Officer – Océ-USA Holding, Inc. Member – Long-Term Incentive Compensation Committee Member – Technology Advisory Group
Paul-Henri Denuit Retired Chief Executive Officer and Chairman – S.A. Coditel Chairman – Long-Term Incentive Compensation Committee Member – Audit Committee
Harry J. Harczak, Jr. Former Executive Vice President – CDW Corporation Member – Audit Committee
Gregory P. Josefowicz Former President, Chairman and Chief Executive Officer – Borders Group Inc. Member – Long-Term Incentive Compensation Committee
Kenneth R. Meyers President and Chief Executive Officer
Peter L. Sereda Senior Vice President – Finance and Treasurer – Telephone and Data Systems
Douglas D. Shuma Chief Accounting Officer – U.S. Cellular Senior Vice President – Finance and Chief Accounting Officer – Telephone and Data Systems
Cecelia D. Stewart Former President of U.S. Consumer and Commercial Banking – Citigroup Inc.Member – Long-Term Incentive Compensation Committee Member – Technology Advisory Group
Kurt B. Thaus Senior Vice President and Chief Information Officer – Telephone and Data Systems
LeRoy T. Carlson Director Emeritus – U.S. Cellular Chairman Emeritus – Telephone and Data Systems
Kenneth R. Meyers President and Chief Executive Officer
Steven T. Campbell Executive Vice President - Finance, Chief Financial Officer and Treasurer
Jay M. Ellison Executive Vice President – Operations
Michael S. Irizarry, Ph.D. Executive Vice President and Chief Technology Officer - Engineering and Information Services
Deirdre C. Drake Senior Vice President – Chief Human Resources Officer
Edward C. Perez Senior Vice President – Sales
Jeffrey W. Baenke Vice President – Technology Development
Rochelle J. Boersma Vice President Sales – Agent Channel
Thomas P. Catani Vice President Sales – Corporate Owned Retail
Nancy E. Fratzke Vice President – Customer Service
John C. Gockley Vice President – Legal and Regulatory Affairs
Jeffrey S. Hoersch Vice President – Financial Planning and Analysis
Denise M. Hutton Vice President – Multi-Channel Strategy and Operations
Eric H. Jagher Vice President Sales – Business Channel
Robert R. Jakubek Vice President – Engineering and Network Operations
Matilde M. Kiser Vice President – Enterprise Portfolio Management
Grant J. Leech Vice President – Brand Management
Kevin R. Lowell Vice President – Information Technology
Kristin A. MacCarthy Vice President and Controller
Narothum Saxena Vice President – Advanced Technology and Systems Planning
Joseph L. Settimi Vice President – Marketing
Catherine M. Shackleford Vice President – Supply Chain
Grant B. Spellmeyer Vice President – Federal Affairs and Public Policy
Thomas S. Weber Vice President – Financial and Real Estate Services
Stephen P. Fitzell General Counsel and Assistant Secretary

United States Cellular Corporation 8410 West Bryn Mawr Avenue Chicago, IL 60631 Phone: 773-399-8900 uscellular.com