usd 340 jefferson west - kansas state department of …ksde.org/portals/0/school...
TRANSCRIPT

USD 340 Jefferson West

USD 340 JEFFERSON WEST 08.13.07
Document Index 1 Budget Facts 2-3 Budget Profile 4-9 USD 340 Form 150, General Fund 10-13 USD 340 Form 155, Supplemental Fund 14-15 Public Notice 16 Summary Material 17-35

2007-2008 Budget General Information USD #340 Jefferson West, PO Box 267, 601 E Wyandotte, Meriden, KS 66512; (785)484-3444
Mission Statement
Each Student Will Be Prepared To Meet Life’s Challenges as a Productive Member of Society.
Introduction
About Jefferson West
The Jefferson West School District has approximately 950 students attending the four facilities in the District. The District covers 68 square miles in three counties: Jefferson, Jackson, and Shawnee. The Elementary School, a Kansas Academic School of Excellence, which includes grades kindergarten through third, is located in Meriden, Kansas, with an enrollment of approximately 250 students. The Intermediate School, also a Kansas Academic School of Excellence, includes grades four and five, is located in Ozawkie, Kansas, with an enrollment of approximately 150 students. The Middle School, also a Kansas Academic School of Excellence, is located in Meriden, Kansas, with approximately 200 students in grades six through eight. Jefferson West High School, also a Kansas Academic School of Excellence, is located in Meriden, Kansas, with an enrollment of approximately 350 students in grades nine through twelve. Patrons passed a bond issue in November, 1994 to construct a new high school at a cost of $5.7 million. Seventy percent of the voters approved this new 83,500 square foot high school that opened in August of 1996.
Our Dedication to Excellence Jefferson West School District strives to maintain the advantages of a small rural way of life within its schools. Small class size, dedicated personnel, personalized instruction, and strong school-community relations are maintained. Jefferson West provides, through the Northeast Kansas Education Service Center, a comprehensive and complete program of Special Education. Jefferson West High School is accredited by the North Central Association of Colleges and Schools and by the State of Kansas. The Elementary, Intermediate, and Middle Schools are also accredited by the State of Kansas and have joined the North Central Association. In cooperation wit Kaw Area Technical School, the Jefferson West School District provides a comprehensive vocational and technical program for high school students grades eleven and twelve. Jefferson West also provides dual credit college hours through Highland Community College for qualifying students as well as Advanced Placement courses. Along with many clubs and student organizations, Jefferson West also offers a Fine Arts program that includes Band, Vocal Music, Art and Drama opportunities for students.

The Staff The Jefferson West School District has approximately 145 certified and classified employees working with our students. Small class sizes are maintained in order to provide the best possible climate for learning. Attracting and retaining top quality staff has been an established priority of the District Athletics The Jefferson West School District has a competitive athletic program for both boys and girls in grades seven through twelve that includes: Football, Volleyball, Cross Country, Basketball, Wrestling, Baseball, Softball, Track & Field, and Golf. Community Support The Jefferson West Booster Club actively supports students and programs for all grade levels. The Board of Education encourages support from the Booster Club, local businesses, civic organizations, and the Chamber of Commerce for District programs. Parent and Patron volunteers work closely with teachers at all grade levels. This partnership with the community and the parents is essential if students are to reach their fullest potential. The Governing Body The Jefferson West School Board of Education is comprised of seven members with the philosophy that all students shall have an equal opportunity in the pursuit of knowledge. The Board views the Education process as a Partnership between Parents, Students, Schools, and Community.
The members of the Board of Education and the districts of election are:
Mr. Blaine Moore, President: Position Number 1 Dr. Jeff VanPetten, Vice President: Position Number 3
Mrs. Dreanna McClurg: Position Number 2 Mr. Dave Jolly: Position Number 4
Dr. G. Daniel Harden: Position Number 5 Mrs. Sandra Mumaw: Position Number 6
Mrs. Shannon McMahon: Position At Large
Duties The Board of Education consists of seven members elected by the voters of the school district for staggered 4-year terms. Its major responsibility is to determine and interpret the educational needs of the community and to harmonize any differences of opinion relative to formulation of policies and the best evidence available. Meetings All meetings of the Board are open to the public and are regularly held on the second Monday of each month at 7:00 pm at the Central Office, 601 E Wyandotte, Meriden, KS. The Board may schedule special meetings at other times, generally for special or emergency issues that may arise from time to time in the life of the school district. These are limited to agenda items included in the meeting notice or as provided by law. If you have any questions or request for the Board and cannot attend the meeting, you my write to: Board of Education, c/o Clerk of the Board; 601 E. Wyandotte, Meriden, Kansas, 66512 or call (785)484-3444.

Key Staff Superintendent: Scott Myers Director of Curriculum & Instruction: Mary C. Getto Central Office Staff: Amy Adam-Mitchell, Board Clerk/Payroll; Marcia Ricklefs, Treasurer/Accounts Payable; Dayna Heineken, Student Data Clerk/Receptionist Building Principals: Ed West, High School; John Hamon, Middle School; Pat Happer, Elementary and Intermediate Schools Other Key Contacts: Harley Lohness, Assistant Principal/High School; Rhonda Frakes, Athletic Director; John Riley, Technology; Rose Herring, Food Service; Jim Malloy, Maintenance; Ron Christlieb, Transportation For District E-mail: [email protected]
The District’s Accomplishments and Challenges Accomplishments USD 340 continues to make great gains in student achievement. Students scoring in the Exemplary categories are increasing in both math and reading. There are an ever-increasing number of students at the high school level taking part in our Advanced Placement curriculum, and these students are performing admirably in these classes. Along with this development, we have been able to strengthen our vocational programming, so that students are coming out of our district ready for the worlds of academics or work. In recent years, full-day kindergarten was implemented, and the results of this program have been substantial. By providing a more thorough examination of the academic materials, our students are entering first grade as beginning readers and are transitioning to the place of “reading to learn” rather than staying at the “learning to read” stage. As well as focusing on our younger students, the district operates a drop-out recovery program. Open six hours a day, the program is designed to serve the need of adult learners who are interested in completing their high school work, thus providing them with greater opportunities in society. Challenges Continued declining enrollment will definitely pose a challenge to Jefferson West. Small class sizes are pivotal to the success that takes place in our district; however, if our current decline continues, our staffing will need to be examined. Ever increasing health care costs also pose a challenge for the district each year. It is simply more expensive to provide this important benefit to our staff.

Supplemental Information for the Following Tables 1. Summary of Total Expenditures by Function (All Funds) 2. Summary of General Fund Expenditures by Function 3. Summary of Supplemental General Fund Expenditures by Function 4. Summary of General and Supplemental General Fund Expenditures by Function 5. Summary of Special Education Fund by Function 6. Instructional Expenditures (1000) 7. Student and Instructional Support Expenditures (2100 & 2200) 8. General Administration Expenditures (2300) 9. School Administration Expenditures (2400) 10. Operations and Maintenance Expenditures (2600) 11. Other Costs (2500 & 2900: Other Supplemental Services) (3000: Non-Instruction Services) 12. Capital Improvements (4000) 13. Debt Services (5000) 14. Miscellaneous Information Unencumbered Cash Balance by Fund 15. Reserve Funds Unencumbered Cash Balance 16. Other Information - FTE 17. Miscellaneous Information Mill Rates by Fund 18. Other Information – Assessed Valuation and Bonded Indebtedness Note: The FTE (full time equivalency) used in this report to calculate the “Amount Per Pupil” is defined as following: Enrollment (FTE) includes the enrollment of the district used for state aid and budget authority, and all other preschool enrollment and kindergarten students attending full time.

KSDE Website Information Available K-12 Statistics (Building, District or State Totals) http://www.ksde.org/Default.aspx?tabid=223
• Attendance / Enrollment Reports • Staff Reports • Graduates / Dropouts Reports • Crime / Violence Reports
School Finance Reports and Publications http://www.ksde.org/Default.aspx?tabid=1870
• Certified Personnel • Enrollment • Dropouts • Graduates • Salary Reports
Kansas Building Report Card http://www.ksde.org/Default.aspx?tabid=229
• Attendance Rate • Graduation Rate • Dropout Rate • School Violence • Assessments
o Reading o Mathematics o Writing
• Graduates Passing Adv. Science Courses • Graduates Passing Adv. Math Courses

USD# 340
Summary of Total Expenditures By Function(All Funds)
% % % % %2005-2006 of 2006-2007 of inc/ 2007-2008 of inc/
Actual Tot Actual Tot dec Budget Tot dec
Instruction 5,494,183 58% 5,728,022 59% 4% 6,408,204 56% 12%
Student & Instructional Support 491,785 5% 557,538 6% 13% 631,388 6% 13%
General Administration 290,952 3% 276,044 3% -5% 292,624 3% 6%
School Administration (Building) 517,730 5% 603,567 6% 17% 610,589 5% 1%
Operations & Maintenance 1,022,871 11% 1,054,289 11% 3% 1,214,367 11% 15%
Capital Improvements 57,803 1% 34,110 0% -41% 615,000 5% 1703%
Debt Services 593,016 6% 610,060 6% 3% 619,720 5% 2%
Other Costs 961,274 10% 905,723 9% -6% 1,015,699 9% 12%
Total Expenditures 9,429,614 100% 9,769,353 100% 4% 11,407,591 100% 17%
Amount per Pupil $10,069 $10,642 6% $12,746 20%
Note: Percentages on charts are within +-1% due to rounding used. Pie graph percentages may differ from charts for this reason also.
Further definition of what goes into each category:Instruction - 1000 Operations & Maintenance - 2600Student & Instructional Support - 2100 & 2200 Other Costs - 2500, 2900 and 3000 and all others not included elsewhereGeneral Administration - 2300 Capital Improvements - 4000School Administration (Building) - 2400 Debt Services - 5100 Transfers - 5200
The funds that are included in the categories above are: General, Supplemental General, Bilingual Education, At Risk(4yr Old), At Risk(K-12), Capital Outlay, Driver Education, Extraordinary School Program, Summer School, Special Education, Vocational Education, Professional Development, Bond & Interest #1, Bond & Interest #2, No-Fund Warrant, Special Assessment, Parent Education, School Retirement, Student Materials Revolving & Textbook Rental, Tuition Reimbursement, Gifts/Grants, KPERS Special Retirement Contribution, Contingency, Special Liability Expense, Federal Funds, Adult Education, Adult Supplemental Education, Area Vocational Education, and Special Education Coop.
Summary of Total Expenditures By Function (All Funds)
0
1,000,000
2,000,000
3,000,000
4,000,000
5,000,000
6,000,000
7,000,000
Instruction Student &Instructional
Support
GeneralAdministration
SchoolAdministration
(Building)
Operations &Maintenance
CapitalImprovements
Debt Services Other Costs
2005-20062006-20072007-2008
2007-2008 Summary of Total Expenditures By Function (All Funds)
Instruction56%
Capital Improvements5%
Debt Services5%
Other Costs9%
Operations & Maintenance11%
School Administration (Building)5%
General Administration3% Student & Instructional Support
6%
InstructionStudent & Instructional SupportGeneral AdministrationSchool Administration (Building)Operations & MaintenanceCapital ImprovementsDebt ServicesOther Costs
9/24/2007 11:48 AM Sumexpen.xls Page 1 of 19

USD# 340
Summary of General Expendituresby Function
% % % % %2005-2006 of 2006-2007 of inc/ 2007-2008 of inc/
Actual Tot Actual Tot dec Budget Tot dec
Instruction 3,767,045 70% 3,741,470 69% -1% 3,874,926 69% 4%
Student & Instructional Support 329,092 6% 400,459 7% 22% 377,974 7% -6%
General Administration 216,822 4% 208,129 4% -4% 230,056 4% 11%
School Administration (Building) 472,154 9% 553,899 10% 17% 550,807 10% -1%
Operations & Maintenance 522,636 10% 469,693 9% -10% 512,877 9% 9%
Capital Improvements 0 0% 0 0% 0% 0 0% 0%
Other Costs 67,279 1% 75,413 1% 12% 78,750 1% 4%
Total Expenditures 5,375,028 100% 5,449,063 100% 1% 5,625,390 100% 3%
Amount per Pupil $5,739 $5,936 3% $6,285 6%
The Summary of General Fund Expenditures chart information comes from pages 6-13 and only uses the 'General Fund' line items.
Summary of General Fund Expendituresby Function
0
500,000
1,000,000
1,500,000
2,000,000
2,500,000
3,000,000
3,500,000
4,000,000
4,500,000
Instruction Student &Instructional
Support
GeneralAdministration
SchoolAdministration
(Building)
Operations &Maintenance
CapitalImprovements
Other Costs
2005-20062006-20072007-2008
2007-2008 Summary of General Fund Expendituresby Function
Instruction69%
Student & Instructional Support
7%
General Administration4%
School Administration (Building)
10%
Operations & Maintenance9%
Other Costs1%
InstructionStudent & Instructional SupportGeneral AdministrationSchool Administration (Building)Operations & MaintenanceCapital ImprovementsOther Costs
9/24/2007 11:48 AM Sumexpen.xls Page 2 of 19

USD# 340
Summary of Supplemental General Fund Expendituresby Function
% % % % %2005-2006 of 2006-2007 of inc/ 2007-2008 of inc/
Actual Tot Actual Tot dec Budget Tot dec
Instruction 278,137 25% 263,135 23% -5% 254,126 21% -3%
Student & Instructional Support 42,540 4% 45,091 4% 6% 46,200 4% 2%
General Administration 63,997 6% 56,095 5% -12% 48,213 4% -14%
School Administration (Building) 30,377 3% 31,941 3% 5% 38,250 3% 20%
Operations & Maintenance 375,499 34% 429,829 38% 14% 492,780 41% 15%
Capital Improvements 0 0% 0 0% 0% 0 0% 0%
Other Costs 322,815 29% 317,890 28% -2% 313,535 26% -1%
Total Expenditures 1,113,365 100% 1,143,981 100% 3% 1,193,104 100% 4%
Amount per Pupil $1,189 $1,246 5% $1,333 7%
The Summary of Supplemental General Fund Expenditures chart information comes from pages 6-13 and only uses the 'Supplemental General Fund' line items.
2007-2008 Summary of Supplemental General Fund Expendituresby Function
Instruction21%
Student & InstructionalSupport
4%
General Administration4%
School Administration (Building)
3%Operations & Maintenance42%
Other Costs26%
InstructionStudent & Instructional SupportGeneral AdministrationSchool Administration (Building)Operations & MaintenanceCapital ImprovementsOther Costs
Summary of Supplemental General Fund Expendituresby Function
0
100,000
200,000
300,000
400,000
500,000
600,000
Instruction Student &Instructional
Support
GeneralAdministration
SchoolAdministration
(Building)
Operations &Maintenance
CapitalImprovements
Other Costs
2005-20062006-20072007-2008
9/24/2007 11:48 AM Sumexpen.xls Page 3 of 19

USD# 340Summary of General and Supplemental General Fund
Expenditures by Function
% % % % %2005-2006 of 2006-2007 of inc/ 2007-2008 of inc/
Actual Tot Actual Tot dec Budget Tot dec
Instruction 4,045,182 62% 4,004,605 61% -1% 4,129,052 61% 3%
Student & Instructional Support 371,632 6% 445,550 7% 20% 424,174 6% -5%
General Administration 280,819 4% 264,224 4% -6% 278,269 4% 5%
School Administration (Building) 502,531 8% 585,840 9% 17% 589,057 9% 1%
Operations & Maintenance 898,135 14% 899,522 14% 0% 1,005,657 15% 12%
Capital Improvements 0 0% 0 0% 0% 0 0% 0%
Other Costs 390,094 6% 393,303 6% 1% 392,285 6% 0%
Total Expenditures 6,488,393 100% 6,593,044 100% 2% 6,818,494 100% 3%
Amount per Pupil $6,928 $7,182 4% $7,618 6%
The Summary of General and Supplemental General Fund Expenditures chart information comes from pages 6-13 and adds togetherthe 'General Fund' and 'Supplemental General Fund' line items.
Summary of General and Supplemental General Fund Expenditures by Function
0
500,000
1,000,000
1,500,000
2,000,000
2,500,000
3,000,000
3,500,000
4,000,000
4,500,000
Instruction Student &Instructional
Support
GeneralAdministration
SchoolAdministration
(Building)
Operations &Maintenance
CapitalImprovements
Other Costs
2005-20062006-20072007-2008
2006-2007 Summary of General and Supplemental General Fund Expenditures by Function
Instruction60%
Student & Instructional Support
6%
General Administration4%
School Administration (Building)
9%
Operations & Maintenance15%
Other Costs6%
InstructionStudent & Instructional SupportGeneral AdministrationSchool Administration (Building)Operations & MaintenanceCapital ImprovementsOther Costs
9/24/2007 11:48 AM Sumexpen.xls Page 4 of 19

USD# 340
Summary of Special Education Fundby Function
% % % % %2005-2006 of 2006-2007 of inc/ 2007-2008 of inc/
Actual Tot Actual Tot dec Budget Tot dec
Instruction 844,727 97% 956,952 97% 13% 1,247,186 94% 30%
Student & Instructional Support 0 0% 0 0% 0% 0 0% 0%
General Administration 0 0% 0 0% 0% 0 0% 0%
School Administration (Building) 0 0% 0 0% 0% 0 0% 0%
Operations & Maintenance 0 0% 0 0% 0% 0 0% 0%
Capital Improvements 0 0% 0 0% 0% 0 0% 0%
Other Costs 26,915 3% 27,262 3% 1% 73,750 6% 171%
Total Expenditures 871,642 100% 984,214 100% 13% 1,320,936 100% 34%
Amount per Pupil $931 $1,072 15% $1,476 38%
The Summary of Special Education Fund Expenditures chart information comes from pages 6-13 and only uses the 'Special Education Fund'line items. (Total expenditures excludes Special Ed Coop Fund because it would include expenditures for all schools participating in the Coop.)
Summary of Special Education Fund Expendituresby Function
0
200,000
400,000
600,000
800,000
1,000,000
1,200,000
1,400,000
Instruction Student &Instructional
Support
GeneralAdministration
SchoolAdministration
(Building)
Operations &Maintenance
CapitalImprovements
Other Costs
2005-20062006-20072007-2008
2007-2008 Summary of Special Education Fundby Function
Instruction94%
Other Costs6%
InstructionStudent & Instructional SupportGeneral AdministrationSchool Administration (Building)Operations & MaintenanceCapital ImprovementsOther Costs
9/24/2007 11:48 AM Sumexpen.xls Page 5 of 19

USD# 340Instruction Expenditures (1000)
% %2005-2006 2006-2007 inc/ 2007-2008 inc/
Actual Actual dec Budget dec
General 3,767,045 3,741,470 -1% 3,874,926 4%Federal Funds 74,221 71,015 -4% 76,184 7%Supplemental General 278,137 263,135 -5% 254,126 -3%At Risk (4yr Old) 0 0 0% 0 0%At Risk (K-12) 59,989 144,326 141% 327,990 127%Bilingual Education 0 0 0% 0 0%Capital Outlay 146,202 168,879 16% 194,936 15%Driver Education 5,044 5,761 14% 19,122 232%Declining Enrollment 0 0 0% 0 0%Extraordinary School Program 0 0 0% 0 0%Food Service 0 0 0% 0 0%Professional Development 0 0 0% 0 0%Parent Education Program 0 0 0% 0 0%Summer School 3,051 0 -100% 0 0%Special Education 844,727 956,952 13% 1,247,186 30%Cost of Living 0 0 0%Vocational Education 102,695 138,581 35% 141,419 2%Gifts/Grants 0 248 0% 0 -100%Special Liability 0 0 0% 0 0%School Retirement 0 0 0% 0 0%Extraordinary Growth Facilities 0 0 0% 0 0%Special Reserve 0 0 0%KPERS Spec. Ret. Contribution 185,283 215,704 16% 272,315 26%Contingency Reserve 0 0 0%Text Book & Student Material 27,789 21,951 -21%Bond & Interest #1 0 0 0% 0 0%Bond & Interest #2 0 0 0% 0 0%No-Fund Warrant 0 0 0% 0 0%Special Assessment 0 0 0% 0 0%Temporary Note 0 0 0% 0 0%
SUBTOTAL 5,494,183 5,728,022 4% 6,408,204 12%Enrollment (FTE)* 936.5 918.0 -2% 895.0 -3%Amount per Pupil 5,867 6,240 6% 7,160 15%
Adult Education 0 0 0% 0 0%Adult Supplemental Education 0 0 0% 0 0%Area Vocational School 0 0 0% 0 0%Tuition Reimbursement 0 0 0% 0 0%Special Education Coop 0 0 0% 0 0%TOTAL 5,494,183 5,728,022 4% 6,408,204 12%
NOTE: Gifts/Grants includes private grants and grants from nonfederal sources.
Amount per pupil excludes the following funds: Area Vocational School, Adult Education, Adult Supplemental Education,Special Education Coop and Tuition Reimbursement.
*Enrollment (FTE) includes the enrollment of the district used for state aid and budget authority, and all other preschool enrollmentand kindergarten students attending full time.
Instruction Expenditures
0
1,000,000
2,000,000
3,000,000
4,000,000
5,000,000
6,000,000
7,000,000
2005-2006 2006-2007 2007-2008
Instruction Expenditures
0500,000
1,000,0001,500,0002,000,0002,500,0003,000,0003,500,0004,000,0004,500,000
2005-2006 2006-2007 2007-2008
General Supplemental GeneralSpecial Education
9/24/2007 11:48 AM Sumexpen.xls Page 6 of 19

USD# 340
Student and Instructional Support Expenditures (2100 & 2200)
% %2005-2006 2006-2007 inc/ 2007-2008 inc/
Actual Actual dec Budget dec
General 329,092 400,459 22% 377,974 -6%Federal Funds 0 0 0% 0 0%Supplemental General 42,540 45,091 6% 46,200 2%At Risk (4yr Old) 0 0 0% 0 0%At Risk (K-12) 54,823 55,903 2% 102,108 83%Bilingual Education 0 0 0% 0 0%Capital Outlay 0 0 0% 25,000 0%Driver Training 0 0 0% 0 0%Declining Enrollment 0 0 0% 0 0%Extraordinary School Program 0 0 0% 0 0%Food Service 0 0 0% 0 0%Professional Development 12,926 8,700 -33% 21,766 150%Parent Education Program 10,500 10,500 0% 10,500 0%Summer School 0 0 0% 0 0%Special Education 0 0 0% 0 0%Cost of Living 0 0 0%Vocational Education 125 0 -100% 0 0%Gifts/Grants 6,205 2,909 -53% 29,897 928%Special Liability 0 0 0% 0 0%School Retirement 0 0 0% 0 0%Extraordinary Growth Facilities 0 0 0% 0 0%Special Reserve 0 0 0%KPERS Spec. Ret. Contribution 12,666 14,773 17% 17,943 21%Contingency Reserve 0 0 0%Text Book & Student Material 22,908 19,203 -16%Bond & Interest #1 0 0 0% 0 0%Bond & Interest #2 0 0 0% 0 0%No-Fund Warrant 0 0 0% 0 0%Special Assessment 0 0 0% 0 0%Temporary Note 0 0 0% 0 0%
SUBTOTAL 491,785 557,538 13% 631,388 13%Enrollment (FTE)* 936.5 918.0 -2% 895.0 -3%Amount per Pupil 525 607 16% 705 16%
Adult Education 0 0 0% 0 0%Adult Supplemental Education 0 0 0% 0 0%Area Vocational School 0 0 0% 0 0%Tuition Reimbursement 0 0 0% 0 0%Special Education Coop 0 0 0% 0 0%TOTAL 491,785 557,538 13% 631,388 13%Amount per Pupil $525 $607 16% $705 16%
NOTE: Gifts/Grants includes private grants and grants from nonfederal sources.
Amount per pupil excludes the following funds: Area Vocational School, Adult Education, Adult Supplemental Education,Special Education Coop and Tuition Reimbursement.
*Enrollment (FTE) includes the enrollment of the district used for state aid and budget authority, and all other preschool enrollmentand kindergarten students attending full time.
Student and Instructional Support Expenditures
0
100,000
200,000
300,000
400,000
500,000
600,000
700,000
2005-2006 2006-2007 2007-2008
9/24/2007 11:48 AM Sumexpen.xls Page 7 of 19

USD# 340
General Administration Expenditures (2300)
% %2005-2006 2006-2007 inc/ 2007-2008 inc/
Actual Actual dec Budget dec
General 216,822 208,129 -4% 230,056 11%Federal Funds 0 0 0% 0 0%Supplemental General 63,997 56,095 -12% 48,213 -14%At Risk (4yr Old) 0 0 0% 0 0%At Risk (K-12) 0 0 0% 0 0%Bilingual Education 0 0 0% 0 0%Capital Outlay 0 0 0% 0 0%Driver Training 0 0 0% 0 0%Declining Enrollment 0 0 0% 0 0%Extraordinary School Program 0 0 0% 0 0%Food Service 0 0 0% 0 0%Professional Development 0 0 0% 0 0%Parent Education Program 0 0 0% 0 0%Summer School 0 0 0% 0 0%Special Education 0 0 0% 0 0%Cost of Living 0 0 0%Vocational Education 0 0 0% 0 0%Gifts/Grants 0 0 0% 0 0%Special Liability Expense 0 0 0% 0 0%School Retirement 0 0 0% 0 0%Extraordinary Growth Facilities 0 0 0% 0 0%Special Reserve 0 0 0%KPERS Spec. Ret. Contribution 10,133 11,820 17% 14,355 21%Contingency Reserve 0 0 0%Text Book & Student Material 0 0 0%Bond & Interest #1 0 0 0% 0 0%Bond & Interest #2 0 0 0% 0 0%No-Fund Warrant 0 0 0% 0 0%Special Assessment 0 0 0% 0 0%Temporary Note 0 0 0% 0 0%
SUBTOTAL 290,952 276,044 -5% 292,624 6%Enrollment (FTE)* 936.5 918.0 -2% 895.0 -3%Amount per Pupil 311 301 -3% 327 9%
Adult Education 0 0 0% 0 0%Adult Supplemental Education 0 0 0% 0 0%Area Vocational School 0 0 0% 0 0%Tuition Reimbursement 0 0 0% 0 0%Special Education Coop 0 0 0% 0 0%TOTAL 290,952 276,044 -5% 292,624 6%
NOTE: Gifts/Grants includes private grants and grants from nonfederal sources.
Amount per pupil excludes the following funds: Area Vocational School, Adult Education, Adult Supplemental Education,Special Education Coop and Tuition Reimbursement.
*Enrollment (FTE) includes the enrollment of the district used for state aid and budget authority, and all other preschool enrollmentand kindergarten students attending full time.
General Administration Expenditures
0
50,000
100,000
150,000
200,000
250,000
300,000
350,000
2005-2006 2006-2007 2007-2008
9/24/2007 11:48 AM Sumexpen.xls Page 8 of 19

USD# 340
School Administration Expenditures (2400)
% %2005-2006 2006-2007 inc/ 2007-2008 inc/
Actual Actual dec Budget dec
General 472,154 553,899 17% 550,807 -1%Federal Funds 0 0 0% 0 0%Supplemental General 30,377 31,941 5% 38,250 20%At Risk (4yr Old) 0 0 0% 0 0%At Risk (K-12) 0 0 0% 0 0%Bilingual Education 0 0 0% 0 0%Capital Outlay 0 0 0% 0 0%Driver Training 0 0 0% 0 0%Declining Enrollment 0 0 0% 0 0%Extraordinary School Program 0 0 0% 0 0%Food Service 0 0 0% 0 0%Professional Development 0 0 0% 0 0%Parent Education Program 0 0 0% 0 0%Summer School 0 0 0% 0 0%Special Education 0 0 0% 0 0%Cost of Living 0 0 0%Vocational Education 0 0 0% 0 0%Gifts/Grants 0 0 0% 0 0%Special Liability Expense 0 0 0% 0 0%School Retirement 0 0 0% 0 0%Extraordinary Growth Facilities 0 0 0% 0 0%Special Reserve 0 0 0%KPERS Spec. Ret. Contribution 15,199 17,727 17% 21,532 21%Contingency Reserve 0 0 0%Text Book & Student Material 0 0 0%Bond & Interest #1 0 0 0% 0 0%Bond & Interest #2 0 0 0% 0 0%No-Fund Warrant 0 0 0% 0 0%Special Assessment 0 0 0% 0 0%Temporary Note 0 0 0% 0 0%
SUBTOTAL 517,730 603,567 17% 610,589 1%Enrollment (FTE)* 936.5 918.0 -2% 895.0 -3%Amount per Pupil 553 657 19% 682 4%
Adult Education 0 0 0% 0 0%Adult Supplemental Education 0 0 0% 0 0%Area Vocational School 0 0 0% 0 0%Tuition Reimbursement 0 0 0% 0 0%Special Education Coop 0 0 0% 0 0%TOTAL 517,730 603,567 17% 610,589 1%
NOTE: Gifts/Grants includes private grants and grants from nonfederal sources.
Amount per pupil excludes the following funds: Area Vocational School, Adult Education, Adult Supplemental Education,Special Education Coop and Tuition Reimbursement.
*Enrollment (FTE) includes the enrollment of the district used for state aid and budget authority, and all other preschool enrollmentand kindergarten students attending full time.
School Administration Expenditures
0
100,000
200,000
300,000
400,000
500,000
600,000
700,000
2005-2006 2006-2007 2007-2008
9/24/2007 11:48 AM Sumexpen.xls Page 9 of 19

USD# 340
Operations and Maintenance Expenditures (2600)
% %2005-2006 2006-2007 inc/ 2007-2008 inc/
Actual Actual dec Budget dec
General 522,636 469,693 -10% 512,877 9%Federal Funds 0 0 0% 0 0%Supplemental General 375,499 429,829 14% 492,780 15%At Risk (4yr Old) 0 0 0% 0 0%At Risk (K-12) 0 0 0% 0 0%Bilingual Education 0 0 0% 0 0%Capital Outlay 65,509 109,546 67% 150,000 37%Driver Training 2,712 2,562 -6% 6,500 154%Declining Enrollment 0 0 0% 0 0%Extraordinary School Program 0 0 0% 0 0%Food Service 21,249 19,026 -10% 23,500 24%Professional Development 0 0 0% 0 0%Parent Education Program 0 0 0% 0 0%Summer School 0 0 0% 0 0%Special Education 0 0 0% 0 0%Cost of Living 0 0 0%Vocational Education 0 0 0% 0 0%Gifts/Grants 15,000 0 -100% 0 0%Special Liability 0 0 0% 0 0%School Retirement 0 0 0% 0 0%Extraordinary Growth Facilities 0 0 0% 0 0%Special Reserve 0 0 0%KPERS Spec. Ret. Contribution 20,266 23,633 17% 28,710 21%Contingency Reserve 0 0 0%Text Book & Student Material 0 0 0%Bond & Interest #1 0 0 0% 0 0%Bond & Interest #2 0 0 0% 0 0%No-Fund Warrant 0 0 0% 0 0%Special Assessment 0 0 0% 0 0%Temporary Note 0 0 0% 0 0%
SUBTOTAL 1,022,871 1,054,289 3% 1,214,367 15%Enrollment (FTE)* 936.5 918.0 -2% 895.0 -3%Amount per Pupil 1,092 1,148 5% 1,357 18%
Adult Education 0 0 0% 0 0%Adult Supplemental Education 0 0 0% 0 0%Area Vocational School 0 0 0% 0 0%Tuition Reimbursement 0 0 0% 0 0%Special Education Coop 0 0 0% 0 0%TOTAL 1,022,871 1,054,289 3% 1,214,367 15%
NOTE: Gifts/Grants includes private grants and grants from nonfederal sources.
Amount per pupil excludes the following funds: Area Vocational School, Adult Education, Adult Supplemental Education,Special Education Coop and Tuition Reimbursement.
*Enrollment (FTE) includes the enrollment of the district used for state aid and budget authority, and all other preschool enrollmentand kindergarten students attending full time.
Operations and Maintenance Expenditures
0
200,000
400,000
600,000
800,000
1,000,000
1,200,000
1,400,000
2005-2006 2006-2007 2007-2008
9/24/2007 11:48 AM Sumexpen.xls Page 10 of 19
USD# 340
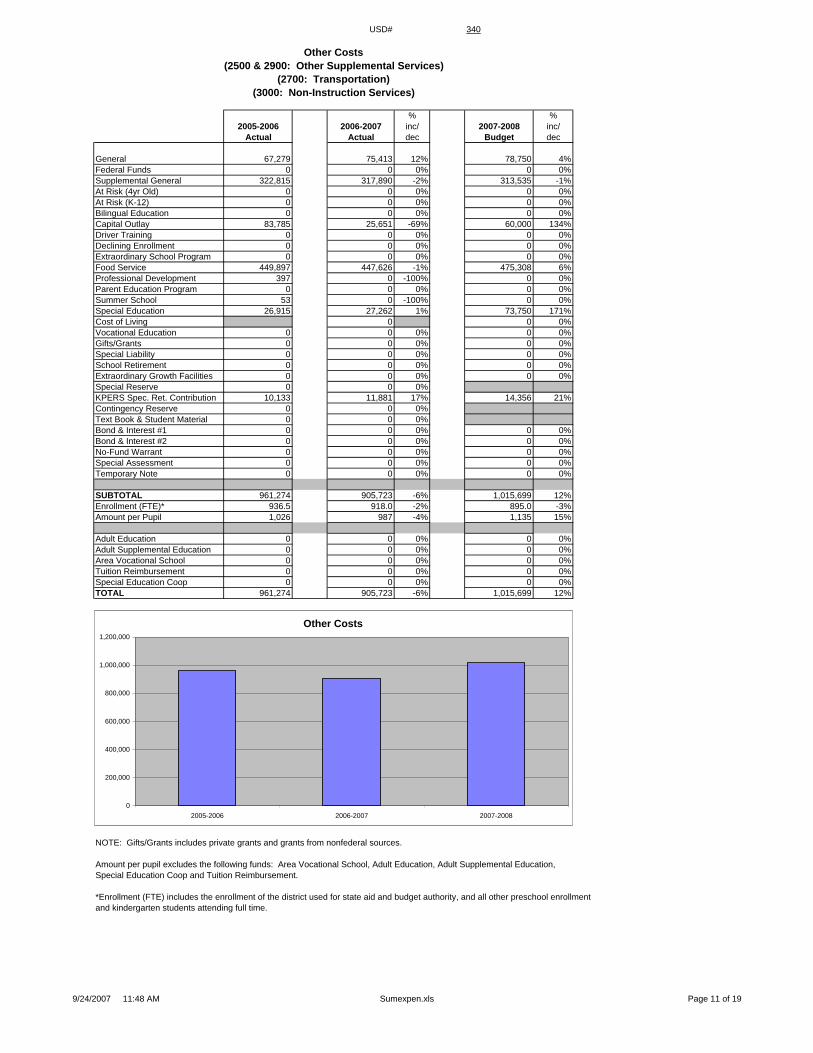
Other Costs(2500 & 2900: Other Supplemental Services)
(2700: Transportation)(3000: Non-Instruction Services)
% %2005-2006 2006-2007 inc/ 2007-2008 inc/
Actual Actual dec Budget dec
General 67,279 75,413 12% 78,750 4%Federal Funds 0 0 0% 0 0%Supplemental General 322,815 317,890 -2% 313,535 -1%At Risk (4yr Old) 0 0 0% 0 0%At Risk (K-12) 0 0 0% 0 0%Bilingual Education 0 0 0% 0 0%Capital Outlay 83,785 25,651 -69% 60,000 134%Driver Training 0 0 0% 0 0%Declining Enrollment 0 0 0% 0 0%Extraordinary School Program 0 0 0% 0 0%Food Service 449,897 447,626 -1% 475,308 6%Professional Development 397 0 -100% 0 0%Parent Education Program 0 0 0% 0 0%Summer School 53 0 -100% 0 0%Special Education 26,915 27,262 1% 73,750 171%Cost of Living 0 0 0%Vocational Education 0 0 0% 0 0%Gifts/Grants 0 0 0% 0 0%Special Liability 0 0 0% 0 0%School Retirement 0 0 0% 0 0%Extraordinary Growth Facilities 0 0 0% 0 0%Special Reserve 0 0 0%KPERS Spec. Ret. Contribution 10,133 11,881 17% 14,356 21%Contingency Reserve 0 0 0%Text Book & Student Material 0 0 0%Bond & Interest #1 0 0 0% 0 0%Bond & Interest #2 0 0 0% 0 0%No-Fund Warrant 0 0 0% 0 0%Special Assessment 0 0 0% 0 0%Temporary Note 0 0 0% 0 0%
SUBTOTAL 961,274 905,723 -6% 1,015,699 12%Enrollment (FTE)* 936.5 918.0 -2% 895.0 -3%Amount per Pupil 1,026 987 -4% 1,135 15%
Adult Education 0 0 0% 0 0%Adult Supplemental Education 0 0 0% 0 0%Area Vocational School 0 0 0% 0 0%Tuition Reimbursement 0 0 0% 0 0%Special Education Coop 0 0 0% 0 0%TOTAL 961,274 905,723 -6% 1,015,699 12%
NOTE: Gifts/Grants includes private grants and grants from nonfederal sources.
Amount per pupil excludes the following funds: Area Vocational School, Adult Education, Adult Supplemental Education,Special Education Coop and Tuition Reimbursement.
*Enrollment (FTE) includes the enrollment of the district used for state aid and budget authority, and all other preschool enrollmentand kindergarten students attending full time.
Other Costs
0
200,000
400,000
600,000
800,000
1,000,000
1,200,000
2005-2006 2006-2007 2007-2008
9/24/2007 11:48 AM Sumexpen.xls Page 11 of 19

USD# 340
Capital Improvements Expenditures (4000)
% %2005-2006 2006-2007 inc/ 2007-2008 inc/
Actual Actual dec Budget dec
General 0 0 0% 0 0%Federal Funds 0 0 0% 0 0%Supplemental General 0 0 0% 0 0%At Risk (4yr Old) 0 0 0% 0 0%At Risk (K-12) 0 0 0% 0 0%Bilingual Education 0 0 0% 0 0%Capital Outlay 57,803 34,110 -41% 615,000 1703%Driver Training 0 0 0% 0 0%Declining Enrollment 0 0 0% 0 0%Extraordinary School Program 0 0 0% 0 0%Food Service 0 0 0% 0 0%Professional Development 0 0 0% 0 0%Parent Education Program 0 0 0% 0 0%Summer School 0 0 0% 0 0%Special Education 0 0 0% 0 0%Cost of Living 0 0 0%Vocational Education 0 0 0% 0 0%Gifts/Grants 0 0 0% 0 0%Special Liability 0 0 0% 0 0%School Retirement 0 0 0% 0 0%Extraordinary Growth Facilities 0 0 0% 0 0%Special Reserve 0 0 0%KPERS Spec. Ret. Contribution 0 0 0% 0 0%Contingency Reserve 0 0 0%Text Book & Student Material 0 0 0%Bond & Interest #1 0 0 0% 0 0%Bond & Interest #2 0 0 0% 0 0%No-Fund Warrant 0 0 0% 0 0%Special Assessment 0 0 0% 0 0%Temporary Note 0 0 0% 0 0%
SUBTOTAL 57,803 34,110 -41% 615,000 1703%Enrollment (FTE)* 936.5 918.0 -2% 895.0 -3%Amount per Pupil 62 37 -40% 687 1749%
Adult Education 0 0 0% 0 0%Adult Supplemental Education 0 0 0% 0 0%Area Vocational School 0 0 0% 0 0%Tuition Reimbursement 0 0 0% 0 0%Special Education Coop 0 0 0% 0 0%TOTAL 57,803 34,110 -41% 615,000 1703%
NOTE: Gifts/Grants includes private grants and grants from nonfederal sources.
Amount per pupil excludes the following funds: Area Vocational School, Adult Education, Adult Supplemental Education,Special Education Coop and Tuition Reimbursement.
*Enrollment (FTE) includes the enrollment of the district used for state aid and budget authority, and all other preschool enrollmentand kindergarten students attending full time.
Capital Improvements (4000)
0
100,000
200,000
300,000
400,000
500,000
600,000
700,000
2005-2006 2006-2007 2007-2008
9/24/2007 11:48 AM Sumexpen.xls Page 12 of 19

USD# 340
Debt Services Expenditures (5100)
% %2005-2006 2006-2007 inc/ 2007-2008 inc/
Actual Actual dec Budget dec
General 0 0 0% 0 0%Federal Funds 0 0 0% 0 0%Supplemental General 0 0 0% 0 0%At Risk (4yr Old) 0 0 0% 0 0%At Risk (K-12) 0 0 0% 0 0%Bilingual Education 0 0 0% 0 0%Capital Outlay 0 0 0% 0 0%Driver Training 0 0 0% 0 0%Declining Enrollment 0 0 0% 0 0%Extraordinary School Program 0 0 0% 0 0%Food Service 0 0 0% 0 0%Professional Development 0 0 0% 0 0%Parent Education Program 0 0 0% 0 0%Summer School 0 0 0% 0 0%Special Education 0 0 0% 0 0%Cost of Living 0 0 0%Vocational Education 0 0 0% 0 0%Gifts/Grants 0 0 0% 0 0%Special Liability 0 0 0% 0 0%School Retirement 0 0 0% 0 0%Extraordinary Growth Facilities 0 0 0% 0 0%Special Reserve 0 0 0%KPERS Spec. Ret. Contribution 0 0 0% 0 0%Contingency Reserve 0 0 0%Text Book & Student Material 0 0 0%Bond & Interest #1 593,016 610,060 3% 619,720 2%Bond & Interest #2 0 0 0% 0 0%No-Fund Warrant 0 0 0% 0 0%Special Assessment 0 0 0% 0 0%Temporary Note 0 0 0% 0 0%
SUBTOTAL 593,016 610,060 3% 619,720 2%Enrollment (FTE)* 936.5 918.0 -2% 895.0 -3%Amount per Pupil 633 665 5% 692 4%
Adult Education 0 0 0% 0 0%Adult Supplemental Education 0 0 0% 0 0%Area Vocational School 0 0 0% 0 0%Tuition Reimbursement 0 0 0% 0 0%Special Education Coop 0 0 0% 0 0%TOTAL 593,016 610,060 3% 619,720 2%
NOTE: Gifts/Grants includes private grants and grants from nonfederal sources.
Amount per pupil excludes the following funds: Area Vocational School, Adult Education, Adult Supplemental Education,Special Education Coop and Tuition Reimbursement.
*Enrollment (FTE) includes the enrollment of the district used for state aid and budget authority, and all other preschool enrollmentand kindergarten students attending full time.
Debt Services (5100)
0
100,000
200,000
300,000
400,000
500,000
600,000
700,000
2005-2006 2006-2007 2007-2008
9/24/2007 11:48 AM Sumexpen.xls Page 13 of 19

USD# 340
Transfers (5200)
% %2005-2006 2006-2007 inc/ 2007-2008 inc/
Actual Actual dec Budget dec
General 815,302 917,638 13% 951,794 4%Federal Funds 0 0 0% 0 0%Supplemental General 440,847 565,893 28% 647,896 14%At Risk (4yr Old) 0 0 0% 0 0%At Risk (K-12) 0 0 0% 0 0%Bilingual Education 0 0 0% 0 0%Capital OutlayDriver Training 0 0 0% 0 0%Declining Enrollment 0 0 0% 0 0%Extraordinary School Program 0 0 0% 0 0%Food Service 0 0 0% 0 0%Professional Development 0 0 0% 0 0%Parent Education Program 0 0 0% 0 0%Summer School 0 0 0% 0 0%Special Education 0 0 0% 0 0%Cost of Living 0 0 0%Vocational Education 0 0 0% 0 0%Gifts/Grants 0 0 0% 0 0%Special Liability 0 0 0% 0 0%School Retirement 0 0 0% 0 0%Extraordinary Growth Facilities 0 0 0% 0 0%Special Reserve 0 0 0%KPERS Spec. Ret. Contribution 0 0 0% 0 0%Contingency Reserve 0 0 0%Text Book & Student Material 0 0 0%Bond & Interest #1 0 0 0% 0 0%Bond & Interest #2 0 0 0% 0 0%No-Fund Warrant 0 0 0% 0 0%Special Assessment 0 0 0% 0 0%Temporary Note 0 0 0% 0 0%
SUBTOTAL 1,256,149 1,483,531 18% 1,599,690 8%Enrollment (FTE)* 936.5 918.0 -2% 895.0 -3%Amount per Pupil 1,341 1,616 20% 1,787 11%
Adult Education 0 0 0% 0 0%Adult Supplemental Education 0 0 0% 0 0%Area Vocational School 0 0 0% 0 0%Tuition Reimbursement 0 0 0% 0 0%Special Education Coop 0 0 0% 0 0%TOTAL 1,256,149 1,483,531 18% 1,599,690 8%
NOTE: Gifts/Grants includes private grants and grants from nonfederal sources.
Amount per pupil excludes the following funds: Area Vocational School, Adult Education, Adult Supplemental Education,Special Education Coop and Tuition Reimbursement.
*Enrollment (FTE) includes the enrollment of the district used for state aid and budget authority, and all other preschool enrollmentand kindergarten students attending full time.
Transfers (5200)
0
200,000
400,000
600,000
800,000
1,000,000
1,200,000
1,400,000
1,600,000
1,800,000
2005-2006 2006-2007 2007-2008
9/24/2007 11:48 AM Sumexpen.xls Page 14 of 19

USD# 340Miscellaneous Information
Unencumbered Cash Balance by Fund
July 1, 2005 July 1, 2006 July 1, 2007General 0 0 0Federal Funds 0 0 0Supplemental General 28,210 36,694 41,518At Risk (4yr Old) 0 0At Risk (K-12) 8,888 9,320Bilingual Education 0 0 0Capital Outlay 734,863 830,122 898,532Driver Training 25,264 27,144 25,622Declining Enrollment 0 0Extraordinary School Program 0 0 0Food Service 163,689 123,745 121,808Professional Development 20,269 8,786 21,766Parent Education Program 0 0 0Summer School 3,104 0 0Special Education 213,003 236,490 292,525Cost of Living 0Vocational Education 0 0 1,419Gifts/Grants 16,190 20,706 25,397Special Liability 0 0 0School Retirement 0 0 0Extraordinary Growth Facilities 0 0 0Special Reserve 0 0KPERS Spec. Ret. Contribution 0 0 0Contingency Reserve 233,546 233,546Text Book & Student Material 71,462 84,325Bond & Interest 1 612,679 665,634 694,658Bond & Interest 2 0 0 0No Fund Warrant 0 0 0Special Assessment 0 0 0Temporary Note 0 0 0
SUBTOTAL 2,122,279 2,276,080 2,132,565Enrollment (FTE)* 936.5 918.0 895.0Amount per Pupil 2,266 2,479 2,383
Adult Education 0 0 0Adult Supplemental Education 0 0 0Area Vocational School 0 0 0Tuition Reimbursement 0 0 0Special Education Coop 0 0 0TOTAL 2,122,279 2,276,080 2,132,565
NOTE: Gifts/Grants includes private grants and grants from nonfederal sources.
Amount per pupil excludes the following funds: Area Vocational School, Adult Education, Adult Supplemental Education,Special Education Coop and Tuition Reimbursement.
*Enrollment (FTE) includes the enrollment of the district used for state aid and budget authority, and all other preschool enrollmentand kindergarten students attending full time.
Unencumbered Cash Balances by Fund
0
500,000
1,000,000
1,500,000
2,000,000
2,500,000
July 1, 2005 July 1, 2006 July 1, 2007
9/24/2007 11:48 AM Sumexpen.xls Page 15 of 19

USD# 340
Reserve FundsUnencumbered Cash Balance
July 1, 2005 July 1, 2006Special Reserve 0 0TOTAL OTHER 0 0Amount per Pupil $0 $0
*School districts are authorized by law to self insure rather than purchase insurance for the following categories: Worker's Comp,Health Insurance, Life Insurance, Property and Casualty (Risk Management) and Disability Income Insurance. Monies are placedin the Self Insured Fund to pay for claims which may arise from the categories listed above.
Unencumbered Cash Balances by Fund (Reserve Funds Only)
0
0
0
0
0
1
1
1
1
1
1
July 1, 2005 July 1, 2006
9/24/2007 11:48 AM Sumexpen.xls Page 16 of 19

USD# 340Other Information
2003-2004 2004-2005 % 2005-2006 % 2006-2007 % 2007-2008 %Actual Actual inc/ Actual inc/ Actual inc/ Budget inc/
dec dec dec dec
Enrollment (FTE)* 945.1 950.0 1% 936.5 -1% 918.0 -2% 895.0 -3%
Enrollment (FTE)** 1,006.0 950.0 -6% 936.5 -1% 918.0 -2% 895.0 -3%Number of Students - Free Meals 130 129 -1% 107 -17% 118 10% 140 19%Number of Students - Reduced Meals 75 87 16% 99 14% 90 -9% 95 6%
*FTE for state aid and budget authority purposes for general fund (excludes 4 yr old at-risk).
** FTE includes 9/20 enrollment used for state aid purposes and adding the additional FTE for preschool programs, headstart, and all-daykindergarten. For example, preschool students attending half days on September 20th would be counted as .5 FTE. Kindergartenstudents attending full time every day would be counted as 1.0 FTE.
Enrollment (FTE)* for Budget Authority
0.0
100.0
200.0
300.0
400.0
500.0
600.0
700.0
800.0
900.0
1000.0
2003-2004 2004-2005 2005-2006 2006-2007 2007-2008
Low Income Students
0
20
40
60
80
100
120
140
160
2003-2004 2004-2005 2005-2006 2006-2007 2007-2008
Free MealsReduced Meals
Enrollment (FTE)** Used for Calculating "Amount Per Pupil"
820.0840.0860.0880.0900.0920.0940.0960.0980.0
1000.01020.0
2003-2004 2004-2005 2005-2006 2006-2007 2007-2008
9/24/2007 11:48 AM Sumexpen.xls Page 17 of 19

USD# 340
Miscellaneous InformationMill Rates by Fund
2005-2006 2006-2007 2007-2008Actual Actual Budget
General 20.000 20.000 20.000Supplemental General 17.200 17.490 18.298Adult Education 0.000 0.000 0.000Capital Outlay 3.930 3.960 4.000Declining Enrollment 0.000 0.000 0.000Cost of Living 0.000 0.000Special Liability 0.000 0.000 0.000School Retirement 0.000 0.000 0.000Extraordinary Growth Facilities 0.000 0.000 0.000Bond & Interest 1 10.240 9.170 8.288Bond & Interest 2 0.000 0.000 0.000No Fund Warrant 0.000 0.000 0.000Special Assessment 0.000 0.000 0.000Temporary Note 0.000 0.000 0.000TOTAL USD 51.370 50.620 50.586Historical Museum 0.000 0.000 0.000Public Library Board 0.000 0.000 0.000Public Library Brd & Emp Benf 0.000 0.000 0.000Recreation Commission 0.000 0.000 0.000Recreation Commission Employee Benefit 0.000 0.000 0.000TOTAL OTHER 0.000 0.000 0.000
2007-2008 Miscellaneous InformationMill Rates by Fund (Total USD)
General40%
Supplemental General36%
Capital Outlay8%
Bond & Interest 116%
GeneralSupplemental GeneralAdult EducationCapital OutlaySpecial LiabilitySchool RetirementDeclining EnrollmentCost of LivingBond & Interest 1Bond & Interest 2Extraordinary Growth FacilitiesNo Fund WarrantSpecial AssessmentTemporary Note
Total USD Mill Rates
0.000
10.000
20.000
30.000
40.000
50.000
60.000
2005-2006 2006-2007 2007-2008
9/24/2007 11:48 AM Sumexpen.xls Page 18 of 19
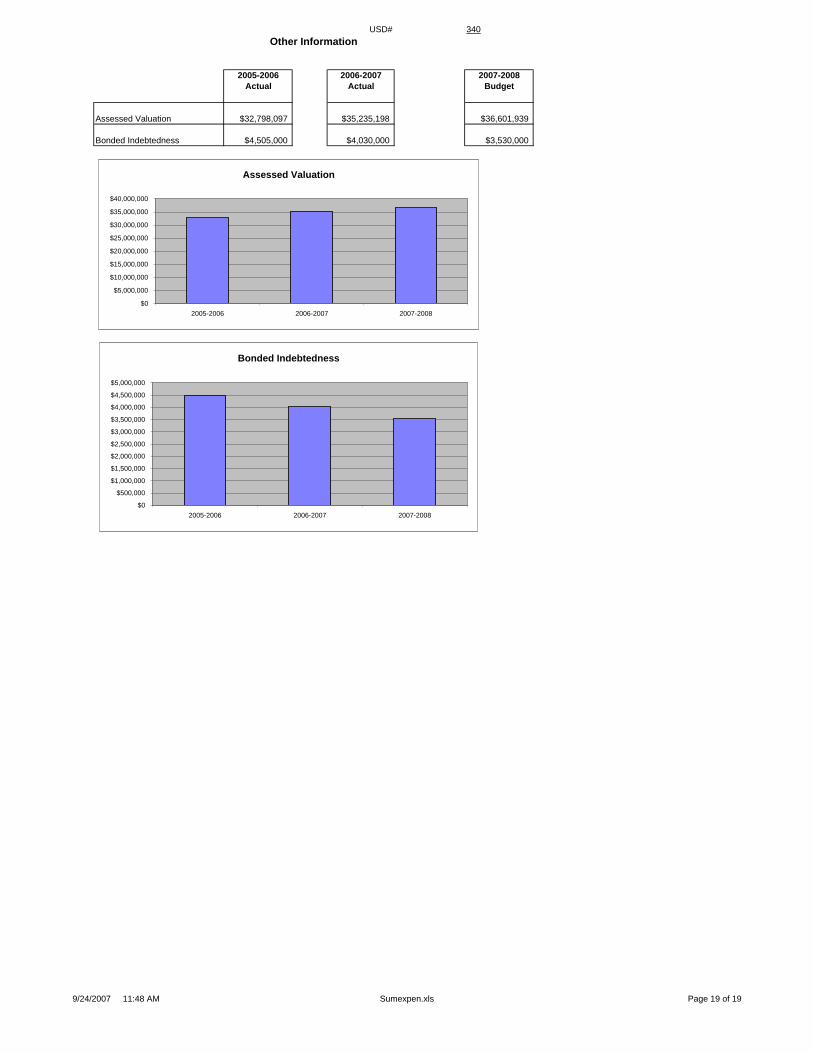
USD# 340Other Information
2005-2006 2006-2007 2007-2008Actual Actual Budget
Assessed Valuation $32,798,097 $35,235,198 $36,601,939
Bonded Indebtedness $4,505,000 $4,030,000 $3,530,000
Assessed Valuation
$0
$5,000,000
$10,000,000
$15,000,000
$20,000,000
$25,000,000
$30,000,000
$35,000,000
$40,000,000
2005-2006 2006-2007 2007-2008
Bonded Indebtedness
$0
$500,000
$1,000,000
$1,500,000
$2,000,000
$2,500,000
$3,000,000
$3,500,000
$4,000,000
$4,500,000
$5,000,000
2005-2006 2006-2007 2007-2008
9/24/2007 11:48 AM Sumexpen.xls Page 19 of 19