use of a new model to represent hydrocyclone …users.ntua.gr/mmmskt/new model representing... · 1...
TRANSCRIPT

1
USE OF A NEW MODEL TO REPRESENT HYDROCYCLONE
CORRECTED-EFFICIENCY CURVES
K.G. TSAKALAKIS, Associate Professore-mail: [email protected]
School of Mining and Metallurgical Engineering, National Technical University of Athens (NTUA)
Presented at AMIREG 2004 (June 2004, Chania-Crete)
2
MAIN USES OF HYDROCYCLONES
• Classification (e.g. closed grinding circuits extremely efficient at fine separation sizes)
• De-sliming (clarification)• De-gritting• Thickening• Sorting
3
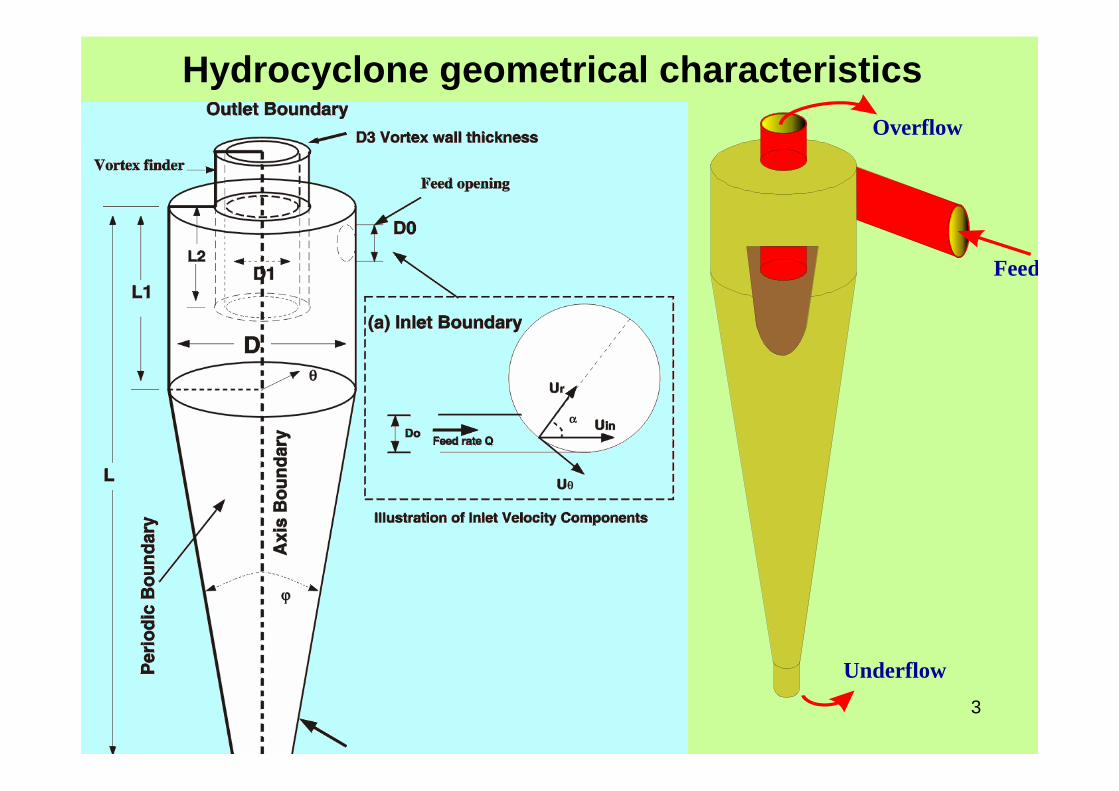
Feed
Underflow
Overflow
Hydrocyclone geometrical characteristics

4
CYCLONE EFFICIENCY• The partition or performance curve is the method
of representing the cyclone efficiency.• The curve relates the weight fraction or
percentage of each size fraction found in the feed, which reports to the underflow (coarse material).
• The cut size (separation size) or d50 is the mean size fraction for which, 50% of its particles in the feed reports to the underflow (equal chance of going either with the underflow or with the overflow).
• The sharpness of the separation depends on the slope of the central section of the partition curve.
• The closer to vertical is the slope, the higher is the efficiency.

5
Typical hydrocyclonepartition curves (actual Ea a and corrected and corrected EEcc efficiency
curves)
Comparison between typical partition curves
and the fish-hook effect
6
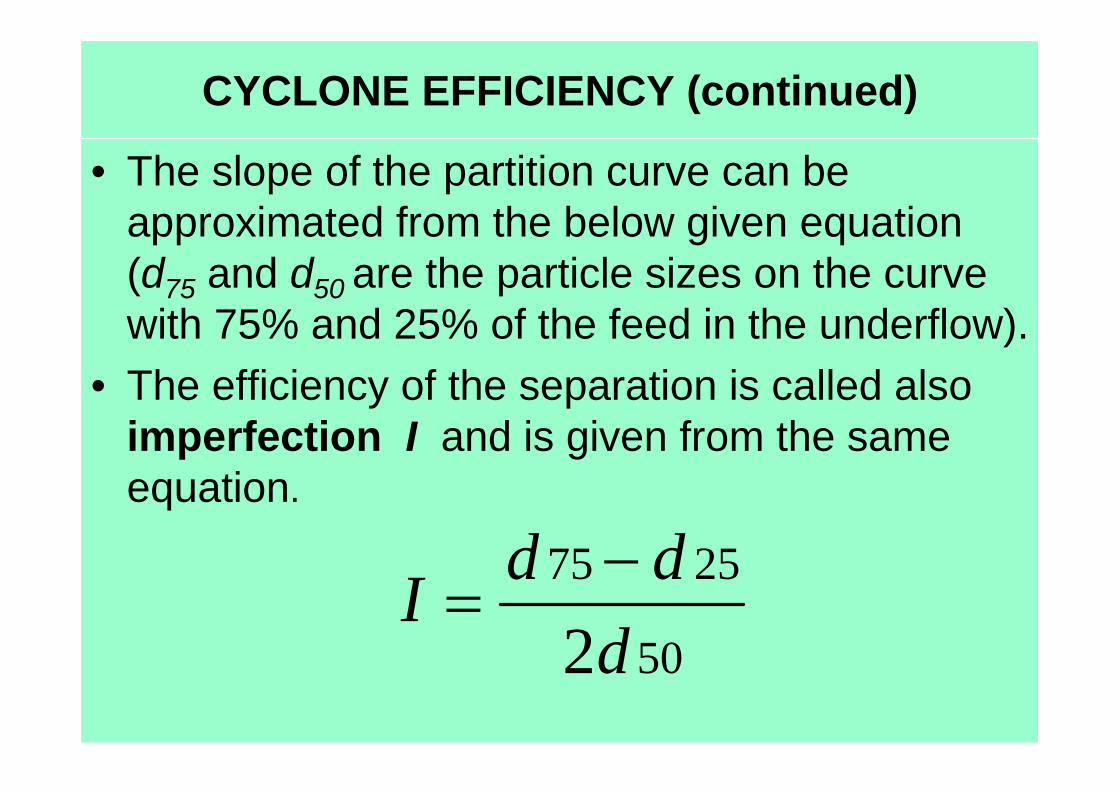
CYCLONE EFFICIENCY (continued)
• The slope of the partition curve can be approximated from the below given equation (d75 and d50 are the particle sizes on the curve with 75% and 25% of the feed in the underflow).
• The efficiency of the separation is called also imperfection I and is given from the same equation.
50
2575
2dddI −
=

7
RELATIONSHIP BETWEEN actual efficiency Ea
and corrected efficiency Ec
• In many mathematical models of hydrocyclonesthe term (mean size fraction) d50c is used, since it is assumed that solids from all size fractions are entrained in the coarse product due to short –circuiting, in direct proportion to the fraction of feed water reporting to the underflow.
• The relationship between Ea (separation size d50 )and Ec (d50c ) is given from
1a f
cf
E RE
R−
=−

8
Models used for the corrected efficiency Ec curves
[ ]
[ ]
50
50
( / )
( / )
12
c
c
a d d
c a d d a
eEe e
−=
+ −
( )500.6931 /1
mcd d
cE e⎡ ⎤−⎢ ⎥⎣ ⎦= −
[ ]1 1 ( / )maxrm
E d dc = − −
( Lynch model, 1965 )
( Plitt-Reid model, 1971 )
( Harris model, 1972 )
9
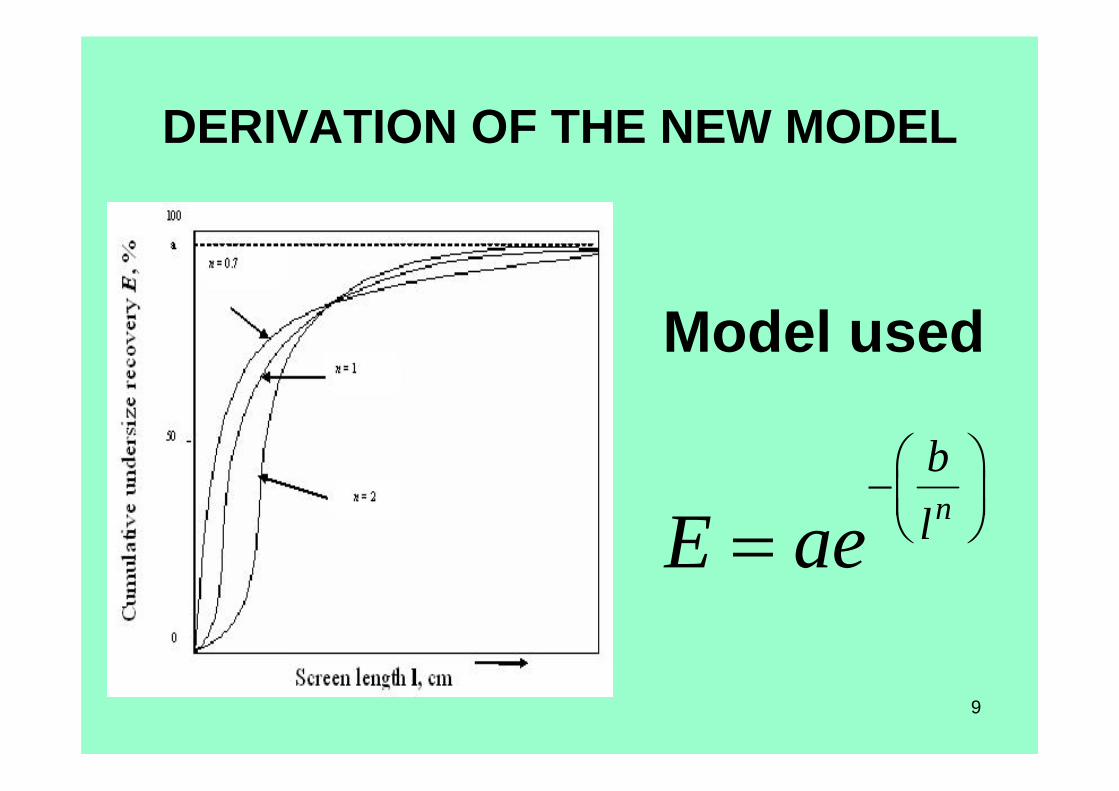
DERIVATION OF THE NEW MODEL
nblE ae
⎛ ⎞−⎜ ⎟⎝ ⎠=
Model used
10
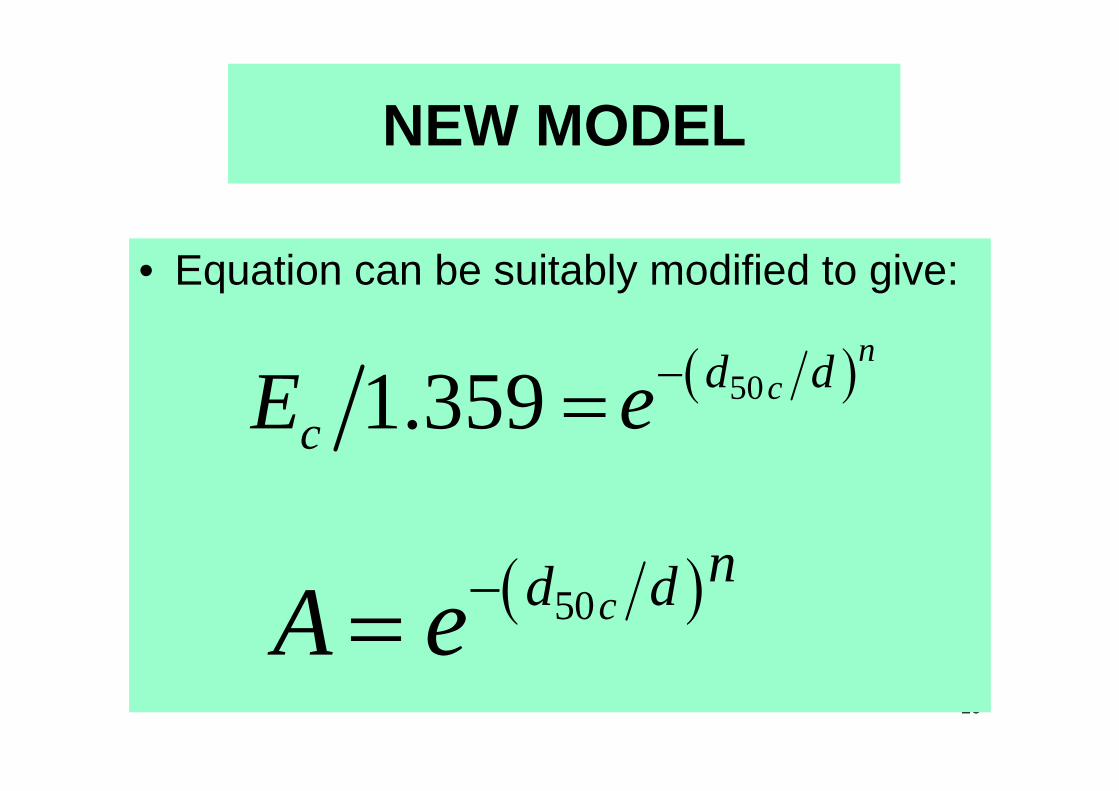
NEW MODEL
• Equation can be suitably modified to give:
( )501.359n
cd dcE e−=
( )50cnd dA e−=
11
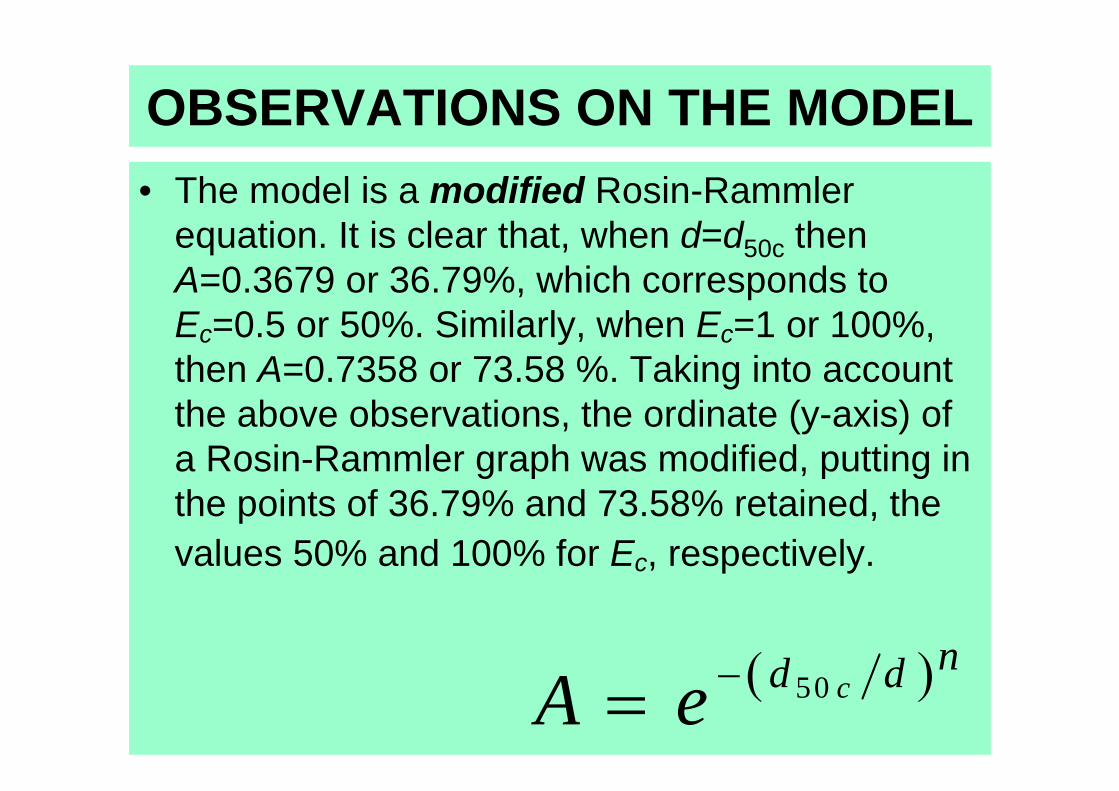
OBSERVATIONS ON THE MODEL• The model is a modified Rosin-Rammler
equation. It is clear that, when d=d50c then A=0.3679 or 36.79%, which corresponds to Ec=0.5 or 50%. Similarly, when Ec=1 or 100%, then A=0.7358 or 73.58 %. Taking into account the above observations, the ordinate (y-axis) of a Rosin-Rammler graph was modified, putting in the points of 36.79% and 73.58% retained, the values 50% and 100% for Ec, respectively.
( )50 cnd dA e −=

12
13
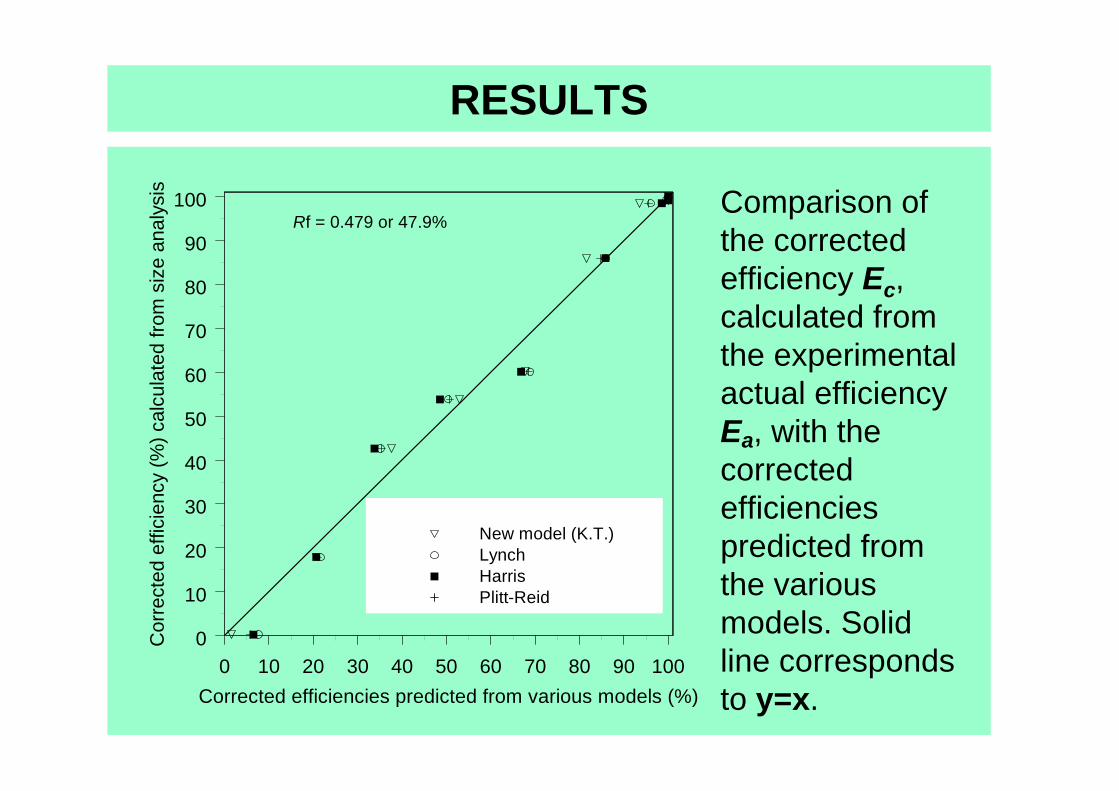
RESULTS
0 10 20 30 40 50 60 70 80 90 100Corrected efficiencies predicted from various models (%)
0
10
20
30
40
50
60
70
80
90
100
Cor
rect
ed e
ffici
ency
(%) c
alcu
late
d fro
m s
ize
anal
ysis
New model (K.T.)LynchHarrisPlitt-Reid
Rf = 0.479 or 47.9%Comparison of the corrected efficiency Ec, calculated from the experimental actual efficiency Ea, with the corrected efficiencies predicted from the various models. Solid line corresponds to y=x.

14
RESULTS (continued)
50 60 70 80 90 100
Actual efficiencies predicted from various models (%)
50
60
70
80
90
100
Expe
rimen
tal a
ctua
l effi
cien
cy E
a (%
to u
nder
flow
)
Actual Efficiency (Ea)LynchHarrisPlitt-ReidNew Model (K.T.)
Comparison of the actual efficiencies predicted from various models to the actual efficiency (Ea) from size analysis. Solid line corresponds to y=x.

15
COMPARISON between the various models
Simple linear
regression & graphi-
cally
Non-linear regression & graphically
(very complicated)
Simple linear
regression &
graphically
Non-linear regression
Method of prediction
r = 2.878
n = 0.892m = 1.263m = 1.42a = 1.602
d50c = 116 µmdmax = 433.1 µmd50c = 122 µmd50c = 123 µm
Values of the
parameters
New modelHarrisPlitt-ReidLynchModel

16
CONCLUSIONS• The model is a powerful two-parameter model. • Its parameters describing the performance of a
classifier can be mathematically and graphicallyobtained with accuracy comparable to that presented by the already known models.
• It can be used as an alternative tool or in parallel with the already applied models for the prediction of d50c, dmax and d50 (actual separation size).
• d50 (28.3 µm) predicted (from the new model) is closer to the experimental one (>22 µm), than those predicted from the other models (from 11.83 to 16.7 µm). Probably this is due to the superior fitting capability of the proposed model for the fine size fractions.
17
CONCLUSIONS (continued)
• It can also be thought as an advantage of the proposed model that Ec is predicted to be 1.359 or 135.9% at infinite particle size, whereas Ec = 1 or 100% at a finite particle size dmax, as it actually happens in wet classification.
• The proposed model is in most cases reliable and adequate for the representation of the classifier efficiency (corrected and afterwards actual).
• It needs further testing for its applicability to other classification tests.
• It proved to be valid for the cases examined here.

18
THANK YOU