use of smartphone's microphone sensor to estimate rate of
TRANSCRIPT

!
Use of Smartphone's Microphone Sensor to Estimate Rate of Respiration
by Kanchanjot Kaur Phokela
Under the Supervision of Dr Vinayak Naik
Indraprastha Institute of Information Technology Delhi
July,2017

!
©Indraprastha Institute of Information Technology (IIITD),New
Delhi 2017

!
Use of Smartphone's Microphone Sensor to Estimate Rate of Respiration
by
Kanchanjot Kaur Phokela
Submitted in partial fulfillment of the requirements for the degree of Master of Technology
to
Indraprastha Institute of Information Technology Delhi
July, 2017

!
Certificate This is to certify that the thesis titled “Use of Smartphone's Microphone Sensor to Estimate Rate of Respiration” being submitted by Kanchanjot Kaur Phokela to the Indraprastha Institute of Information Technology Delhi, for the award of the Master of Technology, is an original research work carried out by her under my supervision. In my opinion, the thesis has reached the standards fulfilling the requirements of the regulations relating to the degree.
The results contained in this thesis have not been submitted in part or full to any other university or institute for the award of any degree/diploma.
July, 2017 Dr. Vinayak Naik
Department of Mobile & Ubiquitous Computing
Indraprastha Institute of Information Technology Delhi
New Delhi 110 020
! !

!
Acknowledgement I would like to express my sincere gratitude towards my advisor, Dr. Vinayak Naik for guiding me through the duration of my thesis. His knowledge and expert advice helped me in understanding the different facets of my research work. His valuable inputs helped me build on the approach to carry forward my thesis in the right direction.
I would also like to thank my parents for motivating from time to time throughout the course of my thesis which enabled me to pursue my research in an efficient and structured manner.

!
Abstract
Sleep plays a crucial part of one’s physical and mental wellbeing. Polysomnography, which is the gold standard for measuring and analyzing sleep requires the subject to sleep overnight with many expensive sensors attached to the body. A disordered respiration pattern can lead to different physiological and psychological dysfunctioning, in turn hampering the sleep. PSG uses specialized flow or pressure sensor for measuring rate of respiration. This thesis proposes a portable, comfortable, and cost-effective solution using the smartphone to estimate respiration rate with the help of attached headset microphone placed beneath the nose. The method uses the amplitude of nasal breath sound to estimate different breathing rates. Inhale and exhale periods are estimated by taking the average of the amplitude of nasal breath sound. Performance evaluation of the system involved collecting data from people of different gender and across all age groups. The experimental results showed that the method achieved good accuracy with a median error of 10% for varied breathing rates. ! !

!
Contents Certificate
Acknowledgement
Abstract
List of Figures
List of Tables
1 Introduction 2
2 Related Work 4
3 Proposed System 6
3.1 System Architecture 6
3.2 Event Detection 7
3.3 Proposed Technique 8
3.4 Data Analysis on Different Techniques 9
4 Noisy Environment 11
4.1 Noise Reduction 11
4.1.1 Effect of Noise on breathing rate 11
4.2 Noise Detection 12
4.3 Noise Subtraction 12
5 Experiment Evaluation 14

!
5.1 Data Acquisition 14
5.2 Experiment 15
5.2.1 Experiment based on Time Duration 15
5.2.1.1 One Hour Experiment 15
5.2.1.2 One Minute Experiment 15
5.2.2 Experiment based on Sampling Frequency and Battery Consumption 16
5.2.2.1 Estimating Sampling Frequency 16
5.2.2.2 Sampling Rate and Battery Consumption 17
5.2.3 Experiment based on Breathing Rate 19
5.2.4 Experiment by varying the Gender and Age Group 19
5.2.5 Experiment based on different Smartphone and Microphone sensitivity 20
5.2.6 Experiment in Noisy Environment 24
5.2.6.1 Experiment based on different Noisy Categories 24
5.2.6.2 Experiment based on different Noisy Settings 31
5.3 Performance Metrics 40
6 Results 42
6.1 Accuracy and Overall Performance of Mean without Windowing Technique 42
6.2 Impact of Background Noise 44
6.3 Impact of Smartphone configuration and sensitivity of Microphone 46
6.4 Battery Consumption and Storage Utilization 47

!
7 Conclusion 48
Bibliography 49

!
List of Figures
3.1 Flow chart of the proposed system to estimate respiration rate using headphone microphone and smartphone. 7
3.2 Scatter plot of the amplitude of the power spectrum of the nasal breath sounds. 8
4.1
Scatter plot of the amplitude of the power spectrum of the nasal breath sounds sampled at the rate of 3.33hz, (a) before passing the data through a low pass filter, (b) after passing the data through a low pass filter.
12
5.1 Bar chart comparing the performance of sampling rate on the evaluation metrics of precision and recall. 17
5.2 Bar chart comparing the performance of sampling rate and its effect on battery consumption on the evaluation metrics of precision and recall.
18
5.3 Experimental setup of noisy sitting area. 32
5.4 Experimental setup of noisy canteen area. 33
5.5 Experimental setup of noisy café coffee day express, glassdoor area. 34
5.6 Experimental setup of noisy library area. 35
5.7 Experimental setup of noisy lab area. 36
5.8 Experimental setup of noisy common room area. 38
5.9 Experimental setup of noisy reading room area. 40
6.1
Evaluation of techniques by varying the parameter A and B. Precision for (a) Male Dataset (b) Female Dataset, Recall for (c) Male Dataset (d) Female Dataset, Breathing Rate Error for (e) Male Dataset (f) Female Dataset.
44
6.2 Evaluation of techniques by varying the noise conditions. Breathing Rate Error for (a) Noisy setting (b) Noise Creating instances individually.
45

!
6.3
Evaluation of techniques by varying the smartphone configuration and microphone model. Breathing Rate Error for (a) Microphone Model (b) Smartphone Model
47

!
List of Tables!
3.1 Comparison of performance in terms of error percentage in breathing
rate for various methodologies on one minute datasets. 10
5.1 Comparison of performance of sampling rate with battery consumption. 18
5.2 Comparison of performance of breathing rate using precision recall as the evaluation metric. 19
5.3 Comparison of performance of breathing rate on different sex and age group using precision recall as the evaluation metric. 20
5.4 Comparison of performance of breathing rate on different microphone for smartphone lenovo using precision recall as the evaluation metric.
21
5.5 Comparison of performance of breathing rate on different microphone using precision recall as the evaluation metric.
22
5.6 Comparison of performance of breathing rate on different microphone for smartphone one plus 3t using precision recall as the evaluation metric.
22
5.7 Comparison of performance of breathing rate on different microphone for smartphone redimi using precision recall as the evaluation metric.
23
5.8 Comparison of performance of breathing rate on different microphone for smartphone samsung using precision recall as the evaluation metric.
23
5.9 Comparison of performance of breathing rate using noise category air conditioner using precision recall as the evaluation metric. 25
5.10 Comparison of performance of breathing rate using noise category construction noise using precision recall as the evaluation metric. 26
5.11 Comparison of performance of breathing rate using noise category fan using precision recall as the evaluation metric.
27

!
!
5.12 Comparison of performance of breathing rate using noise category home appliances noise using precision recall as the evaluation metric.
28
5.13 Comparison of performance of breathing rate using noise category people murmuring using precision recall as the evaluation metric.
29
5.14 Comparison of performance of breathing rate using noise category traffic noise using precision recall as the evaluation metric.
30
5.15 Comparison of performance of breathing rate using noise category television using precision recall as the evaluation metric.
31
5.16 Comparison of performance of breathing rate using noise setting sitting area using precision recall as the evaluation metric.
32
5.17 Comparison of performance of breathing rate using noise setting canteen using precision recall as the evaluation metric.
33
5.18 Comparison of performance of breathing rate using noise setting cdx using precision recall as the evaluation metric.
34
5.19 Comparison of performance of breathing rate using noise setting library using precision recall as the evaluation metric.
35
5.20 Comparison of performance of breathing rate using noise setting lab using precision recall as the evaluation metric.
36
5.21 Comparison of performance of breathing rate using noise setting park using precision recall as the evaluation metric.
37
5.22 Comparison of performance of breathing rate using noise setting common room using precision recall as the evaluation metric.
38
5.23 Comparison of performance of breathing rate using noise setting personal room using precision recall as the evaluation metric.
39
5.24 Comparison of performance of breathing rate using noise setting reading room using precision recall as the evaluation metric.
40

! 2!
Chapter 1
Introduction Breathing plays a crucial role in one’s physical and psychological well being, it is inevitable for survival. There are not many readily available, low cost, user friendly and less intrusive methods present that can measure the respiration rate. Breathing rate estimation and analysis cater to a variety of healthcare applications such as sleep quality monitoring, diabetics and cardiac arrest [4][5]. It is observed that about 15 million people are affected by sleep related problems [6] that can cause drowsiness, lack of attention and can lead to heart stroke and vehicular accidents [7].
Technology has advanced but till date, there is no solution that is cheap and can replace the Polysomnography(PSG) test. Polysomnography test is considered as the gold standard for measuring and analyzing sleep apnea [8] and also provides an accurate analysis of the breathing rate. The test relies on EEG, EMG and EOG sensors to report results. In this test, the patient has to sleep overnight at the hospital by wearing multiple sensors, which causes not only discomfort but also is costly with only limited beds available. Actigraphy is considered as the low cost alternative to PSG, which uses the accelerometer to quantify sleep based on body movements [9], and has many applications such as FitBit, Sleep Tracker [11].
Our system provides a low cost, portable, less intrusive, user-friendly solution to estimate respiration rate. The system uses the breathing sound generated by airflow captured by the off device microphone to estimate respiration rate. Doctors use a stethoscope to diagnose respiratory related diseases. A Stethoscope is a form of a microphone, from which we can infer that a microphone can be used to estimate respiration rate [18]. Studies depict that the nasal sound is directly correlated with the airway flow [19]. Using the above facts, on the phone microphone or headset microphone can be used to estimate respiration rate.
People tend to sleep in quite environment but the background noise of air conditioner, fan, nearby construction and etc. is inevitable. The background noise tends to hamper the performance of the system as it gets added to the breathing sound. Our system removes the background noise by passing the data

! 3!
from a low pass filter and then estimation of respiration rate it performed on the processed data.
As the studies show the increasing use of smartphones in our daily lives, people tend to use it for listening music or watching videos before going to sleep [1][2]. People are habitual of wearing the headset microphone and if asked to wear for detection of respiration rate it won’t cause them much discomfort. On the phone microphone poses inconvenience in usage as the user is resilient in keeping the phone too close due to electromagnetic radiation concerns and generally on the phone microphone is less sensitive as compared to headset microphone.
The various challenges faced during the designing of the system were 1) The microphone is susceptible to background noise that tends to become louder as compared to the acoustic sound created by the airflow 2) The breathing rate varies from person to person and the algorithm should be able to adapt to different breathing rates.
In this thesis, the development of a low cost, portable, user-friendly solution to measure respiration rate is proposed with the use of headset microphone and a smartphone. In Section 2 review of the related work is discussed. Section 3 gives a brief outline of the system architecture, event detection and the proposed technique. Section 4 outlines the effect of background noise on data and its removal. Section 5 outlines the process of data acquisition and experimental setup to assess the performance of technique on various parameters. Section 6 validates the proposed technique on the data acquired, noisy environment and smartphone and microphone configuration. Section 7 concludes the system based on the results obtained.

! 4!
Chapter 2!!!
Related Work Polysomnography (PSG) has been considered for long as a gold standard for sleep study. PSG takes into consideration the reading of multiple channels such as respiration rate, oxygen saturation, airflow, electrocardiography(ECG) or heart rate, electroencephalography (EEG), electromyography (EMG) and etc. The results of these channels are considered together to estimate the sleep quality. As PSG requires use of various sensors and professional installation, hence is limited to sleep clinics. Actigraphy is considered as the low cost alternative to PSG, which uses the accelerometer to quantify sleep based on body movements [9], and has many applications such as FitBit, Sleep Tracker [11]. Zeo [10], based on PSG uses the EEG headband that the subject has to wear to estimate sleep and analyze breathing rate. Accelerometer is also used to estimate respiration rate and is used by many mobile applications such as Sleep as Android and iSleep for iOS[12]. This method caters to monitoring based on body movements, but is unable to provide fine grain breathing analysis. Moreover, it is crucial for the device to be placed on body or on the bed, which can cause discomfort to the individual.
Smartphones have been widely used as medical devices with benefit being portability, ease of use and availability among people [13]. A good estimate for breathing rate can be found out using the pulsating light fluctuations that are captured by the smartphone’s camera [14]. It is observed that the accuracy drops after 30 breaths per minute and it also is inconvenient to place the finger throughout the night on the camera with an added concern of battery drain. Other alternatives include use of Oximeter (Spo2 sensor) along with other sensors such as motion sensor to estimate breathing rate [15]. User is asked to wear the Spo2 sensor clip on the finger, which causes discomfort and the sensor is not able to accurately differentiate between different respiration rates such as breathlessness and panting. Wireless sensors are also used to estimate respiration rate based changes in received signals due to breathing [16] with a limitation of high cost. Off the shelf radar sensor is also used to estimate

! 5!
breathing using the body movements due to heart beating and respiration [17].
Several research efforts are made in developing a low cost wearable sleep estimation system. Watch-PAT [20] find out respiration disturbance during sleep by monitoring peripheral arterial tone (PAT). The user has to attach the probe to the finger during sleep for estimation. A wearable cuff [21], that relies on accelerometer, oximetry sensor and microphone to estimate the sleep quality. Body movements and positions during the sleep can give the estimation about the sleep quality. Accelerometer attached to the bed mattress is used for the estimation [22]. Pressure sensor attached to the bed sheet also talks about sleep positions and in turn sleep quality. These devices incur the cost of hardware and require maintenance and professional installation.
Most recent work to estimate breathing rate involves use of gas analyzer [23] to estimate the concentration of carbon dioxide in the exhaled air.
! !

! 6!
Chapter 3!!
Proposed System!!!3.1! System Architecture!!The system involves the use of headset microphone attached to the smartphone to estimate respiration rate. Headset is a commonly used accessory that is usually sold with the smartphone. The current study shows the increasing trend of use of smartphone to listen music and watch videos among people before they go to sleep [1][2]. This shows that people are habitual of wearing headphone while sleeping or keeping it beside themselves before they sleep. In turn, it facilitates us to use the capabilities of a headphone attached to the smartphone to estimate respiration rate in less intrusive manner. The system takes as input the amplitude acoustic signal generated due to nasal airflow with the help of headset microphone placed beneath the nose of the user. The system is susceptible to background noise such as air conditioner, fan and etc. The data is passed through the low pass filter to remove the background noise component, which got added to the breathing sound. This preprocessing was performed on a personal computer using Matlab (R2015b, The Mathworks, Inc., Natick, MA, USA). The breathing sound varies from 10 to 50 breaths per minute which account breathing frequency range of 0.16 Hz to 0.83 Hz. Normal breathing rate for adults, on the other hand, varies from 10 to 30 breaths per minute which is 0.16Hz to 0.30 Hz. Given the processed input data, the threshold is computed by taking the average of amplitude. Threshold is used to mark inhale and exhale period. Transition from below threshold (marked as inhale period) to above threshold marked as (exhale period) is estimated as one breath. The system performs the same process over a minute to calculate the respiration rate for a minute. This method is effective in adapting to different users and breathing rates. !

! 7!
!Figure 3.1: Flow chart of the proposed system to estimate respiration rate using headphone microphone and smartphone. !
3.2! Event Detection/ Peak Detection To detect the event of breath, the processed data is used. A threshold for the sample is calculated based on the methods explained in the next section. The transition from below the threshold to above the threshold is considered as one breath. The values below the threshold are considered as the inhale period and the values above the threshold are considered as exhale period. Fig 3.2 shows the line plot of the breathing sound captured. Pink cross and black cross depict inhale and exhale point respectively. Red rectangle depicts one breath cycle.

! 8!
Figure 3.2: Scatter plot of the amplitude of the power spectrum of the nasal breath sounds.
3.3! Proposed Technique In order to estimate the respiration rate, the digital values of the amplitude of the power spectrum of the nasal breathing sound are used. The techniques are a function of two parameters A and B, which was used to estimate the threshold, indeed used to mark the transition from inhale to exhale period. Parameter A varied the sample window based on i.e. windowing and non-windowing measure and parameter B varied the statistical measure on the sample window i.e. mean, median and max in the window for windowing technique. In the case of windowing technique variable size windows are created which is adaptive to the sample, while in the case of non-windowing technique complete sample of one minute is considered as the sample space. Our proposed system uses the non-windowing measure of parameter A with mean statistical measure of parameter B for calculating threshold. Using the data points present in sample space, average of the amplitude values is used as

! 9!
the threshold to mark the transition from inhale to exhale period. This method is able to adapt effectively to the various breathing rates and different people. Although the method is susceptible to outliers yet this feature helped in giving a good estimate for different breathing rate. 3.4! Data Analysis on Different Techniques As explained in the last subsection, various techniques are possible for estimating the respiration rate by varying the parameter A and B. Consider a sample dataset with amplitude values of the power spectrum of nasal breath. The readings are as follows I1(61,80,65,70,64), E1(289,291,327,266), I2(65,77,82,69), E2(156,129,248,241,134), I3(63,71,90,61), E3(315,301,326). Here inhale and exhale period marked as I# and E# respectively, are group together. As can be seen from the above values, constant window size for the complete sample will not capture inhale-exhale period accurately. For the period I1-E1 and I2-E2 sample size of 9 will be ideal but for period I3-E3, window size of 9 will lead to penetration in the next inhale- exhale period. Also, for each inhale-exhale window, the value of exhale period can be more than inhale period and vice versa, which can affect the statistical measures in calculating the threshold. For the window I2-E2, the median is 129, which is used as thresholds to mark the transition from inhale to exhale period. This would lead to marking of two breath points, one at 156 and other at 248 but indeed there is only one breath point. Using max in the window will not be robust as it is susceptible to outliers in inhale/exhale period. As seen through experiments that inhale period are longer as compared to exhale period. In case of non-windowing technique with median as a statistical measure, the above facts lead to deviation of threshold towards inhale period, leading to more false positive in the result set and dip in accuracy. Using the above example the median is 90, which results in four breath points at 269, 156, 90 and 315 but indeed there are only three. In case of non windowing with mean as statistical measure, it tends to find the threshold which is neither close to inhale period nor exhale period, making it less prone to outliers in inhale/exhale period. Using the above sample the mean is 157.6, which results in three breath points at 269, 248, 315, same as the actual breath points.

! 10!
TABLE 3.1. COMPARISON OF PERFORMANCE IN TERMS OF ERROR PERCENTAGE IN BREATHING RATE FOR VARIOUS METHODOLOGIES ON ONE MINUTE DATASETS
Technique/ Dataset Dataset 1 Dataset 2 Dataset 3 Dataset 4
Error Error Error Error
Windowing (Size-8)
Max 8.6% -3.8% 31% 31%
Median 11.5% 15% 121% 78.9%
Mean -8.6% 7.6% 57% 26.3%
Non Windowing
Mean 0% -11.5% -5.2% -26.3%
Median 8.6% 11.5% 36% 15.7%
Table 3.1 shows the performance of the above methodologies for various samples. As it can be seen from the samples the median error is least for mean with non-windowing technique. The experiment results showed that the mean performs best among the various other methods and hence is used in the paper for estimation of respiration rate.

! 11!
Chapter 4!!
Noisy Environment!!In this section, we present the identification of the background noise and its effect on breathing data recorded. Further, we assess different methods to remove the background noise. !4.1! Noise Reduction People tend to sleep in quite environment. As the breathing sound is faint, the background noise that is inevitable plays a role in distorting the data collected of breathing sound of the user. The various categories of background noise such as fan, air conditioner, nearby construction noise, off the window traffic noise, nearby people mumming, past door television noise and etc. get added in the breathing noise. To make sure the system performance is vigorous, removal of noise is performed before passing the data into peak detection/ event detection technique that further estimates the respiration rate. 4.1.1! Effect of Noise on breathing rate The background noise can affect the breathing sound causing the accuracy to drop to 20%. To make sure the system works in a robust way, noise reduction is performed.

! 12!
(a)
(b) Figure 4.1 Scatter plot of the amplitude of the power spectrum of the nasal breath sounds sampled at the rate of 3.33hz, (a) before passing the data through a low pass filter, (b) after passing the data through a low pass filter.

! 13!
As can be seen from the figure 4.1 the accuracy for before filtering (a) is about 20% while that of after filtering (b) is 95%. This shows the need to remove the background noise from the data. 4.2! Noise Detection The breathing rate lies between 6 to 50 breaths per minute that account to the breathing frequency of 0.16 Hz to 0.83 Hz. Normal breathing rate for adults, on the other hand, varies from 10 to 30 breaths per minute which is 0.16Hz to 0.30 Hz. A low pass filter is applied to the raw breathing sound data to remove low frequency sounds that are not related to the breathing events. The cutoff frequency of 0.9 Hz is selected because the most sound generated by breathing related events is below 0.9 Hz. 4.3! Noise Subtraction After detecting the noise frames, our system performs noise subtraction by passing the raw data through a low pass filter with a cut-off frequency of about 0.9 Hz. Specifically, let {rˆ(l), 0 ≤ l ≤ N − 1} be a sequence of breathing sound samples after filtering and {n(l),0 ≤ l ≤ N − 1} be the noise that has been added to the clean breathing sound signal {r(l),0 ≤ l ≤ N − 1}. Their relationships thus can be represented as {rˆ(l) = r(l) + n(l),0 ≤ l ≤ N − 1}. Taking the Fourier transform, we have: Rˆ(ejw) = R(ejw) + N(ejw) where Rˆ(ejw), R(ejw) and N(ejw) denote the Fourier transform of sequence rˆ(l), r(l) and n(l), respectively. To estimate the frequency spectrum of the breathing sound R(ejw), we can estimate the noise magnitude spectrum N(ejw) and then subtract it from the spectrum of the recorded acoustic data. This is done by passing the data through a low pass filter with a cut-off frequency of 0.9 Hz. R(ejw) = R^(ejw) - N(ejw) The cleaned breathing sound signal {r(l), 0 ≤ l ≤ N − 1} is obtained by after taking the Inverse Fourier transform on R(ejw). Now the clean breathing sound signal after Inverse Fourier transform is further fed into peak detection algorithm to estimate the respiration rate on the clean breathing sound signal.

! 14!
Chapter 5!!
Experiment Evaluation!!In this section, we conduct experiments on subjects of varying genders and age groups in different noisy settings to assess the usefulness and accuracy of the technique purposed. The subsequent subsections provide with the details of the experiments performed. !!5.1! Data Acquisition The data was collected from 15 healthy people that consisted of 8 males and 10 females of an age group ranging from 10 to 50 years. Data were collected when the people were relaxed and sitting in an upright comfortable position by fixing the headset microphone beneath the nose so that the headphone doesn’t get displaced during the experiment. It was ensured there was no discomfort to the subject because of the placement of microphone. To determine the true respiration rate, the subjects were asked to record inhale and exhale point by using the Android application on Moto X. They had to press the inhale button after they have inhaled and similarly press the exhale button after they have exhaled. These reference values were stored in the smartphone memory and were used to judge the accuracy of the proposed method. Nasal breathing sound data was collected from the headset microphone with a sampling rate of 3.33 Hz and stored on the smartphone. Rather than storing the complete acoustic signal, amplitude of the power spectrum of nasal breathing sound was recorded. These digital values then passed through a low pass filter to remove the noise component. The clean data was further used for processing. All the subjects were asked to breathe at their normal pace so as to capture their actual breathing rate. This helped in capturing the variability of breathing rate among people of varied age and sex. For each subject, reading for duration of 1 minute was taken for experiments.

! 15!
5.2! Experiment The experiments were conducted on subjects of varying age groups where the subject is asked to sit upright in a comfortable position, in a relaxed mode or sleep with the wearing the headset microphone beneath the nose. An Android smartphone along with its headphone of the sale’s package is used. The experiments were performed in quite as well as noisy environment. The Android application records the amplitude of the power spectrum of nasal breathing sound at a sampling rate of 3.33 Hz. 5.2.1!!Experiment based on Time Duration The subject was asked to wear the headphone beneath the nose for one minute as well as one-hour readings. The experiments were performed to test the accuracy and comfort for long run usage. 5.2.1.1!!One Hour Experiment
In this experiment the subject is asked to wear the headset microphone beneath the nose and when in a comfortable situation start the Android application and sleep with the device on. Then out of these one-hour samples, one-minute samples are randomly extracted. This data is passed through a low pass filter to remove noise and then methodology of mean with non-windowing is used to estimate the respiration rate. 5.2.1.2!!One Minute Experiment
In this experiment the subject is asked to sit in upright position and wear the headset microphone beneath the nose for one-minute reading. The user is allowed to breathe at their own pace. This helps in assessing the performance of the methodology on different breathing rates of varied subjects. To obtain the ground truth of breathing rate in the case of one minute experiment, user is asked to press the Inhale and Exhale button on the Android application as explained in Section 3.2. The ground truth is then calculated by

! 16!
the summation of number of inhale-exhale pairs entered by the user. Fig 3.2 shows the plotted digital nasal breath sound with calculated breath points and user pressed inhale-exhale windows. Here the circles depicts the transition from inhale period to exhale period. Green line depicts the average of the amplitude that is used as the threshold. Black cross depicts inhale point and pink cross depict exhale point as entered by the user on the Android application. 5.2.2! ! Experiment based on Sampling Frequency and Battery Consumption 5.2.2.1!!Estimating Sampling Frequency
One minute experiments were performed by varying the sampling frequency. Data were collected when the people were relaxed and sitting in an upright comfortable position by fixing the headset microphone beneath the nose. The sampling frequencies on which the experiment was performed were varied from 0.55Hz to 50 Hz. These experiments were performed by recording five datasets for each sampling rate to figure out the optimal sampling rate. As can be seen from the Fig 5.1, the sampling rate of 3.33 Hz performs the best in all the five datasets. The sampling rate of 3.33Hz is considered optimal for further experiments. As the sampling rate is increased, there is a slight drop in the performance of the technique. This happens because the nasal breath sound is faint and background noise is random. Estimation of respiration rate involves inhale period, which has predominantly background noise as there is generally no inhale noise, followed by exhale period, which is a combination background noise and exhale noise. Using a high sample rate captures a wider bandwidth, which captures more background noise. While on the other hand capturing the data with optimal sampling rate works in a similar way to average several adjacent samples into one sample, in turn reducing the effect of background noise.

! 17!
Figure 5.1 Bar chart comparing the performance of sampling rate on the evaluation metrics of precision and recall. 5.2.2.2!!Sampling Rate and Battery Consumption
To estimate the battery consumption of the application, the application was run for a duration of one hour on smartphone Moto X. The power consumption was recorded using an application Power Tutor [24]. The results show that battery consumption for all the sampling rates didn’t degrade the performance of the smartphone. Table 5.1 depicts the one hour reading of battery consumption by varying the sampling rate.

! 18!
TABLE 5.1. COMPARISON OF PERFORMANCE OF SAMPLING RATE WITH BATTERY CONSUMPTION
Battery Consumption/ Sampling Rate 3.33 Hz 5 Hz 10 Hz 20 Hz 50 Hz
Percentage of average power consumption 4.1% 4.4% 5.7% 9.6% 9.6%
Average power 40 mW 61mW 83mW 113mW 203mW
Total power consumption 134 J 221J 300J 411J 731J
Figure 5.2 Bar chart comparing the performance of sampling rate and its effect on battery consumption on the evaluation metrics of precision and recall. As can be seen from Figure 5.2, the battery consumption is scaled down to a scale of 2. The performance of sampling rate 3.33 Hz in terms of precision-recall is optimal and has minimal battery consumption.

! 19!
5.2.3!!Experiment based on Breathing Rate One minute experiments were performed on the user, where the user was asked to sit in upright position and wear the headphone beneath the nose. These experiments were performed to evaluate the performance of the technique by changing the breathing rate. The user was asked to breathe in fast or panting, normal and slow or breathlessness modes. Table 5.2, shows that the respiration rate estimation technique performs satisfactorily for different breathing rate. TABLE 5.2, COMPARISON OF PERFORMANCE OF BREATHING RATE USING PRECISION RECALL AS THE EVALUATION METRIC.
Technique/ Dataset
Normal Slow Fast
Dataset 1 Dataset 2 Dataset 1 Dataset 2 Dataset 1 Dataset 2
True Positive
17 19 12 12 24 25
False Positive
2 3 0 0 0 0
True Negative
0 0 0 0 0 0
False Negative
1 0 0 0 1 0
Precision 0.89 0.86 1 1 1 1
Recall 0.94 1 1 1 0.95 1
5.2.4!!Experiment by varying the Gender and Age Group One minute experiments were performed on the user, where the user was asked to sit in upright position and wear the headphone beneath the nose. Breathing rate varies with sex and age group. These experiments were performed to

! 20!
evaluate the performance of the technique by changing the sex and the age group. The user was asked to breathe at normal rate. Table 5.3, shows that the respiration rate estimation technique performs satisfactorily for different sex and age group. TABLE 5.3 COMPARISON OF PERFORMANCE OF BREATHING RATE ON DIFFERENT SEX AND AGE GROUP USING PRECISION RECALL AS THE EVALUATION METRIC.
Age/Technique
10+ yrs 25+yrs 35+yrs
Male Female Male Female Male Female
True Positive 16 15 11 16 14 13
False Positive 2 2 1 1 1 1
True Negative 0 0 0 0 0 0
False Negative 0 3 0 2 1 1
Precision 0.88 0.88 0.91 0.94 0.93 0.92
Recall 1 0.83 1 0.88 0.93 0.92
5.2.5! Experiment based on different Smartphone and Microphone sensitivity. One minute experiments were performed on the user, where the user was asked to sit in upright position and wear the headphone beneath the nose. These experiments were performed to evaluate the performance of the technique by changing the smartphone. The user was asked to breathe at normal rate.

! 21!
Five smartphones of different configuration and brand were examined with three microphones of different sensitivity. The microphone used was Bluetooth-enabled hands-free, in box mobile handset microphone and JBL microphone.
a) Smartphone Handset- Lenovo
TABLE 5.4 COMPARISON OF PERFORMANCE OF BREATHING RATE ON DIFFERENT MICROPHONE FOR SMARTPHONE LENOVO USING PRECISION RECALL AS THE EVALUATION METRIC.
Evaluation/Dataset
JBL Motorolla Sony Bluetooth Handsfree
Dataset 1
Dataset 2
Dataset 3
Dataset 1
Dataset 2
Dataset 3
Dataset 1
Dataset 2
Dataset 3
True Positive 15 17 16 16 15 15 12 15 17
True Negative 0 0 0 0 0 0 0 0 0
False Positive 7 0 0 0 7 5 6 8 5
False Negative 0 0 0 0 2 2 4 4 3
Precision 0.68 1 1 1 0.68 0.75 0.66 0.65 0.77
Recall 1 1 1 1 0.88 0.88 0.75 0.78 0.85

! 22!
b) Smartphone Handset- Moto X
TABLE 5.5 COMPARISON OF PERFORMANCE OF BREATHING RATE ON DIFFERENT MICROPHONE FOR SMARTPHONE MOTO X USING PRECISION RECALL AS THE EVALUATION METRIC
Evaluation/Dataset
JBL Motorolla Sony Bluetooth Handsfree
Dataset 1
Dataset 2
Dataset 3
Dataset 1
Dataset 2
Dataset 3
Dataset 1
Dataset 2
Dataset 3
True Positive 15 15 14 17 17 13 9 13 13
True Negative 0 0 0 0 0 0 0 0 0
False Positive 5 5 2 0 0 0 2 1 3
False Negative 1 0 0 0 0 5 4 3 6
Precision 0.75 0.75 0.87 1 1 1 0.81 0.92 0.81
Recall 0.93 1 1 1 1 0.72 0.69 0.81 0.68
c) Smartphone Handset- One Plus 3T
TABLE 5.6 COMPARISON OF PERFORMANCE OF BREATHING RATE ON DIFFERENT MICROPHONE FOR SMARTPHONE ONE PLUS 3T USING PRECISION RECALL AS THE EVALUATION METRIC
Evaluation/Dataset
JBL Motorolla Sony Bluetooth Handsfree
Dataset 1
Dataset 2
Dataset 3
Dataset 1
Dataset 2
Dataset 3
Dataset 1
Dataset 2
Dataset 3
True Positive 14 15 15 10 10 10 12 13 13
True Negative 0 0 0 0 0 0 0 0 0
False Positive 0 0 0 1 0 3 4 1 6
False Negative 0 0 0 3 4 6 2 4 5
Precision 1 1 1 0.90 1 0.76 0.90 0.92 0.68
Recall 1 1 1 0.76 0.71 0.62 0.76 0.76 0.72

! 23!
d) Smartphone Handset- Redimi
TABLE 5.7 COMPARISON OF PERFORMANCE OF BREATHING RATE ON DIFFERENT MICROPHONE FOR SMARTPHONE REDIMI USING PRECISION RECALL AS THE EVALUATION METRIC
Evaluation/Dataset
JBL Motorolla Sony Bluetooth Handsfree
Dataset 1
Dataset 2
Dataset 3
Dataset 1
Dataset 2
Dataset 3
Dataset 1
Dataset 2
Dataset 3
True Positive 17 18 17 16 16 17 15 16 15
True Negative 0 0 0 0 0 0 0 0 0
False Positive 0 0 0 0 0 0 3 2 2
False Negative 0 0 1 0 0 0 5 3 2
Precision 1 1 1 1 1 1 0.83 0.88 0.88
Recall 1 1 0.94 1 1 1 0.75 0.84 0.88
e) Smartphone Handset- Samsung
TABLE 5.8 COMPARISON OF PERFORMANCE OF BREATHING RATE ON DIFFERENT MICROPHONE FOR SMARTPHONE SAMSUNG USING PRECISION RECALL AS THE EVALUATION METRIC
Evaluation/Dataset
JBL Motorolla Sony Bluetooth Handsfree
Dataset 1
Dataset 2
Dataset 3
Dataset 1
Dataset 2
Dataset 3
Dataset 1
Dataset 2
Dataset 3
True Positive 18 18 18 18 33 18 17 16 17
True Negative 0 0 0 0 0 0 0 0 0
False Positive 0 0 0 8 4 2 3 2 3
False Negative 0 0 0 0 0 0 3 1 2
Precision 1 1 1 0.69 0.89 0.90 0.85 0.88 0.85
Recall 1 1 1 1 1 1 0.85 0.94 0.89

! 24!
Table 5.4-5.8, show that respiration rate estimation technique performs satisfactorily for different smartphones with microphones of different sensitivity. Bluetooth enabled hands-free microphone tends to perform the worst in comparison to other microphones because of its bulkier microphone which poses difficulty in placing beneath the nose and in turn causes high relative error rate. The stock Motorola microphone and the JBL microphone perform satisfactorily for all the handset. This shows that in the box microphone can be used for acceptable estimate of respiration rate, which in turn makes the device readily available with no extra investment. 5.2.6!Experiment in Noisy Environment People generally tend to sleep in quite environment but the background noise such as air conditioner, fan, nearby construction and etc. is inevitable. Since the breathing sound is faint, these background noises tend to get added to the breathing sound and distort the data. In order to evaluate the performance of the respiration rate estimation technique, the user is asked to record one minute normal breathing sound near and far from the subject of noise. The user will record the data sitting in comfortable upright position. Since background noise tends to be combination of various devices creating noise hence experiments are performed under different setting to ensure goodness of the technique. 5.2.6.1!Experiment based on different Noise Categories
One minute experiments are performed where the user is asked to breathe at the normal rate, sitting in upright comfortable position. In this section we will evaluate the performance of the technique by considering one noise-creating instance at a time. The user is asked to record the breathing sound by sitting just next to the noise-creating instance and at a distance from it. The noise creating categories picked up are those that tend to distort the breathing sound while the user is asleep. Five readings each of near and far from the noise creating instance are recorded.

! 25!
a) Noise Category- Air Conditioner
Air Conditioner is the most common device that is to be kept on during summers while the user is sleeping. To ensure that the technique performs satisfactorily, user is asked to record the breathing sound by sitting just next to air conditioner and at a required distance from air conditioner. Table 5.9 shows the performance of the respiration rate estimation technique on breathing sound recorded near and far from the air conditioner.
TABLE 5.9 COMPARISON OF PERFORMANCE OF BREATHING RATE USING NOISE CATEGORY AIR CONDITIONER USING PRECISION RECALL AS THE EVALUATION METRIC
Dataset /Metrics Near to the subject Far from the subject
1 2 3 4 5 1 2 3 4 5
True Positive 19 21 21 21 21 20 21 24 20 23
False Positive 0 0 0 0 1 0 0 0 0 0
True Negative 0 0 0 0 0 0 0 0 0 0
False Negative 1 0 0 0 0 0 1 1 1 0
Precision 1 1 1 1 0.94 1 1 1 1 1
Recall 0.95 1 1 1 1 1 0.95 0.96 0.95 1
b) Noise Category- Construction Noise
Construction happening in the adjacent building can contribute to breathing noise distortion or if the room in which user is asleep tends to have a window, that can cause a prominent effect of it on the breathing recording. To ensure that the technique performs satisfactorily, user is asked to record the breathing sound by sitting just next to construction noise and at a required distance from construction noise Table 5.10 shows the performance of the respiration rate estimation technique on breathing sound recorded near and far from the construction noise.

! 26!
TABLE 5.10 COMPARISON OF PERFORMANCE OF BREATHING RATE USING NOISE CATEGORY CONSTRUCTION NOISE USING PRECISION RECALL AS THE EVALUATION METRIC
Dataset /Metrics Far from the subject Near to the subject
1 2 3 4 5 1 2 3 4 5
True Positive 19 21 21 20 20 16 29 19 17 16
False Positive 0 0 0 0 0 0 0 2 1 0
True Negative 0 0 0 0 0 0 0 0 0 0
False Negative 2 1 0 2 1 2 5 1 1 3
Precision 1 1 1 1 1 1 1 0.90 0.94 1
Recall 0.90 0.95 1 0.92 0.95 0.88 0.85 0.95 0.94 0.84
c) Noise Category- Fan
Fan is the most common device that is to be kept on during summers while the user is sleeping. To ensure that the technique performs satisfactorily, user is asked to record the breathing sound by sitting just beneath the fan and at a required distance from fan. Table 5.11 shows the performance of the respiration rate estimation technique on breathing sound recorded near and far from the fan.

! 27!
TABLE 5.11 COMPARISON OF PERFORMANCE OF BREATHING RATE USING NOISE CATEGORY FAN USING PRECISION RECALL AS THE EVALUATION METRIC
Dataset /Metrics Near to the subject Far from the subject
1 2 3 4 5 1 2 3 4 5
True Positive 15 15 16 15 17 18 19 19 17 20
False Positive 1 1 1 0 0 0 0 0 1 0
True Negative 0 0 0 0 0 0 0 0 0 0
False Negative 3 4 0 1 0 0 0 0 0 0
Precision 0.93 0.93 1 1 1 1 1 1 0.94 1
Recall 0.83 0.83 0.94 0.93 1 1 1 1 1 1
d) Noise Category- Home Appliances
The room where the user tends to sleep might have home appliances surrounding the user. The home appliances tend to create a continuous sound while running. To ensure that the technique performs satisfactorily, user is asked to record the breathing sound by sitting just next to home appliance such as water cooler and at a required distance from water cooler. Table 5.12 shows the performance of the respiration rate estimation technique on breathing sound recorded near and far from the water cooler.

! 28!
TABLE 5.12 COMPARISON OF PERFORMANCE OF BREATHING RATE USING NOISE CATEGORY HOME APPLIANCES NOISE USING PRECISION RECALL AS THE EVALUATION METRIC
Dataset /Metrics Near to the subject Far from the subject
1 2 3 4 5 1 2 3 4 5
True Positive 17 18 17 17 18 18 21 21 22 22
False Positive 0 0 0 0 0 0 0 0 0 0
True Negative 0 0 0 0 0 0 0 0 0 0
False Negative 1 0 0 0 0 1 0 0 0 0
Precision 1 1 1 1 1 1 1 1 1 1
Recall 0.95 1 1 1 1 0.94 1 1 1 1
e) Noise Category- People Murmuring
People tend to sleep in quite room but there can be instances of people talking in the next room or just outside the window. These sound contribute in distorting the breathing sound. To ensure that the technique performs satisfactorily, user is asked to record the breathing sound by sitting just next to people murmuring and at a required distance from people murmuring. Table 5.13 shows the performance of the respiration rate estimation technique on breathing sound recorded near and far from the people talking.

! 29!
TABLE 5.13 COMPARISON OF PERFORMANCE OF BREATHING RATE USING NOISE CATEGORY PEOPLE MURMURING USING PRECISION RECALL AS THE EVALUATION METRIC
Dataset /Metrics Near to the subject Far from the subject
1 2 3 4 5 1 2 3 4 5
True Positive 15 16 18 18 20 14 17 19 16 18
False Positive 0 2 0 0 0 0 1 1 0 1
True Negative 0 0 0 0 0 0 0 0 0 0
False Negative 2 2 0 0 0 2 1 1 0 0
Precision 1 0.83 1 1 1 1 0.94 0.95 1 0.95
Recall 0.88 0.83 1 1 1 0.87 0.94 0.95 1 1
f) Noise Category- Traffic Noise
The user might be sleeping in a room just next to the road with running traffic. The continuous sound of faint traffic noise will not disturb the sleep but add to distortion of breathing sound data. To ensure that the technique performs satisfactorily, user is asked to record the breathing sound by sitting just next to a busy road and at a required distance from busy road. Table 5.14 shows the performance of the respiration rate estimation technique on breathing sound recorded near and far from the traffic noise.

! 30!
TABLE 5.14 COMPARISON OF PERFORMANCE OF BREATHING RATE USING NOISE CATEGORY TRAFFIC NOISE USING PRECISION RECALL AS THE EVALUATION METRIC
Dataset /Metrics Near to the subject Far from the subject
1 2 3 4 5 1 2 3 4 5
True Positive 16 17 17 20 22 19 17 17 22 23
False Positive 1 0 0 0 0 0 0 0 0 0
True Negative 0 0 0 0 0 0 0 0 0 0
False Negative 4 1 3 1 0 0 2 1 0 0
Precision 0.94 1 1 1 1 1 1 1 1 1
Recall 0.80 0.94 0.85 0.95 1 1 0.89 0.94 1 1
g) Noise Category- Television
People sleep in quite room but there can be instances of people watching television in the next room. These sound contribute in distorting the breathing sound. To ensure that the technique performs satisfactorily, user is asked to record the breathing sound by sitting just next to television and at a required distance from television. Table 5.15 shows the performance of the respiration rate estimation technique on breathing sound recorded near and far from the television.

! 31!
TABLE 5.15 COMPARISON OF PERFORMANCE OF BREATHING RATE USING NOISE CATEGORY TELEVISION USING PRECISION RECALL AS THE EVALUATION METRIC
Dataset /Metrics Near to the subject Far from the subject
1 2 3 4 5 1 2 3 4 5
True Positive 17 15 17 18 18 15 16 16 17 16
False Positive 3 1 0 0 0 2 0 0 0 0
True Negative 0 0 0 0 0 0 0 0 0 0
False Negative 0 2 1 2 0 1 0 0 0 0
Precision 0.85 0.93 1 1 1 0.93 1 1 1 1
Recall 1 0.88 0.94 0.90 1 0.88 1 1 1 1
5.2.6.2!Experiment based on different Noise Settings In the previous section, experiments were performed taking one noise-creating instance at a time. In real life scenario, there are multiple noise creating instances that affect the breathing sound together. To evaluate the goodness of the technique, different noisy settings were examined. These settings had multiple noise-creating instances that can distort the breathing sound data. The user was asked to wear the headset microphone beneath the nose and record the breathing sound at normal rate sitting in comfortable upright position. The duration of each recording was one minute and ten reading each at different settings was taken. Different settings are taken in mind such that all possible combination of noise creating instance that are likely to be found together are covered.
a) Noise Setting- Sitting Area The contributing noise instances in sitting area were fan, air conditioner and people talking at a distance. Such scenarios are possible while the user is asleep in his/her room with people talking in the next room. One minute data

! 32!
samples were recorded by the user sitting in upright comfortable position, breathing at normal rate. Ten such samples were recorded. Table 5.16 shows the performance of the technique in the noisy sitting area and Fig 5.3(a)-(b), shows the experimental setup.
(a) (b)
Figure 5.3(a),(b) Experimental setup of noisy sitting area. TABLE 5.16 COMPARISON OF PERFORMANCE OF BREATHING RATE USING NOISE SETTING SITTING AREA USING PRECISION RECALL AS THE EVALUATION METRIC
Dataset /Metrics
D1 D2 D3 D4 D5 D6 D7 D8 D9 D10
True Positive 15 16 17 16 15 17 18 19 17 13
False Positive 1 2 1 1 1 0 0 1 1 1
True Negative 0 0 0 0 0 0 0 0 0 0
False Negative 0 0 0 3 0 2 0 0 0 3
Precision 0.93 0.88 0.94 0.94 0.93 1 1 0.95 094 0.92
Recall 1 1 1 0.84 0.93 0.89 1 1 1 0.81
b) Noise Setting- Canteen The contributing noise instances in the canteen were distant people talking and fan noise. Such scenarios are possible while the user is asleep in his/her room just next to a busy street with people talking. One minute data samples

! 33!
were recorded by the user sitting in upright comfortable position, breathing at normal rate. Ten such samples were recorded. Table 5.17 shows the performance of the technique in the noisy canteen area and Fig 5.4, shows the experimental setup.
Figure 5.4 Experimental setup of noisy canteen area. TABLE 5.17 COMPARISON OF PERFORMANCE OF BREATHING RATE USING NOISE SETTING CANTEEN USING PRECISION RECALL AS THE EVALUATION METRIC
Dataset /Metrics D1 D2 D3 D4 D5 D6 D7 D8 D9 D10
True Positive 19 21 23 19 20 18 20 18 20 19
False Positive 0 0 0 0 0 0 0 0 0 0
True Negative 0 0 0 0 0 0 0 0 0 0
False Negative 1 1 0 0 0 0 1 1 1 1
Precision 1 1 1 1 1 1 1 1 1 1
Recall 0.95 0.95 1 1 1 1 0.95 0.94 0.95 0.95
! 34!
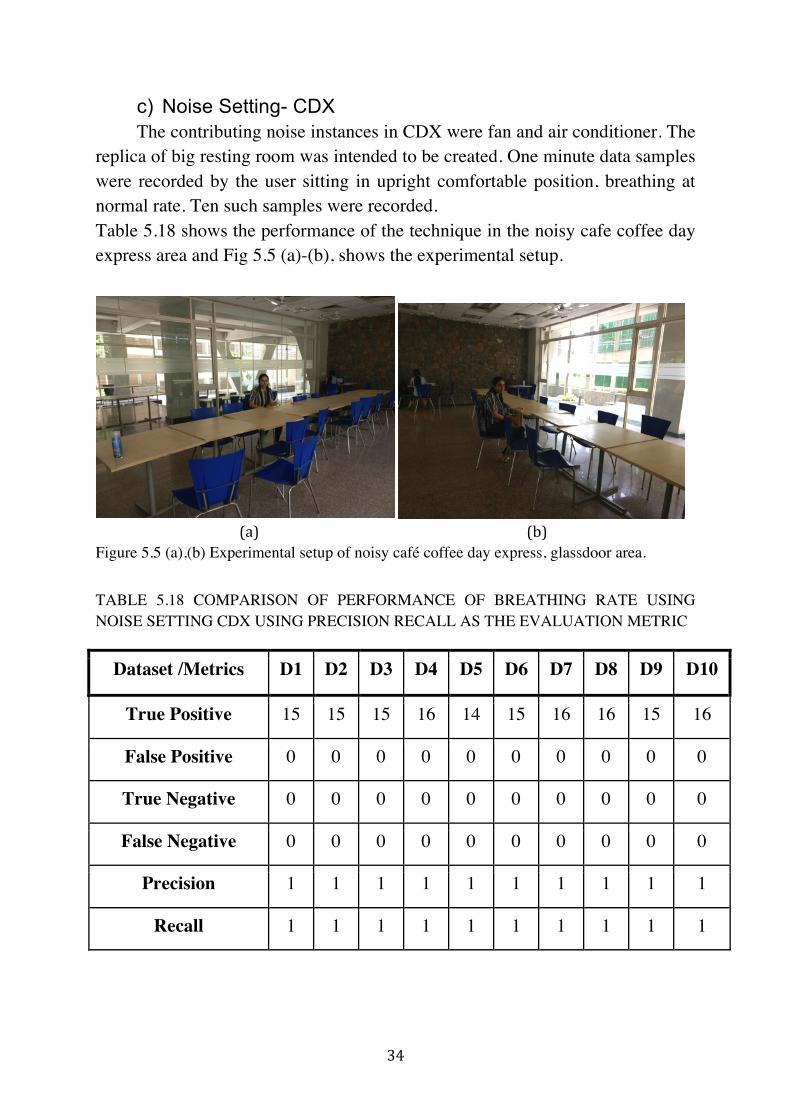
c) Noise Setting- CDX The contributing noise instances in CDX were fan and air conditioner. The replica of big resting room was intended to be created. One minute data samples were recorded by the user sitting in upright comfortable position, breathing at normal rate. Ten such samples were recorded. Table 5.18 shows the performance of the technique in the noisy cafe coffee day express area and Fig 5.5 (a)-(b), shows the experimental setup.
! !(a) (b)!
Figure 5.5 (a),(b) Experimental setup of noisy café coffee day express, glassdoor area. TABLE 5.18 COMPARISON OF PERFORMANCE OF BREATHING RATE USING NOISE SETTING CDX USING PRECISION RECALL AS THE EVALUATION METRIC
Dataset /Metrics D1 D2 D3 D4 D5 D6 D7 D8 D9 D10
True Positive 15 15 15 16 14 15 16 16 15 16
False Positive 0 0 0 0 0 0 0 0 0 0
True Negative 0 0 0 0 0 0 0 0 0 0
False Negative 0 0 0 0 0 0 0 0 0 0
Precision 1 1 1 1 1 1 1 1 1 1
Recall 1 1 1 1 1 1 1 1 1 1

! 35!
d) Noise Setting- Library The contributing noise instances in Library were fan and air conditioner. There were multiple air conditioners and fan working in library and the user was asked to record the breathing sound by sitting at a distance from the both noise instances. One minute data samples were recorded by the user sitting in upright comfortable position, breathing at normal rate. Ten such samples were recorded. Table 5.19 shows the performance of the technique in the noisy library area and Fig 5.6, shows the experimental setup.
Figure 5.6 Experimental setup of noisy library area. TABLE 5.19 COMPARISON OF PERFORMANCE OF BREATHING RATE USING NOISE SETTING LIBRARY USING PRECISION RECALL AS THE EVALUATION METRIC
Dataset /Metrics D1 D2 D3 D4 D5 D6 D7 D8 D9 D10
True Positive 17 17 19 21 19 19 21 23 21 21
False Positive 1 0 0 0 0 1 0 0 0 0
True Negative 0 0 0 0 0 0 0 0 0 0
False Negative 0 0 0 0 0 0 0 0 0 0
Precision 0.94 1 1 1 1 0.95 1 1 1 1
Recall 1 1 1 1 1 1 1 1 1 1

! 36!
e) Noise Setting- Lab
The contributing noise instances in Lab were appliance noise likely personal computer, fan and people murmuring. Since the lab is filled people working on computers, the user was asked to sit next to computer to record the breathing sound. One minute data samples were recorded by the user sitting in upright comfortable position, breathing at normal rate. Ten such samples were recorded. Table 5.20 shows the performance of the technique in the noisy lab area and Fig 5.7, shows the experimental setup.
Figure 5.7 Experimental setup of noisy lab area. TABLE 5.20 COMPARISON OF PERFORMANCE OF BREATHING RATE USING NOISE SETTING LAB USING PRECISION RECALL AS THE EVALUATION METRIC
Dataset /Metrics D1 D2 D3 D4 D5 D6 D7 D8 D9 D10
True Positive 16 15 17 18 17 18 18 19 19 20
False Positive 1 0 0 0 0 0 0 0 0 0
True Negative 0 0 0 0 0 0 0 0 0 0
False Negative 0 1 0 0 0 0 0 0 0 0
Precision 0.94 1 1 1 1 1 1 1 1 1
Recall 1 0.93 1 1 1 1 1 1 1 1

! 37!
f) Noise Setting- Park
The contributing noise instances in Park were application noise likely air purifier and construction noise. Park had air purifier installed along with construction happening at a distant. To get the influence of both the noise, the user was asked to sitting at a considerable distance from both the noise creating instances. One minute data samples were recorded by the user sitting in upright comfortable position, breathing at normal rate. Ten such samples were recorded. Table 5.21, shows the performance of the technique in the noisy park area. TABLE 5.21 COMPARISON OF PERFORMANCE OF BREATHING RATE USING NOISE SETTING PARK USING PRECISION RECALL AS THE EVALUATION METRIC
Dataset /Metrics D1 D2 D3 D4 D5 D6 D7 D8 D9 D10
True Positive 18 19 21 21 20 15 14 14 20 18
False Positive 0 0 0 0 0 0 0 0 0 0
True Negative 0 0 0 0 0 0 0 0 0 0
False Negative 1 0 0 0 2 0 4 4 0 2
Precision 1 1 1 1 1 1 1 1 1 1
Recall 0.94 1 1 1 0.90 1 0.77 0.77 1 0.9
g) Noise Setting- Common Room The contributing noise instances in common room were air conditioner, fan and television noise. Such scenarios are possible while the user is asleep in his/her room that is next to the room where television is being watched. One minute data samples were recorded by the user sitting in upright comfortable position, breathing at normal rate. Ten such samples were recorded. Table 5.22 show the performance of the technique in the noisy common room area and Fig 5.8, shows the experimental setup.

! 38!
Figure 5.8 Experimental setup of noisy common room area. TABLE 5.22 COMPARISON OF PERFORMANCE OF BREATHING RATE USING NOISE SETTING COMMON ROOM USING PRECISION RECALL AS THE EVALUATION METRIC
Dataset /Metrics D1 D2 D3 D4 D5 D6 D7 D8 D9 D10
True Positive 15 19 17 17 18 17 16 18 19 19
False Positive 2 1 2 1 3 3 0 1 1 0
True Negative 0 0 0 0 0 0 0 0 0 0
False Negative 0 0 1 2 0 0 2 0 0 0
Precision 0.88 0.95 0.89 0.94 0.85 0.85 1 0.94 0.95 1
Recall 1 1 0.94 0.89 1 1 0.88 1 1 1
h) Noise Setting- Personal Room
The contributing noise instances in personal room were air conditioner and fan. The room was quite small with no outside noise. One minute data samples were recorded by the user sitting in upright comfortable position, breathing at normal rate. Ten such samples were recorded.

! 39!
Table 5.23 show the performance of the technique in the noisy personal room area. TABLE 5.23 COMPARISON OF PERFORMANCE OF BREATHING RATE USING NOISE SETTING PERSONAL ROOM USING PRECISION RECALL AS THE EVALUATION METRIC
Dataset /Metrics 1 2 3 4 5 6 7 8 9 10
True Positive 19 18 19 20 17 18 19 19 17 17
False Positive 0 0 0 0 2 0 0 0 2 0
True Negative 0 0 0 0 0 0 0 0 0 0
False Negative 0 0 0 0 0 0 0 0 0 0
Precision 1 1 1 1 0.89 1 1 1 0.89 1
Recall 1 1 1 1 1 1 1 1 1 1
i) Noise Setting- Reading Room The contributing noises in reading room were fan, air conditioner and people murmuring. The setting is similar to the scenario at home contributing people murmuring noise from an adjacent room or from the busy street with no vehicles. One minute data samples were recorded by the user sitting in upright comfortable position, breathing at normal rate. Ten such samples were recorded. Table 5.24 show the performance of the technique in the noisy common room area and Fig 5.9, shows the experimental setup.

! 40!
! !(a) (b)!
Figure 5.9 (a), (b) Experimental setup of noisy reading room area. TABLE 5.24 COMPARISON OF PERFORMANCE OF BREATHING RATE USING NOISE SETTING READING ROOM USING PRECISION RECALL AS THE EVALUATION METRIC
Dataset /Metrics D1 D2 D3 D4 D5 D6 D7 D8 D9 D10
True Positive 12 19 20 21 21 22 23 18 20 19
False Positive 0 0 0 0 0 0 0 0 0 0
True Negative 0 0 0 0 0 0 0 0 0 0
False Negative 5 0 1 1 0 0 0 0 0 1
Precision 1 1 1 1 1 1 1 1 1 1
Recall 0.70 1 0.95 0.95 1 1 1 0.94 1 0.95
5.3! Performance Metrics
Several metrics are used to evaluate the performance of the methodology used to estimate the respiration rate. These metrics are as follows:

! 41!
• Breathing rate error: This is the difference between the calculated breathing rate to that of the observed breathing rate normalized by observed breathing rate
• True Positive: The number of positive breath events captured by the methodology.
• False Positive: The number of negative breath events that were captured as positive breath events by the methodology.
• True Negative: The number of negative breath events i.e. absence of breath during that period, captured by the methodology.
• False Negative: The number of positive breath events that were captured as negative breath events by the methodology.
• Precision: The ratio of positive breath events that were reported positive to that of total positive breath events.
• Recall: The ratio of positive breathes events that were reported positive to that of sum of number of positive breath events that were reported positive and number of positive breath events that were captured as negative breath events.

! 42!
Chapter 6!!
Results In this section, evaluation of the breathing rate detection for different gender and age group is formulated. As already discussed in Section Four, about the impact of background noise and its effect on breathing sound data, hence the assessment of experiment performed in noisy environment are evaluated. Further, to make the technique robust, impact of smartphone and microphone sensitivity on technique’s performance is analyzed. 6.1! Accuracy and Overall Performance of Mean without Windowing Technique As it can be inferred from Fig 6.1, the overall performance of the mean without windowing methodology, in estimating the respiration rate over subjects of varying sex and age groups seems promising. It can be observed that the error rate lies between 5%-20% breaths per minute (bpm) percentage error, which is insignificant in medical terms as it only corresponds to a mismatch of 1-3 actual breaths [3]. In Fig 6.1 (e),(f), it can be observed that the overall performance of other techniques tends to have huge tradeoff in accuracy of estimating of respiration rate. This manifests that the mean without windowing methodology works effectively to estimate the respiration rate of various subjects under different respiration rate.
(a)

! 43!
(b)
(c)
(d)

! 44!
(e)
(f) Figure 6.1: Evaluation of techniques by varying the parameter A and B. Precision for (a) Male Dataset (b) Female Dataset, Recall for (c) Male Dataset (d) Female Dataset, Breathing Rate Error for (e) Male Dataset (f) Female Dataset. 6.2! Impact of Background Noise In this section, we analyze the performance of the technique while considering different noise creating instances individually and combined under different settings. As can be inferred from the figure 6.2, that the accuracy of breathing rate detection under different environments with noise instances individually and combined have promising results. It can be observed that the overall average

! 45!
breathing error rate remains about 1.1% to 9.6% for noisy setting and 2% to 14% for individual noise, which is comparable to that of the results performed in quite environment as discussed in Section 6.1. This shows that across all environments the respiration rate estimation system is able to eliminate noise and is robust to background noise.
(a)
(b) Figure 6.2: Evaluation of techniques by varying the noise conditions. Breathing Rate Error for (a) Noisy setting (b) Noise Creating instances individually.

! 46!
6.3 Impact of Smartphone configuration and sensitivity of Microphone In this section, the impact of smartphone configuration and sensitivity of microphone on the technique is evaluated. As can be observed from the figure 6.3 (a), the in-box Motorolla headset tends to perform satisfactorily. This shows that there is no need for additional cost to be put up on hardware as in box headset performs considerably well. On the other hand, the performance of Sony Bluetooth hands-free is less promising yet can be used as alternative. There is drop in performance because the microphone is bulky and cumbersome to wear beneath the nose. Fig 6.3 (b), depicts the performance of smartphone. As it can be inferred that techniques performance and accuracy doesn’t vary considerably with the smartphone configuration. This manifests that any smartphone can be used to report satisfactory estimate of respiration rate.
(a)

! 47!
(b) Figure 6.3: Evaluation of techniques by varying the smartphone configuration and microphone model. Breathing Rate Error for (a) Microphone Model (b) Smartphone Model 6.4 Battery Consumption and Storage Utilization Respiration rate caters to many medical applications such as sleep quality estimation. To system has to be device friendly in terms of storage utilization and battery consumption so as to facilitate long duration usage. As can be inferred from Section 5.2.2.2, that battery consumption is reasonably less and won’t have a toll on the battery life even if the system runs for 6-7 hours. In terms of storage utilization, the data recording is done at a frequency rate of 3.33Hz and data collection is in the form of text, which is the amplitude of the breathing sound. This ensures that privacy of the user is maintained as no audio recording is stored and at the same time it aids in less storage utilization.

! 48!
Chapter 7!
Conclusion In this thesis, methodology for reliably estimating the respiration rate with the help of headset microphone and smartphone is proposed. As there is a direct relationship between the airflow and breathing rate intensity [19], microphone is able to accurately estimate the respiration rate. This system provides a low cost, portable, user friendly and less intrusive solution at home to measure and analyze the breathing pattern without the use of external sensors, which further has many healthcare applications. The perspective of using a microphone to be able to estimate respiration rate, looks promising. We use Android smartphone Moto X with the headset microphone of the sale’s package for the estimation. As it can be seen that people are habitual of using headset before sleeping [1][2] so, it won’t cause much botheration to place the microphone beneath the nose for breath analysis. The sampling rate is 3.33 Hz for processing the nasal breath sound. The storage and battery consumption is less and the system the can last throughout the night without much of battery draining. There were experiments performed both during sleeping and while sitting in an upright comfortable way, over different genders and age groups to account for varied breathing rates. Environmental noise is inevitable and distorts the breathing sound data, so the reliability of the technique in different noisy settings was evaluated. The technique performed comparable in noise free and noisy environment, which shows that the effect of background noise on breathing sound data after filtering was minimal. As it can be seen from results that error of 10%-20%, which accounts for a mismatch of integer 1-3 breaths per minute is observed and can be ignored. With favorable results obtained from the system, smartphones with headset microphone can be used to measure the vital sign, without the use of external sensors.

! 49!
Bibliography [1] Lanaj, Klodiana, Russell E. Johnson, and Christopher M. Barnes. "Beginning the workday yet already depleted? Consequences of late-night smartphone use and sleep." Organizational Behavior and Human Decision Processes 124.1 (2014): 11-23. [2] Sarwar, Muhammad, and Tariq Rahim Soomro. "Impact of Smartphone’s on Society." European journal of scientific research 98.2 (2013): 216-226. [3] N. Patwari, J. Wilson, S. Ananthanarayanan, S. K. Kasera, and D. R. Westenskow, “Monitoring breathing via signal strength in wireless networks,” IEEE Transactions on Mobile Computing, 2013. [4] J. E. Shaw, N. M. Punjabib, J. P. Wildingc, K. G. M. Albertid, and P. Z. Zimmeta, “Sleep-disordered breathing and type 2 diabetes: A report from the international diabetes federation taskforce on epidemiology and prevention,” Diabetes research and clinical practice, 2008. [5] P. X. Braun, C. F. Gmachl, and R. A. Dweik, “Bridging the collaborative gap: Realizing the clinical potential of breath analysis for disease diagnosis and monitoring tutorial,” IEEE Sensors Journal, 2012. # [6] Young, Terry, et al. "The occurrence of sleep-disordered breathing among middle-aged adults." New England Journal of Medicine 328.17 (1993): 1230-1235. ## [7] Lyznicki, James M., et al. "Sleepiness, driving, and motor vehicle crashes." Jama 279.23 (1998): 1908-1913. # [8] A. Chesson et al. Practice parameters for the indications for polysomnography and related procedures. In Sleep, volume 20, pages 406–422, 1997. [9] S. Ancoli-Israel et al. The role of actigraphy in the #study of sleep and circadian rhythms. In Sleep, #volume 26, pages 342–392, 2003. #

! 50!
[10] Zeo. http://www.myzeo.com/sleep/. [11] Sleep tracker. http://www.sleeptracker.com/. # [12] T. Hao, G. Xing, and G. Zhou, “isleep: Unobtrusive sleep quality monitoring using smartphones,” in Proceedings of ACM Sensys, 2013. [13] Phillips G, Felix L, Galli L, Patel V, Edwards P. The effectiveness of M-health technologies for improving health and health services: a systematic review protocol. BMC research notes, vol. 3(1). 2010. p. 250. [14] Y. Nam, J. Lee, and K. Chon, “Respiratory Rate Estimation from the Built-in Cameras of Smartphones and Tablets,” Ann. Biomed. Eng., vol. 42, no. 4, pp. 885-898, 2014. [15] Burgos, Alfredo, et al. "Real-time detection of apneas on a PDA." IEEE Transactions on Information Technology in Biomedicine 14.4 (2010): 995-1002. [16] N. Patwari, J. Wilson, S. Ananthanarayanan, S. K. Kasera, and D. R. Westenskow, “Monitoring breathing via signal strength in wireless networks,” IEEE Transactions on Mobile Computing, 2013. [17] Rahman, Tauhidur, et al. "Dopplesleep: A contactless unobtrusive sleep sensing system using short-range doppler radar." Proceedings of the 2015 ACM International Joint Conference on Pervasive and Ubiquitous Computing. ACM, 2015. [18] G. Comtois, J. I. Salisbury, and Y. Sun, “A smartphone-based platform for analyzing physiological audio signals,” in Bioengineering Conference (NEBEC), 2012 38th Annual Northeast, 2012, pp. 69–70. [19] A. Yadollahi and Z. Moussavi, “Comparison of flow-sound relationship for different features of tracheal sound,” in Proceedings of IEEE EMBC, 2008. # [20] Watch Pat. http://www.itamar-medical.com/WatchPAT.html.

! 51!
[21] M. Rofouei, M. Sinclair, R. Bittner, T. Blank, N. Saw,G. DeJean, and J. Heron. A non-invasive wearable neck-cuff system for real-time sleep monitoring. In BSN, 2011. # [22] E. Hoque, R. Dickerson, and J. Stankovic. Monitoring body positions and movements during sleep using wisps. In Wireless Health, 2010. [23] F. Takatori, S. Yamamori, M. Inoue, S. Abe, and K. Miyasaka, “A novel mainstream capnometer system for non-intubated pediatric patients requiring oxygen administration,” in IEEE Eng Med Biol Soc, 2011. [24] Power Tutor. http://ziyang.eecs.umich.edu/projects/powertutor/