use of the niyama criterion to predict shrinkage...
TRANSCRIPT
1
Use of the Niyama Criterion To Predict Shrinkage-Related Leaks in High-Nickel
Steel and Nickel-Based Alloy Castings
Kent D. Carlson and Christoph Beckermann
Department of Mechanical and Industrial Engineering
The University of Iowa, Iowa City, IA 52242
Abstract
A common simulation output variable routinely used by foundries to detect solidification
shrinkage defects in steel castings is the Niyama criterion (Ny), which is defined as the local
thermal gradient divided by the square root of the local cooling rate. For sufficiently large
Niyama values, no shrinkage porosity forms. When the Niyama value decreases below a critical
value, Nymicro, small amounts of micro-shrinkage begin to form. As the Niyama value decreases
further, the amount of micro-shrinkage increases until it becomes detectable on a standard
radiograph. This transition occurs at a second critical value, Nymacro. The amount of shrinkage
porosity continues to increase as the Niyama criterion decreases below Nymacro. A previous study
by the present authors determined that Nymacro = 1.0 (°C-s)1/2
/mm for nickel-based alloys M30C,
M35-1 and CW12MW, and for austenitic stainless steel type CN7M. The purpose of the present
study is to develop a tool to predict micro-shrinkage in high-nickel alloys by determining Nymicro.
This is accomplished by performing metallographic analyses on two case study castings (a
CN7M valve and a M35-1 valve) in which leakage occurred. In both cases the pouring and
solidification of these castings was simulated, and careful comparisons were made to correlate
the resulting Niyama criterion values to regions containing micro-porosity (and macro-porosity).
The results indicate that the Niyama criterion is capable of predicting the probability of leakage
due to interconnected macro- and/or micro-shrinkage porosity. The case studies indicate that
macro-shrinkage (visible on a radiograph) may be present in casting regions with Ny < Nymacro =
1.0 (°C-s)1/2
/mm, which validates previous research. More importantly, these case studies
indicate that noticeable amounts of micro-shrinkage may be present in casting regions with Ny <
Nymicro = 2.0 (C-s)1/2
/mm. These results imply that leaks in high-nickel alloy castings can be
prevented by ensuring that simulated Niyama values are above 2.0 (C-s)1/2
/mm. This does not,
however, imply that one should attempt to keep Ny > 2.0 (C-s)1/2
/mm throughout the casting.
While that may be possible, it may be impractical and expensive to ensure such a high level of
soundness throughout the casting. For the purpose of preventing leaks, it is only necessary to
ensure that there not be a potential “pathway” of shrinkage porosity (micro- and/or macro-
porosity) that leads from the inside to the outside of a fluid-containing casting.
2
Introduction
Leaks in fluid-containing castings (e.g., valves, pumps, etc.) are a major cause of
unscheduled and costly shutdowns for users and a lesser cause of casting rejections at the
foundry or equipment manufacturer. Such leaks may be caused by macro-shrinkage (visible
solidification shrinkage, which may be detected by common radiographic techniques), micro-
shrinkage (solidification shrinkage that is not visible on a standard radiographic film), other
casting features, or some combination of these causes. If a leak is the result of macro-shrinkage,
it may be detected by radiography. In this case, the shrinkage causing the leak is frequently
eliminated through the use of additional risers and/or chills. Such procedures lower the casting
yield and increase rigging cost. Industry standards for radiography produce radiographs with 2%
sensitivity. This implies, for example, that for a defect to be detectable on a radiograph of a 2.54
cm (1 in) thick section, the defect must correspond to a lost-section thickness of at least 0.5 mm
(0.020 in). Smaller shrinkage will not be detected via radiography. If a leak is caused by such
micro-shrinkage, it is often only detected after machining operations or during pressure testing.
In the worst case, a micro-shrinkage-related leak may not be detected until after the casting has
been placed in service, increasing costs to both the foundry and the end user. Present risering
rules are primarily intended to prevent macro-shrinkage detectable by radiographic testing; little
is known about proper risering procedures to prevent micro-shrinkage. A review of risering rules
for steel castings is given in Carlson et al.[1]
Over the course of about the past quarter-century, foundries have begun to rely increasingly
upon casting simulation software to predict and improve casting quality. A common simulation
output variable routinely used by foundries to detect solidification shrinkage defects in steel
castings is known as the Niyama criterion[2]
. The Niyama criterion is defined as the local thermal
gradient divided by the square root of the local cooling rate (i.e., TGNy = ). Common units
for the Niyama criterion are (C-s)1/2
/mm, (C-min)1/2
/cm and (F-min)1/2
/in; the relationship
between these units is 1.0 (C-s)1/2
/mm = 1.29 (C-min)1/2
/cm = 4.40 (F-min)1/2
/in. The Niyama
criterion is evaluated near the end of solidification, when solidification shrinkage forms. In the
present study, the Niyama values are evaluated at a temperature 10% of the solidification range
above the 100% solid (i.e., solidus) temperature; i.e., ( )solliqsolNy TTTT += 1.0 . This is important
to note, as the choice of Niyama evaluation temperature can significantly influence the resulting
Niyama values[3]
.
The relationship between shrinkage porosity and the Niyama criterion is shown
schematically in Fig. 1. For sufficiently large Niyama values, no shrinkage porosity forms. When
the Niyama value decreases below a critical value, Nymicro, small amounts of micro-shrinkage
begin to form. As the Niyama value decreases further (note the log scale on the x-axis), the
amount of micro-shrinkage increases until it becomes detectable on a standard radiograph. This
transition occurs at a second critical value, Nymacro. The amount of shrinkage porosity continues
to increase as the Niyama criterion decreases below Nymacro. It should be emphasized that the
Niyama criterion only predicts feeding-distance related shrinkage; it does not explicitly predict
hot spots in a casting, and it does not predict gas porosity.
A previous study by the present authors[4]
determined the value of Nymacro for nickel-based
alloys M30C, M35-1 and CW12MW, and for austenitic stainless steel type CN7M, using a

3
combination of casting experiments and simulation. For these four high-nickel alloys, end-
risered plates with a thickness of 2.54 cm (1 in) were cast in a variety of lengths, to produce
levels of casting soundness ranging from very sound to extremely unsound (i.e., extensive
centerline shrinkage). All of these plates were then radiographed. The casting of these plates was
simulated using recorded casting data, and the simulated Niyama values were compared to the
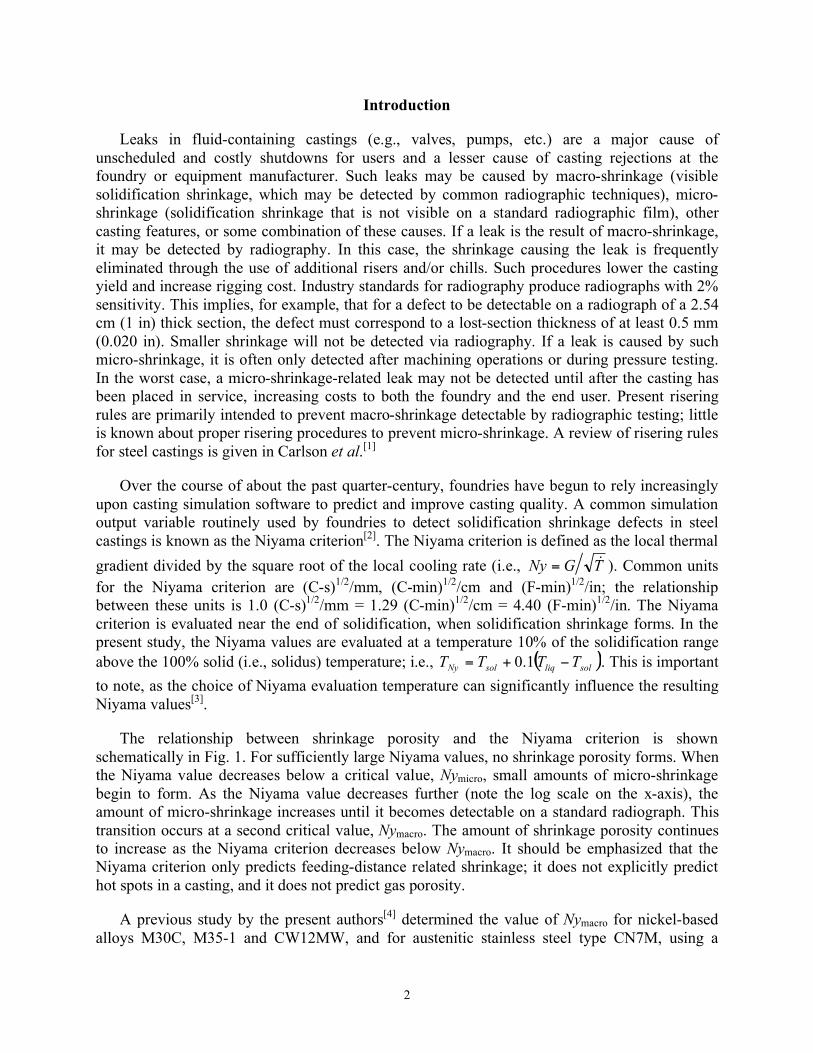
plate radiographs. A sample comparison is shown for a CN7M plate in Fig. 2. Note the
correlation between visible shrinkage porosity in the radiograph and low Niyama values (blue
regions) in the simulation results. Based on these comparisons, it was determined that the critical
Niyama value for macro-shrinkage for these high-nickel alloys is Nymacro = 1.0 (C-s)1/2
/mm.
Casting leaks caused by macro-porosity can be detected with radiography, and they can be
predicted using the Niyama criterion as described above. However, leaks caused by micro-
porosity cannot be detected by either of these methods. The purpose of the present study is to
develop a tool to predict micro-shrinkage in high-nickel alloys by determining Nymicro, as
depicted in Fig. 1. This is accomplished by performing metallographic analyses on two case
study castings in which leakage occurred, simulating the pouring and solidification of these
castings1, and making careful comparisons to correlate the resulting Niyama criterion values to
regions containing micro-porosity (and macro-porosity).
1 The simulations performed for this study were conducted using the casting simulation software package
MAGMASOFT[5]
. A wide variety of simulation packages are commercially available, and most of them calculate
the Niyama criterion. A recent round-robin study conducted by the present authors[3]
directly compared Niyama
results generated with different simulation packages.
log10(Ny)
Pore Volume (%)
0
micro-shrinkage
macro-shrinkage
Nymicro Nymacro
Fig. 1 Schematic illustrating the relationship between shrinkage porosity volume and the
Niyama criterion.
4
Case Study 1
The first case study is an investment cast alloy M35-1 valve. Eight valves, all the same model
and poured from the same heat, were shipped from the foundry to a customer. One of these eight
valves leaked during the customer’s pressure test, and was returned to the foundry. Photographs
of this valve are shown in Fig. 3. The inner diameter (ID) and outer diameter (OD) sides of the
leak are indicated in Fig. 3b. When the foundry recovered the valve, a section containing the leak
was cut from the valve for metallographic analysis. The location of this section is indicated by
interrupted lines in Fig. 3b. Photographs of the OD of the extracted section containing the leak
are provided in Fig. 4. These photographs show that the leak exit appears to be macro-shrinkage,
and that the exit location is about 1 mm (0.039 in) from the valve mid-plane. In addition to
obtaining a metallographic analysis of the leaking section, the present researchers also obtained
metallographic analyses of five additional regions. The location of the leaking region and the
measured x-ray level 3
(b) (a)
Fig. 2 Comparison between (a) experimental and (b) simulated results for a 1”T x 8”W x
16”L (2.54 x 20.3 x 40.6 cm) CN7M plate casting with a 4” (10.2 cm) diameter riser.
The radiograph in (a) was rated x-ray level 3; the red circle denotes the region of the
radiograph with visible shrinkage. The Niyama contours shown in (b) are taken at the
plate mid-plane.

5
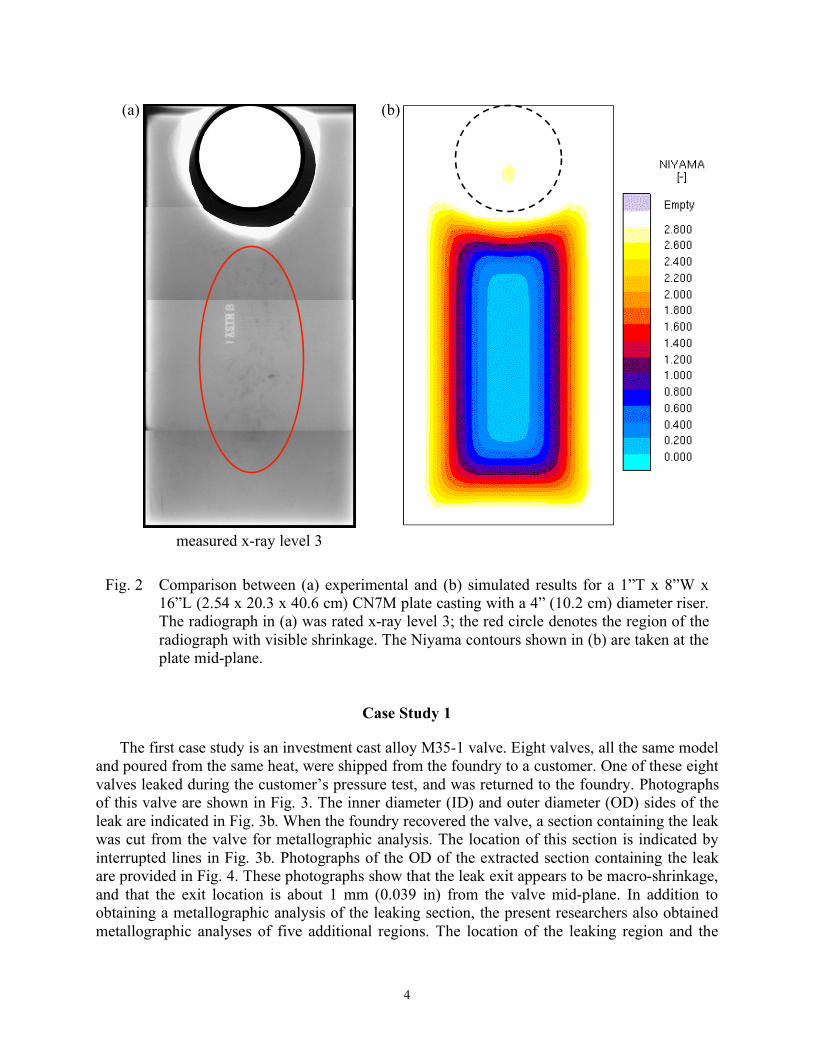
five additional regions are indicated in Fig. 5, which is a photograph of the valve sectioned at the
mid-plane.
The investment casting process for this valve was simulated using casting data that was
supplied by the foundry. For the simulation, the valve and gating assembly (not shown for
proprietary reasons) was coated with a 10 mm (0.39 in) thick shell coating using a shell
generation option in the casting simulation software. The pouring temperature for the simulation
was taken as 1450 C (2642 F), and the pouring time was 7 s. The initial temperature of the shell
Fig. 4 Photographs of the OD surface of the section containing the leak that was cut from
the valve: (a) a view of the entire thickness of the cut section; and (b) a close-up of
the leak exit location. The dashed rectangle in (a) indicates the area shown in (b). The
vertical surface on the right of these photographs corresponds to the valve mid-plane.
1 mm (b)
b
leak exit location (a)
leak
exit
metallographic sample location
leak
exit ID OD
(b) (a)
Fig. 3 Photographs of the M35-1 valve, indicating the leak exit location: (a) valve side view;
and (b) valve bottom view, showing the leak exit location and indicating with dashed
lines the size of the sample cut from the valve to analyze the leaking section.
6
in the simulation was set to 800 C (1472 F), to account for the shell preheat provided by the
foundry. The alloy was modeled using a M35-1 material database developed by the present
researchers[4]
. According to the foundry, their shell was primarily fused silica sand. Two sand
mold databases provided with the casting simulation software were considered to model this
shell: a database for dry silica sand and a database called ‘shell sand’. Simulations were run
using both of these sand databases; the Niyama values in the regions of interest were slightly
lower (up to about 0.2 (C-s)1/2
/mm lower) with the dry silica sand database than with the shell
sand database, so the dry silica sand database was selected because it provided the more
conservative estimate of the two databases. The insulating sleeve around the pouring cup was
modeled with properties supplied by the sleeve manufacturer. The interfacial heat transfer
coefficient (HTC) between the metal and the shell was taken as a constant value of 1000 W/m2-K
(176 Btu/h-ft2-F). This value is very approximate; however, simulations were run varying the
HTC by a factor of two, and the difference in the resulting Niyama criterion values was
negligible. The HTCs between the insulating sleeve and the other components were taken from
HTC datasets supplied by the sleeve manufacturer. The simulation used a grid containing about
791,000 metal cells. It should be noted that there may be some inaccuracies in this investment
casting simulation, due to uncertainties in parameters such as the shell sand material properties
and the interfacial shell/metal heat transfer coefficient (as discussed above). Also, radiation
effects on the exterior surface of the shell are only approximately accounted for in the
simulation. However, parametric studies such as the ones described above indicate that the
resulting Niyama contours are relatively insensitive to these quantities.
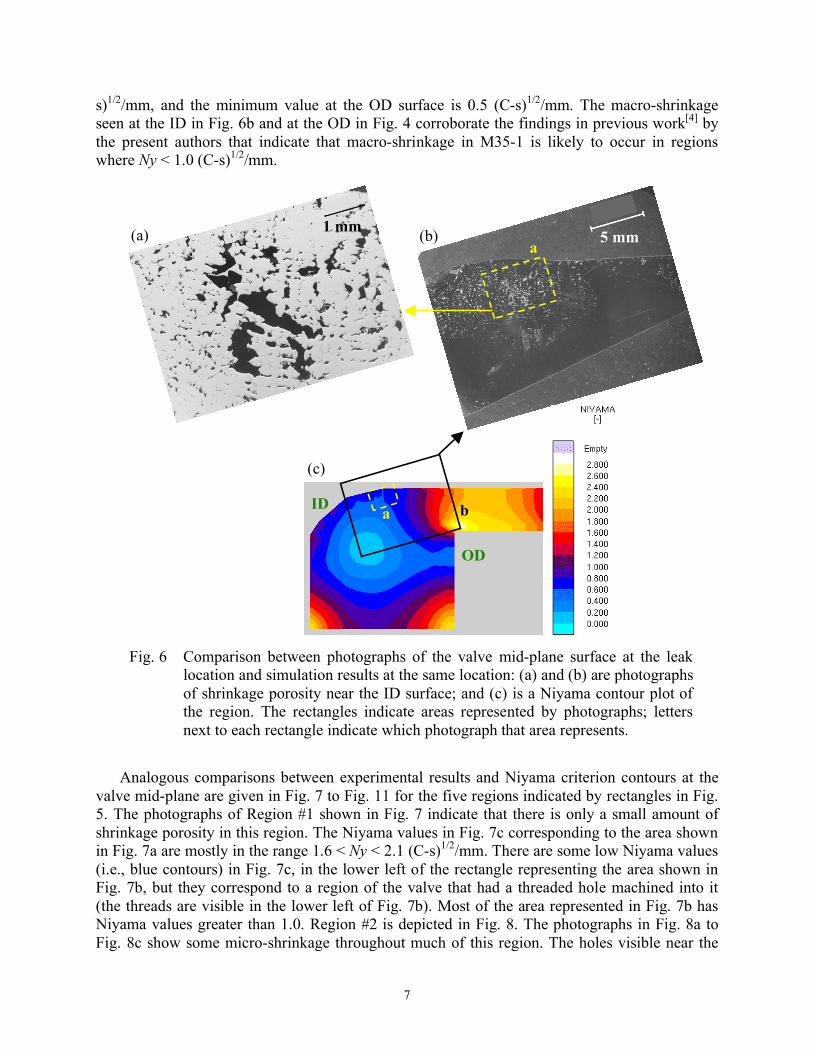
A comparison between experimental results and Niyama criterion contours at the valve mid-
plane in the vicinity of the leak (see Fig. 5) is given in Fig. 6. The rectangles with letters beside
them in this figure (and subsequent figures) indicate areas represented in the photographs
corresponding to that letter. Fig. 6a shows the dendritic nature of the features, confirming that
they are indeed shrinkage. Fig. 6b shows visible shrinkage porosity in the area of the ID of the
leak. The region showing considerable shrinkage in Fig. 6b corresponds to a region with Ny <
1.0 (C-s)1/2
/mm in Fig. 6c. The minimum Niyama value along the ID surface in Fig. 6c is 0.6 (C-
Fig. 5 Photograph of the valve after being sectioned at the mid-plane, indicating the location
of the leak as well as the five additional regions where metallographic examination
was performed.
2
4
5
3
1
leak
7
s)1/2
/mm, and the minimum value at the OD surface is 0.5 (C-s)1/2
/mm. The macro-shrinkage
seen at the ID in Fig. 6b and at the OD in Fig. 4 corroborate the findings in previous work[4]
by
the present authors that indicate that macro-shrinkage in M35-1 is likely to occur in regions
where Ny < 1.0 (C-s)1/2
/mm.
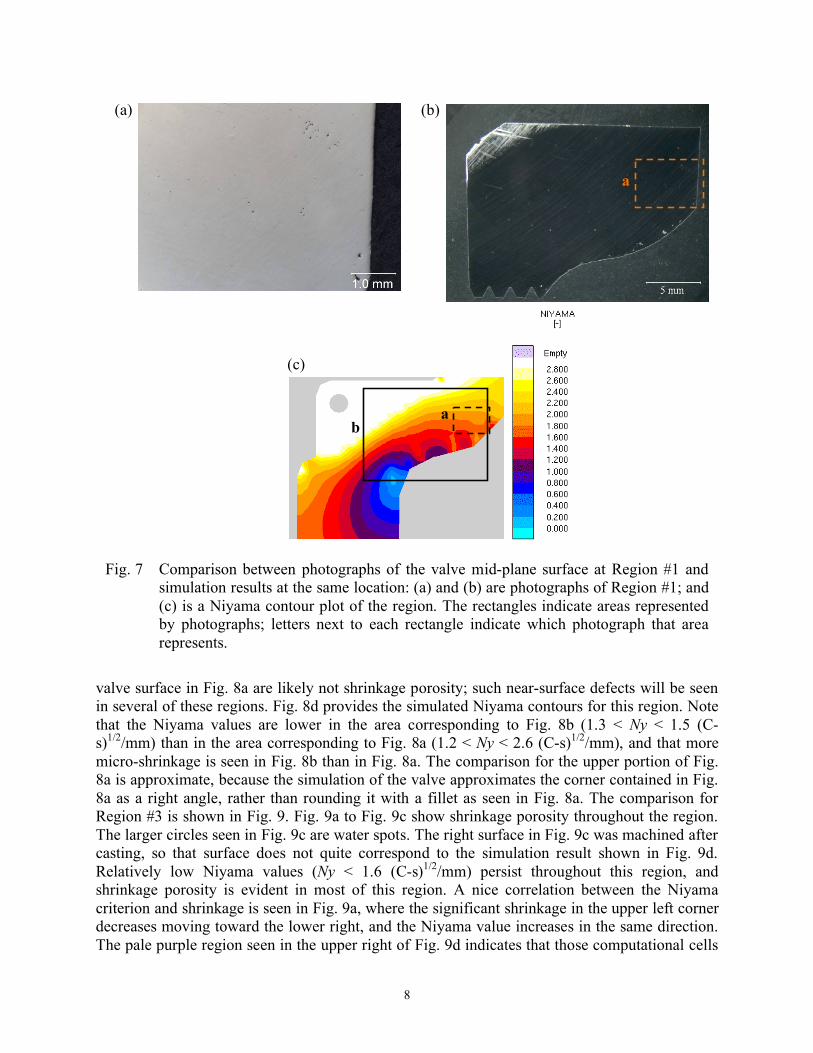
Analogous comparisons between experimental results and Niyama criterion contours at the
valve mid-plane are given in Fig. 7 to Fig. 11 for the five regions indicated by rectangles in Fig.
5. The photographs of Region #1 shown in Fig. 7 indicate that there is only a small amount of
shrinkage porosity in this region. The Niyama values in Fig. 7c corresponding to the area shown
in Fig. 7a are mostly in the range 1.6 < Ny < 2.1 (C-s)1/2
/mm. There are some low Niyama values
(i.e., blue contours) in Fig. 7c, in the lower left of the rectangle representing the area shown in
Fig. 7b, but they correspond to a region of the valve that had a threaded hole machined into it
(the threads are visible in the lower left of Fig. 7b). Most of the area represented in Fig. 7b has
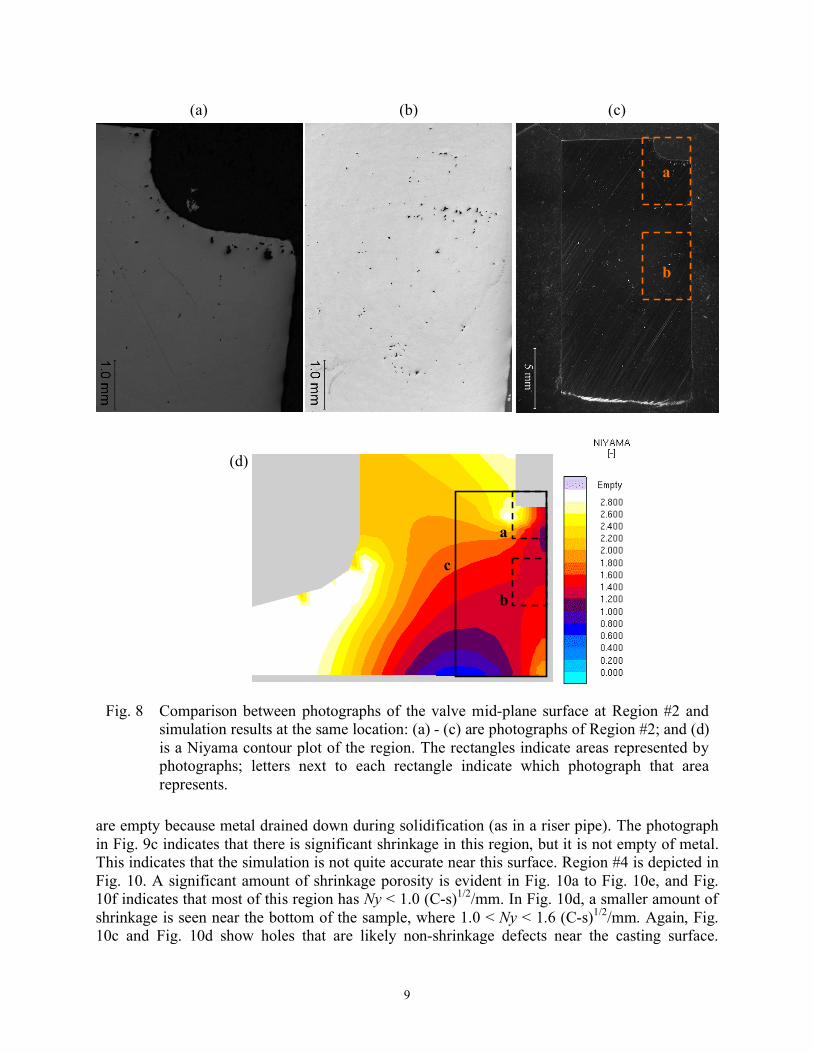
Niyama values greater than 1.0. Region #2 is depicted in Fig. 8. The photographs in Fig. 8a to
Fig. 8c show some micro-shrinkage throughout much of this region. The holes visible near the
(a) 1 mm
(b) a
5 mm
(c)
OD
ID b a
Fig. 6 Comparison between photographs of the valve mid-plane surface at the leak
location and simulation results at the same location: (a) and (b) are photographs
of shrinkage porosity near the ID surface; and (c) is a Niyama contour plot of
the region. The rectangles indicate areas represented by photographs; letters
next to each rectangle indicate which photograph that area represents.
8
valve surface in Fig. 8a are likely not shrinkage porosity; such near-surface defects will be seen
in several of these regions. Fig. 8d provides the simulated Niyama contours for this region. Note
that the Niyama values are lower in the area corresponding to Fig. 8b (1.3 < Ny < 1.5 (C-
s)1/2
/mm) than in the area corresponding to Fig. 8a (1.2 < Ny < 2.6 (C-s)1/2
/mm), and that more
micro-shrinkage is seen in Fig. 8b than in Fig. 8a. The comparison for the upper portion of Fig.
8a is approximate, because the simulation of the valve approximates the corner contained in Fig.
8a as a right angle, rather than rounding it with a fillet as seen in Fig. 8a. The comparison for
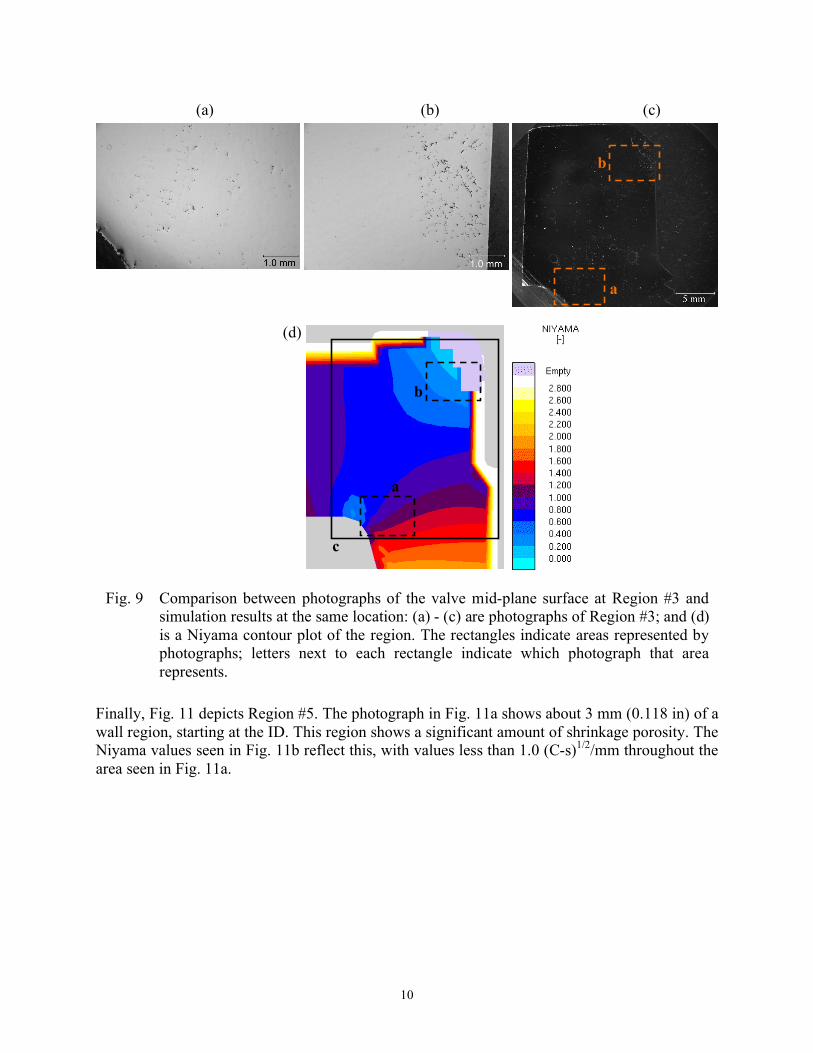
Region #3 is shown in Fig. 9. Fig. 9a to Fig. 9c show shrinkage porosity throughout the region.
The larger circles seen in Fig. 9c are water spots. The right surface in Fig. 9c was machined after
casting, so that surface does not quite correspond to the simulation result shown in Fig. 9d.
Relatively low Niyama values (Ny < 1.6 (C-s)1/2
/mm) persist throughout this region, and
shrinkage porosity is evident in most of this region. A nice correlation between the Niyama
criterion and shrinkage is seen in Fig. 9a, where the significant shrinkage in the upper left corner
decreases moving toward the lower right, and the Niyama value increases in the same direction.
The pale purple region seen in the upper right of Fig. 9d indicates that those computational cells
a b
(c)
(a) (b)
a
Fig. 7 Comparison between photographs of the valve mid-plane surface at Region #1 and
simulation results at the same location: (a) and (b) are photographs of Region #1; and
(c) is a Niyama contour plot of the region. The rectangles indicate areas represented
by photographs; letters next to each rectangle indicate which photograph that area
represents.
9
are empty because metal drained down during solidification (as in a riser pipe). The photograph
in Fig. 9c indicates that there is significant shrinkage in this region, but it is not empty of metal.
This indicates that the simulation is not quite accurate near this surface. Region #4 is depicted in
Fig. 10. A significant amount of shrinkage porosity is evident in Fig. 10a to Fig. 10e, and Fig.
10f indicates that most of this region has Ny < 1.0 (C-s)1/2
/mm. In Fig. 10d, a smaller amount of
shrinkage is seen near the bottom of the sample, where 1.0 < Ny < 1.6 (C-s)1/2
/mm. Again, Fig.
10c and Fig. 10d show holes that are likely non-shrinkage defects near the casting surface.
Fig. 8 Comparison between photographs of the valve mid-plane surface at Region #2 and
simulation results at the same location: (a) - (c) are photographs of Region #2; and (d)
is a Niyama contour plot of the region. The rectangles indicate areas represented by
photographs; letters next to each rectangle indicate which photograph that area
represents.
(a) (b)
b
a
(c)
a
b
c
(d)
10
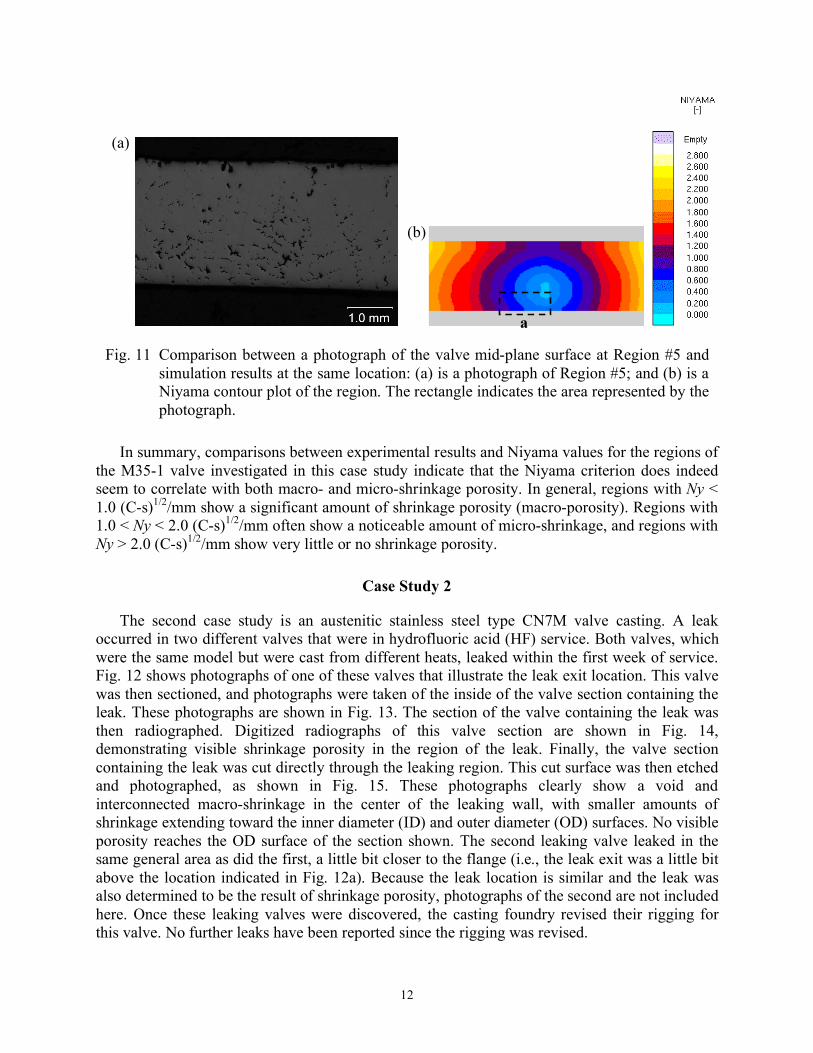
Finally, Fig. 11 depicts Region #5. The photograph in Fig. 11a shows about 3 mm (0.118 in) of a
wall region, starting at the ID. This region shows a significant amount of shrinkage porosity. The
Niyama values seen in Fig. 11b reflect this, with values less than 1.0 (C-s)1/2
/mm throughout the
area seen in Fig. 11a.
a
b
c
(d)
(a) (b)
b
a
(c)
Fig. 9 Comparison between photographs of the valve mid-plane surface at Region #3 and
simulation results at the same location: (a) - (c) are photographs of Region #3; and (d)
is a Niyama contour plot of the region. The rectangles indicate areas represented by
photographs; letters next to each rectangle indicate which photograph that area
represents.

11
(b) (a)
(d) (c)
b
a
(e)
c
d
(f)
a
b
c
d
e
Fig. 10 Comparison between photographs of the valve mid-plane surface at Region #4 and
simulation results at the same location: (a) - (e) are photographs of Region #4; and (f)
is a Niyama contour plot of the region. The rectangles indicate areas represented by
photographs; letters next to each rectangle indicate which photograph that area
represents.
12
In summary, comparisons between experimental results and Niyama values for the regions of
the M35-1 valve investigated in this case study indicate that the Niyama criterion does indeed
seem to correlate with both macro- and micro-shrinkage porosity. In general, regions with Ny <
1.0 (C-s)1/2
/mm show a significant amount of shrinkage porosity (macro-porosity). Regions with
1.0 < Ny < 2.0 (C-s)1/2
/mm often show a noticeable amount of micro-shrinkage, and regions with
Ny > 2.0 (C-s)1/2
/mm show very little or no shrinkage porosity.
Case Study 2
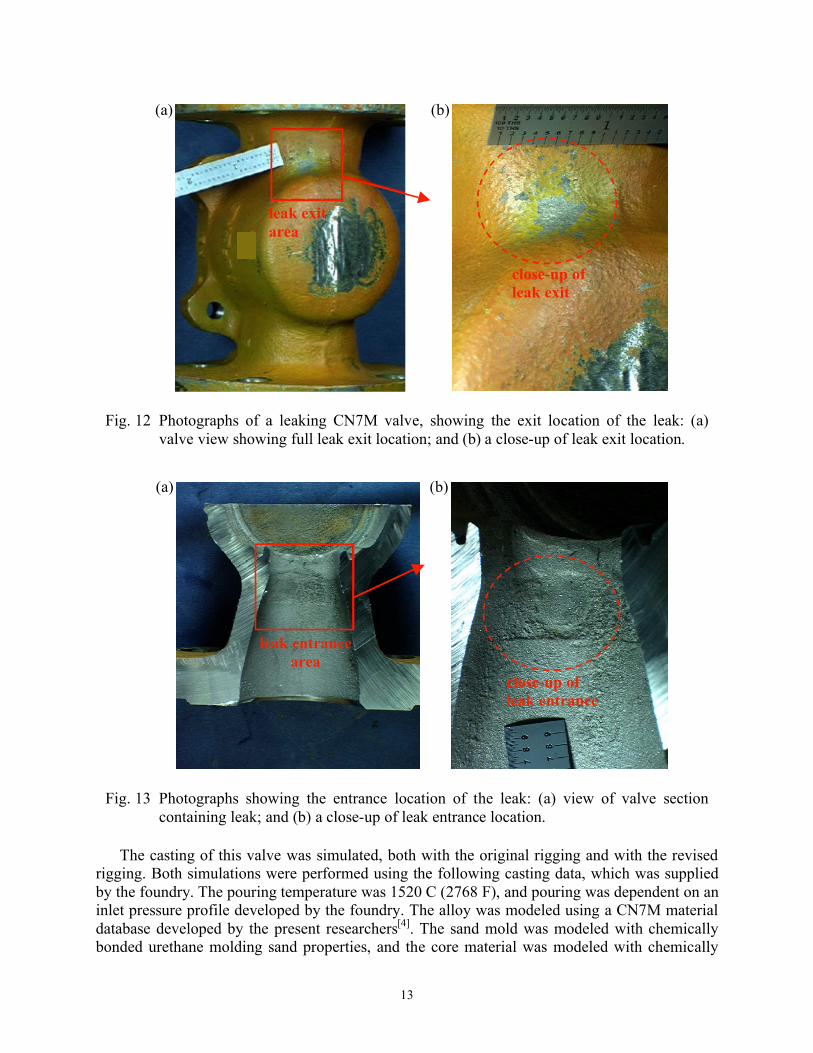
The second case study is an austenitic stainless steel type CN7M valve casting. A leak
occurred in two different valves that were in hydrofluoric acid (HF) service. Both valves, which
were the same model but were cast from different heats, leaked within the first week of service.
Fig. 12 shows photographs of one of these valves that illustrate the leak exit location. This valve
was then sectioned, and photographs were taken of the inside of the valve section containing the
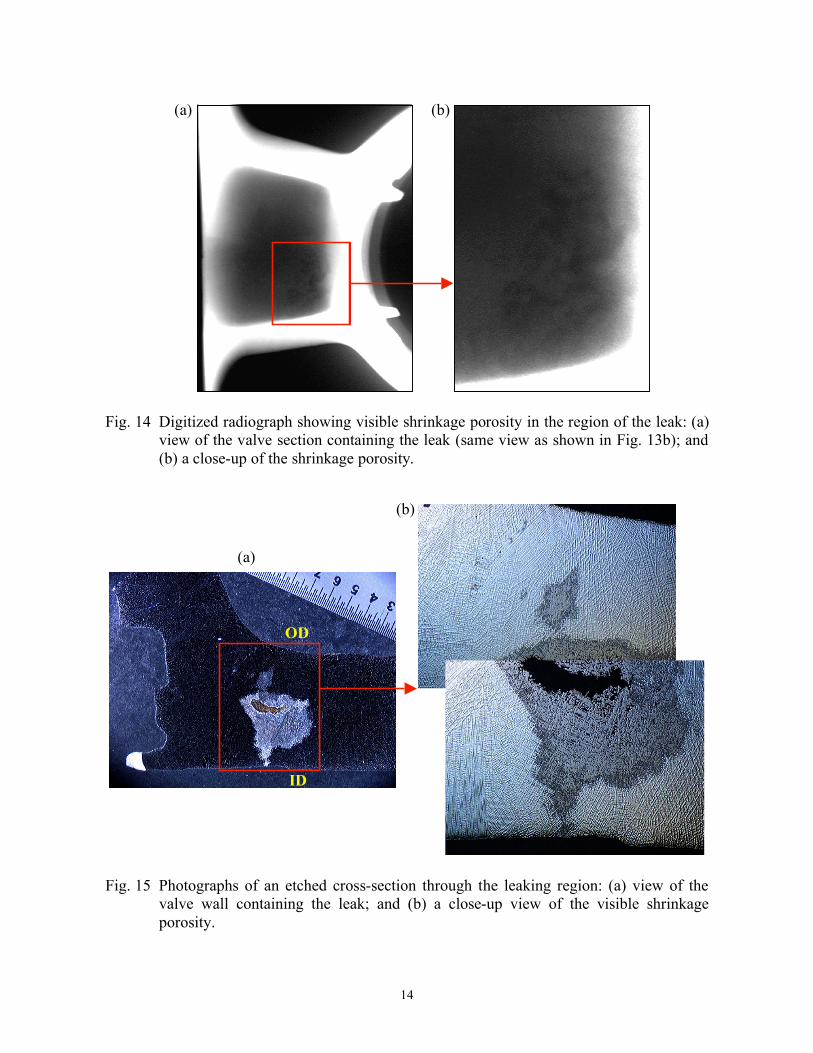
leak. These photographs are shown in Fig. 13. The section of the valve containing the leak was
then radiographed. Digitized radiographs of this valve section are shown in Fig. 14,
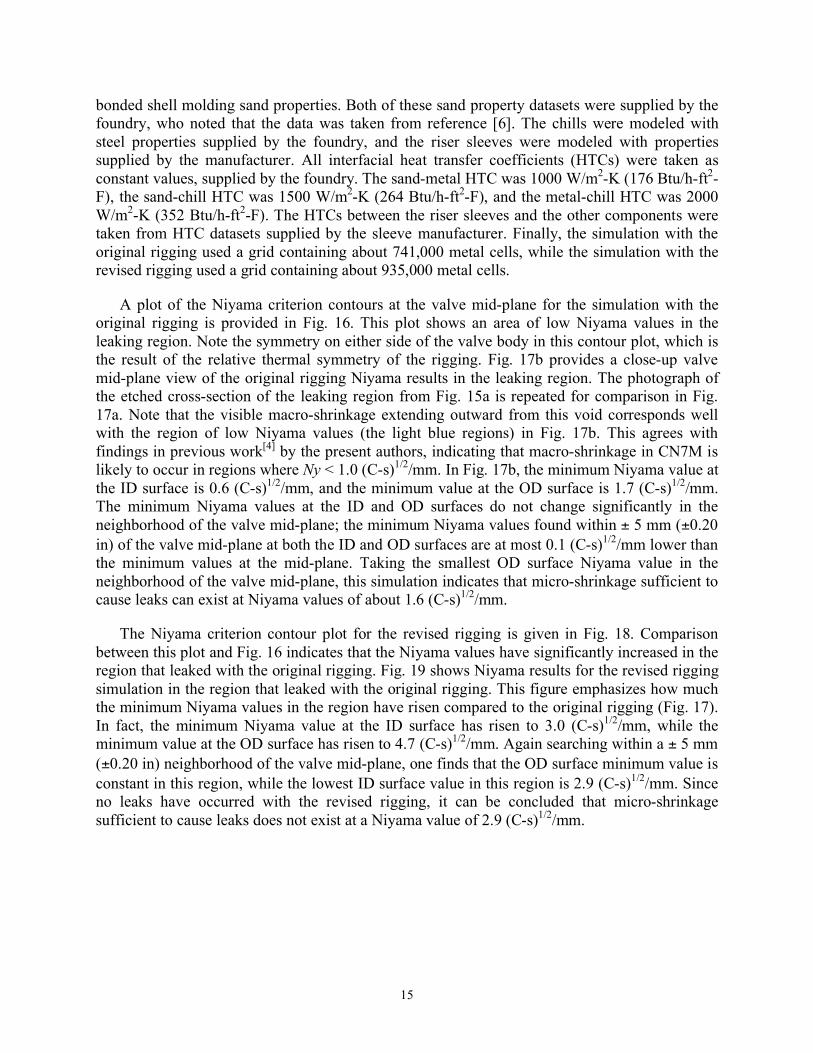
demonstrating visible shrinkage porosity in the region of the leak. Finally, the valve section
containing the leak was cut directly through the leaking region. This cut surface was then etched
and photographed, as shown in Fig. 15. These photographs clearly show a void and
interconnected macro-shrinkage in the center of the leaking wall, with smaller amounts of
shrinkage extending toward the inner diameter (ID) and outer diameter (OD) surfaces. No visible
porosity reaches the OD surface of the section shown. The second leaking valve leaked in the
same general area as did the first, a little bit closer to the flange (i.e., the leak exit was a little bit
above the location indicated in Fig. 12a). Because the leak location is similar and the leak was
also determined to be the result of shrinkage porosity, photographs of the second are not included
here. Once these leaking valves were discovered, the casting foundry revised their rigging for
this valve. No further leaks have been reported since the rigging was revised.
(a)
(b)
a
Fig. 11 Comparison between a photograph of the valve mid-plane surface at Region #5 and
simulation results at the same location: (a) is a photograph of Region #5; and (b) is a
Niyama contour plot of the region. The rectangle indicates the area represented by the
photograph.
13
The casting of this valve was simulated, both with the original rigging and with the revised
rigging. Both simulations were performed using the following casting data, which was supplied
by the foundry. The pouring temperature was 1520 C (2768 F), and pouring was dependent on an
inlet pressure profile developed by the foundry. The alloy was modeled using a CN7M material
database developed by the present researchers[4]
. The sand mold was modeled with chemically
bonded urethane molding sand properties, and the core material was modeled with chemically
Fig. 13 Photographs showing the entrance location of the leak: (a) view of valve section
containing leak; and (b) a close-up of leak entrance location.
leak entrance
area
close-up of
leak entrance
(b) (a)
Fig. 12 Photographs of a leaking CN7M valve, showing the exit location of the leak: (a)
valve view showing full leak exit location; and (b) a close-up of leak exit location.
(a)
leak exit
area
close-up of
leak exit
(b)
14
(b)
(a)
OD
ID
Fig. 15 Photographs of an etched cross-section through the leaking region: (a) view of the
valve wall containing the leak; and (b) a close-up view of the visible shrinkage
porosity.
(b) (a)
Fig. 14 Digitized radiograph showing visible shrinkage porosity in the region of the leak: (a)
view of the valve section containing the leak (same view as shown in Fig. 13b); and
(b) a close-up of the shrinkage porosity.
15
bonded shell molding sand properties. Both of these sand property datasets were supplied by the
foundry, who noted that the data was taken from reference [6]. The chills were modeled with
steel properties supplied by the foundry, and the riser sleeves were modeled with properties
supplied by the manufacturer. All interfacial heat transfer coefficients (HTCs) were taken as
constant values, supplied by the foundry. The sand-metal HTC was 1000 W/m2-K (176 Btu/h-ft
2-
F), the sand-chill HTC was 1500 W/m2-K (264 Btu/h-ft
2-F), and the metal-chill HTC was 2000
W/m2-K (352 Btu/h-ft
2-F). The HTCs between the riser sleeves and the other components were
taken from HTC datasets supplied by the sleeve manufacturer. Finally, the simulation with the
original rigging used a grid containing about 741,000 metal cells, while the simulation with the
revised rigging used a grid containing about 935,000 metal cells.
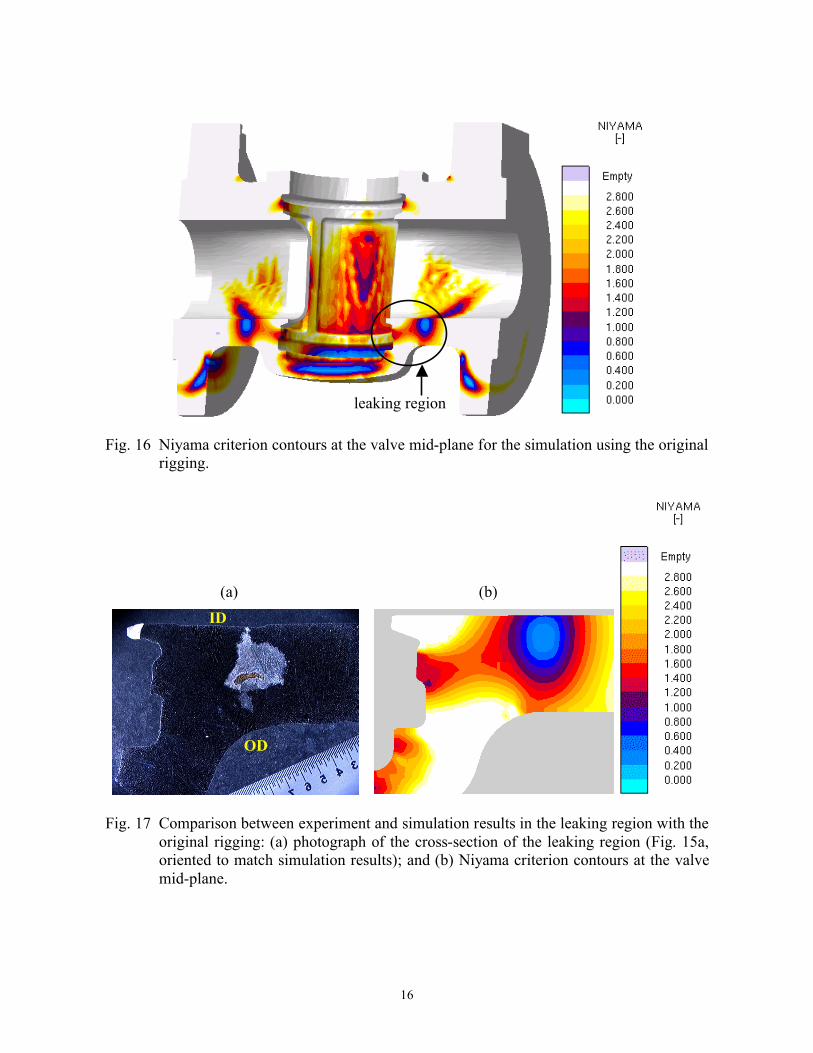
A plot of the Niyama criterion contours at the valve mid-plane for the simulation with the
original rigging is provided in Fig. 16. This plot shows an area of low Niyama values in the
leaking region. Note the symmetry on either side of the valve body in this contour plot, which is
the result of the relative thermal symmetry of the rigging. Fig. 17b provides a close-up valve
mid-plane view of the original rigging Niyama results in the leaking region. The photograph of
the etched cross-section of the leaking region from Fig. 15a is repeated for comparison in Fig.
17a. Note that the visible macro-shrinkage extending outward from this void corresponds well
with the region of low Niyama values (the light blue regions) in Fig. 17b. This agrees with
findings in previous work[4]
by the present authors, indicating that macro-shrinkage in CN7M is
likely to occur in regions where Ny < 1.0 (C-s)1/2
/mm. In Fig. 17b, the minimum Niyama value at
the ID surface is 0.6 (C-s)1/2
/mm, and the minimum value at the OD surface is 1.7 (C-s)1/2
/mm.
The minimum Niyama values at the ID and OD surfaces do not change significantly in the
neighborhood of the valve mid-plane; the minimum Niyama values found within ± 5 mm (±0.20
in) of the valve mid-plane at both the ID and OD surfaces are at most 0.1 (C-s)1/2
/mm lower than
the minimum values at the mid-plane. Taking the smallest OD surface Niyama value in the
neighborhood of the valve mid-plane, this simulation indicates that micro-shrinkage sufficient to
cause leaks can exist at Niyama values of about 1.6 (C-s)1/2
/mm.
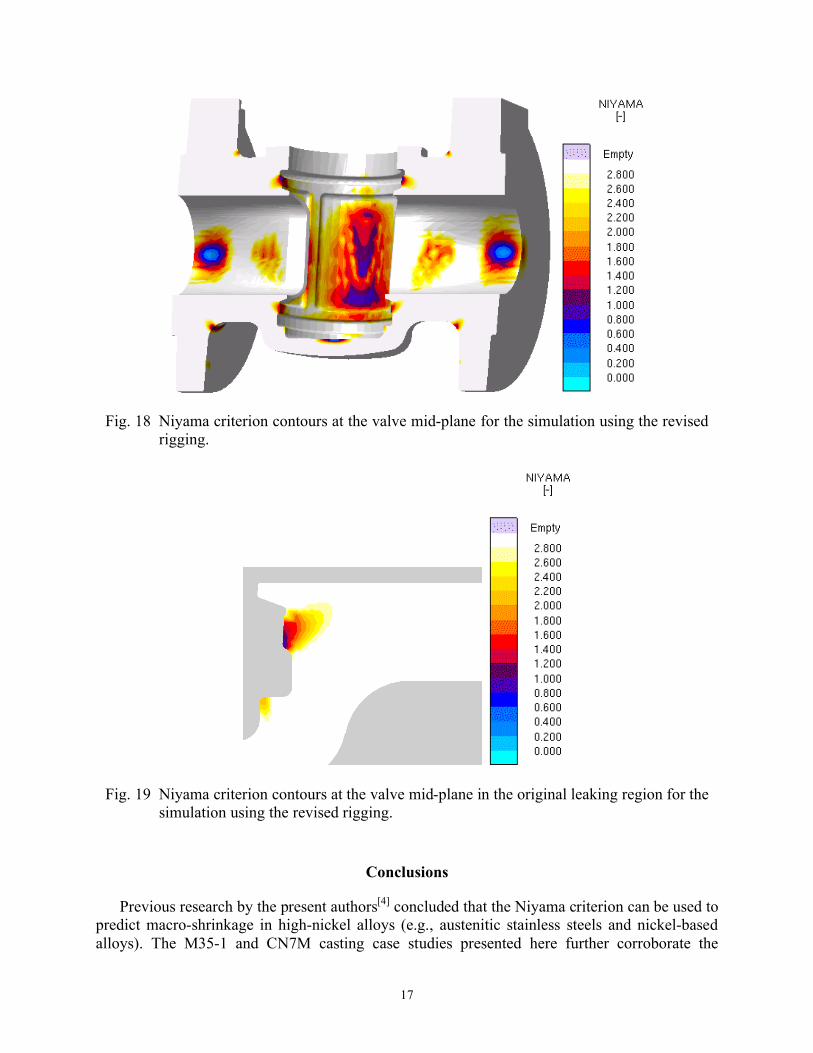
The Niyama criterion contour plot for the revised rigging is given in Fig. 18. Comparison
between this plot and Fig. 16 indicates that the Niyama values have significantly increased in the
region that leaked with the original rigging. Fig. 19 shows Niyama results for the revised rigging
simulation in the region that leaked with the original rigging. This figure emphasizes how much
the minimum Niyama values in the region have risen compared to the original rigging (Fig. 17).
In fact, the minimum Niyama value at the ID surface has risen to 3.0 (C-s)1/2
/mm, while the
minimum value at the OD surface has risen to 4.7 (C-s)1/2
/mm. Again searching within a ± 5 mm
(±0.20 in) neighborhood of the valve mid-plane, one finds that the OD surface minimum value is
constant in this region, while the lowest ID surface value in this region is 2.9 (C-s)1/2
/mm. Since
no leaks have occurred with the revised rigging, it can be concluded that micro-shrinkage
sufficient to cause leaks does not exist at a Niyama value of 2.9 (C-s)1/2
/mm.
16
leaking region
Fig. 16 Niyama criterion contours at the valve mid-plane for the simulation using the original
rigging.
(b) (a)
OD
ID
Fig. 17 Comparison between experiment and simulation results in the leaking region with the
original rigging: (a) photograph of the cross-section of the leaking region (Fig. 15a,
oriented to match simulation results); and (b) Niyama criterion contours at the valve
mid-plane.
17
Conclusions
Previous research by the present authors[4]
concluded that the Niyama criterion can be used to
predict macro-shrinkage in high-nickel alloys (e.g., austenitic stainless steels and nickel-based
alloys). The M35-1 and CN7M casting case studies presented here further corroborate the
Fig. 19 Niyama criterion contours at the valve mid-plane in the original leaking region for the
simulation using the revised rigging.
Fig. 18 Niyama criterion contours at the valve mid-plane for the simulation using the revised
rigging.

18
predictive ability of the Niyama criterion to predict macro-shrinkage for these alloys. More
importantly, these case studies also indicate that a correlation exists between the Niyama
criterion and micro-shrinkage sufficient to cause leaks in high-nickel alloy castings. The
comparisons between metallographic examination results and simulated Niyama values shown in
this work indicate that macro-porosity may exist in regions with Ny < Nymacro = 1.0 (C-s)1/2
/mm,
which validates previous research[4]
. These comparisons also indicate that noticeable amounts of
micro-shrinkage may be present in casting regions with Ny < Nymicro = 2.0 (C-s)1/2
/mm. These
results imply that leaks in high-nickel alloy castings can be prevented by ensuring that simulated
Niyama values are above 2.0 (C-s)1/2
/mm. This does not, however, imply that one should attempt
to keep Ny > 2.0 (C-s)1/2
/mm throughout the casting. While that may be possible, it may be
impractical and expensive to ensure such a high level of soundness throughout the casting. For
the purpose of preventing leaks, it is only necessary to ensure that there not be a “pathway” of
shrinkage porosity (micro- and/or macro-porosity) that leads from the inside to the outside of a
fluid-containing casting.
Acknowledgements
The authors would like to thank the Materials Technology Institute (MTI), for their financial
support of this research. We are also indebted to the Steel Founders’ Society of America (SFSA)
as well as to MTI, for their assistance in finding castings to use as case studies. The authors
would also like to thank the customers who identified the case studies and provided the castings,
as well as the foundries who provided the casting data necessary to perform the simulations. We
would also like to express our gratitude to John Griffin of the University of Alabama at
Birmingham, and to Willie Henderson of Honeywell, for providing us with photographs of the
metallographic analyses of the case studies.
References
1. K.D. Carlson, S. Ou, R.A. Hardin, and C. Beckermann, “Development of New Feeding-
Distance Rules Using Casting Simulation: Part I. Methodology,” Metall. Mater. Trans. B, vol.
33B, pp. 731-740 (2002).
2. E. Niyama, T. Uchida, M. Morikawa, and S. Saito, “A Method of Shrinkage Prediction and its
Application to Steel Casting Practice,” Am. Foundrymen’s Soc. Int. Cast Met. J., vol. 7(3), pp.
52-63 (1982).
3. N. Jain, K.D. Carlson, and C. Beckermann, “Round Robin Study to Assess Variations in
Casting Simulation Niyama Criterion Predictions,” in Proceedings of the 61st Technical and
Operating Conference, Steel Founders’ Society of America, Chicago (2007).
4. K.D. Carlson, S. Ou, and C. Beckermann, “Feeding of High-Nickel Alloy Castings,” Metall.
Mater. Trans. B, vol. 36B, pp. 843-856 (2005).
5. MAGMASOFT v4.5, MAGMA GmbH, Aachen, Germany.
6. T. Midea and J.V. Shah, “Bringing Mold Material Thermophysical Data up to Speed,”
Modern Casting, vol. 94(8), pp. 30-33 (2004)