use project management toolsweb1.muirfield-h.schools.nsw.edu.au/.../documents/1016_reading.doc ·...
TRANSCRIPT
Reading: Use project management tools
Use project management tools
Inside this reading:
Project management tools 2
Work breakdown structure (WBS) 3Breaking down tasks 4
Network diagrams 6Creating a network diagram 6The critical path 8
Program evaluation review technique (PERT) 11The weighted average formula 11
Gantt charts 14Relationships between activities on a Gantt chart 15Lead time, lag time and float time on a Gantt chart 16
Some general tools and techniques for estimating in projects 18
Estimating task and project duration 18Estimating task duration and resource requirements 19
Project management software 23CASE tools 23
Summary 26
document.doc
© State of New South Wales, Department of Education and Training 2006 1

Reading: Use project management tools
document.doc
© State of New South Wales, Department of Education and Training 2006 2
Reading: Use project management tools
Project management tools
Project management tools can range from a pencil and note pad, to expensive integrated software and systems. The tools that are useful will vary with the scope of the project. Various tools, however, are commonly used for project activities like planning, budgeting, reporting, recording, analysing, communicating and measuring.
Most project managers rely on the following types of tools.
Work breakdown structures
Network diagrams
Critical Path Method (CPM)
Gantt and bar charts
Program Evaluation and Review Technique (PERT) charts
CASE Tools
Project management software
Generic software such as word processors, spreadsheets, databases and email software
Estimation tools and techniques
Cost schedule control system
Logistics support analysis
Life cycle cost analysis
Risk analysis
Organisational project governance framework
Communications plan
Reporting framework.
This topic will introduce some of these tools to you.
document.doc
© State of New South Wales, Department of Education and Training 2006 3
Reading: Use project management tools
Work breakdown structure (WBS)
The most used and easiest to understand method of defining activities and tasks that make up a project, is the work breakdown structure (WBS). A WBS generally has:
a breakdown of the project into identifiable stages with a statement of the work content in each stage
an estimate of the time required to complete each stage
a statement of the resources needed for each stage, such as labour, materials, plant, subcontracts, overheads and cash flow estimates.
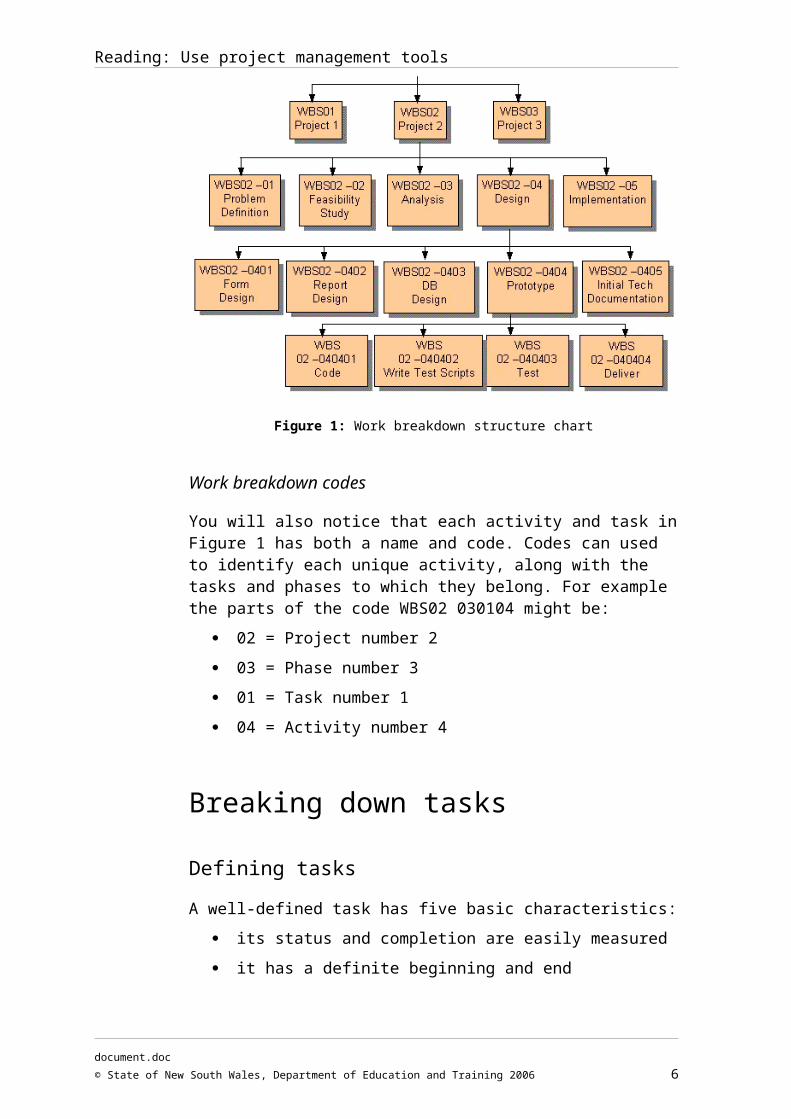
Using the WBS method, the goal, objectives, tasks, sub-tasks and work packages are represented by a hierarchical tree that shows all the levels of breakdown—the top branch has the goal of the project and the bottom branches represent the individual work activities to be performed.
It could be a hierarchical listing like a table of contents or a graphical display like the chart in Figure 1, which shows three interconnected projects (and which you’ll notice looks a bit like an organisational chart).
Figure 1: Work breakdown structure chart
document.doc
© State of New South Wales, Department of Education and Training 2006 4
Reading: Use project management tools
Work breakdown codes
You will also notice that each activity and task in Figure 1 has both a name and code. Codes can used to identify each unique activity, along with the tasks and phases to which they belong. For example the parts of the code WBS02 030104 might be:
02 = Project number 2
03 = Phase number 3
01 = Task number 1
04 = Activity number 4
Breaking down tasks
Defining tasks
A well-defined task has five basic characteristics:
its status and completion are easily measured
it has a definite beginning and end
it is familiar (may have been done before) and therefore its completion time, associated resource requirements and costs can be easily estimated from previous experiences with this or similar tasks
it is made up of work packages that are manageable, measurable, integrable and independent of work packages in other tasks
it should normally be one continuous stream of work from start to finish.
If you examine a task that you have identified and it does not have one or more of these characteristics, then you will have to break it down further into subtasks.
The top down method
The top down method is the most commonly used way to break down projects into tasks and then work packages. It can be done in five steps:
1 Divide the project into its major objectives.
2 Divide each objective into the tasks that must be done in order to accomplish the objective.
3 For each task that must be done, check if it has all of the required characteristics listed above. If it has one or more missing characteristics then divide the task into subtasks.
document.doc
© State of New South Wales, Department of Education and Training 2006 5
Reading: Use project management tools
4 Repeat Step 3 until all subtasks have the required characteristics.
5 The lowest level of subtasks in the WBS hierarchy will be the basis for the work packages that must be done to complete the project.
The bottom down method
The other type of breakdown method is the bottom-up approach. This is where all the basic tasks are determined and then they are grouped into linked tasks and then into phases. The bottom-up is best suited to smaller projects.
You’ll get a chance to develop a work breakdown structure in the Practice activities.
document.doc
© State of New South Wales, Department of Education and Training 2006 6
Reading: Use project management tools
Network diagrams
Using network diagrams is a proven and accepted way to organise and sequence the tasks of a project. A network diagram is like a roadmap of all activities, drawn as an interconnected network of tasks. A low-level version for 50 tasks can be easily drawn with pencil and paper. When managing more complex projects it is usually necessary to use project management software to generate complex network diagrams. In this topic we will introduce and use a simple, low-level, manual version of a network diagram.
Creating a network diagram
Relationships between tasks
To create a network diagram you need first to determine the relationships between the tasks involved.
Some conventions for network diagrams are shown in Figure 2.
For any particular task, you need to determine whether there are any other activities that must be done before this task can begin. If there are any, then they are called predecessors.
Tasks that must be done in a defined sequence are shown by placing them in horizontal order from left to right.
Figure 2: Network diagram conventions
document.doc
© State of New South Wales, Department of Education and Training 2006 7

Reading: Use project management tools
Tasks that can occur in parallel (meaning, at the same time) are called concurrent, and are shown in columns. The relationships between dependent tasks are also called ‘dependencies’.
The five steps
The following table outlines the five steps in creating a network diagram.
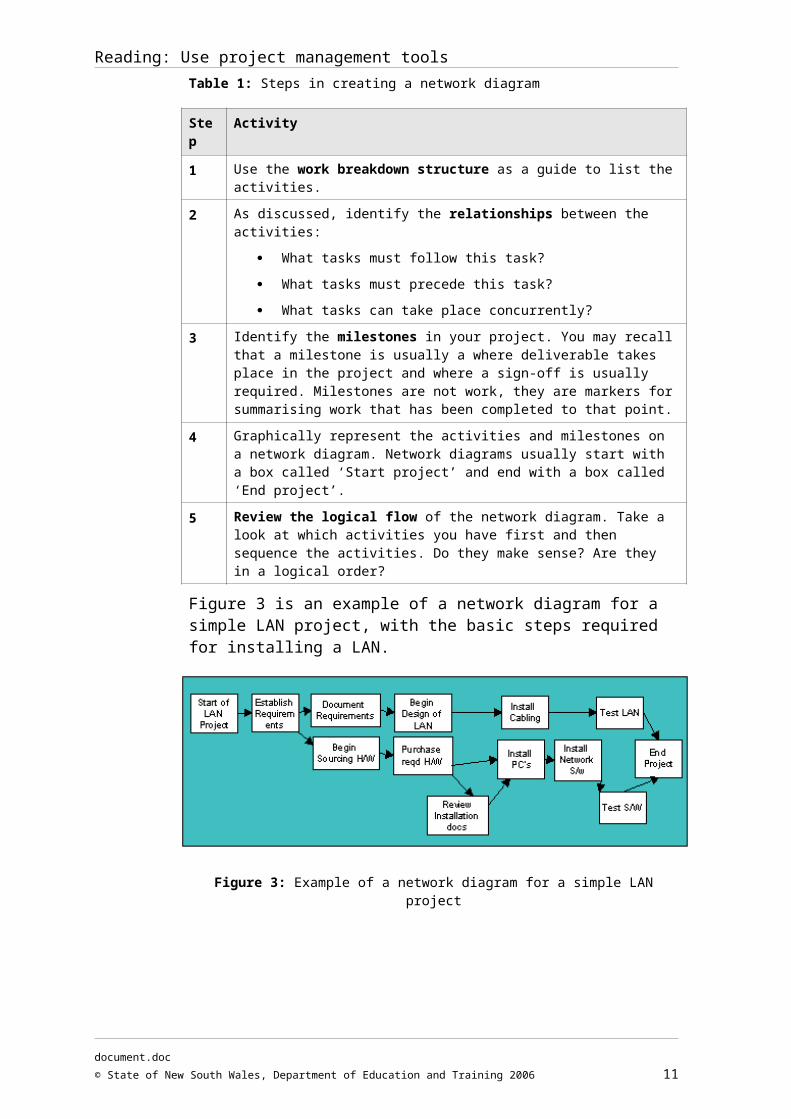
Table 1: Steps in creating a network diagram
Step Activity
1 Use the work breakdown structure as a guide to list the activities.
2 As discussed, identify the relationships between the activities:
What tasks must follow this task?
What tasks must precede this task?
What tasks can take place concurrently?
3 Identify the milestones in your project. You may recall that a milestone is usually a where deliverable takes place in the project and where a sign-off is usually required. Milestones are not work, they are markers for summarising work that has been completed to that point.
4 Graphically represent the activities and milestones on a network diagram. Network diagrams usually start with a box called ‘Start project’ and end with a box called ‘End project’.
5 Review the logical flow of the network diagram. Take a look at which activities you have first and then sequence the activities. Do they make sense? Are they in a logical order?
Figure 3 is an example of a network diagram for a simple LAN project, with the basic steps required for installing a LAN.
Figure 3: Example of a network diagram for a simple LAN project
document.doc
© State of New South Wales, Department of Education and Training 2006 8
Reading: Use project management tools
Review your network diagram
After you have drawn your diagram, check that:
the tasks start from the left side and sequence left to right, meaning that all predecessors must be to the left of their successor tasks
there are no loops or backward flow sequences
all tasks except ‘start project’ and ‘end project’ have at least one predecessor and one successor node and therefore there are no orphan nodes.
The critical pathA path is a sequence of tasks from the start to the finish. Each network may have several paths from start to finish. The critical path is the sequence of tasks that forms the longest duration of the project, based on the task work estimates. A delay in any of the tasks and all tasks that are on this path affect the final completion date.
The critical path method (CPM)
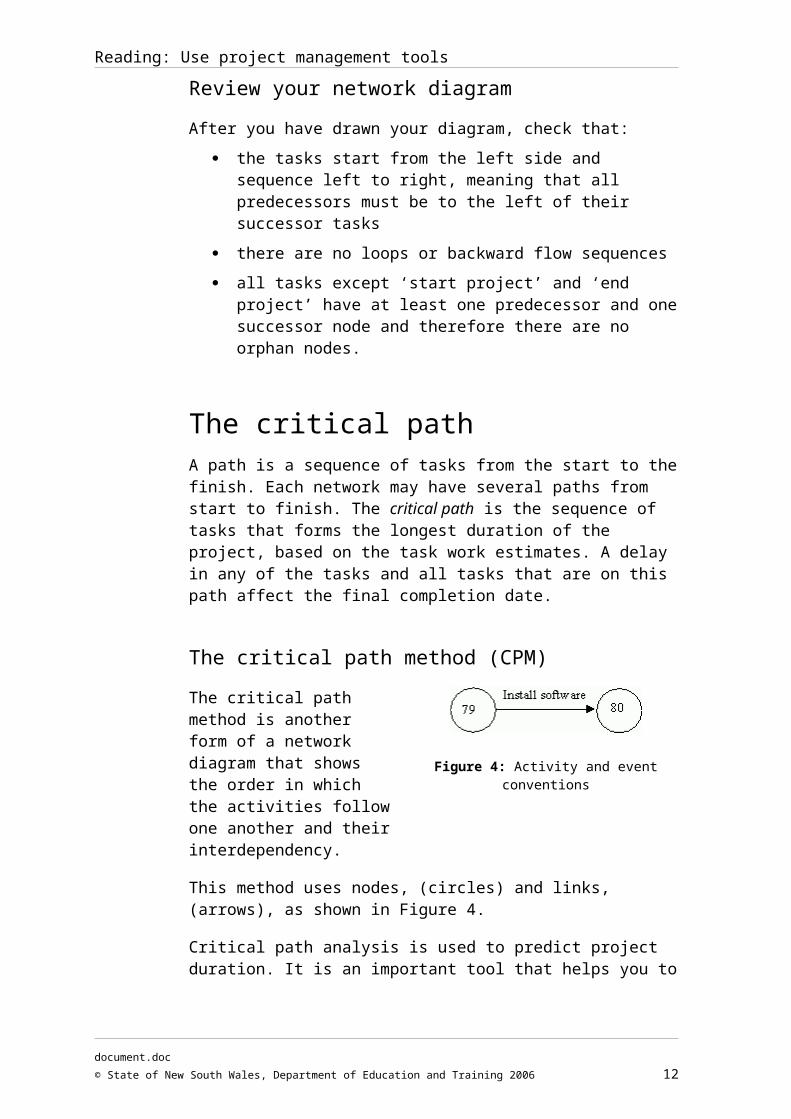
The critical path method is another form of a network diagram that shows the order in which the activities follow one another and their interdependency.
Figure 4: Activity and event conventions
This method uses nodes, (circles) and links, (arrows), as shown in Figure 4.
Critical path analysis is used to predict project duration. It is an important tool that helps you to fight project overruns. The critical path for a project:
is the series of activities that determine the earliest time that a project can finish
is the longest path through the network diagram
has the least amount of slack or float.
Diagram conventions
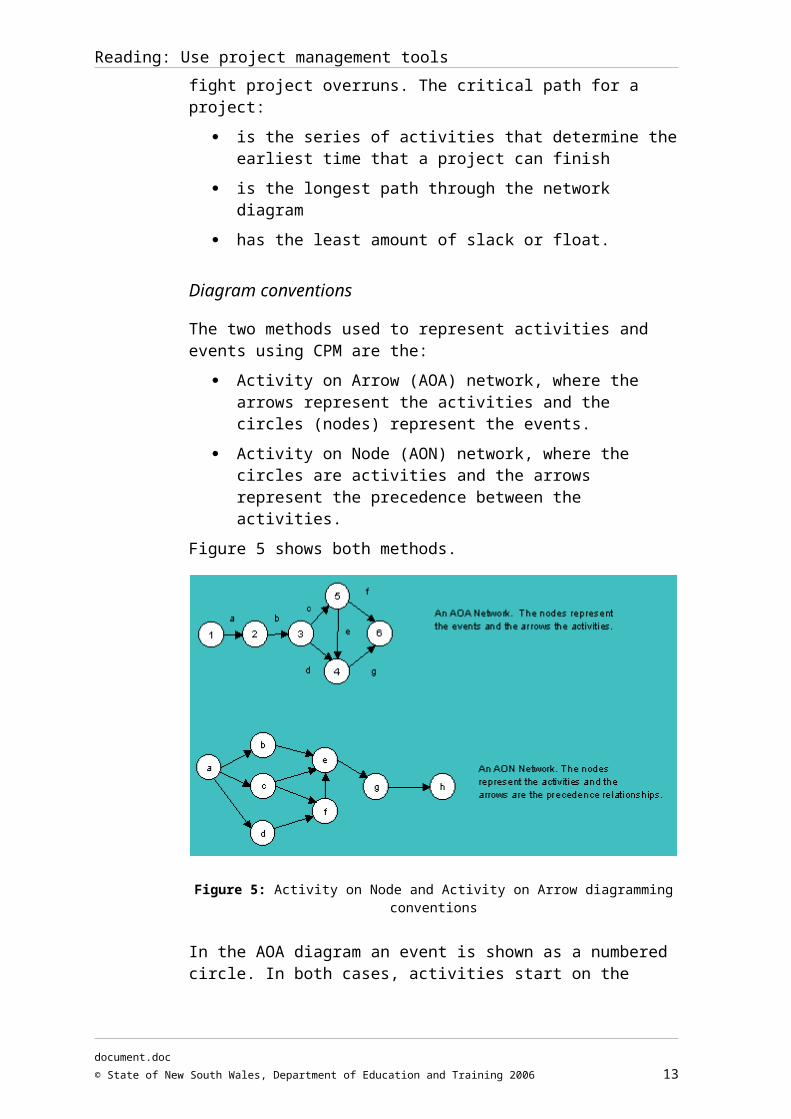
The two methods used to represent activities and events using CPM are the:
Activity on Arrow (AOA) network, where the arrows represent the activities and the circles (nodes) represent the events.
Activity on Node (AON) network, where the circles are activities and the arrows represent the precedence between the activities.
document.doc
© State of New South Wales, Department of Education and Training 2006 9

Reading: Use project management tools
Figure 5 shows both methods.
Figure 5: Activity on Node and Activity on Arrow diagramming conventions
In the AOA diagram an event is shown as a numbered circle. In both cases, activities start on the left-hand side, and end on the right. The letters on the links in the AOA diagram represent durations of activity.
Calculating the critical path
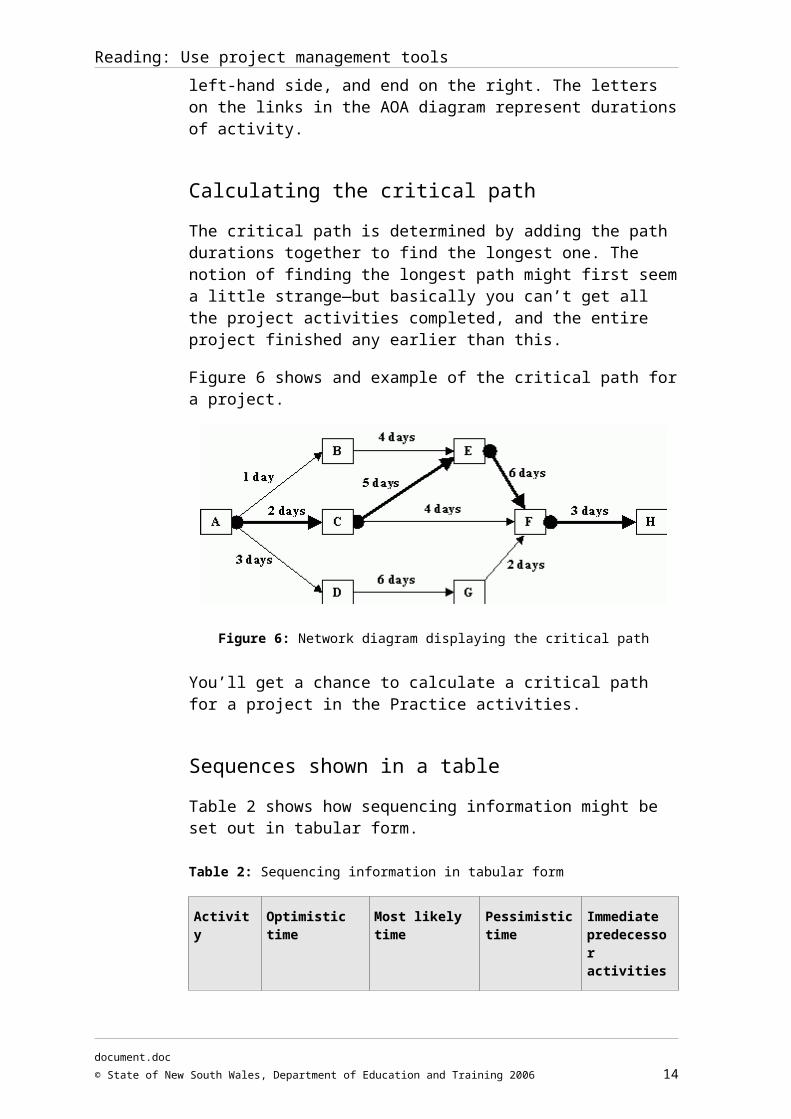
The critical path is determined by adding the path durations together to find the longest one. The notion of finding the longest path might first seem a little strange—but basically you can’t get all the project activities completed, and the entire project finished any earlier than this.
Figure 6 shows and example of the critical path for a project.
Figure 6: Network diagram displaying the critical path
You’ll get a chance to calculate a critical path for a project in the Practice activities.
document.doc
© State of New South Wales, Department of Education and Training 2006 10
Reading: Use project management tools
Sequences shown in a table
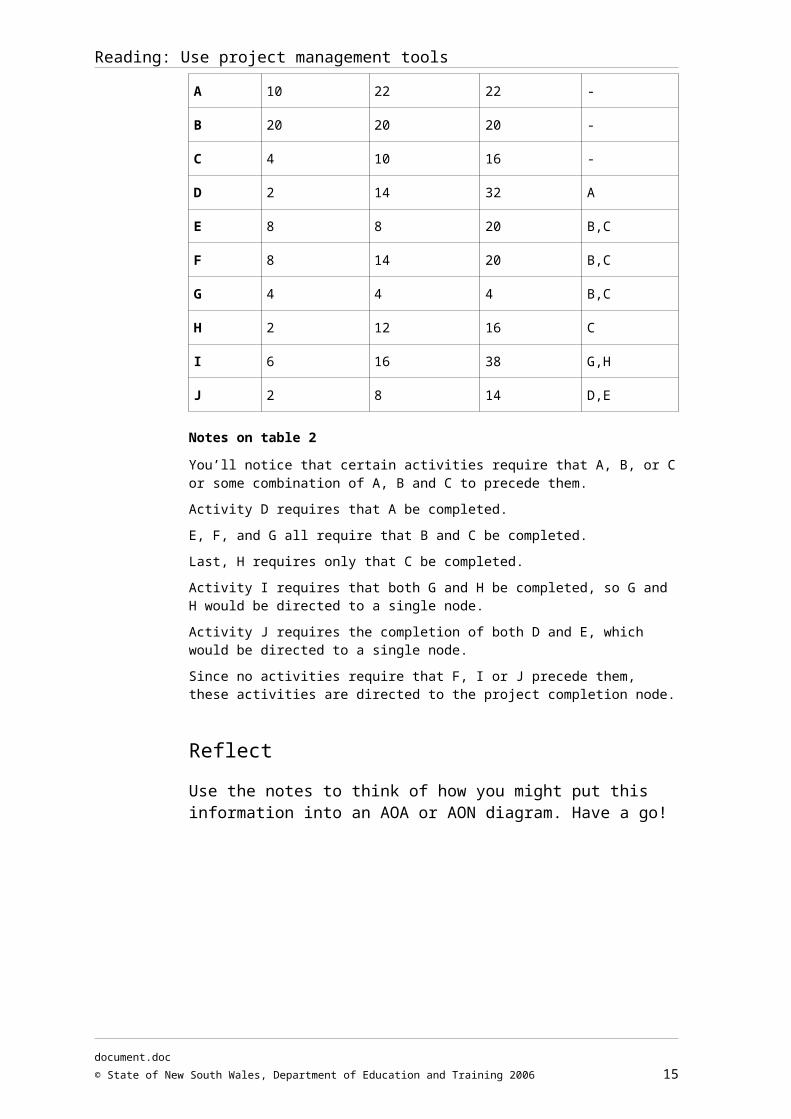
Table 2 shows how sequencing information might be set out in tabular form.
Table 2: Sequencing information in tabular form
Activity Optimistic time Most likely time Pessimistic time
Immediate predecessor activities
A 10 22 22 -
B 20 20 20 -
C 4 10 16 -
D 2 14 32 A
E 8 8 20 B,C
F 8 14 20 B,C
G 4 4 4 B,C
H 2 12 16 C
I 6 16 38 G,H
J 2 8 14 D,E
Notes on table 2
You’ll notice that certain activities require that A, B, or C or some combination of A, B and C to precede them.
Activity D requires that A be completed.
E, F, and G all require that B and C be completed.
Last, H requires only that C be completed.
Activity I requires that both G and H be completed, so G and H would be directed to a single node.
Activity J requires the completion of both D and E, which would be directed to a single node.
Since no activities require that F, I or J precede them, these activities are directed to the project completion node.
Reflect
Use the notes to think of how you might put this information into an AOA or AON diagram. Have a go!
document.doc
© State of New South Wales, Department of Education and Training 2006 11
Reading: Use project management tools
Program evaluation review technique (PERT)
Another project time management technique is the Program Evaluation Review Technique (PERT). PERT is used when there is a high degree of uncertainty about the individual activity duration estimates. PERT applies the critical path method to a weighted average duration estimate.
PERT uses probabilistic estimates, which are activity duration estimates based on three criteria:
optimistic
most likely
pessimistic.
The three estimates are then statistically averaged using a formula.
The weighted average formulaPERT is based on a project network diagram, and activity durations are then calculated using a formula called the weighted average formula. Deriving this formula is outside the scope of this topic. If you are interested you could do some further research to read about this. Here, however, we’ll just provide you with the formula and show you how it is used.
The formula is: Where:
ED = Estimated event duration
BD = Best duration – shortest time needed to complete the activity
LD = Likely duration—the time most likely needed to complete the activity
WD = Worst duration—the longest time required to complete the activity.
document.doc
© State of New South Wales, Department of Education and Training 2006 12
Reading: Use project management tools
An example of how to calculate and plot duration
The following is an example of how to calculate duration and how to plot duration on a critical path diagram. We will use the AOA network diagram, shown in Figure 5 above. All durations in this example are in days and are simple estimates for the purpose of performing the calculations.
Table 2: Duration calculation—an example
Activity BD WD LD ED
a 2 5 4
b 1 5 3
c 1 3 2
d 1 3 2
e 4 7 6
f 2 6 4
g 2 6 4
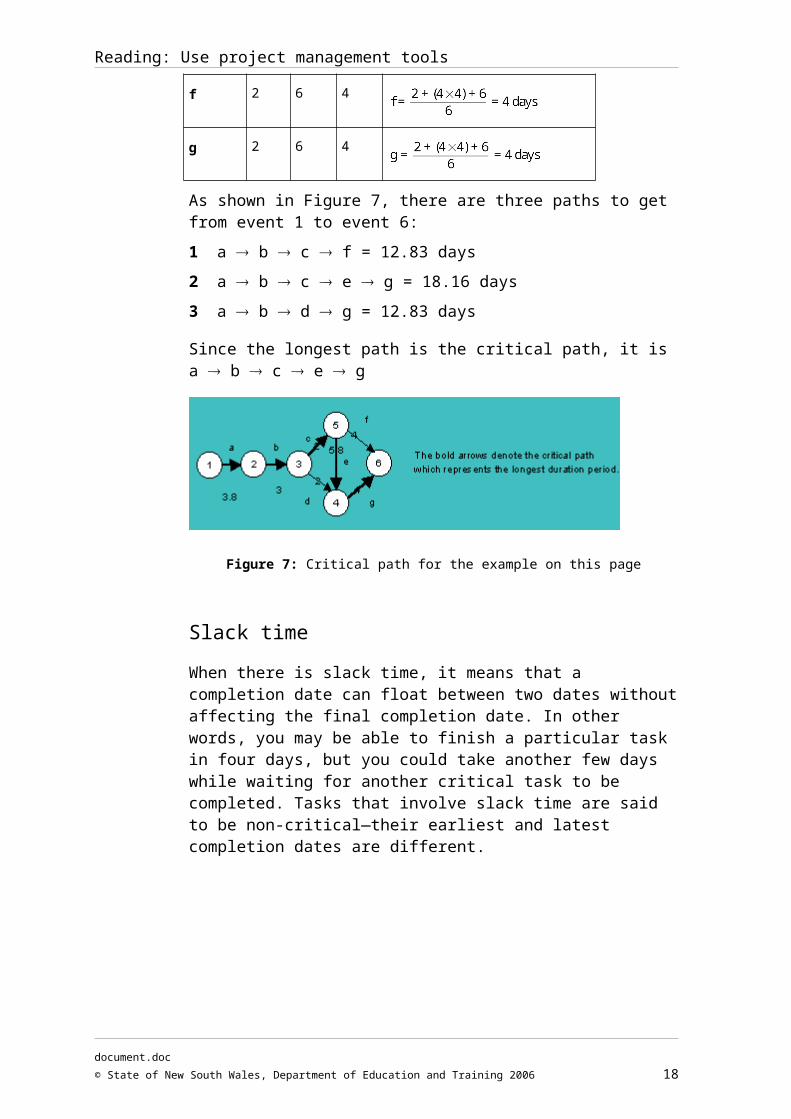
As shown in Figure 7, there are three paths to get from event 1 to event 6:
1 a b c f = 12.83 days
2 a b c e g = 18.16 days
3 a b d g = 12.83 days
Since the longest path is the critical path, it is a b c e g
Figure 7: Critical path for the example on this page
document.doc
© State of New South Wales, Department of Education and Training 2006 13
Reading: Use project management tools
Slack time
When there is slack time, it means that a completion date can float between two dates without affecting the final completion date. In other words, you may be able to finish a particular task in four days, but you could take another few days while waiting for another critical task to be completed. Tasks that involve slack time are said to be non-critical—their earliest and latest completion dates are different.
What are the advantages and disadvantages of PERT?
PERT has one main advantage but several disadvantages.
The advantage is that it tries to address the risk associated with duration estimates.
The disadvantages are that it:
involves more work
requires several duration estimates and so it is rarely used in practice.
Usually people confuse PERT with project network diagrams and misuse the term. You will often hear the expression PERT chart. This is actually a normal network chart with PERT calculated task durations displayed.
document.doc
© State of New South Wales, Department of Education and Training 2006 14
Reading: Use project management tools
Gantt charts
A Gantt chart is used to show all project activities in a graphic time line. A basic Gantt chart does not display the relationships between the activities—which is normally done with a network diagram.
A Gantt chart should be used in conjunction with network diagrams, including the critical path method (CPM) and the project schedule to give a clear overall picture and of the project.
A Gantt chart lists all the activities on the left-hand side of the chart and the time line is across the top of the chart. The detail of the Gantt chart is dependent of the level of detail that you put into the time line. A Gantt chart has to be easy and clear to read, so you must ensure that appropriate time frame is used for the time line.
For example, if a project will take three months, then a weekly time line may be useful. If the project will take 30 days then a daily timeline would be more useful. A simple Gantt chart is presented in Figure 8 below. This is the Gantt chart for that CPM diagram in Figure 7 above. The duration of the activities is shown by arrows, sized as close as possible to the duration periods calculated in Table 2.
Figure 8: Example of a Gantt chart
document.doc
© State of New South Wales, Department of Education and Training 2006 15
Reading: Use project management tools
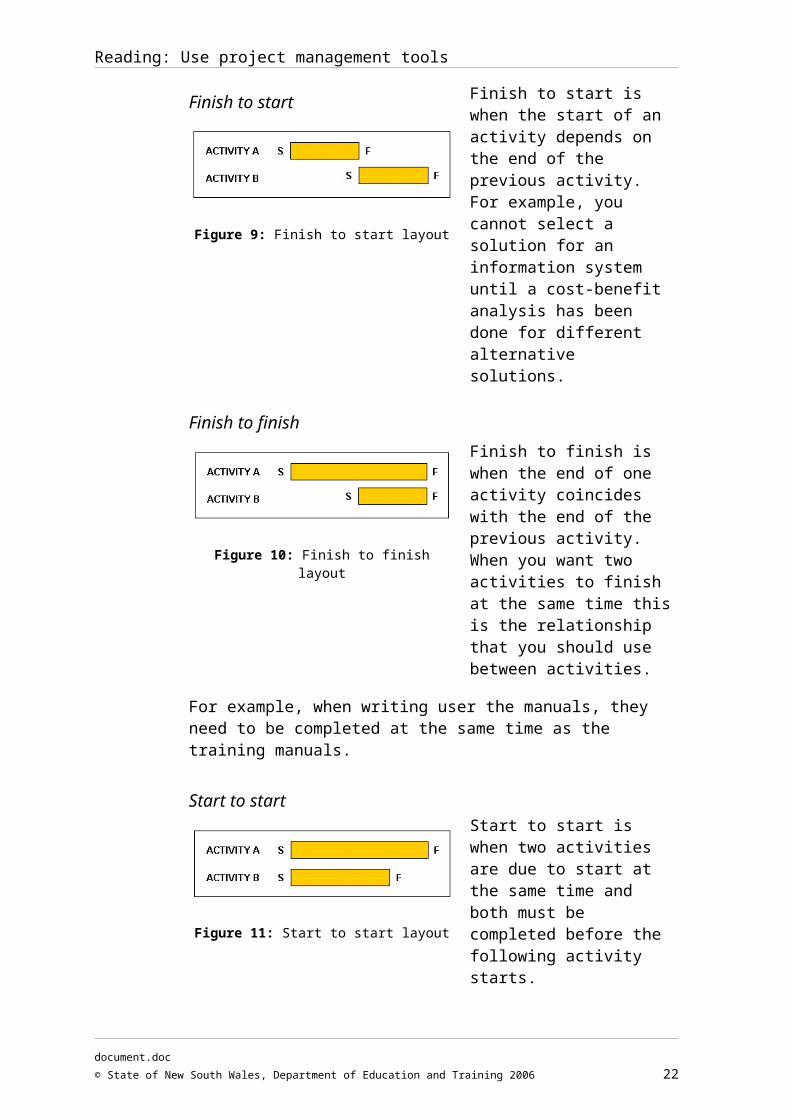
Relationships between activities on a Gantt chartThe following are descriptions of the four ways that activities on a Gantt chart can relate to one another.
Finish to start
Figure 9: Finish to start layout
Finish to start is when the start of an activity depends on the end of the previous activity. For example, you cannot select a solution for an information system until a cost-benefit analysis has been done for different alternative solutions.
Finish to finish
Figure 10: Finish to finish layout
Finish to finish is when the end of one activity coincides with the end of the previous activity. When you want two activities to finish at the same time this is the relationship that you should use between activities.
For example, when writing user the manuals, they need to be completed at the same time as the training manuals.
Start to start
Figure 11: Start to start layout
Start to start is when two activities are due to start at the same time and both must be completed before the following activity starts.
Start to finish
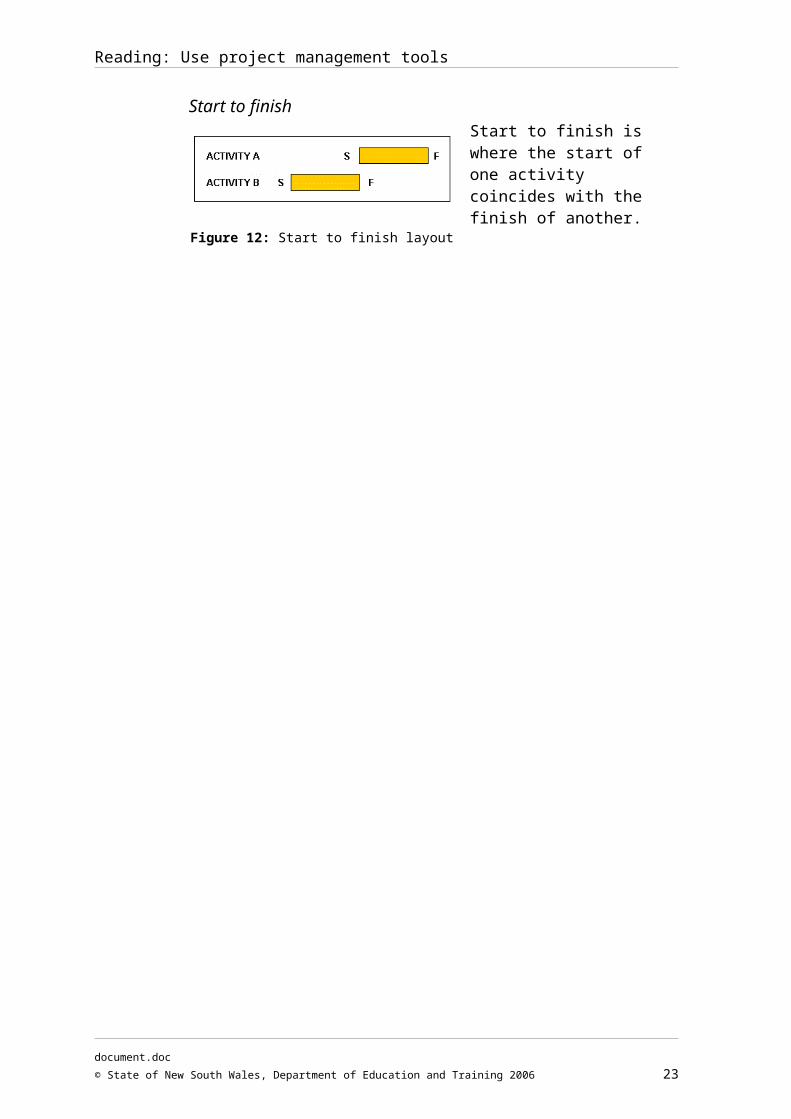
Figure 12: Start to finish layout
Start to finish is where the start of one activity coincides with the finish of another.
document.doc
© State of New South Wales, Department of Education and Training 2006 16

Reading: Use project management tools
Lead time, lag time and float time on a Gantt chart
Lead time
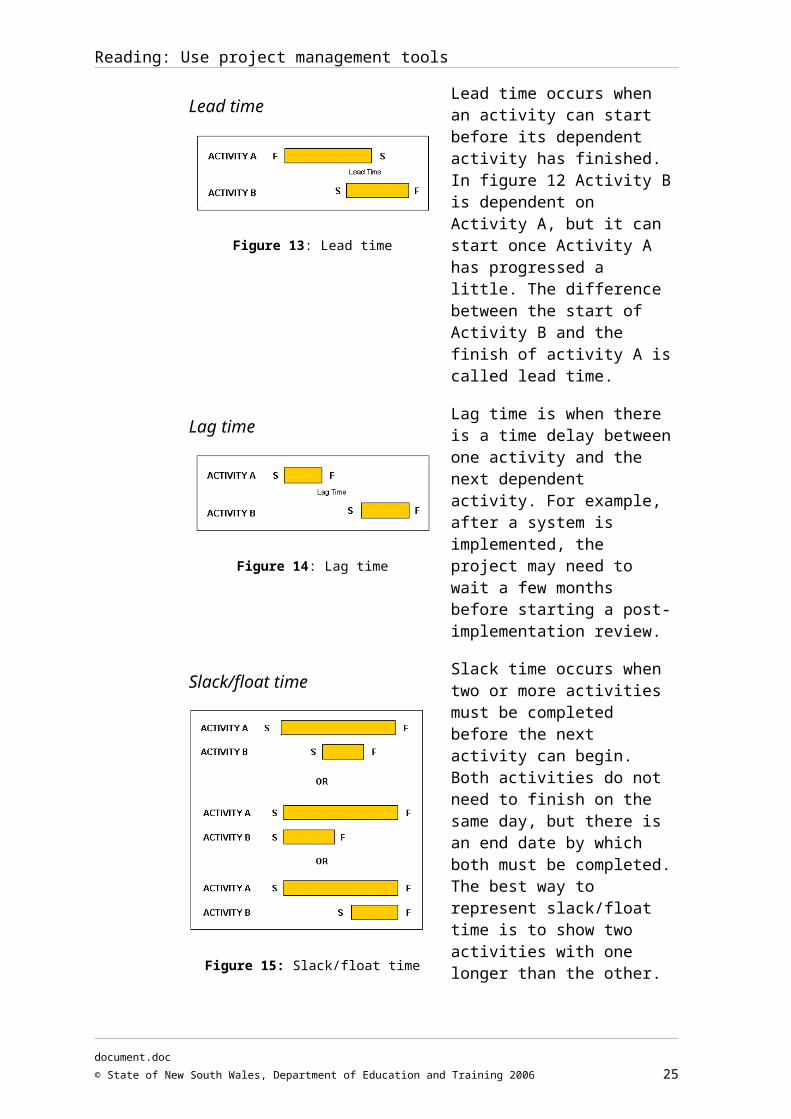
Figure 13: Lead time
Lead time occurs when an activity can start before its dependent activity has finished. In figure 12 Activity B is dependent on Activity A, but it can start once Activity A has progressed a little. The difference between the start of Activity B and the finish of activity A is called lead time.
Lag time
Figure 14: Lag time
Lag time is when there is a time delay between one activity and the next dependent activity. For example, after a system is implemented, the project may need to wait a few months before starting a post-implementation review.
Slack/float time
Figure 15: Slack/float time
Slack time occurs when two or more activities must be completed before the next activity can begin. Both activities do not need to finish on the same day, but there is an end date by which both must be completed. The best way to represent slack/float time is to show two activities with one longer than the other.
In Figure 15, Activity A is longer and must be done in 8 days. Activity B is shorter and must be done in 4 days. The difference between the two activity durations—4 days—is the slack/float time.
Activity B, the shorter activity, can do one of the following:
It can start any time during the activity A, as long as it is completed by activity A’s end date
It can start at the same time as activity A and finish before activity A
It can finish at the same time as activity A.
document.doc
© State of New South Wales, Department of Education and Training 2006 17
Reading: Use project management tools
Detailed Gantt charts
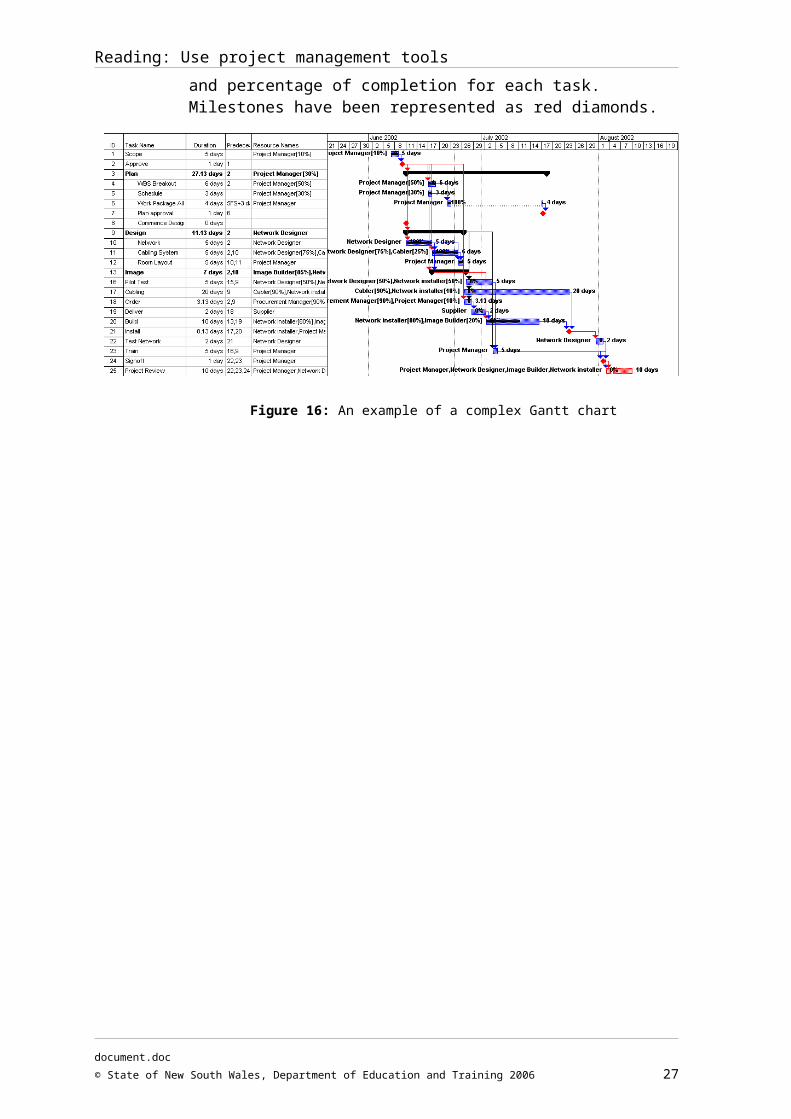
You have reviewed a basic Gantt chart and how it can be derived from a critical path method (CPM) diagram. Most Gantt charts are far more detailed, as in Figure 15 below.
Complex Gantt charts can show the slack times and the absolute latest finish times by using different kinds of lines (solid, striped, zig zag, dotted or shaded).
They can show milestones and the current project status. When creating complex Gantt charts, it is always a good idea to include a legend so that others reading it can associate what the different lines represent.
Figure 15 shows the level of detail that can be put on a Gantt chart using Microsoft Project 2000. We can see resource names, the task interrelationships and percentage of completion for each task. Milestones have been represented as red diamonds.
Figure 16: An example of a complex Gantt chart
document.doc
© State of New South Wales, Department of Education and Training 2006 18

Reading: Use project management tools
Some general tools and techniques for estimating in projects
Estimating task and project duration Durations are often difficult to estimate because of the many factors that can influence them, such as resource levels and resource productivity. The following techniques are used to make the estimations more accurate.
Expert judgement
Expert judgement, guided by historical information should be used whenever possible. If such expertise is not available, the estimates can be inherently uncertain and risky.
Analogous estimating
Analogous estimating, also called top-down estimating, is when the actual duration of a previous, similar activity is used to estimate the duration of a future activity. It is often used to estimate project duration when there is limited detailed information about the project, such as in the early phases. Analogous estimating is a form of expert judgement, and is most reliable when:
the previous activities are similar in fact and not just in appearance
the individuals preparing the estimates have the required expertise.
Simulation
Simulation involves calculating multiple durations, with different sets of assumptions. The most common is Monte Carlo analysis, in which a distribution (range) of probable results is defined for each activity and used to calculate a distribution of probable results for the total project.
document.doc
© State of New South Wales, Department of Education and Training 2006 19
Reading: Use project management tools
Estimating task duration and resource requirementsIt is necessary to estimate the effort required for each defined task. Duration and resource requirements for each task are based on the number of people with the appropriate skills who will be assigned to that task.
A number of alternative estimation techniques are available. The most widely used techniques are:
the macro technique of function points, which derives an estimate for the total development effort, and
the micro technique of bottom-up or task-based estimates, which involves estimating tasks and ‘rolling-up’ the tasks into a phase total.
The micro technique is required for developing project schedules.
Usually, you’ll start with an initial macro technique estimate developed using function point. This is then used to correlate a second estimate by developing a bottom-up micro technique (such as wide-band Delphi). The task estimates are combined into a phase estimate, and if the organisation has a standard methodology, it can be used to calculate total development effort using the phase percentages as a guide.
Using common task naming to estimate work effort
For each task or subtask in each phase of the project, the project manager and project team must produce:
an estimate of work effort and
elapsed days required to complete the task or subtask.
If projects within an organisation conform to a standard methodology—meaning that there is common task naming in all their projects, then actual work effort and actual elapsed duration can be tracked and recorded using this commonly named set of tasks.
Metric databases and project tracking
A formal history for estimates is often not available. If a history is recorded, however, there are great benefits. In future projects, a project manager can use the output from the project tracking process from all projects using the methodology to obtain guidelines as to how long the standard phases or tasks took on similar projects. This is often called a metric database.
document.doc
© State of New South Wales, Department of Education and Training 2006 20

Reading: Use project management tools
Guidelines for estimating
The following are some broad guidelines for estimating:
The smaller and more specific the task/subtask activities, the easier they are to estimate.
The greater the risk of the project, the greater the possibility of estimating error.
It is useful to estimate by teams. For example, during the task definition team meeting, the project manager should seek estimates from team members and average all the estimates given for each task or subtask.
Estimate assuming one person is doing the task, and estimate in work effort, not in duration. The mapping of work effort to elapsed duration and the allocation of actual resources are done during scheduling.
Estimation ranges
It is essential to state estimates as a range rather than a single figure, especially during the early phases of the project development cycle. The use of sensitivity analysis techniques is highly recommended. This technique makes estimates ranged into the following categories:
optimistic/best case
realistic/likely
pessimistic/worst case.
The optimistic estimate is based on everything going better than expected. The realistic estimate reflects the likely situation, and the pessimistic estimate is based on the worst possible scenario.
How risk affects estimation
The project manager should select one of these figures as a base for scheduling. For low-risk projects the optimistic or the realistic estimates are the estimates used for scheduling. The higher the risk of the project, the more the realistic or pessimistic range would be used.
However, all three sets of figures are included in the project file. In many cases, the realistic estimate is the most useful estimate for scheduling. However, certain tasks may be of a higher risk than others and may require the pessimistic estimate. In other words, by doing an informal risk assessment of each task:
document.doc
© State of New South Wales, Department of Education and Training 2006 21
Reading: Use project management tools
the low-risk tasks are scheduled using the optimistic estimate
medium-risk tasks use the realistic estimate
high-risk tasks are scheduled using the pessimistic estimate.
Estimating actual to elapsed duration
Poor estimating often occurs because of the difference between work or direct effort (effort hours) and the elapsed or calendar duration (elapsed hours) required to expand the effort.
Estimation firstly involves estimating the work effort required, then estimating the elapsed or calendar duration involved. For example, a process may be estimated at four hours work effort, but due to other commitments the four hours is scheduled in 2-hour slots over two days. Therefore, the elapsed duration is two days.
Since all project scheduling is in elapsed or calendar days, project managers must take into account the distinction between work effort and elapsed duration.
Typical reasons for the difference between work effort and elapsed duration include:
re-work or defect repair on previously completed dependent tasks
holidays, weekends and public holidays
consulting or coaching team members
rostered days off
non-project administration
non-project education and team coaching
non-project meetings
interruptions, including phone calls
non-project paperwork
wait time for meetings and results
switch time, meaning the time required to switch between tasks.
It is not unusual for these factors to account for 30-50% of an elapsed day. Therefore, it is acceptable to find a work effort of one day taking an elapsed duration of two or three days, depending on the particular project and administrative environment. Further, the amount of lost time varies with the skill or experience of the person performing the task. A 30% loss is typical for a junior programmer or analyst, while a 50% or higher loss is typical for a senior analyst or team leader who spends more time in consulting, administration, coaching team members and non-project meetings.
document.doc
© State of New South Wales, Department of Education and Training 2006 22
Reading: Use project management tools
Task duration estimation outputs
Activity duration estimates are quantitative assessments of the likely number of work periods that are required to complete an activity.
The estimates should include some indication of the range of possible results, for example, two weeks plus or minus two days. You might indicate that the activity will take at least eight days and no more than twelve days. Alternatively, percentages may be used, such as 15% probability of exceeding three weeks (to indicate a high probability), and 85% that the activity will take three weeks or less.
The basis of estimates is made on assumptions and these must be documented in the activity list.
document.doc
© State of New South Wales, Department of Education and Training 2006 23
Reading: Use project management tools
Project management software
CASE toolsComputer-aided software engineering (CASE) was originally the use of a computer-assisted method to organise and control the development of software, especially on large, complex projects involving many software components and people.
Using CASE allows designers, code writers, testers, planners, and managers to share a common view of where a project stands at each stage of development. CASE helps ensure a disciplined, check-pointed process. A CASE tool may portray progress (or lack of it) graphically. It may also serve as a collection of data that can be linked into other business systems such as marketing and service plans.
CASE originated in the 1970s, when computer companies were beginning to borrow ideas from the hardware manufacturing process and applying them to software development. Now CASE tools are commonly used to mean project management software.
A number of CASE tools exist to help in managing a project. Their role is to automate the process of creating Gantt charts, network diagrams, CPM diagrams, calendars, resource lists and activity lists.
Most project management CASE tools have linked functions. This means that if you make a change to a ‘due date’, this updates all other areas that are affected by that change. If you have ever used an accounting software package, like MYOB, then you will understand this principle. For example, if you make a change to a ledger in MYOB, it updates all other areas.
The most popular CASE tool on the market is Microsoft (MS) Project (on the web at http://www.office.microsoft.com). However, Flowcharter, has been used in this topic for the CPM diagrams and Gantt charts (on the web at: http://www.igrafix.com). Although Flowcharter is quite user-friendly and well suited to the purposes of these materials it is not as fully functional as MS Project. You can also use SmartDraw as your CASE tool (on the web at: http://www.smartdraw.com), which can be downloaded for free.
document.doc
© State of New South Wales, Department of Education and Training 2006 24
Reading: Use project management tools
MS Project
When you purchase MS Project software, you receive a CD and user manual. Be aware that this is not an easy piece of software to learn, so you will need time to understand how the MS Project functions link together. It does however have an excellent online tutorial that you should complete.
If you already have the software but do not have a manual, you may want to purchase one from a bookstore. Make sure that you get one that is relevant to your version of the software. Also, there are a number of useful books on the subject—see the Resources section of this topic. Often you will receive an evaluation copy and tutorial with the book. This is the case with the book Information Technology Project Management by Kathy Schwalbe.
MS Project enables you to create and modify activities to meet your objectives and time frame. It allows you to:
set a start date
enter the activities
enter the activity durations
assign resources to activities
link activities
re-evaluate your plan
make necessary changes to your plan
set the plan as a baseline
make changes to the baseline throughout the project
print the actual plan throughout the project.
The advantages of using project management tools
The use of project management tools:
provides a consistent framework for planning, scheduling, monitoring and controlling the project
illustrates the interdependencies of all tasks, work packages and work units
denotes time when specific individuals must be available for work on a given task
determines an expected project completion date
identifies critical activities which, if delayed, postpone or push back the project completion time
identifies activities with slack (those can be delayed for specified periods without penalty) or activities from which resources may be temporarily borrowed without harm
document.doc
© State of New South Wales, Department of Education and Training 2006 25

Reading: Use project management tools
determines dates on which tasks may be started or must be started if the project is to remain on-schedule
illustrates which tasks must be co-ordinated to avoid resource or timing conflicts
illustrates which tasks may or must be run in parallel to achieve the pre-determined project completion date
allows an estimate of the probability of the project completion by various dates or the date corresponding to a particular probability, depending on the network form used.
The disadvantages of using project management tools
There can be drawbacks to using project management tools of which you should be aware, including that:
during the ongoing operation, the schedule function in projects may lack the continuity of day-to-day operations and often presents much more complex problems of coordination
not all project activities need to be scheduled at the same level of detail
The main drawback is the over-emphasis placed on time and its control relative to performance, quality, process, costs and other factors, which may be more critical for some projects.
document.doc
© State of New South Wales, Department of Education and Training 2006 26
Reading: Use project management tools
Summary
Using the right project management software will let you concentrate on the management of the project and greatly assist in the success of the project.
In this topic we have introduced some commonly used methods and software tools that can help you create your own Gantt charts, network diagrams, activity lists, resource lists, critical path diagrams, and various project reports.
document.doc
© State of New South Wales, Department of Education and Training 2006 27