useful life of a reservoir and its dependency on … life of a reservoir and its dependency on...
TRANSCRIPT

Useful Life of a Reservoir and its Dependency on Watershed Activities
Qamar Sultana1* and Gopal Naik M2
1MuffakhamJah College of Engineering & Tech, India 2University College of Engineering (UCE) OU, India
Submission: June 19, 2017; Published: July 28, 2017*Corresponding author: Qamar Sultana, MuffakhamJah College of Engineering & Tech, Hyderabad, India, Email:
Agri Res & Tech: Open Access J 8(5): ARTOAJ.MS.ID.555749 (2017) 001
Research ArticleVolume 8 Issue 5 - July 2017DOI: 10.19080/ARTOAJ.2017.08.555749
Agri Res & Tech: Open Access JCopyright © All rights are reserved by Qamar Sultana
Introduction
The significance of dams in the present and in future to the society has been discussed by Veltrop [2]. Dams are an important infrastructure since they produce, a regulated water supply, and its value tends to increase with time as water supplies become increasingly scarce relative to demand. The importance of reservoirs to society can be expected to increase over time as population, economic activity, and irrigation demand grows. While modern hydraulic systems consist of many elements to appropriate both surface and groundwater supplies, in many regions reservoirs are the single most important component. In terms of consumptive use volume, irrigation is the most important user of water from reservoirs. Irrigated acreage has been expanding at the rate of about 30 percent per decade. One-third of the global harvest comes from that 17 percent of the world’s crop land receiving irrigation and irrigation deliveries worldwide now equal 5 times the average flow of the Mississippi River Postel [3].
However, uncontrolled sediment accumulation makes storage reservoirs the key non-sustainable component of modern water supply systems.
Sedimentation is a major unavoidable phenomenon in all the reservoirs. Many empirical studies have been done for reservoir sedimentation since 1950’s. Prediction of reservoir useful
lifetime is the final target of all the reservoir designers making the issue as an important subject within hydraulic research Lawankar et al. [4]. Sultana et al. [5] applied the empirical equations given by Brune [6], Gill [1] and stated that the trap efficiency estimated for Sriramsagar reservoir were fairly good. The results showed that the Brune’s and Gill’s method estimated the trap efficiency better than the Brown’s method.
Methods and Materials
Study area
In this study, the useful life of Sriramsagar reservoir (SRSP), is determined which is situated in the Telangana State, in India. This project was formerly known as the Pochampadu irrigation project. It is built on the river Godavari. The river Godavari is one of the major peninsular rivers in southern India, and the third largest in India. The Sriramsagar Project or the Pochampadu Project is a part of the Godavari middle sub basin of the Godavari basin. Sriramsagar Reservoir is a Major Irrigation Project with a Gross Storage capacity of 112TMC at FRL 1091Ft intended to provide Irrigation facilities in 9.68Lakh Acres in four districts viz. Adilabad, Nizambad, Karimnagar and Warangal districts. The useful life of a storage reservoir depends upon the rate of sediment deposition in the reservoir. At the planning stage of the reservoir, a provision of dead storage to extent of 30TMC,
Abstract
The developmental and remedial measure activities within the reservoir watershed, results in large variations in the discharge of volumes of sediment to the reservoir, which in turn affects the useful life of the reservoir. The information of the loss of storage capacity and the period of time over which the sediment would interfere with the useful functioning of the reservoir necessitate the reservoir sedimentation studies. In this study the empirical equation given by Gill [1] is used to determine the useful life of the reservoir, which uses the trap efficiency approach. Also the remote sensing data is used to generate the images of the land use and land cover maps and drainage maps to study about the variations of catchment area to discuss the changes in the useful life of the reservoir. The useful life of the reservoir is estimated to be 240 years.
Keywords: Trap efficiency; Useful life of reservoir; Empirical method

How to cite this article: Qamar S, Gopal N M. Useful Life of a Reservoir and its Dependency on Watershed Activities. Agri Res & Tech: Open Access J. 2017; 8(5): 555749. DOI: 10.19080/ARTOAJ.2017.08.555749.002
Agricultural Research & Technology: Open Access Journal
assuming the life of the reservoir as 100 years has been made to accommodate the silt deposition. The original capacity of the reservoir in 1984 was 112 TMC. The capacity of the reservoir from the 1994 surveys is found to be 90 TMC and the capacity of the reservoir was reduced to 80TMC as per 2014 surveys. The loss of capacity till 2014 is found to be 32 TMC. Remedial measures were taken later on by construction of 152 number of silt arresting tanks, 26 numbers of check dams and afforestation in foreshore area.
The hydrological and sediment data has been acquired from Central Water Commission Board (CWC), Hyderabad and
Sriramsagar Reservoir Camp Office (SRSP)-I, Hyderabad. Remote sensing data from Indian Remote Sensing satellites IRS-1D & RESOURCESAT/IRS-P6 , with linear imaging and self-scanning sensor (LISS-III sensors) which operates in three spectral bands in VNIR and one band in SWIR with a spatial resolution of 23.5m and a swath of 141km for the year 2008 and 2013 has been acquired. ArcGIS-10.2.2 software is used to generate the False Color Composite Figures (FCC), Land Use/Land Cover (LU/LC) images, slope maps, drainage maps with the count of the stream order for the catchment area of Sriramsagar reservoir for the year 2008 and 2013.
Figure 1: False Color Composite Figures of Godavari Middle Sub Basin of year 2008 and 2013.
Figure 2: Drainage Maps of Godavari Middle Sub Basin for the year 2008 and 2013.
Figure 1 shows the false color composite figures of the catchment area of Sriramsagar reservoir for the years 2008 and 2013. From the Figure 2 and Table 1, observations in the change of stream patterns can be done. The major change is seen in the reduction in the number of first order streams. The higher order stream pattern remains more or less the same.
From the Figure 3 & Table 2, it is observed that there is increase in the grasslands area, agricultural land area and the wet land area from the year 2008 to 2013, which reduces the soil erosion, which in turn reduces the sediment reaching the reservoir.

How to cite this article: Qamar S, Gopal N M. Useful Life of a Reservoir and its Dependency on Watershed Activities. Agri Res & Tech: Open Access J. 2017; 8(5): 555749. DOI: 10.19080/ARTOAJ.2017.08.555749.003
Agricultural Research & Technology: Open Access Journal
Table 1: Table showing the variations in the streams for the year 2008 and 2013.
Stream Order No of Streams
2008 2013
1 811 804
2 379 380
3 184 187
4 109 103
5 76 71
6 43 43
Total 1602 1588
Table 2: Land Use and Land Cover Data of the Godavari Middle Sub Basin.
Type of Land Use/Land Cover
Area Coverage in 2008 (Sq.Km)
Area Coverage in 2013 (Sq.Km)
Water bodies 2.399671 1.5141
Agriculture 10.750954 12.32777
Grass Land 11.144956 20.291451
Vacant Land 15.507007 14.285333
Waste Land 15.372674 5.526783
Wet Land 12.284997 19.986105
Built Up Land 9.94515 9.054327
Figure 3: Land Use and Land Cover of the catchment area of Sriramsagar reservoir for the year 2008 and 2013.
Estimation of useful life of the reservoir
A direct method for useful life estimation of a reservoir was proposed by Gill [1] which correlates the reservoir capacity with age in years algebraically. With the relationship between sedimentation rates, Te, specific weight of sediment deposited, the storage available after sedimentation for a given period Δt was estimated using the following equation 1.
Co-C= (G*Te*Dt)/Ῡ (1)
where, Co is the initial capacity of reservoir; C, is reduced capacity of reservoir at any time t; G is the characteristic weight of annual sediment inflow; Δt is a short interval of time in years in which capacity is reduced from Co to C; and Ῡis specific weight of sediment deposited. Assuming a period in which the initial reservoir capacity will reduce to half (means C=Co/2) as useful life of a reservoir and by substituting the value of Te, Gill [1] derived equations for estimating the useful life of a reservoir and are shown in the equations 2 to 4.
Primarily Highly Flocculated and Coarse Grained Sediments:
T_L=[ῩxI/G][0.49735Co/I+0.3x〖10〗^(-5) I/Co+0.00436] (2)
Median Curve (for Medium Sediments):
T_L=[ῩxI/G][0.008+0.51Co/I] (3)
Primarily Colloidal and Dispersed Fine-grained Sediments:
T_L=[ῩxI/G][0.51328Co/I+0.133x〖10〗^(-3) I Co+0.513x〖10〗^(-5) [I/Co]^2+0.018167] (4)
Where TL is useful life of reservoir in years, e.g., time in which the initial reservoir capacity Co will reduce to half.
Specific weight of deposited reservoir sediment
The runoff load is usually computed in terms of weight by time, as t/year, and shall be converted into equivalent volume, as m3/year, by knowing the specific weight. Lara and Pemberton realized by performing researches with samplings from existing reservoirs that the specific weight for sediment deposits may be computed according to the kind of operation for the specific reservoir, the level of sediment compaction and granulometry, which are the most influent factors for deposits consolidation.

How to cite this article: Qamar S, Gopal N M. Useful Life of a Reservoir and its Dependency on Watershed Activities. Agri Res & Tech: Open Access J. 2017; 8(5): 555749. DOI: 10.19080/ARTOAJ.2017.08.555749.004
Agricultural Research & Technology: Open Access Journal
Less influent facts may be mentioned, such as the density of the reservoir’s stream sediment, the slope for the tributary stream and the vegetation effect on the reservoir headwaters area.
The bulk density or the specific weight (unit weight of dry sediment material in kg/m3) of the deposits will vary with the proportions of sand (>0.05mm), silt (0.01 to 0.05mm) and clay materials (<0.01mm), the type of reservoir operation (exposed or submerged sediment deposits) and the consolidation period. The variation range is about 300 to 1600 kg/m3. The lower densities generally occur in the vicinity of the dam under submerged conditions, while the higher densities generally occur in the upstream part of the reservoir and exposed regions after drawdown of the reservoir. Based on data from reservoirs in the USA, Lara and Pemberton [7] derived an expression for the initial (at t=0) bulk density shown in the equation 5.
γ_i=W_c P_c+W_m P_m+W_s P_s (5)
Where:
γi = initial specific weight (t/m3).
Wc, Wm ,Ws = coefficient of compaction for clay, silt and sand respectively obtained according to the kind of reservoir operation shown in the Table 3.
Pc, Pm, Ps = fractions of quantities of clay, silt and sand contained in the tributary sediment.
Murthy [8] presents many data of bulk density values from reservoirs (mostly submerged sediments in reservoirs with moderate drawdown) in India. Based on a total of 380 samples
(taken by a corer sampler), Wc (clay), initial = 480kg/m3, Wm (silt), initial = 1040kg/m3, Ws(sand), initial= 1470 kg/m3.
The specific weight increases with time due to compaction. Lane and Koelzer [9] proposed an expression 6, which gives the specific weight of the first year’s deposition after T years of compaction due to later deposits (on top of the first year’s deposit):
γ_T=γ_i+Klog(T) (6)
Miller [10] developed an expression shown in the equation 7 representing the average density of the total deposited sediment package in the reservoir from one to T years:
γ_T=γ_i+0.4343xK[(T/(T-1))ln(T)-1] (7)
γT= average specific weight in T years (t/m3);
T = settled sediment compaction time (years);
K = constant depended on sediment granulometry and based on the kind of reservoir operation as shown in the Table 3.
Table 3: Kind of reservoir operation (adapted from Strand, 1974).
Kind Reservoir Operation
1 Sediment always, or almost always, submerged
2 Little to medium reservoir depletion
3 Reservoir reporting significant level variations
4 Reservoir usually empty
The values for coefficients γi, γT and K, as presented by Strand, were adjusted to be used in the metric system.
Methodology applicationTable 4: Characteristic values of specific weights (initial and after compaction).
Reservoir Type Initial(T=0) Compacted After Time T
Wc(Clay) Kg/m3
Wm(Silt) Kg/m3
Ws(Sand) Kg/m3
Wc (Clay) Kg/m3 Kc
Wm(Silt) Kg/m3 Km
Ws(Sand) Kg/m3 Ks
Always submerged 415 1120 1550 480 255 1040 90 1550 0
Normally moderate to considerable
drawdown
560 1140 1550 735 170 1185 45 1550 0
Normally empty 640 1170 1550 960 100 1265 15 1550 0
River bed sediment 960 1170 1550 1250 0 1310 0 1550 0
The specific weights of the deposited sediment are computed using the characteristic values of the specific weights for the suitable reservoir condition shown in the Table 4. In computing the specific weights of the deposited sediment, the percentages of sand, silt and clay in the sediment is considered which is shown in the Table 5. Lara and Pemberton’s expression for the initial (at t=0) bulk density shown in the equation 5 is used to
calculate the initial specific weights. Miller’s expression shown in the equation 7 is used for determination of average density of the total deposited sediment package in the reservoir from one to T years. Gill’s equation shown in the equation 4 for primarily colloidal and dispersed fine-grained sediments is used to calculate the useful life of reservoir.

How to cite this article: Qamar S, Gopal N M. Useful Life of a Reservoir and its Dependency on Watershed Activities. Agri Res & Tech: Open Access J. 2017; 8(5): 555749. DOI: 10.19080/ARTOAJ.2017.08.555749.005
Agricultural Research & Technology: Open Access Journal
Table 5: Computation of specific weights of deposited sediment.
Year Pc (clay)% Pm (silt)% Ps (sand)% γi(kg/m3)= PcWc+PmWm+PsWs
K= KcPc+KmPm+KsPs T γT (Kg/m3)
1987 0.99 0.00 0.01 425.83 252.56 26 687.80
1988 0.97 0.01 0.02 447.67 247.61 25 700.71
1989 0.96 0.01 0.04 461.57 244.50 24 707.52
1990 0.96 0.00 0.03 456.61 245.63 23 699.61
1991 0.97 0.00 0.03 446.94 247.81 22 687.83
1992 0.98 0.00 0.02 438.20 249.77 21 676.49
1993 0.98 0.00 0.02 438.94 249.59 20 672.36
1994 1.00 0.00 0.00 418.16 254.29 19 650.96
1995 1.00 0.00 0.00 416.09 254.75 18 644.06
1996 1.00 0.00 0.00 415.78 254.82 17 638.26
1997 1.00 0.00 0.00 415.00 255.00 16 631.78
1998 1.00 0.00 0.00 415.42 254.91 15 625.93
1999 1.00 0.00 0.00 416.26 254.72 14 620.03
2000 1.00 0.00 0.00 415.63 254.86 13 612.50
2001 1.00 0.00 0.00 416.35 254.69 12 605.59
2002 1.00 0.00 0.00 418.30 254.24 11 599.13
2003 1.00 0.00 0.00 416.66 254.62 10 588.99
2004 0.98 0.01 0.02 434.45 244.37 9 587.67
2005 0.97 0.02 0.01 436.81 249.96 8 586.24
2006 0.98 0.01 0.02 436.59 250.12 7 574.57
2007 0.98 0.01 0.02 438.72 249.63 6 563.41
2008 0.97 0.01 0.02 441.45 249.01 5 550.87
2009 0.97 0.01 0.02 442.29 248.82 4 533.97
2010 0.97 0.01 0.02 445.15 248.17 3 514.99
2011 0.95 0.01 0.03 460.72 244.63 2 501.76
2012 0.93 0.02 0.04 481.41 239.94 1 481.41
Average 613.24
Year Pc (clay)% Pm (silt)% Ps (sand)% γi(kg/m3)= PcWc+PmWm+PsWs
K=
KcPc+KmPm+KsPs
T γT (Kg/m3)
1987 0.99 0.00 0.01 425.83 252.56 26 687.80
1988 0.97 0.01 0.02 447.67 247.61 25 700.71
1989 0.96 0.01 0.04 461.57 244.50 24 707.52
1990 0.96 0.00 0.03 456.61 245.63 23 699.61
1991 0.97 0.00 0.03 446.94 247.81 22 687.83
1992 0.98 0.00 0.02 438.20 249.77 21 676.49
1993 0.98 0.00 0.02 438.94 249.59 20 672.36
1994 1.00 0.00 0.00 418.16 254.29 19 650.96
1995 1.00 0.00 0.00 416.09 254.75 18 644.06
1996 1.00 0.00 0.00 415.78 254.82 17 638.26
1997 1.00 0.00 0.00 415.00 255.00 16 631.78
1998 1.00 0.00 0.00 415.42 254.91 15 625.93
1999 1.00 0.00 0.00 416.26 254.72 14 620.03

How to cite this article: Qamar S, Gopal N M. Useful Life of a Reservoir and its Dependency on Watershed Activities. Agri Res & Tech: Open Access J. 2017; 8(5): 555749. DOI: 10.19080/ARTOAJ.2017.08.555749.006
Agricultural Research & Technology: Open Access Journal
2000 1.00 0.00 0.00 415.63 254.86 13 612.50
2001 1.00 0.00 0.00 416.35 254.69 12 605.59
2002 1.00 0.00 0.00 418.30 254.24 11 599.13
2003 1.00 0.00 0.00 416.66 254.62 10 588.99
2004 0.98 0.01 0.02 434.45 244.37 9 587.67
2005 0.97 0.02 0.01 436.81 249.96 8 586.24
2006 0.98 0.01 0.02 436.59 250.12 7 574.57
2007 0.98 0.01 0.02 438.72 249.63 6 563.41
2008 0.97 0.01 0.02 441.45 249.01 5 550.87
2009 0.97 0.01 0.02 442.29 248.82 4 533.97
2010 0.97 0.01 0.02 445.15 248.17 3 514.99
2011 0.95 0.01 0.03 460.72 244.63 2 501.76
2012 0.93 0.02 0.04 481.41 239.94 1 481.41
Average 613.24
Figure 4: Slope Map of the catchment area of Sriramsagar reservoir for the year 2008 and 2013.
Figure 5: Variations of initial and consolidated specific weights of sediment.

How to cite this article: Qamar S, Gopal N M. Useful Life of a Reservoir and its Dependency on Watershed Activities. Agri Res & Tech: Open Access J. 2017; 8(5): 555749. DOI: 10.19080/ARTOAJ.2017.08.555749.007
Agricultural Research & Technology: Open Access Journal
Results
Figures 4 & 5 shows the plot of the specific weights of the sediment at the initial stage and at a time after consolidation of the sediment. The trend of the curve for the consolidated specific
weight shows that the greater the time period, the higher is the specific weight of the sediment due to consolidation. Using the initial and the consolidated specific weights, the useful life of the reservoir is calculated which is shown in the Table 6.
Table 6: Computation of useful life of reservoir.
year Inflows (I ) (Mcum) Total Sediment Inflow(G)tons TL in years(fine sediment) using the equation
1987 4593.95 6177.69 190.46
1988 3215.82 37079.32 31.86
1989 25900.39 24053.65 60.98
1990 16351.96 25414.93 52.71
1991 19509.94 5822.26 232.46
1992 4863.10 7924.83 146.44
1993 1666.60 1384.30 240.32
1994 2775.15 2971.76 367.61
1995 3586.79 2054.46 530.66
1996 6815.24 3528.72 316.54
1997 4049.05 10021.28 160.38
1998 1583.05 19072.23 54.37
1999 15672.72 2876.50 410.22
2000 6815.07 8153.97 131.46
2001 9185.72 2793.25 388.42
2002 2947.73 1426.89 705.95
2003 3505.65 1754.58 260.49
2004 3147.25 1878.45 280.61
2005 541.16 10691.25 89.81
2006 10622.35 23458.05 44.49
2007 14625.44 3250.45 326.79
2008 2920.04 3110.49 297.67
2009 3707.05 932.33 240.11
2010 1061.09 9146.04 92.76
2011 8848.57 2662.56 336.52
2012 4896.58 1464.75 260.87
Average 240.41
Discussion
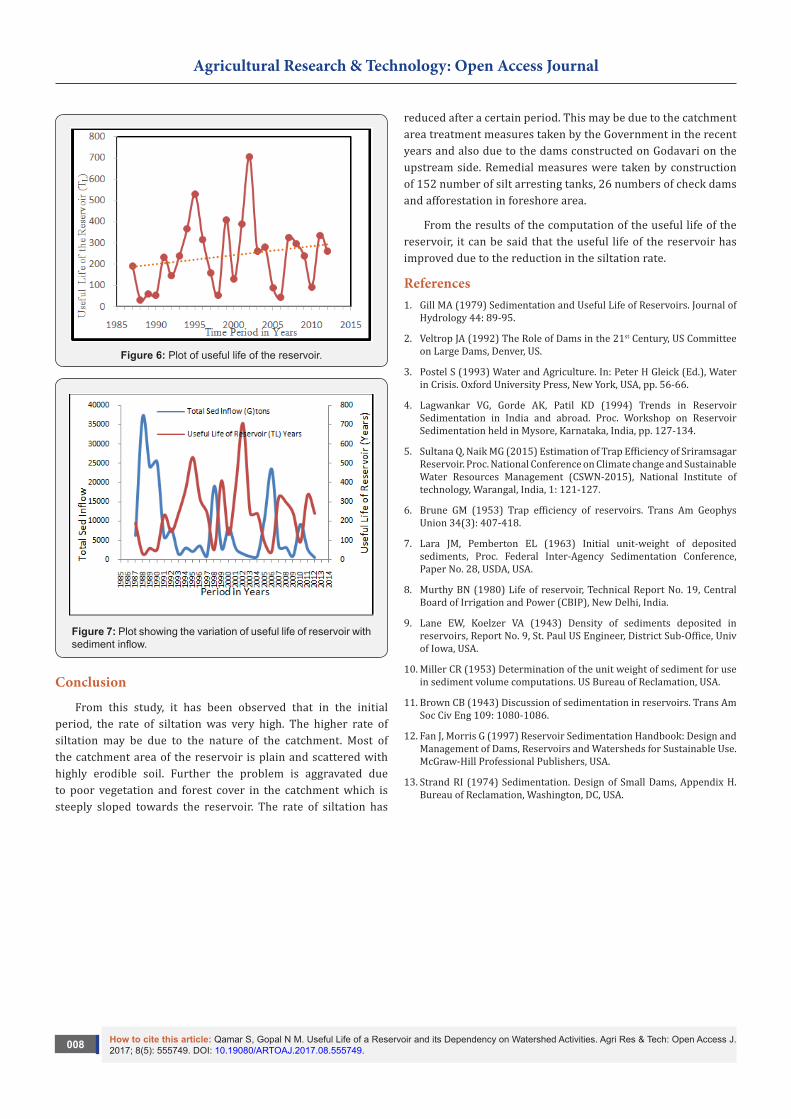
A direct method proposed by Gill [1] which correlates the reservoir capacity with age in years algebraically for primarily colloidal and dispersed fine-grained sediments is used to estimate the useful life of a reservoir. The average useful life of the reservoir computed from 1987 to 2012 is 240 years shown in the Table 6. The Figure 6 shows the plot of the useful life of
the reservoir computed. The average trend line shows a gradual increase in the useful life of the reservoir as in the initial period the rate of siltation was very high and later on there was a reduction in it. Figure 7 shows the variation of the useful life of the reservoir with the total sediment inflow. The plot shows that with the decrease in the sediment, there is an increase in the useful life of the reservoir over a period of time [11-13].
How to cite this article: Qamar S, Gopal N M. Useful Life of a Reservoir and its Dependency on Watershed Activities. Agri Res & Tech: Open Access J. 2017; 8(5): 555749. DOI: 10.19080/ARTOAJ.2017.08.555749.008
Agricultural Research & Technology: Open Access Journal
Figure 6: Plot of useful life of the reservoir.
Figure 7: Plot showing the variation of useful life of reservoir with sediment inflow.
Conclusion
From this study, it has been observed that in the initial period, the rate of siltation was very high. The higher rate of siltation may be due to the nature of the catchment. Most of the catchment area of the reservoir is plain and scattered with highly erodible soil. Further the problem is aggravated due to poor vegetation and forest cover in the catchment which is steeply sloped towards the reservoir. The rate of siltation has
reduced after a certain period. This may be due to the catchment area treatment measures taken by the Government in the recent years and also due to the dams constructed on Godavari on the upstream side. Remedial measures were taken by construction of 152 number of silt arresting tanks, 26 numbers of check dams and afforestation in foreshore area.
From the results of the computation of the useful life of the reservoir, it can be said that the useful life of the reservoir has improved due to the reduction in the siltation rate.
References1. Gill MA (1979) Sedimentation and Useful Life of Reservoirs. Journal of
Hydrology 44: 89-95.
2. Veltrop JA (1992) The Role of Dams in the 21st Century, US Committee on Large Dams, Denver, US.
3. Postel S (1993) Water and Agriculture. In: Peter H Gleick (Ed.), Water in Crisis. Oxford University Press, New York, USA, pp. 56-66.
4. Lagwankar VG, Gorde AK, Patil KD (1994) Trends in Reservoir Sedimentation in India and abroad. Proc. Workshop on Reservoir Sedimentation held in Mysore, Karnataka, India, pp. 127-134.
5. Sultana Q, Naik MG (2015) Estimation of Trap Efficiency of Sriramsagar Reservoir. Proc. National Conference on Climate change and Sustainable Water Resources Management (CSWN-2015), National Institute of technology, Warangal, India, 1: 121-127.
6. Brune GM (1953) Trap efficiency of reservoirs. Trans Am Geophys Union 34(3): 407-418.
7. Lara JM, Pemberton EL (1963) Initial unit-weight of deposited sediments, Proc. Federal Inter-Agency Sedimentation Conference, Paper No. 28, USDA, USA.
8. Murthy BN (1980) Life of reservoir, Technical Report No. 19, Central Board of Irrigation and Power (CBIP), New Delhi, India.
9. Lane EW, Koelzer VA (1943) Density of sediments deposited in reservoirs, Report No. 9, St. Paul US Engineer, District Sub-Office, Univ of Iowa, USA.
10. Miller CR (1953) Determination of the unit weight of sediment for use in sediment volume computations. US Bureau of Reclamation, USA.
11. Brown CB (1943) Discussion of sedimentation in reservoirs. Trans Am Soc Civ Eng 109: 1080-1086.
12. Fan J, Morris G (1997) Reservoir Sedimentation Handbook: Design and Management of Dams, Reservoirs and Watersheds for Sustainable Use. McGraw-Hill Professional Publishers, USA.
13. Strand RI (1974) Sedimentation. Design of Small Dams, Appendix H. Bureau of Reclamation, Washington, DC, USA.

How to cite this article: Qamar S, Gopal N M. Useful Life of a Reservoir and its Dependency on Watershed Activities. Agri Res & Tech: Open Access J. 2017; 8(5): 555749. DOI: 10.19080/ARTOAJ.2017.08.555749.009
Agricultural Research & Technology: Open Access Journal
Your next submission with Juniper Publishers will reach you the below assets
• Quality Editorial service• Swift Peer Review• Reprints availability• E-prints Service• Manuscript Podcast for convenient understanding• Global attainment for your research• Manuscript accessibility in different formats
( Pdf, E-pub, Full Text, Audio) • Unceasing customer service
Track the below URL for one-step submission https://juniperpublishers.com/online-submission.php
This work is licensed under CreativeCommons Attribution 4.0 LicenseDOI: 10.19080/ARTOAJ.2017.07.555749