useful’metrics’for’agile’teams’ - meetupfiles.meetup.com/1470859/agile_metrics.pdf•...
TRANSCRIPT

Useful Metrics for Agile Teams

Agenda
• Useful Agile Metrics • Produc6vity Metrics • Quality Metrics • Predictability Metrics • Value Metrics • Discussion
Note: This presenta6on contains two Appendices. Appendix A: References and Appendix B: Checklist for Crea6ng Metrics

Useful Agile Metrics
3
Useful Agile Metrics
Reinforce Agile Principles Fuel Meaningful Conversa6on
Easy to Collect
Measure Trends Clear Context
Measure Results Not Output
Provide Regular Feedback Just Enough Metrics
Encourage Good Enough Quality
Measure Value or Process

Useful Agile Metrics • Measurement is important • Empirical process controls • Provides feedback on processes • Informa6on for inspec1on & adapta1on
4

Useful Agile Metrics
Useful Agile Metrics by category:
5
Produc6vity Quality Predictability Value
Usefulness (Lower) (Higher)
• Business Value Delivered
• Customer Sa1sfac1on
• Team Sa1sfac1on
• Velocity • Sprint Burn-‐
down chart • Release Burn-‐
down Chart
• Running Tested Features (RTF)
• Shortening the Tail
• Defects • Technical Debt • Process
Assessment
• Story Cycle Time
• Work in Progress
• Impediment Impact

Produc6vity Metrics
6

Useful Agile Metrics • Story Cycle Time (Produc6vity)
– How long a story is in progress – Cycle 6me per story by Sprint – Lower value is beXer
7
0
2
4
6
8
10
1 2 3 4 5
Story Cycle Time
Day
s
Iterations

Useful Agile Metrics • Story Cycle Time
– Story Cycle Time was trending down for the first 3 Itera6ons
– Trend changed in Itera6ons 4 and 5
– Agile Team can discuss root causes and iden6fy changes to try out
8
0
2
4
6
8
10
1 2 3 4 5
Story Cycle Time
Day
s
Iterations

Useful Agile Metrics • Impediment Impact (Produc6vity)
– Impact of Impediments on Team Produc6vity – Amount of the team’s 6me expended due to open impediments expressed as a cost
9
$800.00 $900.00
$1,260.00
$750.00 $625.00
$-‐
$200.00
$400.00
$600.00
$800.00
$1,000.00
$1,200.00
$1,400.00
1 2 3 4 5
Impediment Impact
Iterations

Useful Agile Metrics • Impediment Impact
– First 3 Itera6ons, impediment impacts rose
– Since Itera6on 3, the Trend is good
– Con6nue to monitor and resolve impediments when iden6fied
10
Iterations
$800.00 $900.00
$1,260.00
$750.00 $625.00
$-‐
$200.00
$400.00
$600.00
$800.00
$1,000.00
$1,200.00
$1,400.00
1 2 3 4 5
Impediment Impact

Useful Agile Metrics • Work in Progress (Produc6vity)
– How many items in progress each day by state – Quickly iden6fy boXlenecks – Average Lead Time and Cycle Time
11

? ?
Useful Agile Metrics • Work in Progress
– 6 weeks from start 6ll 1st deployment (Lead Time)
– Team’s capacity is 40 features for 10 weeks
– Widening Band is Requirements
– BoXleneck is the narrow band below
– Team can start improving Design process
12
0
20
40
60
80
100
120
140
11/1
7/07
11/2
4/07
12/1
/07
12/8
/07
12/1
5/07
12/2
2/07
12/2
9/07
1/5/
08
1/12
/08
1/19
/08
1/26
/08
2/2/
08
2/9/
08
2/16
/08
2/23
/08
Work in Progress
Backlog Requirements Design Construction Testing Deployed
6 Weeks
40 Features

Quality Metrics
13

Useful Agile Metrics • Running Tested Features [RTF] (Quality)
– How many features are passing all their acceptance tests – Each feature has one or more automated acceptance tests – Test are passing = Feature is implemented
14
0
10
20
30
40
1 2 3 4 5
Running Tested Features
Sto
ry P
oint
s
Iterations

Useful Agile Metrics • Running Tested Features [RTF] – Trend was steadily increasing
– In Itera6on 4, RTF not consistent with velocity
– Features have broken tests
– Team can address the broken tests and discuss quality
15
0
10
20
30
40
1 2 3 4 5
Running Tested Features
Sto
ry P
oint
s
Iterations

Useful Agile Metrics • Shortening the Tail (Quality)
– “Feature Freeze” to actual deployment – Focuses on Running, Tested sojware
16
40
30
30
28
85
73
38
15
0 20 40 60 80 100 120 140
Release 1
Release 2
Release 3
Release 4
Days in Development Days 6ll Deployment

? ?
Useful Agile Metrics • Shortening the Tail
– Trend is great – First Release = 85 days to deploy
– In Release 4 = 15 days to deploy
– Automated tes6ng and Test Driven Development
17
40 30 30 28
85 73
38 15
0 50 100 150
Release 1 Release 2 Release 3 Release 4
Days in Development
Days 6ll Deployment

Useful Agile Metrics • Defects (Quality)
– Leading indicator (defects found ajer the Sprint ends) – Lagging indicator (defects found ajer a Release)
18
0
2
4
6
8
10
12
14
1 2 3 4 5
# of Defects
Defects
Open
Fixed
Reported
Iterations

Useful Agile Metrics • Defects
– The team was bringing the defects down (new and exis6ng)
– In Itera6on 5, there is an up6ck & fixing declining # of defects
– Agile Team can discuss what to do to reduce defects
19
0 2 4 6 8
10 12 14
1 2 3 4 5
# of Defects
Defects
Open Fixed Reported
Iterations

Useful Agile Metrics • Technical Debt (Quality)
– Technical Debt is undone work – Bring the code base up to quality standard
20
0 1 2 3 4 5
1 2 3 4 5
Technical Debt
Added
Removed Sto
ry P
oint
s
Iterations

? ?
Useful Agile Metrics • Technical Debt
– Trend for adding debt looks good
– Trend for removing technical debt looks good
– No debt was removed in Itera6on 5, team can discuss
21
0
2
4
6
1 2 3 4 5
Technical Debt
Added Removed
Sto
ry P
oint
s
Iterations

Useful Agile Metrics • Process Assessment (Quality)
– Quality of the Scrum Team’s processes and prac6ces – Taken at regular intervals
22

Useful Agile Metrics • Process Assessment
– Team is gelng preXy decent in most of their processes
– Engineering Prac6ces & Development Team Processes need to be addressed
– Discuss at next Retrospec6ve
23

Predictability Metrics
24

Useful Agile Metrics
• Velocity (Predictability) – Team’s rate of story comple6on
25 Iterations
Sto
ry P
oint
s
0
5
10
15
20
25
30
1 2 3 4 5
Velocity

Useful Agile Metrics • Velocity
– Team has made increases in velocity
– Arrived at a consistent velocity
26
Iterations
Sto
ry P
oint
s
0
5
10
15
20
25
30
1 2 3 4 5
Velocity
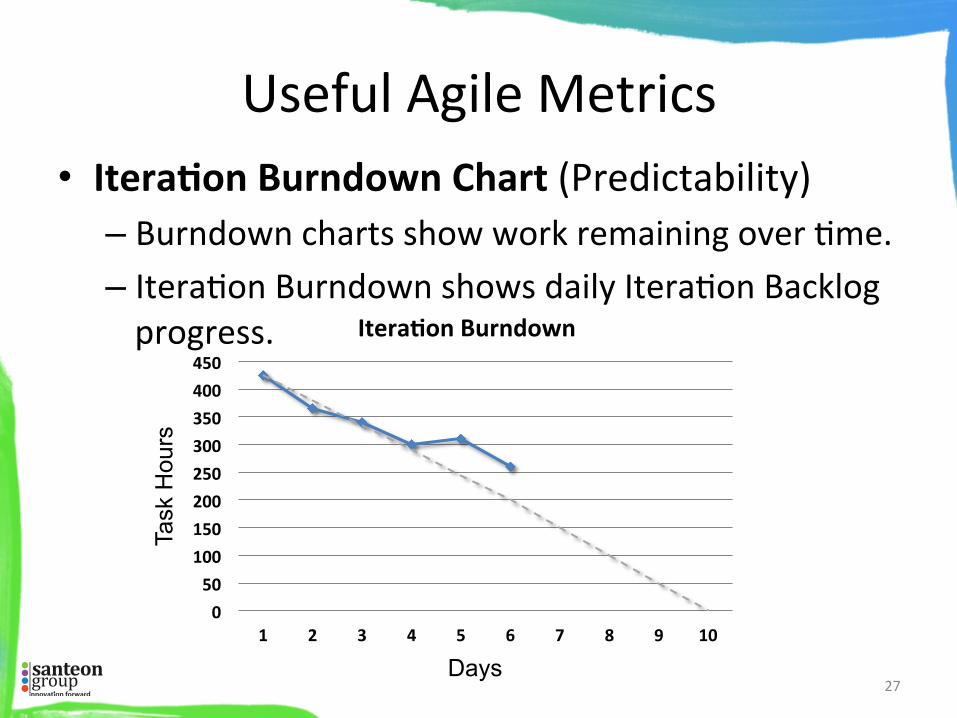
Useful Agile Metrics • Itera1on Burndown Chart (Predictability)
– Burndown charts show work remaining over 6me. – Itera6on Burndown shows daily Itera6on Backlog progress.
27
0 50 100 150 200 250 300 350 400 450
1 2 3 4 5 6 7 8 9 10
Itera1on Burndown
Task
Hou
rs
Days

Useful Agile Metrics • Itera1on Burndown
– On track through day 4.
– Days 5 and 6, more effort than originally es6mated
– Team needs to make adjustments
28
Days
Task
Hou
rs
? ?
0 50
100 150 200 250 300 350 400 450
1 2 3 4 5 6 7 8 9 10
Itera1on Burndown

Useful Agile Metrics • Release Burndown Chart
(Predictability) – Burndown charts show work
remaining over 6me. – Release (Product) Burndown
shows product progress across Itera6ons.
29
0
50
100
150
200
250
1 2 3 4 5 6 7
Release Burndown
Sto
ry P
oint
s
Iterations

Value Metrics
30

Useful Agile Metrics • Business Value Delivered (Value)
– Business value assigned to backlog items – Measure of business value delivered over 6me
31
Iterations
Bus
ines
s Va
lue
0
50
100
150
200
1 2 3 4 5 6 7 8
Business Value

? ?
Useful Agile Metrics • Business Value Delivered – Team delivered majority of value through Itera6on 6
– In Itera6on 7 & 8, incremental business value was small.
– Decide whether to con6nue or not
32
Iterations
Bus
ines
s Va
lue
0
50
100
150
200
1 2 3 4 5 6 7 8
Business Value

Useful Agile Metrics • Customer Sa1sfac1on (Value)
– Customer’s view of the team and its work – Assessed regularly
33

Useful Agile Metrics • Customer Sa1sfac1on
– Product Owner 2 less sa6sfied with the Produc6vity and Quality
– Product Owners 2 & 3 have low sa6sfac6on with budget expended
– Follow-‐up conversa6ons with these Agile Teams
34

Useful Agile Metrics • Team Sa1sfac1on (Value)
– Scrum Team’s view of its processes and work – Assessed regularly
35

Useful Agile Metrics • Team Sa1sfac1on
– Majority of responders are sa6sfied with Scrum
– 8 people have neutral or nega6ve feelings
– 30% of responders with less than posi6ve feelings = follow-‐up conversa6ons
36
? ?
Appendix A: References

Appendix A: References • Hartmann, Deborah, and Robin Dymond. "Appropriate Agile
Measurement:Using Metrics and Diagnos6cs to Deliver Business Value." Berteig Consul6ng. Berteig Consul6ng, Inc. Web. 03 Feb. 2012. < hXp://www.berteigconsul6ng.com/AppropriateAgileMeasurement.pdf >.
• "Towards a Useful Set of Agile Metrics." ScrumSense.com | Leaders in Facilita6ng Las6ng Agile Change. ScrumSense.com, 16 May 2009. Web. 03 Feb. 2012. < hXp://www.scrumsense.com >.
• Derby, Esther. "Metrics for Agile." Web log post. Esther Derby Associates, Inc. Esther Derby, 11 Oct. 2011. Web. 03 Feb. 2012. < hXp://www.estherderby.com/2011/10/metrics-‐for-‐agile.html >.
• Carlin, Patricia. "Agile Metrics That MaXer." Lecture. Agile Webinar: Agile Metrics That MaXer. 12 Jan. 2010. Thoughtworks.com. Jan. 2010. Web. 03 Feb. 2012. < hXp://community.thoughtworks.com/files/1c2707ac7c/Agile_Metrics_that_MaXer.pdf >.
38

Appendix A: References • Anderson, David. "Useful Agile Metrics – Cumula6ve Flow." Web log post.
Systems Thinking, Lean and Kanban. WordPress.com, 09 Apr. 2009. Web. 14 Feb. 2012. < hXp://leanandkanban.wordpress.com/2009/04/04/useful-‐agile-‐metrics-‐cumula6ve-‐flow/ >.
39

Appendix B: Checklist for Crea6ng Metrics

Appendix B: Checklist for Crea6ng Metrics
q Name: q Ques1on: q Basis of Measurement:
q Assump1ons: q Level and Usage:
41
q Expected Trend: q When to Use It: q When to Stop Using It: q How to Game It: q Warnings:
Use this checklist when crea6ng metrics:

Appendix B: Checklist for Crea6ng Metrics
• Metrics should be considered carefully: q Name: this should be well chosen to avoid ambiguity, confusion and oversimplifica6on
q Ques1on: It should answer a specific, clear ques6on for a par6cular role or group. If there are mul6ple ques6ons, design other metrics.
q Basis of Measurement: clearly state what is being measured, including units. Labeling of graph axes must be clear rather than brief.
q Assump1ons: should be iden6fied to ensure clear understanding of data represented.
q Level and Usage: indicate intended usages at the various levels of the organiza6on including limits on usage (if any)
42

Appendix B: Checklist for Crea6ng Metrics
• Metrics should be considered carefully: q Expected Trend: Indicate what you expect to see happen. Once the metric is proven, document trends.
q When to Use It: What prompted the crea6on of this metric? Has it been used historically?
q When to Stop Using It: When will it outlive its usefulness, become extra baggage, or become misleading?
q How to Game It: Think through the natural ways that people warp behavior or informa6on to yield more favorable outcomes.
q Warnings: Recommend balancing metrics, limits on use, and dangers on improper use.
43

Appendix B: Checklist for Crea6ng Metrics
• Metrics Checklist: Velocity
44

Appendix B: Checklist for Crea6ng Metrics
• Metrics Checklist: Velocity
45

Appendix B: Checklist for Crea6ng Metrics
• Metrics Checklist: Velocity
46

Appendix B: Checklist for Crea6ng Metrics
• Metrics Checklist: Business Value Delivered
47

Appendix B: Checklist for Crea6ng Metrics
• Metrics Checklist: Business Value Delivered
48