user-centric evaluation of a k-furthest neighbor ... · pdf file(n=132) to identify...
TRANSCRIPT

User-Centric Evaluation of a K-Furthest NeighborCollaborative Filtering Recommender Algorithm
Alan SaidTechnische Universitat Berlin
Ben FieldsMusicmetric (Semetric Ltd.)
Brijnesh J. JainTechnische Universitat Berlin
[email protected] Albayrak
Technische Universitat [email protected]
ABSTRACTCollaborative filtering recommender systems often usenearest neighbor methods to identify candidate items. Inthis paper we present an inverted neighborhood model,k-Furthest Neighbors, to identify less ordinary neighbor-hoods for the purpose of creating more diverse recom-mendations. The approach is evaluated two-fold, oncein a traditional information retrieval evaluation settingwhere the model is trained and validated on a splittrain/test set, and once through an online user study(N=132) to identify users’ perceived quality of the rec-ommender. A standard k-nearest neighbor recommenderis used as a baseline in both evaluation settings. Ourevaluation shows that even though the proposed furthestneighbor model is outperformed in the traditional eval-uation setting, the perceived usefulness of the algorithmshows no significant difference in the results of the userstudy.
ACM Classification KeywordsH.3.3 Information Storage and Retrieval: InformationSearch and Retrieval - Information filtering, Retrievalmodels, Selection process; H.5.1 Multimedia InformationSystems: Evaluation/methodology
General TermsAlgorithms, Design, Experimentation, Human Factors,Measurement
Author KeywordsRecommender Systems; Evaluation; Long Tail; NearestNeighbors; Diversity; Usefulness; CollaborativeFiltering; User-centric Evaluation
INTRODUCTIONIn recent years the methods used in item-centric recom-mender systems have continued a steady increase in theaccuracy of recommended items. Assuming the goal of
Permission to make digital or hard copies of all or part of this work forpersonal or classroom use is granted without fee provided that copies arenot made or distributed for profit or commercial advantage and that copiesbear this notice and the full citation on the first page. To copy otherwise, orrepublish, to post on servers or to redistribute to lists, requires prior specificpermission and/or a fee.CSCW’13, February 23–27, 2013, San Antonio, Texas, USA.Copyright 2012 ACM 978-1-4503-1209-7/13/02...$15.00.
a system is accurate prediction of ratings, this obviouslyrepresents progress. But it is worth asking, are we miss-ing something? The way these systems are understoodis explicitly defined via the way they are tested; focus onpredictive accuracy can be sufficiently narrow as to missthe broader point. A system that recommends items tousers needs to be tested to determine the rate of satis-faction of its users. Without measuring user satisfaction,there is no means to map the much more common auto-mated measures (e.g. predictive accuracy) back to theusers of an evaluated system [13].
The most direct way to do this is via user study. Specif-ically, with the goal in mind of examining effects thatmay be lost to standard accuracy measures, this paperconducts a comparative user study looking at two dis-tinct approaches to item-based recommendation. Bothof these approaches come in the form of the neighbor-hood model. The first of the these two models is k-nearest neighbors (kNN), where neighborhoods of itemsare created based on item rating history. Each user’sneighborhood is used as a basis to generate future rec-ommendations. kNN is one of the most prevalent algo-rithms used in item-based recommender systems and hasbeen explored in depth by e.g. [4, 6, 8, 25].
While kNN is widespread and understood, it is not with-out problems. Among these are: lack of diverse recom-mendations, the maximal distribution of recommendeditems across the space of all possible items, and of theobviousness of recommendations. These are all aspectswhich are not captured in standard recommender systemevaluation measures. It is with these deficits in mindthat the second algorithm has been selected. Startingwith the core idea of kNN, that of a neighborhood ofusers, k-furtherest neighbors (kFN) pulls kNN inside-out; this approach creates neighbors of maximally dis-similar users and then recommends items that a user’sneighbors are most likely to dislike [23]. It is hypothe-sized that this double-negative style of similarity-basedrecommender will perform better in terms of both nov-elty and obviousness, while maintaining an acceptablelevel of predictive accuracy. In order to evaluate theactual, perceived, quality of the recommendations, theuser study focuses less on traditional evaluation metrics,and instead examines the algorithms from a user-centricperspective.

RELATED WORKTwo relevant channels of previous work provide back-ground for this research. First, many existing ap-proaches to increasing recommendation accuracy of rec-ommender systems do so at the expense of diversity andnovelty, and by increasing the computational cost of theresulting algorithms [12,24]. Second, understanding theneeds and opinions of your users (and how best to gatherthese) is critical to specifying an algorithm that adds sig-nificant value to a system from the user’s perspective.
Accuracy vs. DiversityOne of the key reasons why lack of diversity, thoughlong noticed in recommender systems, remains a prob-lem, is tied to the observation that algorithms modifiedto increase diversity have as a byproduct lower predictiveaccuracy.
The broad justifications of the importance of diversityare outlined in [26]. Here diversity is held up in contrastto similarity as a counter aim of recommender systems.The paper proposes and evaluates some case-based rea-soning (CBR) approaches to recommendation that em-phasize diversity. While successful in its stated goals,the underlying CBR approach itself can be difficult toscale and quite complex. Further, the dichotomy set upin this work of similarity versus diversity can be seenas false if the task being considered is ‘recommend theitems a user will like’. The goal is neither to find itemsthat are similar to each other or spread over the itemspace, rather to satisfy a user.
This idea of diversity tradeoffs not really being trade-offs at all is furthered in [29]. In this work a hybrid ofmultiple algorithms is used to increase both predictiveaccuracy and diversity in a single system. While theoutput of such a system is excellent, it is not withoutcost. The effective complexity of such a system is quitehigh, being the combination of the underlying pieces ofthe hybrid model. However, this system does achieve itsaims and in cases where the complexity is less impor-tant (e.g. domains with small datasets) it presents aneffective solution.
Approaches which, like ours, try to raise the perceivedvalues at the cost of standard accuracy metrics include[30] which defines the intra-list similarity metric as ameans of measuring diversity in recommendations. Sim-ilarly [19] defines the metrics unexpectedness and unex-pectedness r for measuring the level of diversity a rec-ommendation algorithm achieves. More recently, theAuralist framework [28], successfully creates a serendip-itous, diverse and novel hybrid recommendation engineby combining several algorithms, similar to [29] the costof this approach is the complicated underlying model.
There are of course multiple ways of considering diver-sity. While in the remainder of this paper we take diver-sity in terms of fixed-in-time snapshots of our dataset,diversity is considered via user ratings over time in [16].The resulting model of diversity in time-ordered se-
quence highlights user-behavioral patterns of great in-terest when constructing a recommender system. Thework reveals a number of insights into the effects of userbehavior on recommended item diversity, such as an in-verse relationship between profile size (i.e. items ratedby a user) and the diversity of items recommended to auser.
User-Centricity and SatisfactionWhen considering metrics for evaluation of a recom-mender system, keeping the user central and focusing onuser satisfaction, is vital. Bringing people into the equa-tion does complicate methods and evaluation though,and raises a number of issues.
One early way that recommender systems’ users wereexplicitly considered was with regard to trust and pri-vacy [15]. This work formalized various issues aroundtrust in recommender systems especially concerning pri-vacy in sharing preferences. Perhaps most relevantly, thepaper considered how users may be prone to increase in-stances of explicit bias in the expression of ratings whenthey do not trust a recommender.
A means to increase a user’s trust in a system is to op-timize the utility or usefulness of the recommendationsa system offers to a user. Previous research has con-cluded that the reliance on predictive accuracy as themost critical measure is detrimental to the overall util-ity of a recommender system [18]. Thus it makes a greatdeal of sense to consider a recommender using a morerich and diverse set of metrics, especially focused on theuser.
This presents another problem though. If we give up areliance on standard automatic measures, what evalua-tion should be done and why? The ResQue framework isone such solution [20]. This framework presents a unifiedand extremely rigorous approach to user-driven evalua-tion, though it is time intensive for participants and maybe overly costly for focused hypothesis testing.
NEIGHBORHOOD MODELSCommonly memory-based collaborative filtering mod-els utilize the k-nearest neighbor approach to identifycandidate items [7]. This approach uses a neighbor-hood of similar users to identify and recommend itemsto users. Neighborhoods are created by, for each user,finding users within a certain similarity. Each user’sneighborhood contains the k users’ who’s similarity ishighest, an abstract outline of the algorithm is shownin Algorithm 1. Recommendations are then created byiterating over all the items rated by the user’s neighborswhich have not been seen by the user, and estimating thepreference of each item by averaging all neighbors’ rat-ing values for each item multiplied with each neighbor’ssimilarity value. Ultimately, the highly rated items ofthe most similar neighbors are recommended. The sim-ilarity function for neighbor identification can be freelyselected.

Algorithm 1: The k-nearest neighbor algorithm
Input: set U of usersInput: number k of neighborsOutput: k neighbors for each user u ∈ Uforeach u ∈ U do
foreach u′ ∈ U \ {u} dosu,u′ = similarity(u,u′);
select k neighbors u′ 6= u for u with largest su,u′
Common similarity measures used for neighborhood cre-ation are cosine similarity and Pearson product-momentcorrelation coefficient, when working with data contain-ing ratings.
The Person correlation is calculated by comparing therating values of two users’ co-rated items,
P(u, v) =
∑i∈Iuv
(rui − ru) (rvi − rv)√∑i∈Iuv
(rui − ru)2√∑
i∈Iuv
(rvi − rv)2
(1)
where u and v are the two users, Iuv the intersection ofuser u’s and v’s rated items, and r the rating score, e.g.4 on a scale from 1 to 5.
For binary co-occurrence data, common similarity mea-sures include the Jaccard and Tanimoto coefficients[10,11].
Nearest & Furthest NeighborsNearest neighborhood methods have been frequentlyused in information retrieval and information theory formany years [9], with satisfactory results. However, dueto an inherent popularity bias in consumer-item interac-tion data [17], it is possible that nearest neighbor modelsrecommend items which are merely popular and not ex-plicitly personalized for the user [21,22]. Further, Bourkeet al. found that the method of selecting nearest neigh-bors has little effect on the perceived quality of the rec-ommender system itself [6].
Inverting the k-nearest neighbor algorithm into a k-furthest neighbor algorithm could serve as a means tomitigate the popularity bias and increase diversity, with-out adding more complexity (compared to a k-nearestneighbor algorithm) to a recommender system.
The motivation behind the k-furthest neighbor approachis simple. Due to the inherent bias towards popular itemsin the consumption patterns of people, and the posi-tive rating bias of popular items [17,22], basic similaritymeasures can falsely create similarities solely based onpopular items, instead of on actual taste [22]. In orderto mitigate this effect, the furthest neighbor approachis used. The concept is based on an inverted similaritymodel, which finds items disliked by those least similar toa given user. This has the benefit of not being sensitive
to bias induced by highly rated popular (i.e. obvious ornon-novel) items. The approach first identifies the mostdissimilar users to each user, to create dissimilar neigh-borhoods. In every neighborhood it then identifies themost disliked items and recommends these. This doublenegation creates a more diverse, yet personalized, set ofrecommendations.
Inverting Similarity MetricsIn order to create neighborhoods of the least similarusers, a dissimilarity measure must be defined. Dis-similarity cannot simply be expressed by negatingor inverting traditional similarity measures, as thiswould potentially create neighborhoods of completelyunrelated, or disjoint, users. In order for a dissimilaritymeasure to work accurately, we propose the introductionof the following two constraints: (1) two users whoshare no co-rated items can be considered dissimilar bymetrics such as the cosine similarity and the Pearsoncorrelation. However, this dissimilarity is not basedon an actual disagreement in taste, rather just on thetwo users not having an intersection of rated items. Asimilarity measure like this could result in extremelylarge neighborhoods of completely disjoint users. Inorder to circumvent these “false” dissimilarities, wepropose a minimum co-rated items constraint. Thisconstraint means that in order for two users to be con-sidered dissimilar, they must both have co-interactedwith a number of items. The constraint could beextended to treat popular items differently (e.g. lowerweights for popular items). This, or similar, constraintsare commonly used in kNN-based recommendationapproaches as well in order to heighten (and strengthen)the level of similarity between prospective neighbors.The second constraint, (2) the opposed ratings con-straint, is introduced to secure an actual dissimilarityand is data-specific and relates to a rating scale. Con-sider this example:
Suppose that R is a set of ratings rui submitted by usersu ∈ U for items i ∈ I. Ratings may take values fromthe discrete set {1, 2, 3, 4, 5} of rating scores. Typically,ratings are known only for few user-item pairs.If ua’s set of rated items is (ia,ib,ic,id) rated (1, 3, 4, 1)respectively and ub’s set of rated items is (ia,ib,ic,ie)rated (5, 3, 2, 2) respectively, then the intersectionof items (ia, ib, ic) creates a basis for a dissimilaritycalculation. (ia, ic) are rated on the opposite end of therating scale, ib is however rated in the middle of therating scale and has no antipode. This rating, as well asthose for id and ie, are thus not taken into considerationwhen calculating a dissimilarity.
Given this opposed ratings constraint, the minimum co-rated items constraint does not consider items rated withthe middle value of the rating scale, as the rating can-not be inverted. This rating-based constraint should bemodeled according to the rating scale used in the dataset

or system. For a more precise dissimilarity, the match-ing of opposing ratings could be performed on a per-userlevel. This would be done by first identifying the per-sonal rating scale of each user and subsequently match-ing this onto other users’ personalized rating scales (e.g.some users may only use ratings from each end of therating scale, others may predominantly use ratings fromthe middle, while others use the full rating scale meaningthe matching of 2 to 4 might not be a true match for allusers).
Applying this to the Pearson correlation as presentedin Eq. (1), the similarity would be calculated as:
P(u, v) =
{P(u, v′) : if |I∗uv′ | ≥ m
0 : otherwise
where m is the number of minimum co-rated items,v′ contains the inverted ratings of user v accordingto Eq. (2), and I∗uv′ is the list of co-rated items, ex-cluding items rated with the “middle” score as specifiedby the opposed ratings constraint, i.e. (ia, ic) in the ex-ample above.
Each of user v’s rating rvi is inverted according to thefollowing process
rvi = rmax − rvi + rmin (2)
where rmax is the highest possible score in the ratingscale, rvi is user v’s rating on item i and rmin is thelowest possible score in the rating scale. In the exampleabove ub’s ratings would be rub,ia = 5 − 5 + 1 = 1 andrub,ic = 5− 2 + 1 = 4 turning the rating values 5 and 2to 1 and 4 respectively.
A similar approach could be applied to many otherrecommendation scenarios, e.g. in a Singular ValueDecomposition-based recommender [24], the ratings ofthe candidate user could be inverted prior to trainingthe recommender, followed by recommending the itemswhich, by the recommender, are deemed as least suitablefor the user.
EXPERIMENTS & EVALUATIONTo evaluate the quality of the furthest neighbor model,the Movielens1 10 million ratings dataset was used. Twosets of evaluation experiments were conducted: (1) atraditional setup using a portion of the ratings for train-ing the model, and a portion used for validation, and(2) a user-centric evaluation method based on an on-line study evaluating the perceived usefulness of recom-mended items and users’ overall satisfaction with thesystem.
Both the nearest neighbor and the furthest neighborrecommenders were implemented using the Apache Ma-hout2 framework. Additionally, a random recommender,not taking the users’ ratings into consideration when
1http://www.grouplens.org/system/files/ml-10m-README.html2http://mahout.apache.org/
finding candidate items was also implemented using thesame framework.
To create the neighborhoods, the Pearson correlationwas used for the nearest neighbor approach. The fur-thest neighbor approach was created by inverting thePearson correlation and applying the minimum co-ratedand opposed ratings constraints as described in the pre-vious section. The minimum co-rated items constraintwas set to 5 based on small empirical experiments, aswell as not to exclude users with few ratings. It shouldbe noted that the higher this number is, the more thecalculated dissimilarity accurately reflects the actual dif-ference in taste, however it also minimizes the numberof possible neighbors. In the nearest neighbor scenario,the minimum co-rated constraint was left to the defaultvalue set in the Mahout recommender library, 2. How-ever, as the nearest neighbor approach requires two usersto have similar taste, even a lower number should reflectsome level of similarity.
The neighborhood size for both approaches was set to30. Even though a larger neighborhood (up to approx-imately 100 neighbors [10]) can result in better perfor-mance in terms of accuracy metrics, the neighborhoodsize was kept low to minimize memory usage and keepthe recommendation process fast for the survey.
An additional baseline recommender, a random recom-mender, not taking the users’ ratings into consideration,was used as well. The baseline algorithm, a normal k-nearest neighbor algorithm, was chosen to show the du-ality of both approaches – thus showing the gain in diver-sity compared to a traditional recommendation setting.The random recommender was used to show that effectof the furthest neighbor algorithm were not random.
As mentioned in the previous section, similar invertedsimilarities could potentially be applied to other recom-mendation algorithm. Our choice of the k-nearest neigh-bor algorithm was based on it’s illustrative qualities aswell as on hardware limitations. Experiments with ma-trix factorization-based recommendation approaches re-quired 5 to 7 minutes for retraining of the recommender.The participants in the study would need to wait for theirrecommendation for this period of time, which wouldlikely have detrimental effects on the number of userswho completed the study.
DatasetThe Movielens 10 million ratings dataset, provided bythe Grouplens research group, contains 10, 000, 054 rat-ings by 69, 878 users on 10, 677 movies. The datasetadditionally contains the titles and production years ofmovies.
Using the titles, additional information such as actors,directors, plot, etc., was collected from the InternetMovie Database3. This data was used to display ad-ditional information about the movies in the survey.
3http://www.imdb.com

Traditional EvaluationA traditional offline evaluation approach was used toassess the recommendation quality of the furthest neigh-bor approach. Offline in this sense meaning not interact-ing with users during evaluation, i.e. a data-centric orsystem-oriented evaluation. For this purpose, the abovementioned Movielens dataset was split into training andvalidation sets which were subsequently used to trainand validate the furthest neighbor as well as the nearestneighbor model for comparative purposes.
For each user with at least 2 × N ratings, precisionand recall accuracy at N were evaluated for N ={5, 10, 100, 200}. In each of the cases 20% of the ratingsof each user in the dataset were included. For the vali-dation, only movies having been rated above each user’saverage rating plus 0.5 of the user’s standard deviationof rating scores were considered. Thus making sure onlypositively rated items were treated as true positive rec-ommendations. The remaining ratings were included inthe training set.
User-Centric Evaluation: A Movie RecommendationStudyIn order to make a real-life estimate of the perceivedquality of the furthest neighbor approach, a user studywas performed. The study consisted of two steps, firstparticipants were asked to rate a minimum of 10 moviesfrom a page showing 100 randomly selected movies outof the 500 most rated movies in the Movielens dataset,shown in Fig. 1. Due to the large number of moviesin the dataset (more than 10, 000), we chose randomlyamong the 500 most popular movies in order to showthe participants movies which they would most likely befamiliar with4.
Having rated at least 10 movies, recommendations basedon each participant’s ratings were generated and a pagecontaining the top 10 recommendations and a set of ques-tions was shown, see Fig. 2. The recommender engineproviding the survey with recommendations was similarto the one used in offline evaluation. The difference be-ing that the complete Movielens dataset was used fortraining as this scenario did not include any offline eval-uation. The time to generate recommendations for oneuser, using either of the neighborhood-based algorithms,was under one minute for users having rated a large por-tion of the 100 movies shown; this response time wasconsiderably lower for those only having rated the min-imum allowed number of movies (10). The random rec-ommender did not need any noticeable time for gener-ating recommendations, to create the illusion of person-alized recommendations, one of the neighborhood-based
4In an earlier version of the survey, which was tested on asmall number of users, random movies from the whole setof movies were shown instead. The vast majority of the re-actions collected from these early testers were that most ofthe movies were completely unknown to them, thus we choseto present a random set from the 500 most popular moviesinstead.
Figure 1. The movie rating page where participants wereasked to rate movies. The page contains a random selec-tion of 100 of the 500 most popular movies in the Movie-lens dataset.
Figure 2. The questions presented to the participants ofthe survey after having rated a minimum of 10 ratings.
algorithms was trained (but not used) in parallel to serveas a timer.
The selection of algorithm to be used for each partic-ipant was proportional to a randomized variable. For40% of the participants, the recommendations were to bebased on the traditional k-nearest neighbors approach.Another 40% of the participants were to be given recom-mendations based on the k-furthest neighbors approach,and finally 20% of the participants were to be presentedwith randomized recommendations, not taking their ini-tial ratings into consideration.
QuestionnaireFor each of the 10 recommended movies (shown in theleftmost column in Fig. 2), participants were asked toanswer the following questions:

Have you seen the movie?
if Yes: Please rate it (5 star rating)
if No:
1. Are you familiar with it? (y/n)
2. Would you watch it? (y/n)
Additionally, participants were asked to answer a set of8 question regarding the complete set of recommendeditems. The questions were:
1. Are the recommendations novel?
2. Are the recommendations obvious?
3. Are the recommendations recognizable?
4. Are the recommendations serendipitous?
5. Are the recommendations useful?
6. Pick the movie you consider the best recommendation
7. Pick the movie you consider the worst recommenda-tion
8. Would you use this recommender again?
The participants were asked to answer question 1through 5 by stating the level of agreement, fromstrongly disagree (1) to strongly agree (5). A short de-scription was given for the terms novel, obvious, recog-nizable and serendipitous in order to mitigate erroneousanswers based on misunderstanding of the question. Ad-ditionally a field for comments was placed on the bottomof the survey.
Submission of the answers was only possible after allquestions had been answered.
The questionnaire was designed to create a truthful pic-ture of users’ perceived usefulness of the recommenda-tions, considering aspects such as choice overload [5],construction of questions [13] and similar perception-related concepts [11,27].
The link to the survey was circulated on social mediasites (e.g. Facebook, Twitter, Google+) during the lasttwo weeks of March 2012. People from several profes-sions (computer science professionals, lawyers, businessmanagement professionals) were asked to circulate thelink in their networks in order to gain participants fromseveral communities, thus attempting to minimize anybiasing effects which could surface in answers from a ho-mogeneous community. The data used in this paper wascollected in early April 2012, by then a total of 132 par-ticipants had completed the survey.
Out of the 132 participants in the study, 47 (36%) werepresented with recommendations based on the nearestneighbor model, 43 (33%) based on the furthest neigh-bor model and 42 (32%) based on the random recom-mender (due to the randomized seeding of the algorithm
0
0,02
0,04
0,06
0,08
0,1
0,12
0,14
0,16
N=5 N=10 N=100 N=200
Pre
cisi
on
@N
User groups with N*2 ratings
Nearest Neighbor
Furthest Neighbor
(a) Precision@N
User groups with N*2 ratings
0
0,02
0,04
0,06
0,08
0,1
0,12
0,14
0,16
N=5 N=10 N=100 N=200
Re
call
@N
User groups with N*2 ratings
Nearest Neighbor
Furthest Neighbor
(b) Recall@N
Figure 3. The Precision@N and Recall@N values for userswith 2 × N ratings for the furthest and nearest neighbormodels for the traditional offline evaluation approach.
selection, the percentages are somewhat different fromthe intended 40%, 40%, 20% distribution).
Knijnenburg et al. claim that “at least 20 users” percondition should be adequate for being able to mine sta-tistically sound data from a user study [14], indicatingthe amount of participants in our study should be suffi-cient.
No demographic data except for location (reverse lookupvia IP address) was collected. The participants of thesurvey came from a total of 19 countries on 4 continents.Participants from Germany, Ireland and Sweden weremost prominent, in descending order.
RESULTS & DISCUSSIONThe furthest neighbor approach is outperformed by itsnearest neighbor counterpart in terms of precision andrecall when comparing the performance in an offline eval-uation scenario. However, when comparing the resultsobtained from the user-centric evaluation, the outcomesare different.
Traditional Evaluation ResultsFor small values of N , nearest neighbor outperforms fur-thest by a factor of 8.4 in terms of precision(3.14× 10⁻³
and 3.75× 10⁻⁴ for N = 5 respectively). For larger val-ues the difference in performance grows smaller, with thenearest neighbor approach outperforming the furthestneighbor approach by 8.6% at N = 200. Fig. 3(a) showsthe values for all four evaluated Ns. Performance interms of recall is almost identical to precision, as shownin Fig. 3(b). The results of the random recommenderare not shown as they were several orders of magnitudelower than both neighborhood-based recommenders.
The nearest neighbor approach outperforms the furthestone in traditional information retrieval metrics. How-ever, the recommenders seem to be almost entirely dis-joint in terms of recommended items, as shown in Ta-ble 1, i.e. users get completely different items recom-mended from each of the neighborhood-based recom-mender algorithms.
N = 5 N = 10 N = 100 N = 200
items 42 75 7, 925 27, 295
% 0.0013 0.0012 0.74 3.2
Table 1. The absolute number of intersecting items forthe nearest and furthest neighbor recommender and thepercentage of intersecting items from the whole set ofrecommended items (i.e. N × |U |).
The almost complete orthogonality of recommendeditems indicates that both approaches are complemen-tary, and if optimally combined into one, the resultingprecision value would be the sum of the precision of bothapproaches. A recommender engine which would be ableto create an ensemble recommender by estimating thetrue positive recommendations in each algorithm prior torecommendation would in this case serve as an optimalneighborhood algorithm. Ensembles are however com-monly built by combining the intersecting items fromboth sets of recommendations, which becomes infeasiblein this scenario.
User-Centric ResultsAs stated earlier, participants were presented with rec-ommendations from either a nearest neighbor recom-mender, a furthest neighbor recommender, or a randomrecommender. The results of all three approaches arepresented throughout this section. All t-test values pre-sented are either for two-tailed t-tests (when only twodistributions are compared), or ANOVA testing usingtwo-tailed t-tests with Bonferroni correction (n = 2 fortwo comparisons) [2].
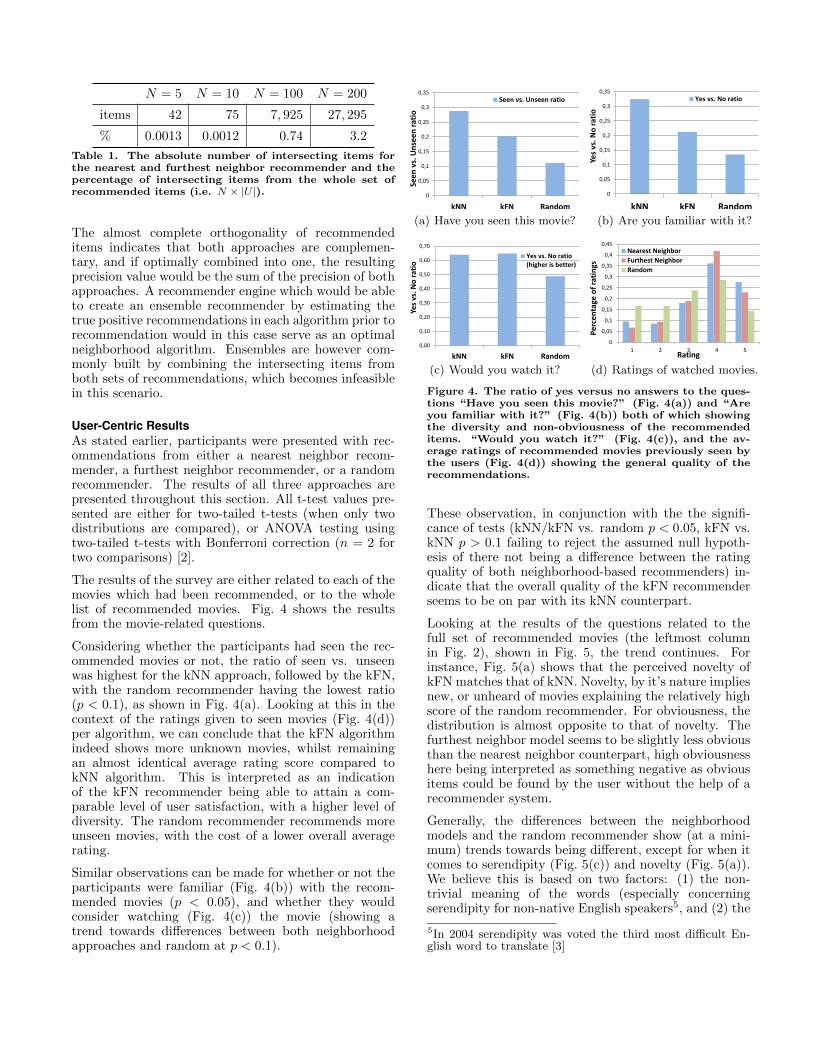
The results of the survey are either related to each of themovies which had been recommended, or to the wholelist of recommended movies. Fig. 4 shows the resultsfrom the movie-related questions.
Considering whether the participants had seen the rec-ommended movies or not, the ratio of seen vs. unseenwas highest for the kNN approach, followed by the kFN,with the random recommender having the lowest ratio(p < 0.1), as shown in Fig. 4(a). Looking at this in thecontext of the ratings given to seen movies (Fig. 4(d))per algorithm, we can conclude that the kFN algorithmindeed shows more unknown movies, whilst remainingan almost identical average rating score compared tokNN algorithm. This is interpreted as an indicationof the kFN recommender being able to attain a com-parable level of user satisfaction, with a higher level ofdiversity. The random recommender recommends moreunseen movies, with the cost of a lower overall averagerating.
Similar observations can be made for whether or not theparticipants were familiar (Fig. 4(b)) with the recom-mended movies (p < 0.05), and whether they wouldconsider watching (Fig. 4(c)) the movie (showing atrend towards differences between both neighborhoodapproaches and random at p < 0.1).
0
0,05
0,1
0,15
0,2
0,25
0,3
0,35
kNN kFN Random
See
n v
s. U
nse
en
rat
io
Seen vs. Unseen ratio
(a) Have you seen this movie?
0
0,05
0,1
0,15
0,2
0,25
0,3
0,35
kNN kFN Random
Yes
vs. N
o r
atio
Yes vs. No ratio
(b) Are you familiar with it?
0,00
0,10
0,20
0,30
0,40
0,50
0,60
0,70
kNN kFN Random
Yes
vs. N
o r
atio
Yes vs. No ratio(higher is better)
(c) Would you watch it?
0
0,05
0,1
0,15
0,2
0,25
0,3
0,35
0,4
0,45
1 2 3 4 5
Pe
rce
nta
ge o
f ra
tin
gs
Rating
Nearest Neighbor
Furthest Neighbor
Random
(d) Ratings of watched movies.
Figure 4. The ratio of yes versus no answers to the ques-tions “Have you seen this movie?” (Fig. 4(a)) and “Areyou familiar with it?” (Fig. 4(b)) both of which showingthe diversity and non-obviousness of the recommendeditems. “Would you watch it?” (Fig. 4(c)), and the av-erage ratings of recommended movies previously seen bythe users (Fig. 4(d)) showing the general quality of therecommendations.
These observation, in conjunction with the the signifi-cance of tests (kNN/kFN vs. random p < 0.05, kFN vs.kNN p > 0.1 failing to reject the assumed null hypoth-esis of there not being a difference between the ratingquality of both neighborhood-based recommenders) in-dicate that the overall quality of the kFN recommenderseems to be on par with its kNN counterpart.
Looking at the results of the questions related to thefull set of recommended movies (the leftmost columnin Fig. 2), shown in Fig. 5, the trend continues. Forinstance, Fig. 5(a) shows that the perceived novelty ofkFN matches that of kNN. Novelty, by it’s nature impliesnew, or unheard of movies explaining the relatively highscore of the random recommender. For obviousness, thedistribution is almost opposite to that of novelty. Thefurthest neighbor model seems to be slightly less obviousthan the nearest neighbor counterpart, high obviousnesshere being interpreted as something negative as obviousitems could be found by the user without the help of arecommender system.
Generally, the differences between the neighborhoodmodels and the random recommender show (at a mini-mum) trends towards being different, except for when itcomes to serendipity (Fig. 5(c)) and novelty (Fig. 5(a)).We believe this is based on two factors: (1) the non-trivial meaning of the words (especially concerningserendipity for non-native English speakers5, and (2) the
5In 2004 serendipity was voted the third most difficult En-glish word to translate [3]

0,00
0,10
0,20
0,30
0,40
0,50
0,60
1 2 3 4 5
Pe
rce
nta
ge o
f an
swe
rs
Level of agreement
Nearest Neighbor
Furthest Neighbor
Random
(a) Novelty.
0,00
0,10
0,20
0,30
0,40
0,50
0,60
1 2 3 4 5
Pe
rce
nta
ge o
f an
swe
rs
Level of agreement
Nearest Neighbor
Furthest Neighbor
Random
(b) Obviousness.
0,00
0,05
0,10
0,15
0,20
0,25
0,30
0,35
0,40
0,45
1 2 3 4 5
Pe
rce
nta
ge o
f an
swe
rs
Level of agreement
Nearest Neighbor
Furthest Neighbor
Random
(c) Serendipity.
0,00
0,05
0,10
0,15
0,20
0,25
0,30
0,35
1 2 3 4 5
Pe
rce
nta
ge o
f an
swe
rs
Level of agreement
Nearest Neighbor Furthest Neighbor Random
(d) Usefulness.
0,00
0,05
0,10
0,15
0,20
0,25
0,30
0,35
0,40
0,45
1 2 3 4 5
Pe
rce
nta
ge o
f an
swe
rs
Level of agreement
Nearest Neighbor
Furthest Neighbor
Random
(e) Recognizability.
0,00
0,20
0,40
0,60
0,80
1,00
1,20
1,40
kNN kFN Random
Yes
vs. N
o R
atio
Yes vs. No ratio (higher isbetter)
(f) Would you use the system again?
Figure 5. The distributions of agreement levels of the non-movie related answers (i.e. those shown in the right columnof Fig. 2) for each algorithm evaluated in the user study. In Fig. 5(a) to Fig. 5(e) the values {1, 2, 3, 4, 5} correspond to{most disagree, . . . , most agree} respectively. In Fig. 5(f) the bars correspond to the ratio of yes vs. no answers.
Alg. rating novel obvious recogn. serend. useful
kNN 3.64 3.83 2.27 2.69 2.71 2.69
kFN 3.65 3.95 1.79 2.07 2.65 2.63
Rand. 3.07 4.17 1.64 1.81 2.48 2.24
Table 2. The average rating given by users for moviesthey had seen which were recommended by the differentalgorithms as well as the average of the agreement levelsfor novelty, obviousness, recognizability, serendipity andusefulness respectively.
inherent difficulty of rating. something which is notknown (which both novelty and serendipity at least inpart cover). Analogously, the assumed null hypothesisof there not being a difference between kNN and kFNfails to be rejected within significant levels of p.
Regarding the level of agreement on the usefulness(Fig. 5(d)) across all the algorithms, Table 2 shows bothneighborhood models performing very similarly, t-testcomparisons of the distributions show a p value close toone for comparison between neighborhood models andp = 0.16 for the comparisons between random and eachof the neighborhood models.
However, recognizability is interpreted differently de-pending on the algorithm (two-tail t-tests give p < 0.05between nearest and furthest, p < 0.01 between nearestand random, and a non-significant p = 0.19 between fur-thest and random). It seems the furthest neighbor rec-ommender recommends less known items than the near-est neighbor does, which confirms the results shown inFig. 4(b). We believe this provides, at least in part, anexplanation to the lower precision values in offline eval-
uation, as less known items are less likely to have beenseen by users, and are thus less likely to appear in thevalidation set.
Finally, on the question of whether the participantswould use a recommender system like the one evalu-ated, there is a slight bias towards the nearest neigh-bor recommender, i.e. Fig. 5(f). However, this goesin line with users’ natural bias towards known items aswell trust-related aspects, e.g. before recommending un-known items a system should establish trust with theuser [1, 11]. Establishing trust requires repetitive use ofa system, which was not possible in the scope of theconducted study.
We believe that given the reported results, precision ac-curacy levels alone cannot be used to accurately evalu-ate an approach which is intended to recommend diverseitems, e.g. items from the long tail. The results of theuser study seem to confirm that even though the near-est neighbor approach outperforms the furthest neighborapproach in terms of traditional accuracy metrics, thegeneral perceived usefulness of the recommenders by theusers does not seem to differ substantially. Even thoughsome of the reported t-test p-values show significancewithin a large error margin (p > 0.1), there is a definitetrend pointing to similar perceived usefulness of bothneighborhood approaches when considering all reportedresults in context.
Due to the fact that the nearest and furthest neighborrecommender are practically orthogonal in terms of rec-ommended items, as shown in Table 1, this type of evalu-ation can have a higher positive effect than it would havehad for two algorithms which recommend a similar set

of items. In contrast, if comparing two recommendationalgorithms that create less disjoint recommendation sets,i.e. by replacing the furthest neighbor approach with analgorithm recommending more “standard” items, it isreasonable to assume that the perceived usefulness wouldhave a bias towards the algorithm that performs better(in terms of precision, recall, and similar metrics).
CONCLUSIONIn this work we have presented an extensive analysis ofthe recommendation quality of both a nearest neighborand a furthest neighbor algorithm. We evaluated thequality of these algorithms through traditional informa-tion retrieval metrics as well as through a user study inorder to gain insight on the perceived usefulness of thealgorithms. In terms of precision and recall, the nearestneighbor algorithm outperforms the furthest neighborapproach. The lists of recommended items are howeveralmost completely disjoint due to the nature of the fur-thest neighbor approach, which recommends more non-obvious and diverse items. By analyzing the feedbackobtained from a user study with more than 130 partic-ipants we have shown that a higher predictive accuracyof a recommender system, in this scenario, does not in-crease the perceived usefulness of the recommender sys-tem, from the users’ perspective.
From the answers obtained in the study, we were ableto recognize several aspects that point to the notionthat at least similar satisfaction can be obtained withlower precision, e.g. proportionally the same amount ofusers claimed they would watch a movie recommendedby the lower scoring furthest neighbor approach than amovie recommended by the nearest neighbor approach -Fig. 4(c). Similarly, the furthest neighbor recommenderand nearest neighbor recommender received almost iden-tical overall rating values, despite the differences in pre-cision and recall, shown in Table 2.
ONGOING & FUTURE WORKWe believe that this model of evaluation of diverse andother non-obvious items needs to be analyzed in orderto gain further insight on when traditional informationretrieval accuracy metrics cannot express the quality ofa recommender system accurately. For this purpose, weplan on extending the survey to include several moretypes of recommender algorithms and more questions.Specifically, we intend to study the perceived usefulnessof similar algorithms (in terms of how recommendationsare found), but which still perform differently in stan-dard metrics. An extended study will be conductedwithin a multi-algorithm recommender system we havedeveloped for user-centric evaluation. In this system wehope to mitigate any effects of the level of trust, or lackof trust, the users have towards the system by continuousinteractions with the recommender system.
Furthermore, we believe that a similar approach couldbe applied to most recommendation algorithms in order
to generate more diverse and non-obvious recommenda-tions, i.e. by inverting the ratings of a user accordingto Eq. (2) and recommending the items found to be leastlikely to be liked by the user. This is however outside ofthe scope of this paper and left as a possible avenue forfuture work.
Additionally, we are investigating the possibilities of cre-ating an ensemble recommender using both types ofneighborhoods.
ACKNOWLEDGMENTSThe authors would like express their gratitude to allparticipants of the study and everyone who helped bydistributing it in their communities, and to Bart Kni-jnenburg from UC Irvine and Michael Meder from TUBerlin for their help with conceptualization, implemen-tation and evaluation of the user study.
REFERENCES1. FilmTrust: movie recommendations using trust in
web-based social networks, vol. 1 (2006).
2. Abdi, H. Bonferroni and Sidak corrections formultiple comparisons. Sage, 2007.
3. Averous, Y. Untranslateable words - serendipity.Journal of the Northern Californa TranslatorsAssociation: Online Edition (2005).
4. Bellogin, A., and Parapar, J. Using graphpartitioning techniques for neighbour selection inuser-based collaborative filtering. In Proceedings ofthe sixth ACM conference on Recommendersystems, RecSys ’12, ACM (New York, NY, USA,2012), 213–216.
5. Bollen, D., Knijnenburg, B. P., Willemsen, M. C.,and Graus, M. Understanding choice overload inrecommender systems. In Proceedings of the fourthACM conference on Recommender systems, RecSys’10, ACM (New York, NY, USA, 2010), 63–70.
6. Bourke, S., McCarthy, K., and Smyth, B. Power tothe people: exploring neighbourhood formations insocial recommender system. In Proceedings of thefifth ACM conference on Recommender systems,RecSys ’11, ACM (New York, NY, USA, 2011),337–340.
7. Breese, J. S., Heckerman, D., and Kadie, C.Empirical analysis of predictive algorithms forcollaborative filtering, vol. 461. San Francisco, CA,1998.
8. Candillier, L., Jack, K., Fessant, F., and Meyer, F.State-of-the-art recommender systems.Collaborative and Social Information Retrieval andAccessTechniques for Improved User Modeling(2009), 1–22.
9. Cover, T., and Hart, P. Nearest neighbor patternclassification. Information Theory, IEEETransactions on 13, 1 (january 1967), 21 –27.

10. Herlocker, J., Konstan, J. A., and Riedl, J. Anempirical analysis of design choices inneighborhood-based collaborative filteringalgorithms. Inf. Retr. 5, 4 (Oct. 2002), 287–310.
11. Herlocker, J. L., Konstan, J. A., Terveen, L. G.,and Riedl, J. T. Evaluating collaborative filteringrecommender systems. Trans. Inf. Syst. 22, 1(2004).
12. Karypis, G. Evaluation of item-based top-nrecommendation algorithms. In Proceedings of thetenth international conference on Information andknowledge management, CIKM ’01, ACM (NewYork, NY, USA, 2001), 247–254.
13. Knijnenburg, B., Willemsen, M., Gantner, Z.,Soncu, H., and Newell, C. Explaining the userexperience of recommender systems. User Modelingand User-Adapted Interaction 22 (2012).
14. Knijnenburg, B. P., Willemsen, M. C., and Kobsa,A. A pragmatic procedure to support theuser-centric evaluation of recommender systems. InProceedings of the fifth ACM conference onRecommender systems, RecSys ’11, ACM (NewYork, NY, USA, 2011), 321–324.
15. Lam, S., Frankowski, D., and Riedl, J. Do you trustyour recommendations? an exploration of securityand privacy issues in recommender systems. InEmerging Trends in Information andCommunication Security, G. Muller, Ed., vol. 3995of Lecture Notes in Computer Science. SpringerBerlin / Heidelberg, 2006, 14–29.
16. Lathia, N., Hailes, S., Capra, L., and Amatriain, X.Temporal diversity in recommender systems. InProceedings of the 33rd international ACM SIGIRconference on Research and development ininformation retrieval, SIGIR ’10, ACM (New York,NY, USA, 2010), 210–217.
17. Marlin, B. M., and Zemel, R. S. Collaborativeprediction and ranking with non-random missingdata. In Proceedings of the third ACM conferenceon Recommender systems, RecSys ’09, ACM (NewYork, NY, USA, 2009), 5–12.
18. McNee, S. M., Riedl, J., and Konstan, J. A. Beingaccurate is not enough: how accuracy metrics havehurt recommender systems. In CHI ’06 extendedabstracts on Human factors in computing systems,CHI EA ’06, ACM (New York, NY, USA, 2006),1097–1101.
19. Murakami, T., Mori, K., and Orihara, R. Metricsfor evaluating the serendipity of recommendationlists. In Proceedings of the 2007 conference on Newfrontiers in artificial intelligence, JSAI’07,Springer-Verlag (Berlin, Heidelberg, 2008), 40–46.
20. Pu, P., Chen, L., and Hu, R. A user-centricevaluation framework for recommender systems. In
Proceedings of the fifth ACM conference onRecommender systems, RecSys ’11, ACM (NewYork, NY, USA, 2011), 157–164.
21. Rafter, R., O’Mahony, M. P., Hurley, N. J., andSmyth, B. What have the neighbours ever done forus? a collaborative filtering perspective. InProceedings of the 17th International Conference onUser Modeling, Adaptation, and Personalization:formerly UM and AH, UMAP ’09, Springer-Verlag(Berlin, Heidelberg, 2009), 355–360.
22. Said, A., Jain, B. J., and Albayrak, S. Analyzingweighting schemes in collaborative filtering: Coldstart, post cold start and power users. In 27thACM Symposium On Applied Computing (SAC’12), ACM (New York, NY, USA, 2012).
23. Said, A., Kille, B., Jain, B. J., and Albayrak, S.Increasing diversity through furthestneighbor-based recommendation. In Proceedings ofthe WSDM’12 Workshop on Diversity in DocumentRetrieval (DDR’12) (2012).
24. Sarwar, B. M., Karypis, G., Konstan, J. A., andRiedl, J. T. Application of dimensionality reductionin recommender system – a case study. InWebKDD Workshop at the ACM SIGKKD (2000).
25. Schafer, J. B., Frankowski, D., Herlocker, J., andSen, S. The adaptive web. Springer-Verlag, Berlin,Heidelberg, 2007, ch. Collaborative filteringrecommender systems, 291–324.
26. Smyth, B., and McClave, P. Similarity vs. diversity.In Case-Based Reasoning Research andDevelopment, D. Aha and I. Watson, Eds.,vol. 2080 of Lecture Notes in Computer Science.Springer Berlin / Heidelberg, 2001, 347–361.
27. Swearingen, K., and Sinha, R. Beyond Algorithms:An HCI Perspective on Recommender Systems.
28. Zhang, Y. C., Seaghdha, D. O., Quercia, D., andJambor, T. Auralist: introducing serendipity intomusic recommendation. In Proceedings of the fifthACM international conference on Web search anddata mining, WSDM ’12, ACM (New York, NY,USA, 2012), 13–22.
29. Zhou, T., Kuscsik, Z., Wakeling, J.-G. L. M. M.J. R., and Zhang, Y.-C. Solving the apparentdiversity-accuracy dilemma of recommendersystems. Proceedings of the National Acadamy ofSciences of the United States of America (PNAS)107, 10 (2010), 4511–4515.
30. Ziegler, C.-N., McNee, S. M., Konstan, J. A., andLausen, G. Improving recommendation liststhrough topic diversification. In Proceedings of the14th international conference on World Wide Web,WWW ’05, ACM (New York, NY, USA, 2005),22–32.