user insights in enabling interoperable mobile money
TRANSCRIPT
User Insights in Enabling INTEROPERABLE MOBILE MONEY MERCHANT PAYMENTS in Tanzania

User Insights in Enabling INTEROPERABLE MOBILE MONEY MERCHANT PAYMENTS in Tanzania
Executive Summary 2
Research Overview 3
Business Model Insights 4
A. Merchant Sizing and Segments 4
B. Pricing 9
C. Customer Experience 15
D. Technology and Acquisition Models 17
Strategic Considerations for Merchant Payment Interoperability 22
Looking Ahead 31
2 Tanzania
The ability for customers to pay electronically for goods and services at physical retailers is a cornerstone of the modern
economy, and hundreds of millions of dollars of such “merchant payments” are conducted daily. As many markets,
including Tanzania, now have a sizeable number of consumers with mobile money stored-value accounts, there has
been considerable interest from industry players such as banks, mobile operators, payment service providers and market
facilitators, in exploring how best to enable merchant payments through mobile money. At the same time, there is a growing
perception that interoperability in merchant payments – the idea that a customer of one mobile operator could pay a merchant
belonging to another – can bolster faster customer adoption and transaction growth as compared to proprietary merchant
networks.
To this end, IFC commissioned a consulting firm, Digital Disruptions, to conduct quantitative and qualitative user research in
Tanzania on merchant payments. The research findings showed that:
1. There is moderate to high interest among small business retailers to adopt merchant payments through mobile money.
2. The total addressable merchant payments market is estimated at between 350,000 and 500,000 small businesses.
3. Adoption of merchant payments by small businesses is influenced by the availability of value-added services, both financial
and non-financial, and dependent on the amount of financial education and awareness of the merchant.
4. There is clear willingness to pay to accept mobile money merchant payments among small businesses, as they stand most
to benefit from them.
5. Those small businesses which responded well to merchant payments responded even better to the concept of
interoperability, as accepting mobile money from customers beyond their own network could help increase sales.
6. On the other hand, customers need a compelling reason to switch away from cash payments, and clever marketing
incentives and loyalty programs may help persuade them to do so. Therefore, a customer experience that is simple and
consistent with the current mobile money experience would be essential to drive uptake amongst customers.
The research implies that demand for mobile money merchant payments, and even more importantly, interoperable merchant
payments will come strongly from the merchant side. The larger question for providers of these services then is whether it is
prudent to enable interoperability from the beginning or to take a wait-and-see approach and develop proprietary solutions
instead. This report outlines some strategic options for consideration.
ExECuTIvE SuMMARY
User Insights in Enabling Interoperable Mobile Money Merchant Payments 3
Mobile Money Interoperability, broadly defined as interconnection between two or more mobile money systems,
has been garnering increased attention over the last four years, as more markets – 60 countries, according to the
most recent figures published by the GSMA1 – now have two or more mobile money operations. The experience in
the banking (e.g., ATMs) and telecommunications (e.g., roaming) sectors, indicate that interoperability leads to increased
transaction volumes, and has positive impact on revenues and costs for operators, customers, and the broader financial system2.
In the mobile money sector, however, interoperability is still a nascent concept and globally only a few initiatives have launched,
mainly person-to-person transfers (P2P, also sometimes referred to as A2A for ‘account to account’)3. The focus of this report
is on Tanzania, where IFC facilitated a two-year, industry-led initiative based on business rules for six use cases, starting with
person-to-person transfers (P2P)4. Since October 2014, all four mobile operators have gradually launched interoperable P2P
services meaning that mobile money users can now send money across networks, and at no additional cost5.
In addition to interoperable P2P services, mobile money operators in Tanzania have also launched their own proprietary
merchant payments services, defined here as paying for goods and services using mobile money at a physical retailer. Enabling
customers to make retail purchases – and merchants to accept them – via mobile money had been expected to increase overall
transaction volumes, although meaningful growth has not been observed.
To determine strategic options for customer and small business adoption of merchant payments, IFC commissioned Digital
Disruptions to conduct user research in August and September 2015. The quantitative survey involved interviews with 700
small businesses in six cities in Tanzania, and covering urban and peri-urban zones. The qualitative research targeted both
customer and small businesses, and included 18 focus groups as well as eight product design ‘sprints’ using Design Thinking
methodology. Interviews were also conducted with each mobile operator at the beginning and towards the end of the project.
This report discusses the high-level insights from the user research that have direct implications for the mobile money
merchant payments business model including:
A. Sizing and Segmentation tackling questions such as which small businesses are more likely to adopt merchant
payments, and to estimate the size of the addressable market.
B. Pricing considerations, particularly around customers’ and small businesses’ willingness to pay and potential pricing
models.
C. Customer Experience when making retail purchases to determine the pain points that merchant payments and
particularly interoperable merchant payments could help address.
D. Technology and Acquisition Models covering potential options for merchant acquiring and technology.
Moreover, there is a separate sub-section on strategic considerations to enable interoperability, based on successful
international experiences in the banking, telecommunications, and airline sectors.
It is worth highlighting that the focus of this report is on providing insights and implications – rather than on prescribing
solutions – for interoperable mobile money merchant payments. In other words, the insights should help inform the rules,
standards, and principles that would govern interoperability between two or more providers for this particular use-case.
We discuss in-depth the findings of our research in four key areas:
1 GSMA (2016), “2015 State of the Industry: Mobile Financial Services for the Unbanked”2 The Central Bank of Sweden finds positive ‘network externalities’ due to interoperable payments http://www.riksbank.se/Upload/
Dokument_riksbank/Kat_foa/wp_126.pdf3 Examples include Indonesia, Sri Lanka, Rwanda, Pakistan, Madagascar, Peru and Tanzania.4 For more information, see “Achieving Interoperability in Mobile Financial Services” at http://www.ifc.org/wps/wcm/
connect/8d518d004799ebf1bb8fff299ede9589/IFC+Tanzania+Case+study+10_03_2015.pdf?MOD=AJPERES5 See press release at: http://www.businesswire.com/news/home/20160218005860/en/Millicom-International-Cellular-Airtel-Tigo-
Vodacom-agree
RESEARCH OvERvIEw
4 Tanzania
A. Merchant Sizing and Segments
B. Pricing
C. User Experience
D. Technology and Acquisition Models
In Merchant Sizing and Segments, we provide estimates of the total addressable market in terms of small business retailers,
as well as additional information, gleaned from secondary research, on existing cash-points such as agents, ATMs and
branches. We then break down merchant segments based on the findings from the quantitative survey.
A key question for any ‘two-sided’ market such as merchant payments is whether to charge the customer, the merchant,
both – or neither. This question is made even more complex as traditional bank card payments employ a “merchant pays”
model, whereas Person-to-Person (P2P) transfers via mobile money employ a “sender pays” model. Therefore, under the Pricing
discussion, we aim to provide insights on who to charge, and which pricing models consumers and merchants appear to prefer
based on the research, as well as international experience. We also discuss possible pricing ranges based on survey data and a
well-known methodology for gauging price for new products and services.
Good product design and customer experience are central for user uptake, and in User Experience we explore different elements
of the customer experience in making retail payments, as well as preferences indicated by customers and small businesses in
the focus groups. Insights on Technology and Acquisition Models are covered chiefly from the perspective of the user research
rather than an evaluation of hardware and software solutions. Finally, two examples of interoperable merchant payments,
from Sri Lanka and Ghana, are briefly touched upon to illustrate possible interoperable models that include banks, mobile
operators, payment service providers and other parties.
A. MERChAnT SIzInG AnD SEGMEnTS This section discusses the estimated size of the market and general profile of segments, before analyzing three specific
segments of interest: mobile money agents, existing mobile money merchants, and prospective merchants.
Sizing
There are no official statistics on the number of small business retailers in Tanzania. however, secondary research data pulled
from various sources and supported by interviews with MnOs and practitioners, indicates that the Total Addressable Market
(TAM) is quite large and unpenetrated: one interviewee made a rough approximation of between 350,000 and 500,000 small
retailers in the country.
According to interviews with mobile operators, as of november 2015 there were roughly 60,000 mobile money merchants
(about 25,000 which are considered active), most acquired by Tigo and Vodacom. There were also approximately 87,000
mobile money agents, roughly half of which are independent, stand-alone kiosks (“dedicated agents”) and the other half are
small businesses selling other goods and services. There appears to be little overlap between mobile money agents and mobile
money merchants.
BuSINESS MOdEL INSIgHTS
User Insights in Enabling Interoperable Mobile Money Merchant Payments 5
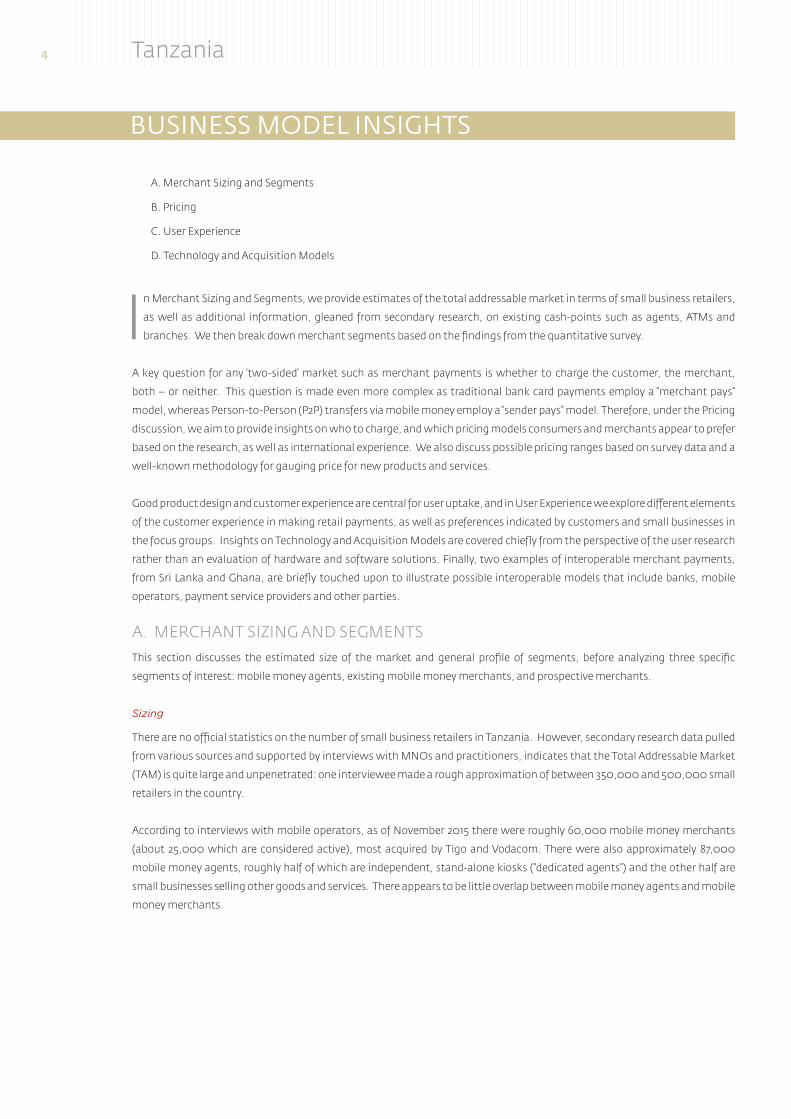
Finally, card-accepting merchants numbered just over 2,500; the bulk of which are establishments catering to tourists and
business people in Dar es Salaam (compared to just under 20,000 in Kenya, which has around the same population but many
more cards issued). Agency banking, mainly led by nMB, the country’s largest private bank, is also an option but this model is
still quite nascent: only 235 retailers provide banking services. Figure 1 below provides a breakdown of these segments and how
they fit within the estimated TAM.
The quantitative survey of small businesses and retailers conducted by IFC is not nationally representative but does align with
the estimates provided above. Out of 700 respondents, there were 101 agents (two of which were banking agents, 99 were
mobile money agents), and 56 mobile money merchants. Using the corresponding ratio that there is one agent for every
seven small business retailers, and with about 44,000 dedicated mobile money agents currently in Tanzania, would equate to
roughly 300,000 small business retailers in urban and peri-urban areas. This figure comes close to the estimate of 350,000 to
500,000 retailers obtained through interviews with providers.
General Profile of Small Business Survey Sample
In the sample surveyed, 41 percent and 20 percent of small business retailer respondents were from the two largest cities, Dar
es Salaam and Mbeya, respectively. Roughly 10 percent each were interviewed in the towns of Dodoma, Arusha, Morogoro,
and the island of zanzibar. Forty-one percent of respondents indicated that they were “managers”, and 59 percent said they
were “owners”; of these, over half were “founders”. Only one out of four businesses had been operating for more than five years,
which suggests that most are relatively new, start-up enterprises.
About equal numbers – 18 percent each – had either no full-time or part-time employees, and 14 percent had 2 or 3 employees.
Just 6 percent of respondents had four or more employees, suggesting that the vast majority of retailers in the country are
indeed “small” (and micro) businesses. That they are usually the sole employee is why eight out of ten respondents indicated
they are always on-site, which is relevant because, as described later, they may not need a dedicated merchant payment
terminal if their own handset will suffice.
Figure 1: Total Estimated Addressable Market for Merchant Payments (Nov 2015)
ONLINE MERCHANTS(business + non-retail)
RETAIL STORES(physical retail + business)
CASH POINTS(retail + non-business)
Bank-aquiredmerchants (2552)
~50% dedicated mobilemoney agents (non-business)
Bank agents(235)
Mobile MoneyMerchants(~60,000)
Virtual merchantsacquired by MNOs
(bill-pay, utility,top-up, etc.)
TOTAL ADDRESSABLE MARKET:350K - 500K
Bank ATMs(1542)
SACCOS MFI
Bank Branches
(~ 635)
Online merchantsacquired by local banks
Mobile Money Agents (~87,639 unique)
Inactive
6 Tanzania
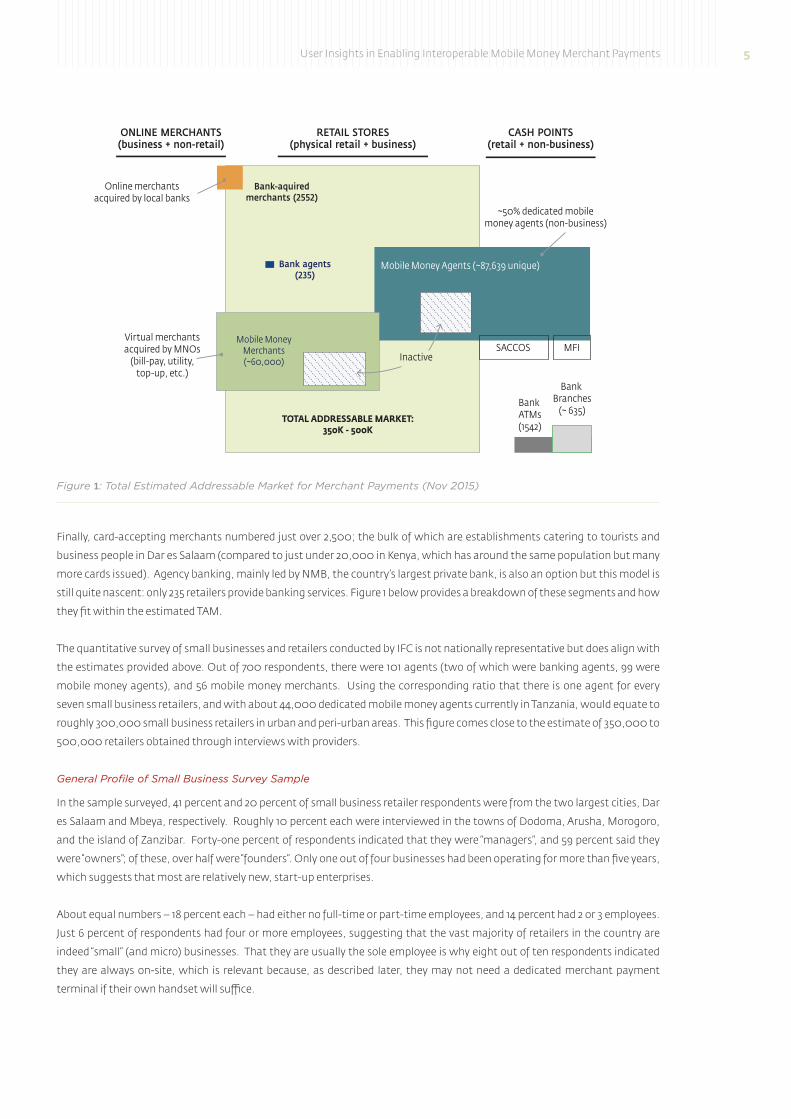
Businesses mainly sold goods (45%) rather than services (21%), though 33 percent said they sold both. Margins are typically
higher in service businesses than retail goods (and thus willingness to pay is also more likely) and respondents indicated an
average revenue margin of 32 percent, though this figure should be treated with caution as most respondents do not typically
keep accurate data. Merchant types were well distributed among 16 main categories, with retail stores, restaurants, and
hardware stores representing 6 percent each of the total sample. A large plurality – 46 percent - indicated “Other”, and an
assessment revealed that these were distributed among various merchant types, ranging from nightclubs, photo shops, and
hotels. Overall, the “Other” category was fragmented and no single merchant type stood out, indicating a high degree of
fragmentation in the sample.
The survey indicated that half of all respondents are between 25 and 34 years old, which is in line with Tanzania’s general
population pyramid, and that 64 percent of businesses are owned by men. Forty-four percent of respondents claim to have
completed secondary education They also appear to be ambitious, with 95 percent indicating they are looking to grow their
business, rather than being content with the way it is currently.
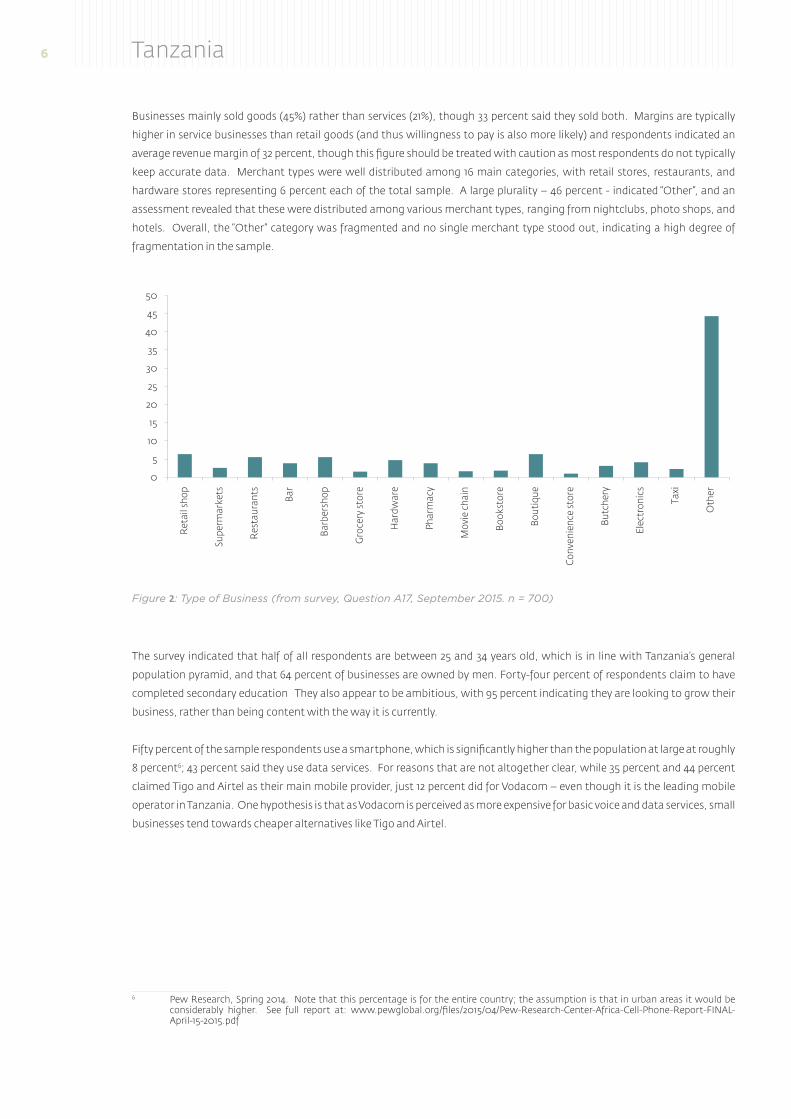
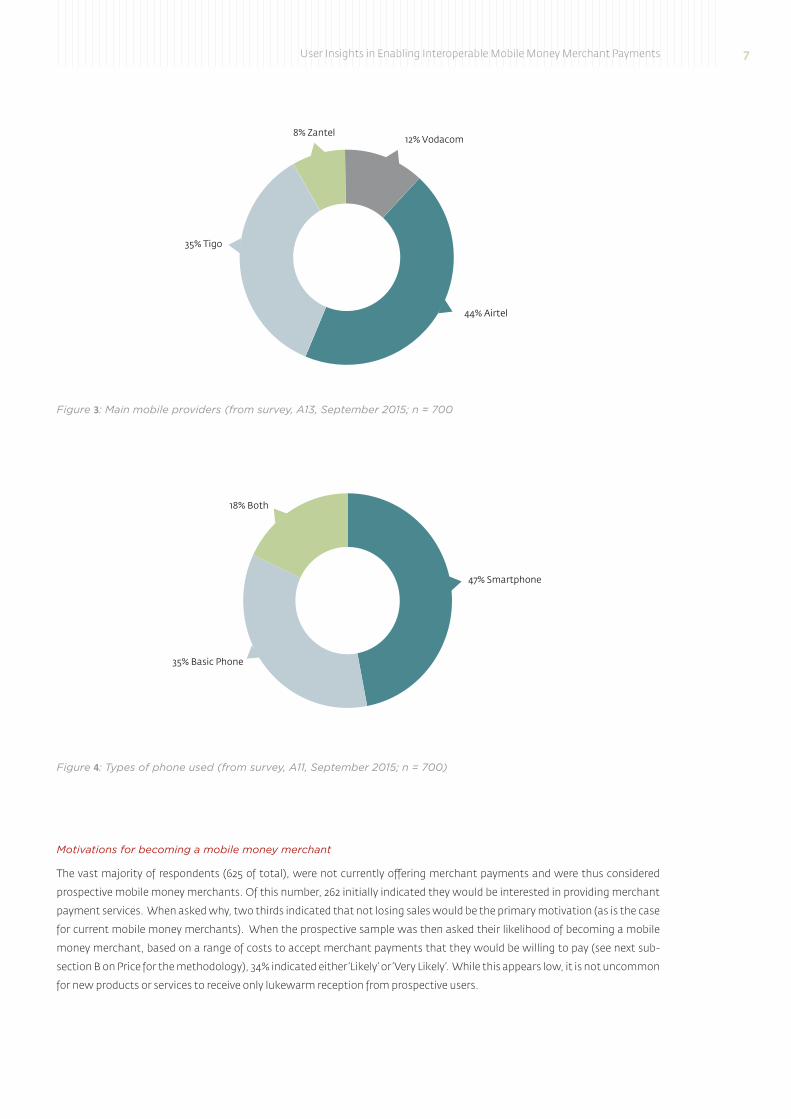
Fifty percent of the sample respondents use a smartphone, which is significantly higher than the population at large at roughly
8 percent6; 43 percent said they use data services. For reasons that are not altogether clear, while 35 percent and 44 percent
claimed Tigo and Airtel as their main mobile provider, just 12 percent did for Vodacom – even though it is the leading mobile
operator in Tanzania. One hypothesis is that as Vodacom is perceived as more expensive for basic voice and data services, small
businesses tend towards cheaper alternatives like Tigo and Airtel.
6 Pew Research, Spring 2014. note that this percentage is for the entire country; the assumption is that in urban areas it would be considerably higher. See full report at: www.pewglobal.org/files/2015/04/Pew-Research-Center-Africa-Cell-Phone-Report-FInAL-April-15-2015.pdf
Figure 2: Type of Business (from survey, Question A17, September 2015. n = 700)
0
5
10
15
20
25
30
35
40
45
50
Ret
ail s
hop
Supe
rmar
kets
Res
taur
ants
Bar
Barb
ersh
op
Gro
cery
sto
re
Har
dwar
e
Phar
mac
y
Mov
ie c
hain
Book
stor
e
Bout
ique
Butc
hery
Elec
tron
ics
Taxi
Oth
er
Conv
enie
nce
stor
e
User Insights in Enabling Interoperable Mobile Money Merchant Payments 7
Motivations for becoming a mobile money merchant
The vast majority of respondents (625 of total), were not currently offering merchant payments and were thus considered
prospective mobile money merchants. Of this number, 262 initially indicated they would be interested in providing merchant
payment services. When asked why, two thirds indicated that not losing sales would be the primary motivation (as is the case
for current mobile money merchants). When the prospective sample was then asked their likelihood of becoming a mobile
money merchant, based on a range of costs to accept merchant payments that they would be willing to pay (see next sub-
section B on Price for the methodology), 34% indicated either ‘Likely’ or ‘Very Likely’. While this appears low, it is not uncommon
for new products or services to receive only lukewarm reception from prospective users.
Figure 3: Main mobile providers (from survey, A13, September 2015; n = 700
12% Vodacom
44% Airtel
35% Tigo
8% Zantel
Figure 4: Types of phone used (from survey, A11, September 2015; n = 700)
47% Smartphone
18% Both
35% Basic Phone
8 Tanzania
Similarly, in focus groups, small business participants were generally positive about the merchant payment proposition,
especially once they had the opportunity to evaluate and interact with simple prototypes that were quickly created based
on initial focus group sessions (e.g., a smartphone terminal that also provided basic business features such as inventory
management). The inference is that a clear selling proposition (and compelling description of benefits) will be imperative to
provide for small businesses to accept merchant payments. Most participants cited the ease of use and security as positive
features of the product concept. In addition to strong product design, a commonly cited reason for small businesses to accept
electronic payments is to close a sale that otherwise would have been lost if they only accepted cash. [In fact, ‘not losing a sale’
is one of the main sales pitches for traditional card acquirers, along with ‘increased overall ticket-size’ (i.e., customers buying
more goods) and ‘increased footfall’ (i.e., more customers shopping in-store).]
Are mobile money agents receptive to being merchants?
The research data revealed a mixed picture of interest amongst mobile money agents. In the focus groups, mobile money
agents viewed the concept of mobile money merchant payments as a threat: they feared that customers would no longer
need to transact mobile money cash-in and cash-out transactions at their agent site – and thus would incur losses and possibly
close the mobile money agent business. Some recommended that customers be charged in order to recover the likely losses.
This reluctance among agents is similar to that in Kenya, where few mobile money agents are also merchants.
Yet in the survey data, 32 percent of agents sampled indicated a ’Likely’ or ’Very Likely’ score for merchant payments, which,
while arguably low, aligned with that of the general sample of prospective mobile money merchants (i.e., all those businesses
that were not currently accepting mobile money), of 34 percent, as described earlier. The higher preference may be because
only 14 percent of mobile money agents rated that the agent commissions they were earning were having a “major impact”
on their business (63% said moderate, 22% said minor). Another possibility is that survey respondents did not completely
comprehend the merchant payment concept (and thus how it would impact their business), while in focus groups there is
more time to explain merchant payment and show prototypes.
Current experience of mobile money merchant payments among existing merchants
Compared with the sample at large, mobile money merchants (n = 56) were significantly younger, with over 60 percent
between the ages of 25-34. They were more likely to be on-site (93% vs 80% in the general sample). Perhaps because they
are younger, they are also much more likely to own a smartphone (71%) and use data (57%). There are slightly more in Dar es
Salaam (54% vs 41% general sample) and Morogoro (18% vs 9%), and much less in Mbeya (4% vs 20%), though these proportions
may have to do with geographic targeting for merchant acquiring than anything else.
As expected, current merchants first heard about the product from the mobile operator staff (49%), but interestingly, 34
percent also indicated they first heard from other merchants, and 27 percent from friends (participants could choose more
than one option). These figures demonstrate the influence of word-of-mouth on merchant adoption.
By far the main reason cited for initial adoption of merchant payments was to ensure they don’t miss out on sales from
customers without adequate cash (70%). The second cited reason was the promise that customers spend more on average in
their store (26%). According to this data, as well as data from prospective merchants, retaining and growing customer sales are
the most important considerations for accepting mobile money merchant payments.
When asked about their experience since accepting merchant payments, only 13 percent of respondents said they had not lost
a customer sale, while 21 percent believed that there was an increase in customers and sales; taken together, this suggests
that mobile money merchants’ current experience with the service falls below initial expectations. Despite this, 34 percent of
respondents still say that offering merchant payments is “very important” and 43 percent “somewhat important”; only 3 percent
indicate not important at all.
User Insights in Enabling Interoperable Mobile Money Merchant Payments 9
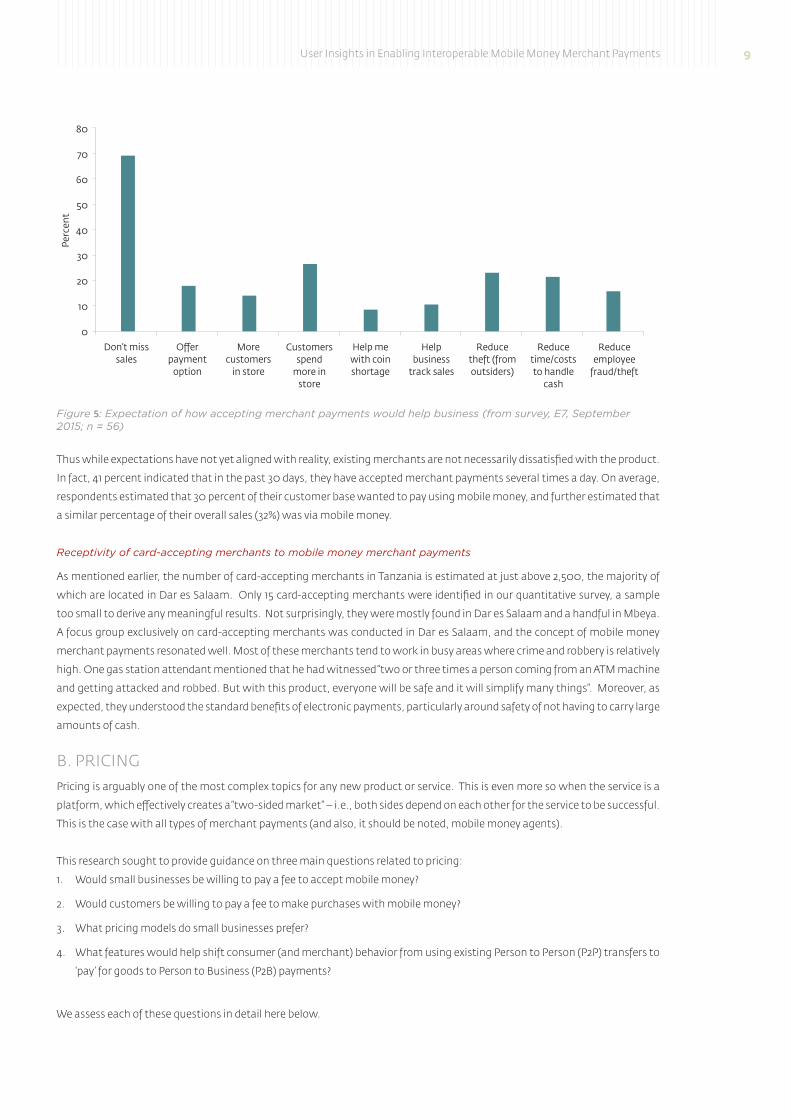
Thus while expectations have not yet aligned with reality, existing merchants are not necessarily dissatisfied with the product.
In fact, 41 percent indicated that in the past 30 days, they have accepted merchant payments several times a day. On average,
respondents estimated that 30 percent of their customer base wanted to pay using mobile money, and further estimated that
a similar percentage of their overall sales (32%) was via mobile money.
Receptivity of card-accepting merchants to mobile money merchant payments
As mentioned earlier, the number of card-accepting merchants in Tanzania is estimated at just above 2,500, the majority of
which are located in Dar es Salaam. Only 15 card-accepting merchants were identified in our quantitative survey, a sample
too small to derive any meaningful results. not surprisingly, they were mostly found in Dar es Salaam and a handful in Mbeya.
A focus group exclusively on card-accepting merchants was conducted in Dar es Salaam, and the concept of mobile money
merchant payments resonated well. Most of these merchants tend to work in busy areas where crime and robbery is relatively
high. One gas station attendant mentioned that he had witnessed “two or three times a person coming from an ATM machine
and getting attacked and robbed. But with this product, everyone will be safe and it will simplify many things”. Moreover, as
expected, they understood the standard benefits of electronic payments, particularly around safety of not having to carry large
amounts of cash.
B. PRICInGPricing is arguably one of the most complex topics for any new product or service. This is even more so when the service is a
platform, which effectively creates a “two-sided market” – i.e., both sides depend on each other for the service to be successful.
This is the case with all types of merchant payments (and also, it should be noted, mobile money agents).
This research sought to provide guidance on three main questions related to pricing:
1. Would small businesses be willing to pay a fee to accept mobile money?
2. Would customers be willing to pay a fee to make purchases with mobile money?
3. What pricing models do small businesses prefer?
4. What features would help shift consumer (and merchant) behavior from using existing Person to Person (P2P) transfers to
‘pay’ for goods to Person to Business (P2B) payments?
We assess each of these questions in detail here below.
Figure 5: Expectation of how accepting merchant payments would help business (from survey, E7, September 2015; n = 56)
80
70
60
50
40
30
20
10
0
Perc
ent
Don’t misssales
O�erpayment
option
Morecustomers
in store
Help mewith coinshortage
Helpbusiness
track sales
Reducetheft (fromoutsiders)
Reducetime/coststo handle
cash
Reduceemployee
fraud/theft
Customersspend
more instore
10 Tanzania
1. Would small businesses be willing to pay a fee to accept mobile money?
Small businesses are indeed willing to pay a fee to accept payments. In focus groups where the mobile money merchant
payment concept was raised, small businesses both understood the product concept, and generally agreed with the benefits
of accepting mobile money as a form of payment. By far the largest cited benefit of accepting mobile money payments was
to reduce cash-handling, mainly due to robbery, employee theft or fraud. The inconvenience of managing cash (counting,
frequent deposits, etc.) was occasionally mentioned, but not as prominently as risk of theft. Due to the perceived benefits of
accepting mobile money, the merchant participants in the focus groups agreed with the need to pay a fee – even if in certain
cases, they felt that as the customer also accrued benefits by paying through mobile money, that they should be charged as
well. (This is discussed further below).
Although it was not a specific filter criterion, all small businesses that were interviewed in the survey were also individual mobile
money customers, therefore the concept of mobile money and making payments (mainly P2P transfers) is well understood.
[This is in contrast to, say, a Point-of-Sale card terminal where small business owners — in other words, prospective merchants
— are not cardholders to begin with, so struggle with the general concept and benefits of payment cards.] Moreover, as
discussed later, a small percentage (17.6% in our survey, about 7% in a separate survey conducted by the market research firm
Intermedia) of small businesses is regularly accepting “de-facto” merchant payments through the P2P functionality.
The willingness to pay by small businesses was conveyed more forcefully in the survey. Upwards of 90 percent of all small
businesses that were not accepting mobile money merchant payments (n = 572) indicated that they would be willing to pay
some amount to accept payments (inferred by the question “at what price is it too expensive?” and a response that is not zero
Tanzanian Shillings). The full pricing graphs are displayed in the second sub-section and discussed in further detail there.
The “Product Sprints” conducted with small businesses owners (and customers) for each mobile network operator (MnO)
using the Design Thinking methodology also helped gauge another factor: the potential effect of prototypes, value-added
services, and/or marketing promotions on the user’s willingness to pay. It was observed that generally speaking, owners
were more enthusiastic about product adoption, and either indicated “no” or slightly higher willingness to pay based on the
prototype in question (for example, a tablet app providing a tool to better manage small business payments and finances). The
important point is that a) prototypes provide a richer, more reliable set of feedback and b) there was no decrease in willingness
to pay based on the prototypes. In other words, small business owners did not report either less enthusiasm to adopt, or less
willingness to pay, once they interacted with prototype solutions.
That prospective merchants indicated – at least in theory – a willingness to pay came as a surprise to the local MnOs. The two
main MnOs which have launched merchant payments in-market, Tigo and Vodacom, do not charge the merchants at all; in
fact, in Tigo’s case, the merchant gains an incentive to accept merchant payments in the form of bonus airtime. In discussions
with the MnOs, both at the beginning and towards the end of the project, the general sense was that small businesses
simply would refuse to pay any fee, particularly because as recipients of the payment (unlike customers) they never had to. In
addition, MnOs understandably believed that small businesses do not earn sufficient margin to “afford” paying a commission.
Yet launches in a handful of other emerging markets have shown that, under the right circumstances, small businesses are
indeed willing to pay to accept mobile money. Interviews conducted in Kenya with Kopo Kopo, a merchant acquirer, and
Safaricom, the country’s largest mobile operator, revealed that thousands of merchants have registered with the understanding
that they would be charged 1 -1.5 percent commission, based on the sale price. In Georgia, the merchant acquirer Open
Revolution signed up hundreds of merchants charging an estimated 1.5 percent of the transaction sale as commission.
User Insights in Enabling Interoperable Mobile Money Merchant Payments 11
2. Would customers be willing to pay with mobile money?
Based on customer focus groups and the Design Thinking product sprints, it was clear that customers may be convinced to
pay a fee, but their current experience of paying in cash is not all that ‘painful’. The majority of respondents believed that it is
the responsibility of the merchant to pay the (entire) fee, even though they agreed that, as customers, they did obtain some
benefits from using mobile money as a payment form.
Broadly speaking, customers did not report their current method of paying small businesses in cash as an inconvenient
process. In certain cases, it was seen as a hassle (if they didn’t have exact change) or undesirable (for fear of theft of large
amounts of cash), but generally it was not viewed as a major pain-point. In fact, in many cases, paying in cash is seen as
simpler and quicker than using mobile money, both to conduct the transaction and for merchants to obtain it, especially for
low-value transactions.
As is discussed further under Customer Experience, it should be noted that, strictly speaking, customers are already making
payments via mobile money for airtime top-ups, bill payments, school fees, and others – it is just that the merchants are
‘virtual’, not physical, as are the services being purchased. In all those cases, the customer does not pay any fees, even though
they derive, and are aware of, the clear benefits of paying through mobile money.
Finally, mobile money providers have tended not to charge a fee to the customer for merchant payments. The first reason
is that customers initiate the buying decision (see point on Customer Experience) and tend to be more price-sensitive than
small businesses, which, by design, earn profit. The second is that in two-sided markets (e.g. newspapers, search engines,
payments), even if value is accrued to both parties, it is a best practice for providers to ‘subsidize’ one side and push more or
all charges on the other. While this does not mean that providers could disproportionately charge the merchant more than
the customer (for example, 1% for the merchant and 0.25% to the customer), it is generally advisable not to create additional
‘obstacles’ (i.e., friction) on the customer side. This is the same reason that in a P2P transaction, it is the sender who pays the
fee: they have “more to give”: even though both sender and receiver stand to benefit from the service (ostensibly the receiver
even more), providers decide to charge the sender exclusively.
3. What pricing models do small businesses prefer?
Given that small businesses indicated a willingness to pay (per point 1 above), the research also explored their preference for
pricing models. The two options initially considered were a) a percentage of sales and b) a tiered fee per sale band.
Although the few examples of mobile money merchant payments in other markets have merchant fees priced as a percentage
of sales – and traditional card payments have, since inception, used a “Merchant Discount Rate” (MDR) – it became clear
through focus groups and surveys that small business owners in Tanzania did not fully understand fees in percentages. In fact,
when asked, most owners were not all that clear about their own sales margins in terms of percentages – even for retail (i.e.,
non-service) businesses which have a clear price point charged to the end user (e.g., a bottle of water for $1) and a unit cost paid
by the business to the supplier (e.g., $0.80).
The advantage of the second pricing option (a tiered fee per sale band) is that it is in line with how small business owners use
P2P transfers as ordinary customers (as mentioned, every owner in the survey had a mobile money customer account). They
therefore feel familiar and comfortable with this pricing approach.
In the quantitative survey, price points were rigorously explored using a technique called the Price Sensitivity Meter (PSM),
which is particularly well-suited for gauging pricing for new products, and thus those which customers may find challenging
to benchmark. After introducing the mobile money merchant payment concept, and taking a hypothetical transaction sale of
10,000 Tsh (approximately $10 USD), four questions were posed:
12 Tanzania
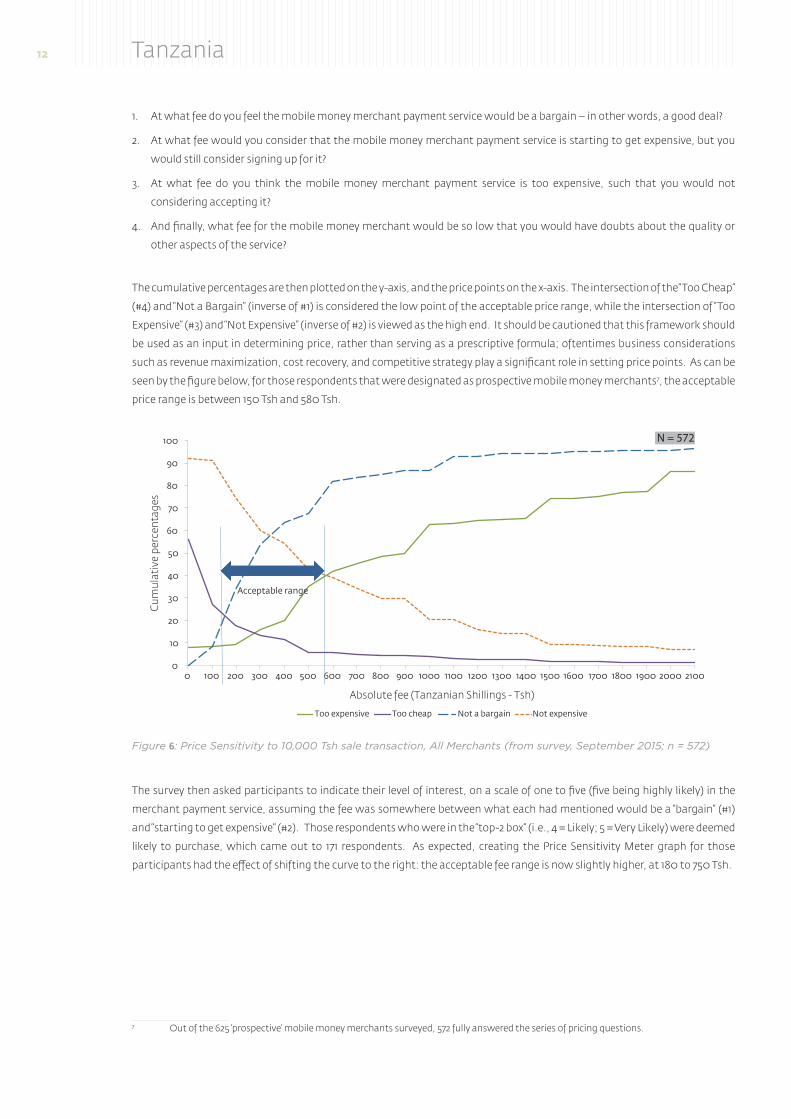
1. At what fee do you feel the mobile money merchant payment service would be a bargain – in other words, a good deal?
2. At what fee would you consider that the mobile money merchant payment service is starting to get expensive, but you
would still consider signing up for it?
3. At what fee do you think the mobile money merchant payment service is too expensive, such that you would not
considering accepting it?
4. And finally, what fee for the mobile money merchant would be so low that you would have doubts about the quality or
other aspects of the service?
The cumulative percentages are then plotted on the y-axis, and the price points on the x-axis. The intersection of the “Too Cheap”
(#4) and “not a Bargain” (inverse of #1) is considered the low point of the acceptable price range, while the intersection of “Too
Expensive” (#3) and “not Expensive” (inverse of #2) is viewed as the high end. It should be cautioned that this framework should
be used as an input in determining price, rather than serving as a prescriptive formula; oftentimes business considerations
such as revenue maximization, cost recovery, and competitive strategy play a significant role in setting price points. As can be
seen by the figure below, for those respondents that were designated as prospective mobile money merchants7, the acceptable
price range is between 150 Tsh and 580 Tsh.
The survey then asked participants to indicate their level of interest, on a scale of one to five (five being highly likely) in the
merchant payment service, assuming the fee was somewhere between what each had mentioned would be a “bargain” (#1)
and “starting to get expensive” (#2). Those respondents who were in the “top-2 box” (i.e., 4 = Likely; 5 = Very Likely) were deemed
likely to purchase, which came out to 171 respondents. As expected, creating the Price Sensitivity Meter graph for those
participants had the effect of shifting the curve to the right: the acceptable fee range is now slightly higher, at 180 to 750 Tsh.
7 Out of the 625 ‘prospective’ mobile money merchants surveyed, 572 fully answered the series of pricing questions.
Figure 6: Price Sensitivity to 10,000 Tsh sale transaction, All Merchants (from survey, September 2015; n = 572)
0
10
20
30
40
50
60
70
80
90
100
0 100 200 300 400 500 600 700 800 900 1000 1100 1200 1300 1400 1500 1600 1700 1800 1900 2000 2100
Cum
ulat
ive
perc
enta
ges
Absolute fee (Tanzanian Shillings - Tsh)
Too expensive Too cheap Not a bargain Not expensive
Acceptable range
N = 572

User Insights in Enabling Interoperable Mobile Money Merchant Payments 13
This aligns with intuition: those who are most interested have a higher willingness to pay, particularly at the high-end. It should
be noted that while this appears high in terms of effective percentage (i.e., 1.8% to 7.5% Merchant Discount Rate), the small
businesses surveyed do not appraise fees in percentage terms. This is not altogether uncommon: most people in developed
countries, for example, do not interpret paying a $1 USD tip on a $4 beer at a bar as a 25 percent effective tip. Similarly, in the
focus groups many participants casually responded that “200 Tsh” was the low-end of what they would pay, and “probably not
more than 500 or 600 Tsh” to accept a 10,000 Tsh sale transaction.
One suggestion from the participants in one of the Design Thinking sessions was for providers to offer an ‘all-you-can-eat’
pricing option – in other words, unlimited transactions for a flat, monthly fee. This seemed easier for users to understand, and,
particularly for those who were optimistic of making many transactions, less costly than paying per transaction. Participants
also expressed a desire to have flexibility in the pricing plan, such as an option to switch to a per transaction fee, based on their
current volume of transactions. In cases where the fee is charged per transaction, they also preferred having the fee not being
immediately ‘discounted’ from their sale price, but in aggregate at a later time (e.g., at end of day or week). While deducting
the fee from the sale amount is common in developed markets, because it is easier for the merchant to receive the net amount,
and is seen as more convenient, this was perceived as undesirable in the focus groups. One micro entrepreneur from a focus
group in Dar es Salaam said it would seem that the fee was “eating into [his] sales”.
Two other considerations arose during the focus group discussions. The first was that from a marketing perspective, it may
also be advisable to offer a promotional discounted rate – or even waive the fee altogether – for a certain period of time to
increase take-up, as long as the provider makes clear when the discount will end, and what the standard rate or pricing plan
is8. The second was that while setting different price points by merchant type (or other criteria) may be an opportunity to
maximize revenue, it may be risky during an introductory period as it would likely confuse the market, unless it is done clearly
(e.g., 100 Tsh discount on each band above 1M Tsh monthly sales).
8 In focus groups with users of one MnO, switching rates without clear and adequate warning was seen as a major source of displeasure; this apparently had occurred with P2P transfers (it had initially been free to launch).
Figure 7: Price sensitivity for 10,000 Tsh sale transaction, Interested Merchants (from survey, September 2015, n = 171)
0
10
20
30
40
50
60
70
80
90
100
0 100 200 300 400 500 600 700 800 900 1000 1100 1200 1300 1400 1500 1600 1700 1800 1900 2000 2100
Cu
mu
lati
ve p
erce
nta
ges
Absolute fee (Tanzanian Shillings - Tsh)
Acceptable range
Too expensive Too cheap Not a bargain Not expensive
N = 171
14 Tanzania
It should be reiterated that the scope of this research is focused more on the pricing model and not price points. While it is
neither within the remit of IFC to prescribe nor to recommend go-to-market price points, price range, or marketing tactics
to the providers (as these do not influence interoperability standards), the findings from the research, as well as some of the
above options, are presented more broadly as ideas for service providers to consider.
4. What features would help shift consumer (and merchant) behavior from using P2P transfers to ‘pay’ for goods?
Intuitively, the mobile money industry is aware that many P2P transfers are, in fact, designated for payments for goods and
services. Anecdotes abound of customers paying taxi drivers, small store owners, and independent contractors using P2P
transfers. The extent of this behavior is very difficult to quantify without primary, quantitative research on the consumer side.
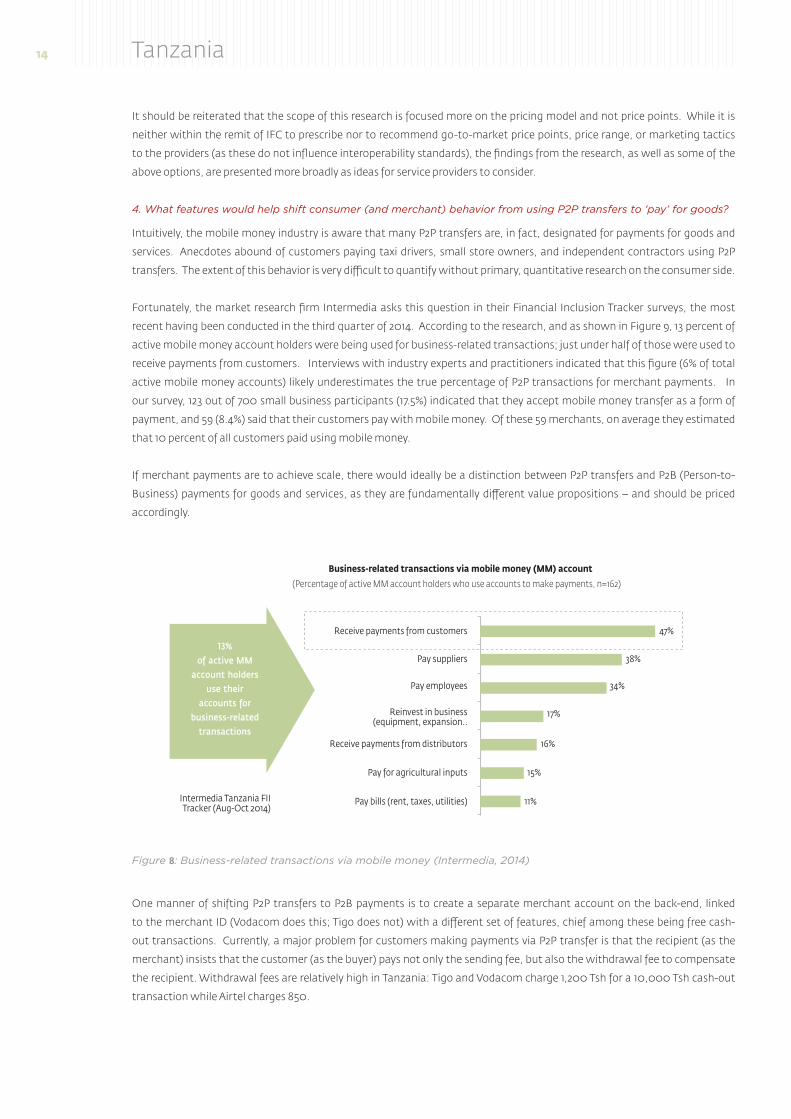
Fortunately, the market research firm Intermedia asks this question in their Financial Inclusion Tracker surveys, the most
recent having been conducted in the third quarter of 2014. According to the research, and as shown in Figure 9, 13 percent of
active mobile money account holders were being used for business-related transactions; just under half of those were used to
receive payments from customers. Interviews with industry experts and practitioners indicated that this figure (6% of total
active mobile money accounts) likely underestimates the true percentage of P2P transactions for merchant payments. In
our survey, 123 out of 700 small business participants (17.5%) indicated that they accept mobile money transfer as a form of
payment, and 59 (8.4%) said that their customers pay with mobile money. Of these 59 merchants, on average they estimated
that 10 percent of all customers paid using mobile money.
If merchant payments are to achieve scale, there would ideally be a distinction between P2P transfers and P2B (Person-to-
Business) payments for goods and services, as they are fundamentally different value propositions – and should be priced
accordingly.
One manner of shifting P2P transfers to P2B payments is to create a separate merchant account on the back-end, linked
to the merchant ID (Vodacom does this; Tigo does not) with a different set of features, chief among these being free cash-
out transactions. Currently, a major problem for customers making payments via P2P transfer is that the recipient (as the
merchant) insists that the customer (as the buyer) pays not only the sending fee, but also the withdrawal fee to compensate
the recipient. Withdrawal fees are relatively high in Tanzania: Tigo and Vodacom charge 1,200 Tsh for a 10,000 Tsh cash-out
transaction while Airtel charges 850.
Figure 8: Business-related transactions via mobile money (Intermedia, 2014)
13%
of active MM
account holders
use their
accounts for
business-related
transactions
Intermedia Tanzania FIITracker (Aug-Oct 2014)
Business-related transactions via mobile money (MM) account
(Percentage of active MM account holders who use accounts to make payments, n=162)
Receive payments from customers
Pay suppliers
Pay employees
Reinvest in business(equipment, expansion..
Receive payments from distributors
Pay for agricultural inputs
Pay bills (rent, taxes, utilities)
47%
38%
34%
17%
16%
15%
11%
User Insights in Enabling Interoperable Mobile Money Merchant Payments 15
In the survey, nearly four out of seven merchants (n = 398) indicated that it would be undesirable to accept mobile money
merchant payments; of those, the most commonly cited reason (n = 62, or 15.6%) was that they would incur charges. In an
ideal merchant payments scenario, the customer would not be charged for the transaction and the merchant would be able to
withdraw cash at no additional cost. Other features, such as increasing the maximum eligible balance, rules for chargebacks,
seamless transfers to personal mobile money or bank accounts, and reward schemes, could also be bundled onto the merchant
account to increase the value proposition for the small business owner.
C. CUSTOMER ExPERIEnCE Payment Decision
A significant question the research sought to answer is which party, the consumer or the merchant, ‘owns’ the decision on
payment method used. In focus groups, almost all customers believed that they were the ones who initially considered which
payment form (usually cash or mobile money) to use. This makes sense intuitively: as the customer is the one initiating the
purchase decision, they will necessarily be the first to contemplate which payment form to use. That being said, in focus
groups, small businesses that indicated a strong preference for the merchant payments concept said they would be willing
to persuade customers to pay using mobile money. In one focus group, a small business owner with a Vodacom M-Pesa
account was so enthralled with the prototype that she insisted that “we [her fellow small business owners] should all be brand
ambassadors”.
Businesses will aim to influence the customer especially if they believe that they stand to benefit more from accepting
electronic payments instead of cash; as noted earlier, from the merchant perspective, accumulating cash is a veritable pain
point and there is a desire to make or increase sales by accessing additional sources of customer funds. Out of the existing
mobile money merchants (most of whom were either moderately or highly satisfied with the service), two out of three said
they have tried to encourage customers to use the service. About 54 percent of all small businesses surveyed said that their
customers did ask them to pay using mobile money merchant payments, indicating moderate demand from the buyer side.
Furthermore, when the 700 survey respondents were asked if accepting mobile money merchant payments would help “ease
a problem” for them, about 40 percent (300) answered in the affirmative. The specific problems they cited were open-ended,
and the most common replies they offered were that merchant payments through mobile money “offered easy and efficient
transactions” (n = 55), “are more secure and safe” (n = 44), and “help to increase the number of customers or retain customers”
(40). This sales pitch – that not only does electronic payment acceptance bring in new customers, but customers end up
spending more than if they had to pay in cash – is common in developed markets for accepting card-based payments.
Conversely, when asked if accepting mobile money would represent a “problem” for them, three out of seven small businesses
surveyed (n = 302), said it would, with about one-fifth (n = 62, or just under 9% of overall respondents) saying that the reason
why is because “it’s costly and one incurs charges”, likely referring to cash-out fees on the merchant side. As discussed in the
previous sub-section on pricing, not only may it be more appropriate to charge merchants rather than the customer, which
has less of an ‘incentive’ to pay via mobile money, there is a relatively small percentage of small businesses that feel that costs
are a barrier to accept electronic payments.
User Experience
From a user experience perspective, it would be advisable to keep the same general flow for the consumer and merchant as
for other mobile money use cases. As mentioned in the pricing sub-section, consumers have already been, in fact, conducting
payments to merchants since the launch of mobile money years ago. The distinction is that the merchants are virtual (i.e., not
face-to-face) instead of physical and provide services like mobile top-ups and mobile bill pay. Customers’ payment experiences
with virtual merchants can thus be used to ‘educate’ them about using mobile money merchant payments at a physical retailer.
From the perspective of the user experience with technology, three elements were considered:
a. Transaction Initiation and Confirmation
b. User Interface and Menu hierarchy
c. Bearer Channel
16 Tanzania
In the current customer experience for mobile money in Tanzania, it is the customer, not the merchant, who initiates the
transaction; both parties receive a confirmation message via SMS. Putting the customer in control of transaction initiation
is generally best practice, as observed across all other emerging markets where mobile money has launched. In most cases,
agents receive confirmation messages by SMS upon completion of the transaction, so strictly speaking they are not ‘active’
participants in the transaction process. This is working well and should be kept as merchant payments are introduced (as is
currently the case in Tanzania). Similarly, the same user interface for virtual payments (e.g. bill payments) could be used for
merchant payments, as well as the same menu hierarchy (e.g., ‘Pay Merchant’ could be added under ‘Pay Bills’). Both of these
aspects are working well and were highlighted by customers.
The least straightforward element of the user experience is the bearer channel. Currently all MnOs use USSD as the means of
transmission for mobile money transactions and other transactions, such as balance inquiry. In focus groups, there were some
complaints from consumers about the number of steps (and duration) to conduct a transaction. The lack of reliability of the
network (in terms of basic voice and data coverage) was also mentioned by several participants.
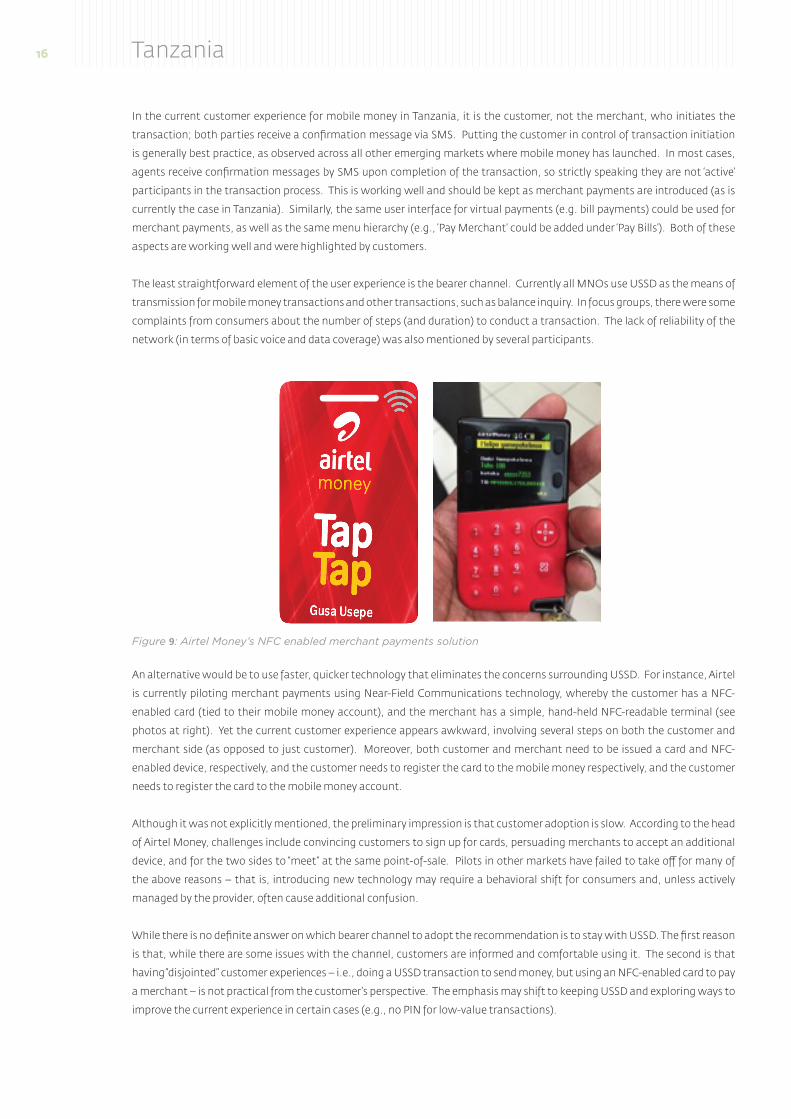
An alternative would be to use faster, quicker technology that eliminates the concerns surrounding USSD. For instance, Airtel
is currently piloting merchant payments using near-Field Communications technology, whereby the customer has a nFC-
enabled card (tied to their mobile money account), and the merchant has a simple, hand-held nFC-readable terminal (see
photos at right). Yet the current customer experience appears awkward, involving several steps on both the customer and
merchant side (as opposed to just customer). Moreover, both customer and merchant need to be issued a card and nFC-
enabled device, respectively, and the customer needs to register the card to the mobile money respectively, and the customer
needs to register the card to the mobile money account.
Although it was not explicitly mentioned, the preliminary impression is that customer adoption is slow. According to the head
of Airtel Money, challenges include convincing customers to sign up for cards, persuading merchants to accept an additional
device, and for the two sides to “meet” at the same point-of-sale. Pilots in other markets have failed to take off for many of
the above reasons – that is, introducing new technology may require a behavioral shift for consumers and, unless actively
managed by the provider, often cause additional confusion.
While there is no definite answer on which bearer channel to adopt the recommendation is to stay with USSD. The first reason
is that, while there are some issues with the channel, customers are informed and comfortable using it. The second is that
having “disjointed” customer experiences – i.e., doing a USSD transaction to send money, but using an nFC-enabled card to pay
a merchant – is not practical from the customer’s perspective. The emphasis may shift to keeping USSD and exploring ways to
improve the current experience in certain cases (e.g., no PIn for low-value transactions).
Figure 9: Airtel Money’s NFC enabled merchant payments solution
User Insights in Enabling Interoperable Mobile Money Merchant Payments 17
Lastly, a distinct merchant account, tied to a customer account9, tested well in focus groups – and is aligned with the agent
experience as well. This is because small businesses, particularly more sophisticated ones, want to manage and understand
their business and personal finances separately, even though there is frequent movement between the two (e.g., part of the
day’s business profit will go towards buying food for dinner).
Interoperability as Value Proposition
In both the survey and (especially) focus groups, interoperable merchant payments were well received by small businesses. As
the benefits became clear, they were asked if they would want to accept payments from customers across all MnO networks
or customers on the same network; not surprisingly, it made sense for them to tap into customers on all networks.
That being said, it is unclear how merchants would react to different fee structures if customers are on a different network.
While the same fee across networks would be simplest, merchants would presumably also understand if, for example, all
operators aside from their own carried a small surcharge. For example, many mobile money agents in developing countries,
including Tanzania, serve multiple mobile money programs, each with their own tariff and commission structure, and agents
generally adapt well. Moreover, if fees did vary for each mobile operator, this would need to be carefully assessed to avoid
‘multiple’ SIMs on either customer or merchant side in the same way that card-based merchants have a separate POS terminal
for each bank. This is discussed in further detail in the previous sub-section on pricing.
D. TEChnOLOGY AnD ACqUISITIOn MODELS The study did not involve an in-depth evaluation of Technology and Acquisition Models (i.e., merchant acquiring). however, the
end-user experience, from both consumer and merchant sides, was explored to inform the selection of and use of technology
for merchant payments.
Technology: Hardware
Both MnOs and bank providers wanted to understand if user preferences influenced hardware requirements at the merchant
site. Currently, merchants (and agents) use their own mobile device to accept payments. This scenario works well for micro-
businesses or when the founder or owner is the sole employee (as is the case for a number of merchants in Tanzania), but
is inconvenient for larger businesses with multiple employees. In this case, if employees are aiming to close a sale and the
customer wants to pay with mobile money, there should be a single, dedicated device for that store.
This device can be a standard phone – or a smartphone or tablet with additional features and functionality to benefit the small
business owner (both were tested as prototypes in the Design Thinking product sprints and resonated well with participants).
If needed, these devices could be programmed so that only messages are received, but no messages can be sent, and no voice
calls can be sent or received – which is Safaricom’s current design in Kenya. As mentioned in the section on user experience,
at this stage it is not recommended to change the customer experience by moving towards nFC terminals, which have the
disadvantage of being considerably more expensive.
A final consideration is hardware requirements for existing card-accepting merchants. Given how few card-accepting
merchants exist in Tanzania, it may be more appropriate to have a direct integration with existing POS terminals, based on
merchant preference (and customer preference for paper receipts), rather than adding new terminals. This is the approach
taken by Safaricom in Kenya and Dialog, a mobile operator, in Sri Lanka. Dialog, for instance, manages the integration with
the existing POS terminals so that customers receive a receipt, and merchants do not need additional devices, hardware, and
software systems.
9 Tigo does not offer the option of being simultaneous a customer and a merchant; an individual can either have a customer account or a merchant account, as the transaction is initiated by entering the recipient’s phone number. In contrast, Vodacom creates separate merchant “till” numbers for the customer to enter, so that the same small business owner can retain his customer account tied to her phone number / SIM card.
18 Tanzania
Merchant Acquisition Options
Merchant acquisition can be handled in-house or outsourced and could involve a combination of stakeholders. These are
typically:
1. The mobile provider itself (in-house)
2. A bank (presumably one familiar with merchant acquiring)
3. A dedicated third-party (agent network manager or merchant acquirer)
4. Joint acquiring (separate firm set up by MnOs)
Moreover, there are models where third party organizations that frequently interact with underserved small merchants (e.g.,
MFIs, Fast-Moving Consumer Good (FMCG) companies) can play a role. The illustrations10 on the following pages depict the
options.
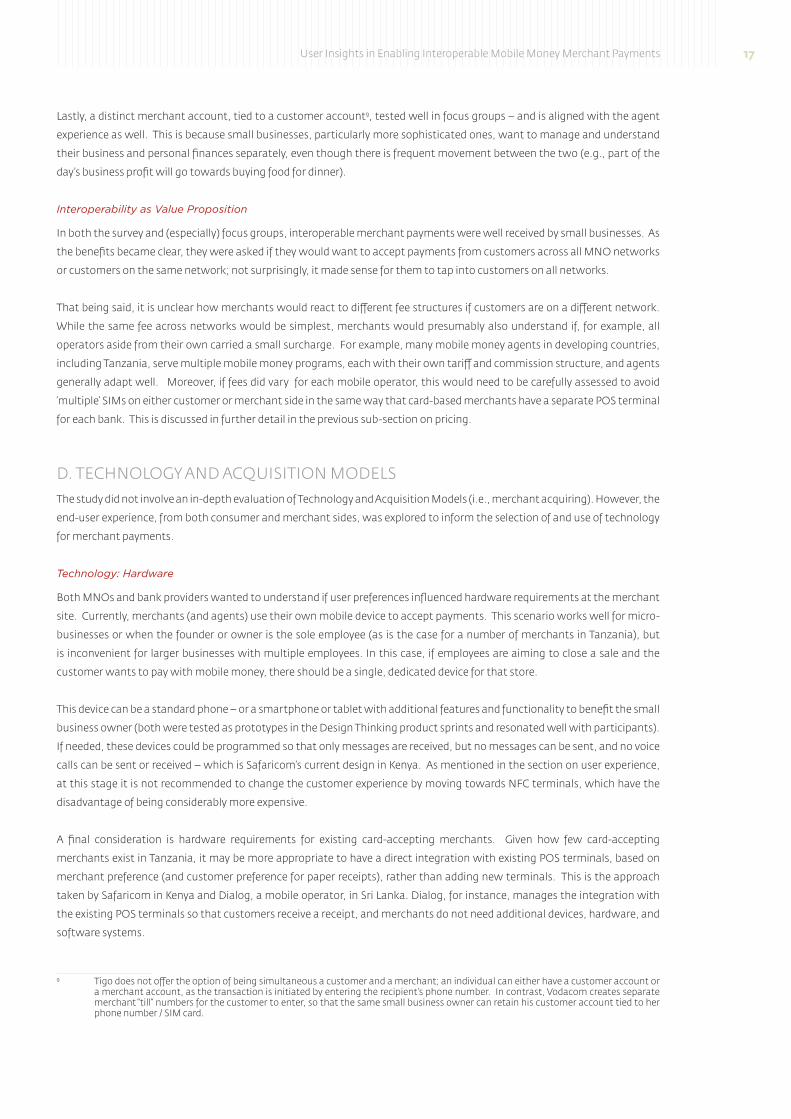
In the first case illustrated below, each mobile operator acquires their own merchant, and transactions may only be conducted
by a customer with the same operator.
In the second case, a mobile operator still manages the exclusive relationship with the merchant, but transactions can be
initiated by other operators’ customers. This is the form of interoperability typically envisioned.
10 Executive’s Guide to Mobile Money Merchant Payments, Digital Disruptions, forthcoming.
Figure 10: Exclusive Merchant Acquiring, Closed-Loop
CUSTOMER ACCOUNT
MNOA
MNOB
MNOC
MNOA
MNOB
MNOC
MERCHANT ACCOUNT
Figure 11: Exclusive Merchant Payment Acquiring, Open-Loop
CUSTOMER ACCOUNT
MNOA
MNOB
MNOC
MNOA
MNOB
MNOC
MERCHANT ACCOUNT
User Insights in Enabling Interoperable Mobile Money Merchant Payments 19
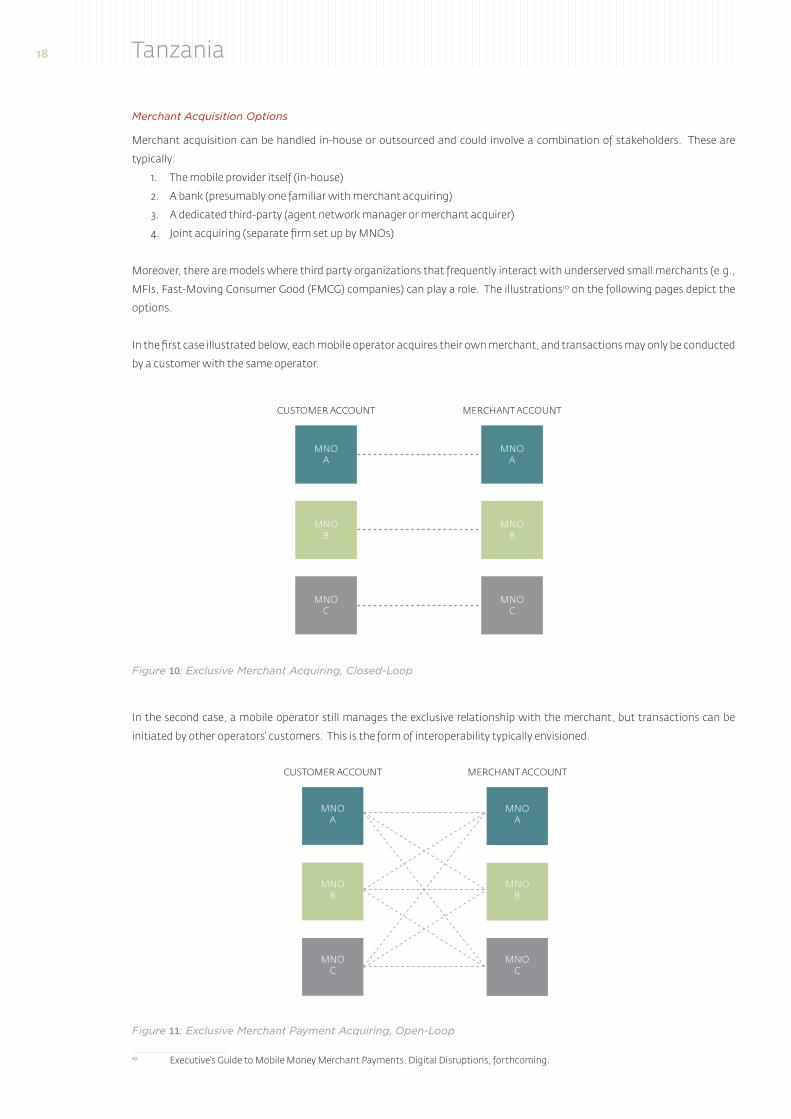
A third scenario is where operators do not manage an exclusive relationship with the merchant (depicted in the illustration by
the merchant having a relationship with all three MnOs). This scenario is similar to the current state of the agent network;
an estimated 50 percent of agents serve more than one mobile operator. In many emerging countries, including Tanzania,
merchants own several POS terminals because they have multiple relationships with acquiring banks (and because the rate
charged to the merchant is higher if the customer and merchant POS is different, i.e., an open-loop transaction).
The last scenario is where a third-party, such as a bank but also a joint venture by the operators, owns the merchant relationship.
The case example in Ghana provided in the next sub-section is an example of this scheme; Ecobank owns the relationship with
the merchant, and customers from various mobile operators can make purchases using mobile money (Kopo in this case is the
processor and ‘switch’; see below).
Figure 12: Joint Merchant Payment Acquiring, Open-Loop
CUSTOMER ACCOUNT
MNOA
MNOB
MNOC
MNOA
MNOB
MNOC
MERCHANT ACCOUNT
Figure 13: Third-Party Merchant Payment Acquiring, Open-Loop
CUSTOMER ACCOUNT MERCHANT ACCOUNT
MNOA
MNOB
Z
MNOC
20 Tanzania
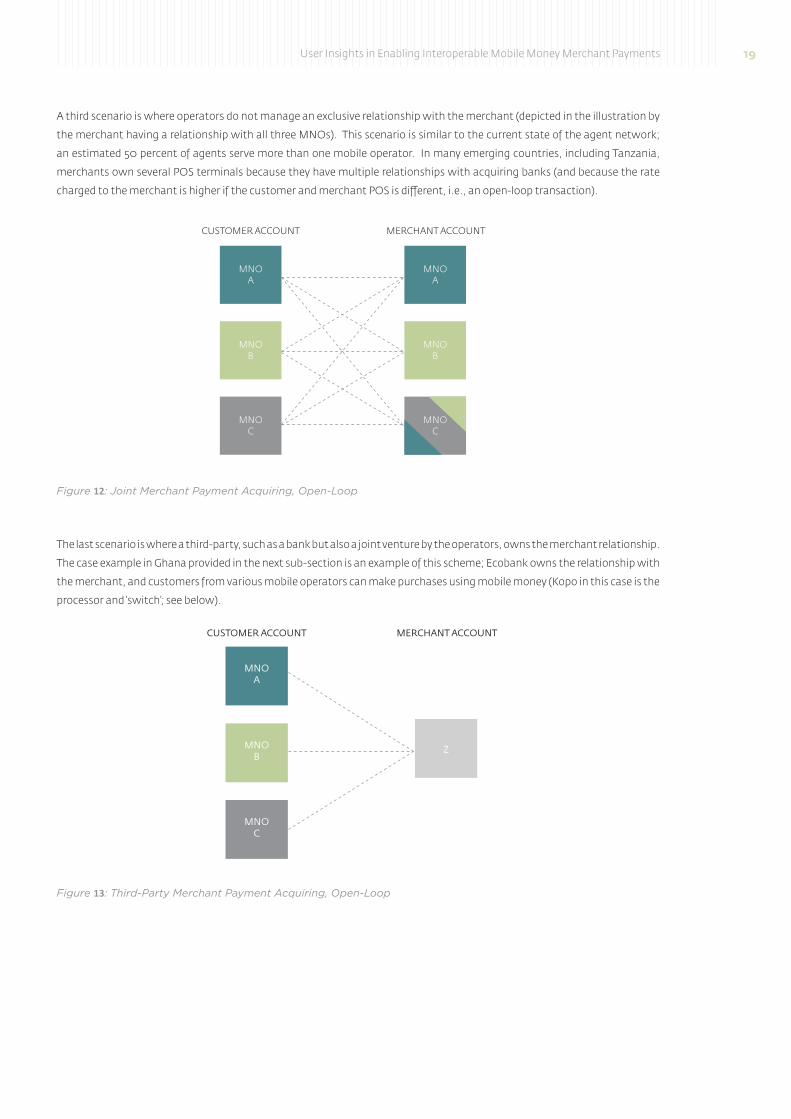
Bi-lateral vs Centralized
It is worth making the distinction that interoperability can be enabled either bi-laterally (direct connection between two
providers) or through a centralized platform (sometimes referred to as a hub-and-spoke model). While standards would
be necessary in a centralized platform for example, on message formatting, or dispute resolution, settlement mechanisms
– for the parties involved, standards are not necessarily imperative in bi-lateral arrangements (although they would make
the process more efficient, which is why the current P2P interoperability, though done bi-laterally, uses rules and standards
developed with the support of the IFC). This model is depicted in the illustrations below, where the figure of the right contains
a ‘black box’ which processes transactions (switching, clearing, and possibly authorization).
Merchant Acquisition Examples
IFC conducted informational interviews with two organizations, Dialog in Sri Lanka and Kopo Kopo in Ghana, to illustrate the
in-house and outsourced acquisition models.
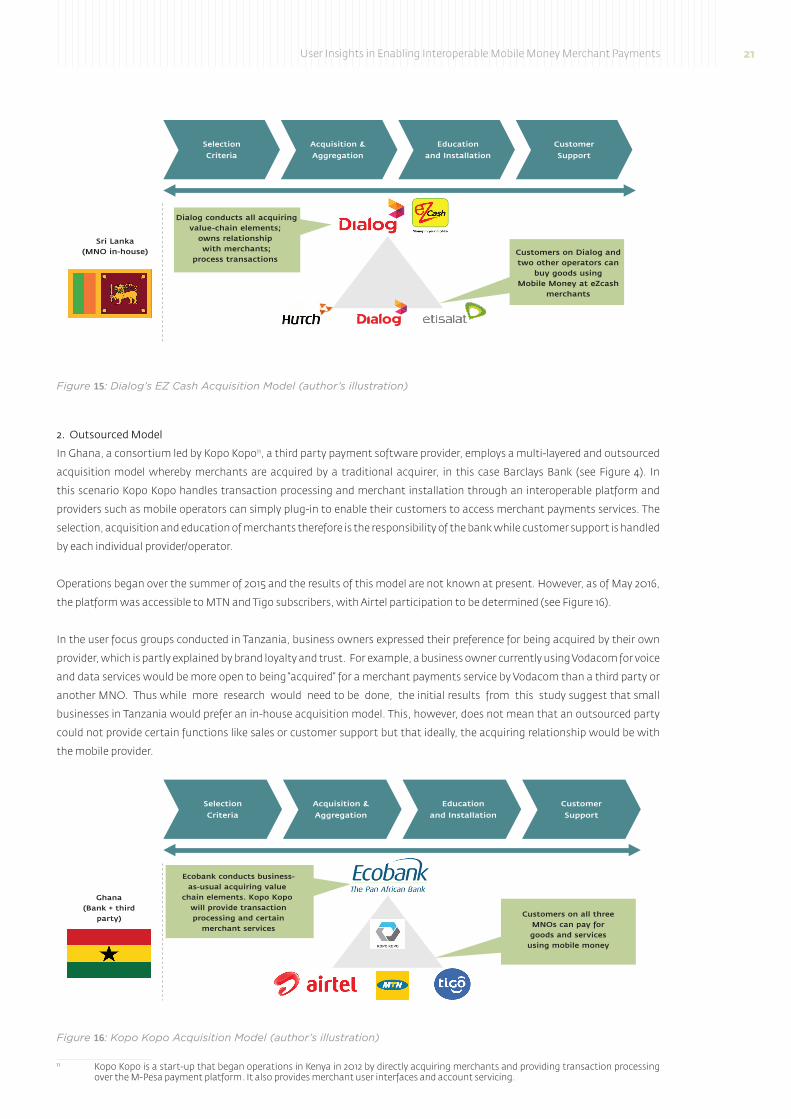
1. In-House Model
Dialog, the leading mobile operator in Sri Lanka, began offering mobile money merchant payments in 2013. It was one of the
first entities to be granted a payment license by the Central Bank of Sri Lanka, and is the only one of the five mobile operators
in the country that is permitted to directly acquire merchants. Dialog developed the “EzCash” brand and currently manages
more than 16,000 merchants, allowing mobile money customers from two other local MnOs, Etisalat and hutch, to conduct
transactions at these merchants.
This scheme, where an MnO manages all the activities in-house (#1), is described in the figure below. As shown, Dialog
manages the entire value chain from selection to ongoing customer support. This acquisition model has resulted in adoption
of mainly existing card-based merchants, in part because of a) the level of sophistication of the businesses (more employees,
larger volumes, larger average transaction size), b) a high level of appreciation of the benefits of electronic payments, and c)
the merchant discount rate of 1 percent is less than acquiring banks charge to accept card brands (roughly 3%).
Figure 14: Bi-Lateral (left) vs Centralized (right) merchant acquisition models
CUSTOMERACCOUNT
CUSTOMERACCOUNT
MNOA
MNOB
MNOC
MNOA
MNOB
MNOC
MNOA
MNOB
MNOC
MERCHANTACCOUNT
MNOA
MNOB
MNOC
MERCHANTACCOUNT
User Insights in Enabling Interoperable Mobile Money Merchant Payments 21
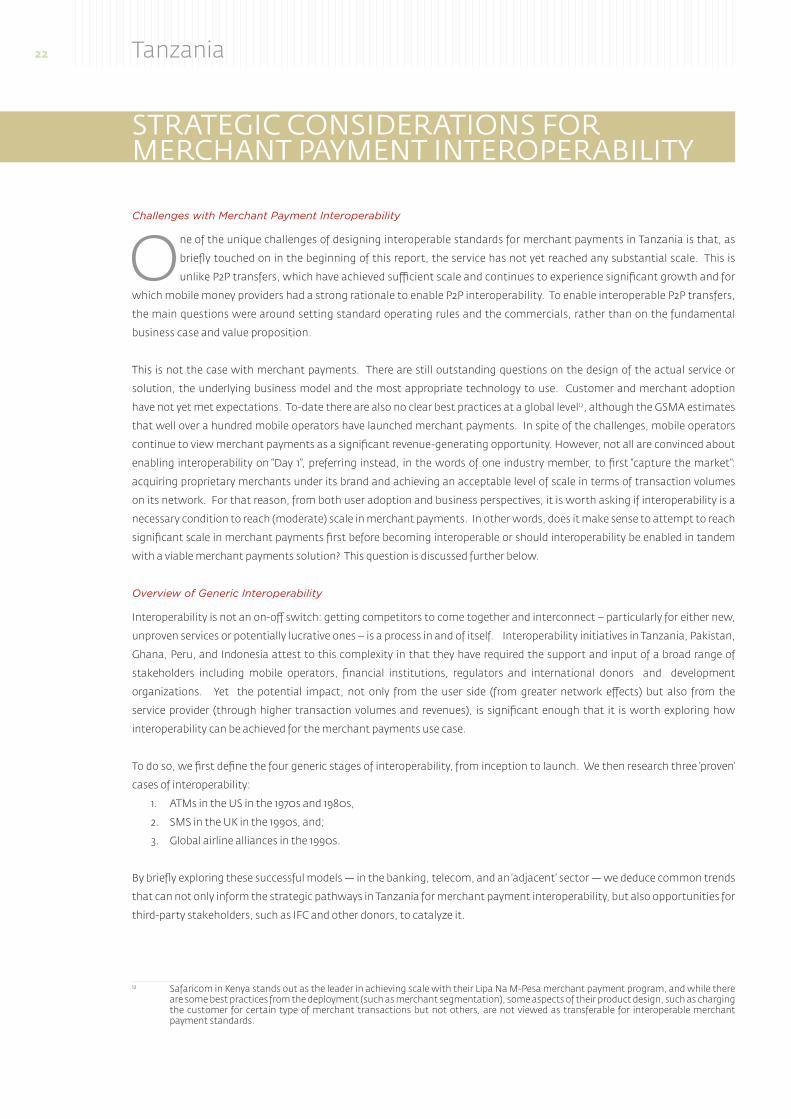
2. Outsourced Model
In Ghana, a consortium led by Kopo Kopo11, a third party payment software provider, employs a multi-layered and outsourced
acquisition model whereby merchants are acquired by a traditional acquirer, in this case Barclays Bank (see Figure 4). In
this scenario Kopo Kopo handles transaction processing and merchant installation through an interoperable platform and
providers such as mobile operators can simply plug-in to enable their customers to access merchant payments services. The
selection, acquisition and education of merchants therefore is the responsibility of the bank while customer support is handled
by each individual provider/operator.
Operations began over the summer of 2015 and the results of this model are not known at present. however, as of May 2016,
the platform was accessible to MTn and Tigo subscribers, with Airtel participation to be determined (see Figure 16).
In the user focus groups conducted in Tanzania, business owners expressed their preference for being acquired by their own
provider, which is partly explained by brand loyalty and trust. For example, a business owner currently using Vodacom for voice
and data services would be more open to being “acquired” for a merchant payments service by Vodacom than a third party or
another MnO. Thus while more research would need to be done, the initial results from this study suggest that small
businesses in Tanzania would prefer an in-house acquisition model. This, however, does not mean that an outsourced party
could not provide certain functions like sales or customer support but that ideally, the acquiring relationship would be with
the mobile provider.
11 Kopo Kopo is a start-up that began operations in Kenya in 2012 by directly acquiring merchants and providing transaction processing over the M-Pesa payment platform. It also provides merchant user interfaces and account servicing.
Figure 15: Dialog’s EZ Cash Acquisition Model (author’s illustration)
Selection
Criteria
Sri Lanka(MNO in-house)
Dialog conducts all acquiringvalue-chain elements;
owns relationship with merchants;
process transactions
Acquisition &
Aggregation
Education
and Installation
Customer
Support
Customers on Dialog andtwo other operators can
buy goods usingMobile Money at eZcash
merchants
Figure 16: Kopo Kopo Acquisition Model (author’s illustration)
Selection
Criteria
Ghana(Bank + third
party)
Ecobank conducts business-as-usual acquiring value
chain elements. Kopo Kopo will provide transactionprocessing and certain
merchant services
Acquisition &
Aggregation
Education
and Installation
Customer
Support
Customers on all threeMNOs can pay forgoods and services
using mobile money
22 Tanzania
Challenges with Merchant Payment Interoperability
One of the unique challenges of designing interoperable standards for merchant payments in Tanzania is that, as
briefly touched on in the beginning of this report, the service has not yet reached any substantial scale. This is
unlike P2P transfers, which have achieved sufficient scale and continues to experience significant growth and for
which mobile money providers had a strong rationale to enable P2P interoperability. To enable interoperable P2P transfers,
the main questions were around setting standard operating rules and the commercials, rather than on the fundamental
business case and value proposition.
This is not the case with merchant payments. There are still outstanding questions on the design of the actual service or
solution, the underlying business model and the most appropriate technology to use. Customer and merchant adoption
have not yet met expectations. To-date there are also no clear best practices at a global level12, although the GSMA estimates
that well over a hundred mobile operators have launched merchant payments. In spite of the challenges, mobile operators
continue to view merchant payments as a significant revenue-generating opportunity. however, not all are convinced about
enabling interoperability on “Day 1”, preferring instead, in the words of one industry member, to first “capture the market”:
acquiring proprietary merchants under its brand and achieving an acceptable level of scale in terms of transaction volumes
on its network. For that reason, from both user adoption and business perspectives, it is worth asking if interoperability is a
necessary condition to reach (moderate) scale in merchant payments. In other words, does it make sense to attempt to reach
significant scale in merchant payments first before becoming interoperable or should interoperability be enabled in tandem
with a viable merchant payments solution? This question is discussed further below.
Overview of Generic Interoperability
Interoperability is not an on-off switch: getting competitors to come together and interconnect – particularly for either new,
unproven services or potentially lucrative ones – is a process in and of itself. Interoperability initiatives in Tanzania, Pakistan,
Ghana, Peru, and Indonesia attest to this complexity in that they have required the support and input of a broad range of
stakeholders including mobile operators, financial institutions, regulators and international donors and development
organizations. Yet the potential impact, not only from the user side (from greater network effects) but also from the
service provider (through higher transaction volumes and revenues), is significant enough that it is worth exploring how
interoperability can be achieved for the merchant payments use case.
To do so, we first define the four generic stages of interoperability, from inception to launch. We then research three ‘proven’
cases of interoperability:
1. ATMs in the US in the 1970s and 1980s,
2. SMS in the UK in the 1990s, and;
3. Global airline alliances in the 1990s.
By briefly exploring these successful models — in the banking, telecom, and an ‘adjacent’ sector — we deduce common trends
that can not only inform the strategic pathways in Tanzania for merchant payment interoperability, but also opportunities for
third-party stakeholders, such as IFC and other donors, to catalyze it.
12 Safaricom in Kenya stands out as the leader in achieving scale with their Lipa na M-Pesa merchant payment program, and while there are some best practices from the deployment (such as merchant segmentation), some aspects of their product design, such as charging the customer for certain type of merchant transactions but not others, are not viewed as transferable for interoperable merchant payment standards.
STRATEgIC CONSIdERATIONS fOR MERCHANT PAYMENT INTEROPERABILITY
User Insights in Enabling Interoperable Mobile Money Merchant Payments 23
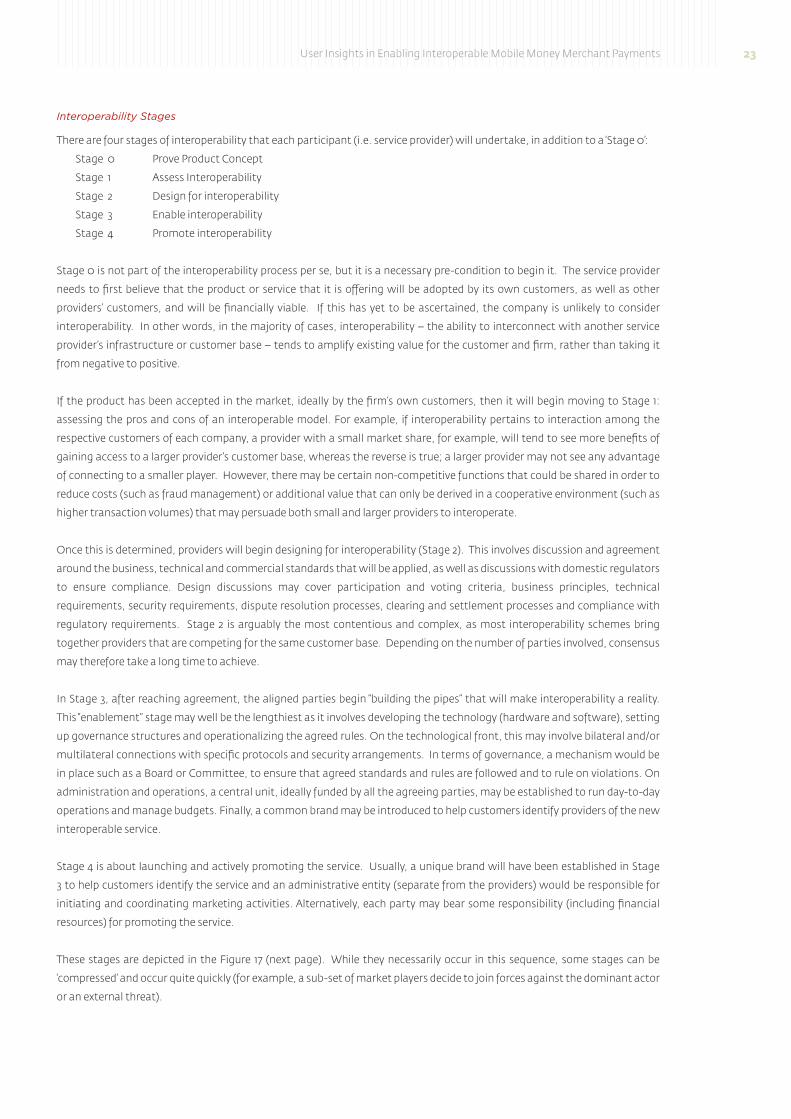
Interoperability Stages
There are four stages of interoperability that each participant (i.e. service provider) will undertake, in addition to a ‘Stage 0’:
Stage 0 Prove Product Concept
Stage 1 Assess Interoperability
Stage 2 Design for interoperability
Stage 3 Enable interoperability
Stage 4 Promote interoperability
Stage 0 is not part of the interoperability process per se, but it is a necessary pre-condition to begin it. The service provider
needs to first believe that the product or service that it is offering will be adopted by its own customers, as well as other
providers’ customers, and will be financially viable. If this has yet to be ascertained, the company is unlikely to consider
interoperability. In other words, in the majority of cases, interoperability – the ability to interconnect with another service
provider’s infrastructure or customer base – tends to amplify existing value for the customer and firm, rather than taking it
from negative to positive.
If the product has been accepted in the market, ideally by the firm’s own customers, then it will begin moving to Stage 1:
assessing the pros and cons of an interoperable model. For example, if interoperability pertains to interaction among the
respective customers of each company, a provider with a small market share, for example, will tend to see more benefits of
gaining access to a larger provider’s customer base, whereas the reverse is true; a larger provider may not see any advantage
of connecting to a smaller player. however, there may be certain non-competitive functions that could be shared in order to
reduce costs (such as fraud management) or additional value that can only be derived in a cooperative environment (such as
higher transaction volumes) that may persuade both small and larger providers to interoperate.
Once this is determined, providers will begin designing for interoperability (Stage 2). This involves discussion and agreement
around the business, technical and commercial standards that will be applied, as well as discussions with domestic regulators
to ensure compliance. Design discussions may cover participation and voting criteria, business principles, technical
requirements, security requirements, dispute resolution processes, clearing and settlement processes and compliance with
regulatory requirements. Stage 2 is arguably the most contentious and complex, as most interoperability schemes bring
together providers that are competing for the same customer base. Depending on the number of parties involved, consensus
may therefore take a long time to achieve.
In Stage 3, after reaching agreement, the aligned parties begin “building the pipes” that will make interoperability a reality.
This “enablement” stage may well be the lengthiest as it involves developing the technology (hardware and software), setting
up governance structures and operationalizing the agreed rules. On the technological front, this may involve bilateral and/or
multilateral connections with specific protocols and security arrangements. In terms of governance, a mechanism would be
in place such as a Board or Committee, to ensure that agreed standards and rules are followed and to rule on violations. On
administration and operations, a central unit, ideally funded by all the agreeing parties, may be established to run day-to-day
operations and manage budgets. Finally, a common brand may be introduced to help customers identify providers of the new
interoperable service.
Stage 4 is about launching and actively promoting the service. Usually, a unique brand will have been established in Stage
3 to help customers identify the service and an administrative entity (separate from the providers) would be responsible for
initiating and coordinating marketing activities. Alternatively, each party may bear some responsibility (including financial
resources) for promoting the service.
These stages are depicted in the Figure 17 (next page). While they necessarily occur in this sequence, some stages can be
‘compressed’ and occur quite quickly (for example, a sub-set of market players decide to join forces against the dominant actor
or an external threat).
24 Tanzania
Interoperability Case 1: ATMs in the US banking sector
The first operational Automatic Teller Machine (ATM), or cash machine, appeared in the late 1960s: Barclays Bank in the UK
used paper vouchers with radioactive ink; Chemical Bank in new York used plastic cards that are more familiar today. The initial
purpose of ATMs was for a bank to reduce the costs of check cashing at its branches, but customers were initially reluctant to
use them and, as is still the case today, the machines were expensive to produce and maintain.
It was part corporate foresight, and part luck, that Citibank (now known as Citi) ended up creating the largest ATM network at
the time. After a couple of years of market research, in 1977, Citibank had invested nearly $100 million to deploy
ATMs in new York City, and soon after the famous “blizzard of 1978” forced branch closures of all banks across the city for days.
Citibank’s customers were able to withdraw much needed cash from the network of ATMs in the time of crisis, and other
customers soon migrated to Citibank. Thus the “product concept” of ATMs (‘Stage 0’) was proven in the marketplace over the
course of about 18 months.
Throughout the early 1980s, six rival new York banks, including Chemical Bank, Chase, and Barclays, decided to collaborate
and form their own interoperable ATM consortium, called the new York Cash Exchange (nYCE) (they had previously each
managed their own, proprietary ATM networks). This allowed a bank’s customer to use the ATM deployed by another bank,
with an interchange agreement for the customer’s bank to compensate the bank owner of the ATM for its use. While each
bank independently had a much smaller ATM footprint than Citibank’s 500 ATMs, collectively they boasted 800 ATMs. In other
words, these banks moved relatively quickly to the ‘Assessing’ (Stage 1) to designing, enabling, and promoting the interoperable
network (Stages 2 through 4) in a matter of a few years.
Still, Citibank refused to join nYCE, opting instead to maintain its proprietary ATM network. But eventually, the nYCE
consortium grew to include more banks and ATMs, and Citibank’s customers started requesting the ability to use nYCE’s more
prominent ATM network. Eventually, Citibank joined nYCE in 1994; since then nYCE has over 300,000 ATM points across the
country (and is now owned by FIS, a payment processor).
Two key lessons emerge from this case. The first is that market leaders often resist interoperability if they stand to gain a
greater competitive advantage by offering so-called ‘closed-loop’ services. In Citibank’s case, it made sense for them to stay
independent – until it didn’t. The second is that partnerships by smaller players – itself a form of interoperability – can in some
cases dwarf the size (either customer base, or infrastructure, or other key benefit) of the market leader, which puts pressure
on the latter to join.
Figure 17: Interoperability Stages (author’s illustration)
Complexity
Design
AssessStage
1
Stage 0
Stage 2
Stage 3
Stage 4
Enable
Promote
Time
User Insights in Enabling Interoperable Mobile Money Merchant Payments 25
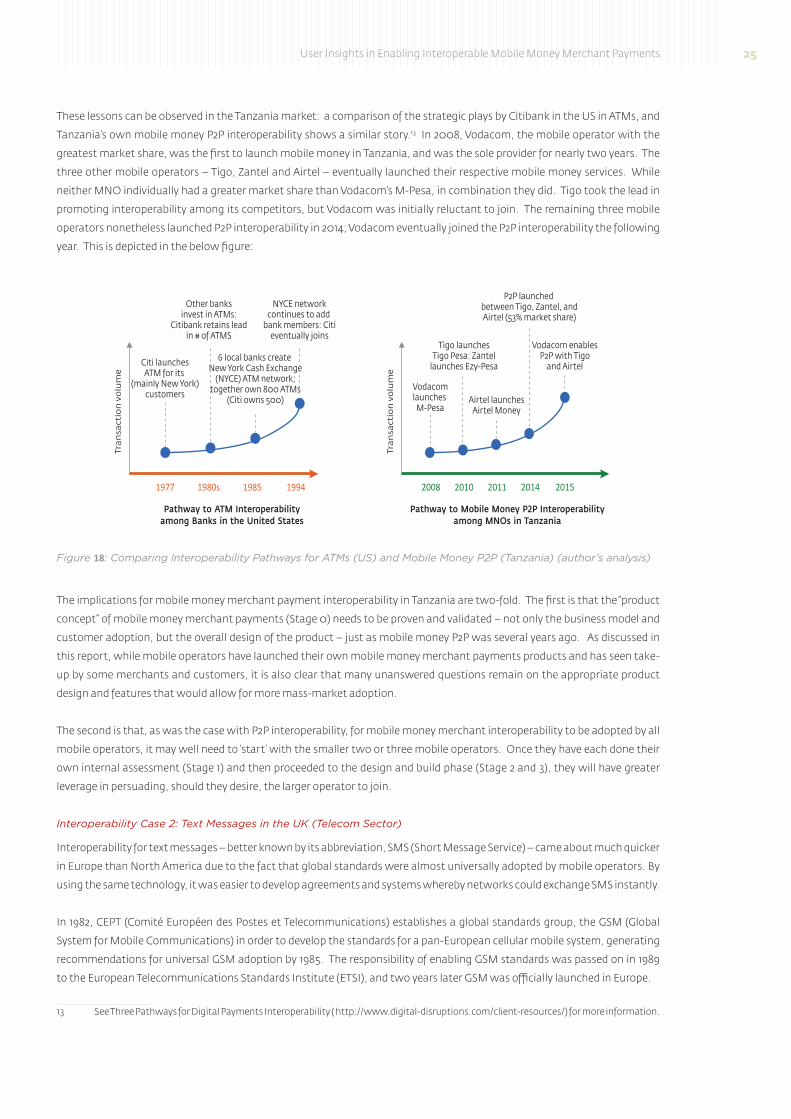
These lessons can be observed in the Tanzania market: a comparison of the strategic plays by Citibank in the US in ATMs, and
Tanzania’s own mobile money P2P interoperability shows a similar story.13 In 2008, Vodacom, the mobile operator with the
greatest market share, was the first to launch mobile money in Tanzania, and was the sole provider for nearly two years. The
three other mobile operators – Tigo, zantel and Airtel – eventually launched their respective mobile money services. While
neither MnO individually had a greater market share than Vodacom’s M-Pesa, in combination they did. Tigo took the lead in
promoting interoperability among its competitors, but Vodacom was initially reluctant to join. The remaining three mobile
operators nonetheless launched P2P interoperability in 2014; Vodacom eventually joined the P2P interoperability the following
year. This is depicted in the below figure:
The implications for mobile money merchant payment interoperability in Tanzania are two-fold. The first is that the “product
concept” of mobile money merchant payments (Stage 0) needs to be proven and validated – not only the business model and
customer adoption, but the overall design of the product – just as mobile money P2P was several years ago. As discussed in
this report, while mobile operators have launched their own mobile money merchant payments products and has seen take-
up by some merchants and customers, it is also clear that many unanswered questions remain on the appropriate product
design and features that would allow for more mass-market adoption.
The second is that, as was the case with P2P interoperability, for mobile money merchant interoperability to be adopted by all
mobile operators, it may well need to ‘start’ with the smaller two or three mobile operators. Once they have each done their
own internal assessment (Stage 1) and then proceeded to the design and build phase (Stage 2 and 3), they will have greater
leverage in persuading, should they desire, the larger operator to join.
Interoperability Case 2: Text Messages in the UK (Telecom Sector)
Interoperability for text messages – better known by its abbreviation, SMS (Short Message Service) – came about much quicker
in Europe than north America due to the fact that global standards were almost universally adopted by mobile operators. By
using the same technology, it was easier to develop agreements and systems whereby networks could exchange SMS instantly.
In 1982, CEPT (Comité Européen des Postes et Telecommunications) establishes a global standards group, the GSM (Global
System for Mobile Communications) in order to develop the standards for a pan-European cellular mobile system, generating
recommendations for universal GSM adoption by 1985. The responsibility of enabling GSM standards was passed on in 1989
to the European Telecommunications Standards Institute (ETSI), and two years later GSM was officially launched in Europe.
13 See Three Pathways for Digital Payments Interoperability ( http://www.digital-disruptions.com/client-resources/) for more information.
Figure 18: Comparing Interoperability Pathways for ATMs (US) and Mobile Money P2P (Tanzania) (author’s analysis)
Other banksinvest in ATMs:
Citibank retains leadin # of ATMS
6 local banks create New York Cash Exchange
(NYCE) ATM network;together own 800 ATMs
(Citi owns 500)
Citi launchesATM for its
(mainly New York)customers
Tra
nsa
ctio
n v
olu
me
Pathway to ATM Interoperabilityamong Banks in the United States
1977 1980s 1985 1994
Pathway to Mobile Money P2P Interoperabilityamong MNOs in Tanzania
Vodacomlaunches
M-PesaAirtel launches
Airtel Money
Tigo launchesTigo Pesa: Zantel
launches Ezy-Pesa
Vodacom enablesP2P with Tigo
and Airtel
P2P launched between Tigo, Zantel, andAirtel (53% market share)
NYCE networkcontinues to add
bank members: Citieventually joins
2008 2010 20142011 2015
Tra
nsa
ctio
n v
olu
me
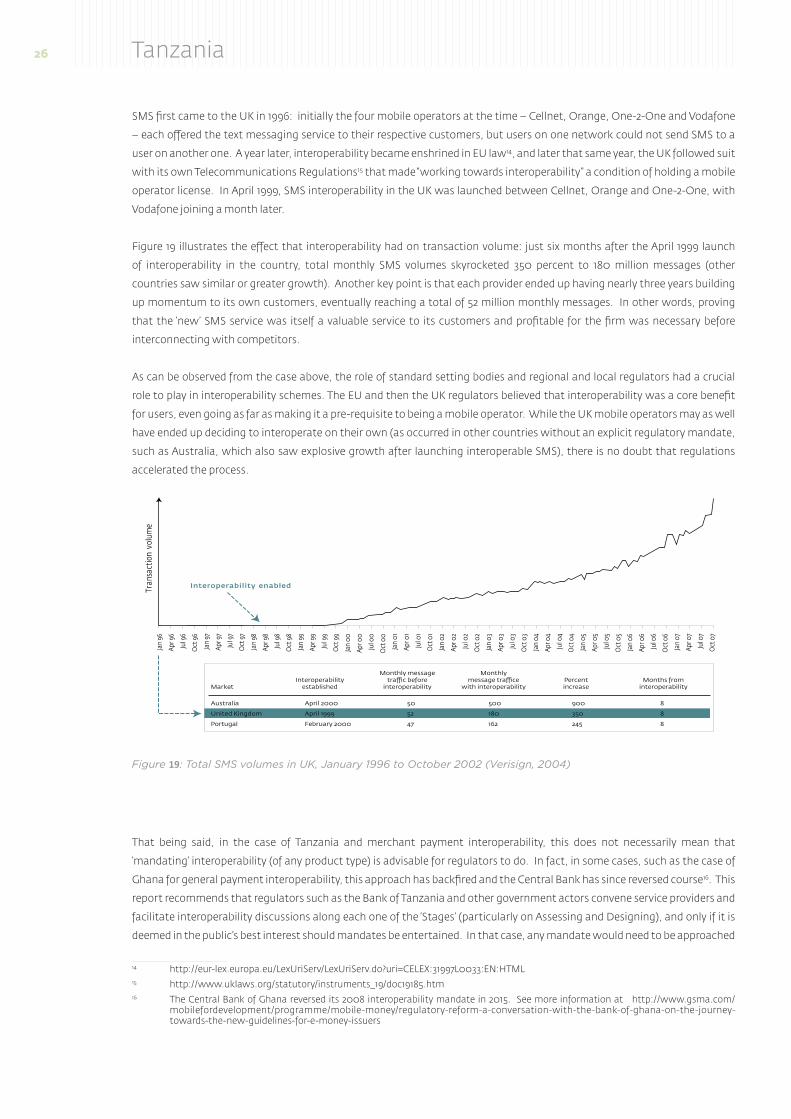
26 Tanzania
SMS first came to the UK in 1996: initially the four mobile operators at the time – Cellnet, Orange, One-2-One and Vodafone
– each offered the text messaging service to their respective customers, but users on one network could not send SMS to a
user on another one. A year later, interoperability became enshrined in EU law14, and later that same year, the UK followed suit
with its own Telecommunications Regulations15 that made “working towards interoperability” a condition of holding a mobile
operator license. In April 1999, SMS interoperability in the UK was launched between Cellnet, Orange and One-2-One, with
Vodafone joining a month later.
Figure 19 illustrates the effect that interoperability had on transaction volume: just six months after the April 1999 launch
of interoperability in the country, total monthly SMS volumes skyrocketed 350 percent to 180 million messages (other
countries saw similar or greater growth). Another key point is that each provider ended up having nearly three years building
up momentum to its own customers, eventually reaching a total of 52 million monthly messages. In other words, proving
that the ‘new’ SMS service was itself a valuable service to its customers and profitable for the firm was necessary before
interconnecting with competitors.
As can be observed from the case above, the role of standard setting bodies and regional and local regulators had a crucial
role to play in interoperability schemes. The EU and then the UK regulators believed that interoperability was a core benefit
for users, even going as far as making it a pre-requisite to being a mobile operator. While the UK mobile operators may as well
have ended up deciding to interoperate on their own (as occurred in other countries without an explicit regulatory mandate,
such as Australia, which also saw explosive growth after launching interoperable SMS), there is no doubt that regulations
accelerated the process.
That being said, in the case of Tanzania and merchant payment interoperability, this does not necessarily mean that
‘mandating’ interoperability (of any product type) is advisable for regulators to do. In fact, in some cases, such as the case of
Ghana for general payment interoperability, this approach has backfired and the Central Bank has since reversed course16. This
report recommends that regulators such as the Bank of Tanzania and other government actors convene service providers and
facilitate interoperability discussions along each one of the ‘Stages’ (particularly on Assessing and Designing), and only if it is
deemed in the public’s best interest should mandates be entertained. In that case, any mandate would need to be approached
14 http://eur-lex.europa.eu/LexUriServ/LexUriServ.do?uri=CELEx:31997L0033:En:hTML15 http://www.uklaws.org/statutory/instruments_19/doc19185.htm16 The Central Bank of Ghana reversed its 2008 interoperability mandate in 2015. See more information at http://www.gsma.com/
mobilefordevelopment/programme/mobile-money/regulatory-reform-a-conversation-with-the-bank-of-ghana-on-the-journey-towards-the-new-guidelines-for-e-money-issuers
Figure 19: Total SMS volumes in UK, January 1996 to October 2002 (Verisign, 2004)
Interoperability enabledTran
sact
ion
vol
ume
Market
Jan
96
Apr 9
6
Jul 9
6
Oct
96
Jan
97
Apr 9
7
Jul 9
7
Oct
97
Jan
98
Apr 9
8
Jul 9
8
Oct
98
Jan
99
Apr 9
9
Jul 9
9
Oct
99
Jan
00
Apr 0
0
Jul 0
0
Oct
00
Jan
01
Apr 0
1
Jul 0
1
Oct
01
Jan
02
Apr 0
2
Jul 0
2
Oct
02
Jan
03
Apr 0
3
Jul 0
3
Oct
03
Jan
04
Apr 0
4
Jul 0
4
Oct
04
Jan
05
Apr 0
5
Jul 0
5
Oct
05
Jan
06
Apr 0
6
Jul 0
6
Oct
06
Jan
07
Apr 0
7
Jul 0
7
Oct
07
Australia
United Kingdom
Portugal
Interoperabilityestablished
April 2000
April 1999
February 2000
Monthly messagetra�c before
interoperability
50
52
47
Monthlymessage tra�ce
with interoperability
500
180
162
Percentincrease
900
350
245
Months frominteroperability
8
8
8
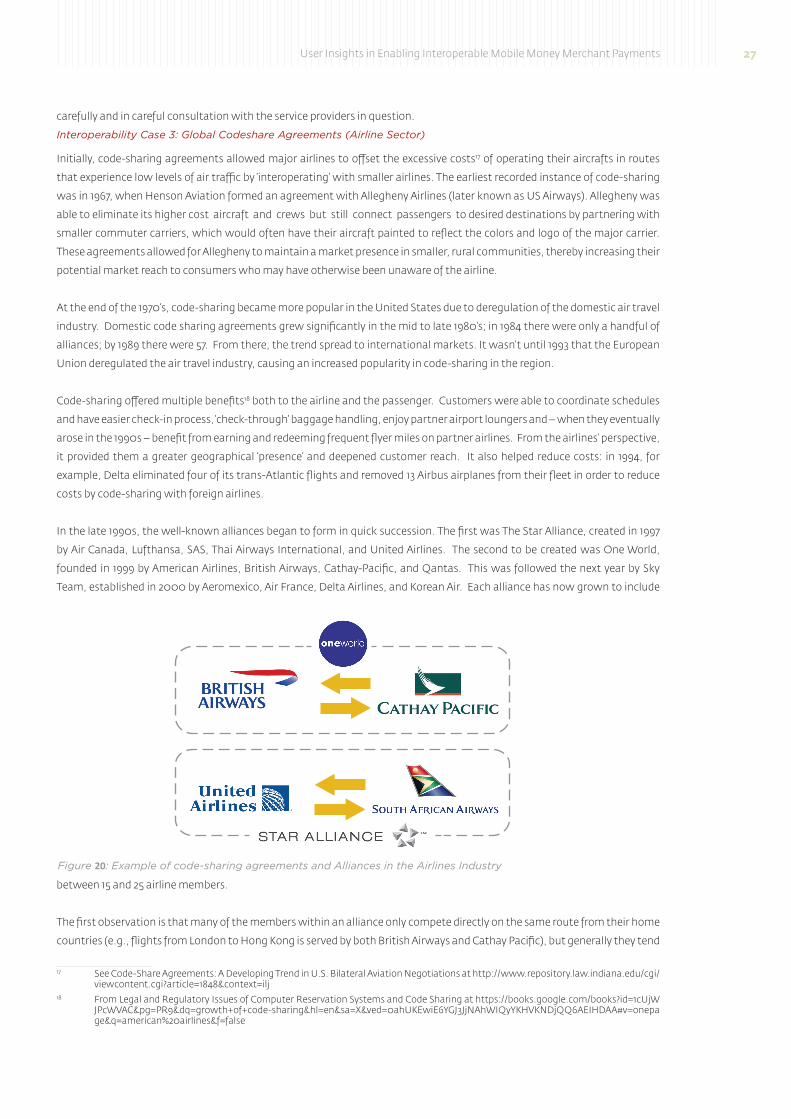
User Insights in Enabling Interoperable Mobile Money Merchant Payments 27
carefully and in careful consultation with the service providers in question.
Interoperability Case 3: Global Codeshare Agreements (Airline Sector)
Initially, code-sharing agreements allowed major airlines to offset the excessive costs17 of operating their aircrafts in routes
that experience low levels of air traffic by ‘interoperating’ with smaller airlines. The earliest recorded instance of code-sharing
was in 1967, when henson Aviation formed an agreement with Allegheny Airlines (later known as US Airways). Allegheny was
able to eliminate its higher cost aircraft and crews but still connect passengers to desired destinations by partnering with
smaller commuter carriers, which would often have their aircraft painted to reflect the colors and logo of the major carrier.
These agreements allowed for Allegheny to maintain a market presence in smaller, rural communities, thereby increasing their
potential market reach to consumers who may have otherwise been unaware of the airline.
At the end of the 1970’s, code-sharing became more popular in the United States due to deregulation of the domestic air travel
industry. Domestic code sharing agreements grew significantly in the mid to late 1980’s; in 1984 there were only a handful of
alliances; by 1989 there were 57. From there, the trend spread to international markets. It wasn’t until 1993 that the European
Union deregulated the air travel industry, causing an increased popularity in code-sharing in the region.
Code-sharing offered multiple benefits18 both to the airline and the passenger. Customers were able to coordinate schedules
and have easier check-in process, ‘check-through’ baggage handling, enjoy partner airport loungers and – when they eventually
arose in the 1990s – benefit from earning and redeeming frequent flyer miles on partner airlines. From the airlines’ perspective,
it provided them a greater geographical ‘presence’ and deepened customer reach. It also helped reduce costs: in 1994, for
example, Delta eliminated four of its trans-Atlantic flights and removed 13 Airbus airplanes from their fleet in order to reduce
costs by code-sharing with foreign airlines.
In the late 1990s, the well-known alliances began to form in quick succession. The first was The Star Alliance, created in 1997
by Air Canada, Lufthansa, SAS, Thai Airways International, and United Airlines. The second to be created was One World,
founded in 1999 by American Airlines, British Airways, Cathay-Pacific, and qantas. This was followed the next year by Sky
Team, established in 2000 by Aeromexico, Air France, Delta Airlines, and Korean Air. Each alliance has now grown to include
between 15 and 25 airline members.
The first observation is that many of the members within an alliance only compete directly on the same route from their home
countries (e.g., flights from London to hong Kong is served by both British Airways and Cathay Pacific), but generally they tend
17 See Code-Share Agreements: A Developing Trend in U.S. Bilateral Aviation negotiations at http://www.repository.law.indiana.edu/cgi/viewcontent.cgi?article=1848&context=ilj
18 From Legal and Regulatory Issues of Computer Reservation Systems and Code Sharing at https://books.google.com/books?id=1cUjWJPcWVAC&pg=PR9&dq=growth+of+code-sharing&hl=en&sa=x&ved=0ahUKEwiE6YGJ3JjnAhWIqyYKhVKnDjqq6AEIhDAA#v=onepage&q=american%20airlines&f=false
Figure 20: Example of code-sharing agreements and Alliances in the Airlines Industry
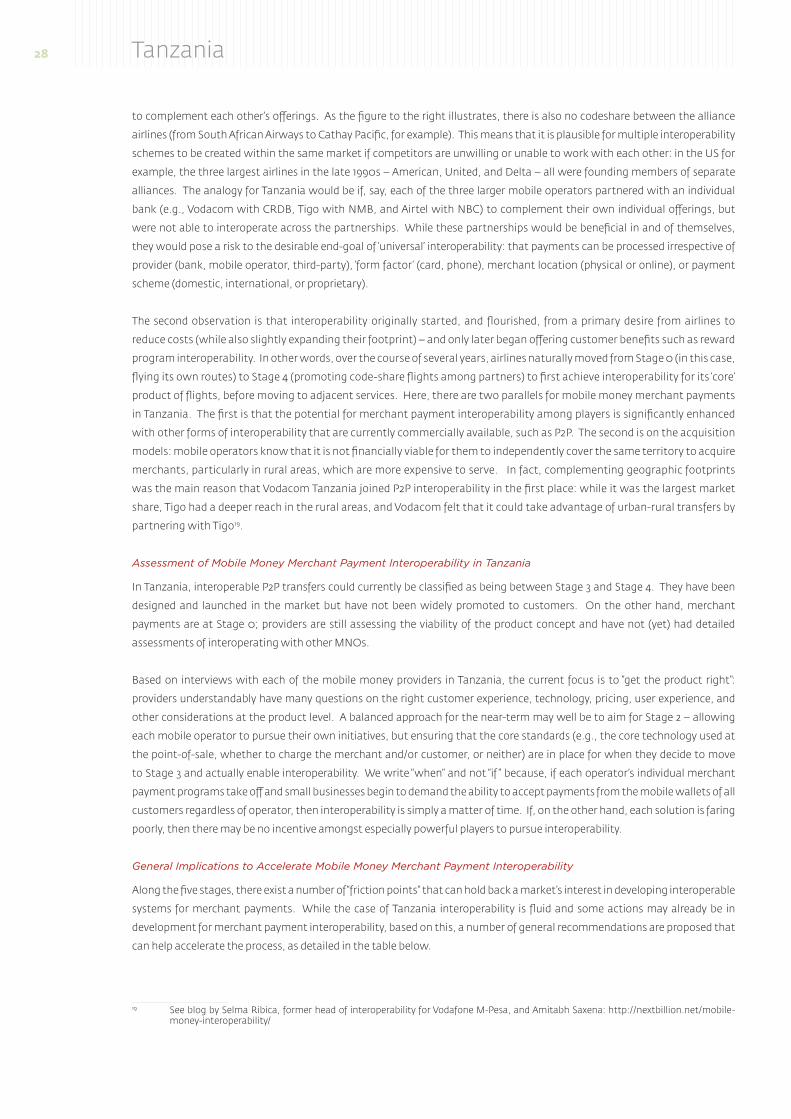
28 Tanzania
to complement each other’s offerings. As the figure to the right illustrates, there is also no codeshare between the alliance
airlines (from South African Airways to Cathay Pacific, for example). This means that it is plausible for multiple interoperability
schemes to be created within the same market if competitors are unwilling or unable to work with each other: in the US for
example, the three largest airlines in the late 1990s – American, United, and Delta – all were founding members of separate
alliances. The analogy for Tanzania would be if, say, each of the three larger mobile operators partnered with an individual
bank (e.g., Vodacom with CRDB, Tigo with nMB, and Airtel with nBC) to complement their own individual offerings, but
were not able to interoperate across the partnerships. While these partnerships would be beneficial in and of themselves,
they would pose a risk to the desirable end-goal of ‘universal’ interoperability: that payments can be processed irrespective of
provider (bank, mobile operator, third-party), ‘form factor’ (card, phone), merchant location (physical or online), or payment
scheme (domestic, international, or proprietary).
The second observation is that interoperability originally started, and flourished, from a primary desire from airlines to
reduce costs (while also slightly expanding their footprint) – and only later began offering customer benefits such as reward
program interoperability. In other words, over the course of several years, airlines naturally moved from Stage 0 (in this case,
flying its own routes) to Stage 4 (promoting code-share flights among partners) to first achieve interoperability for its ‘core’
product of flights, before moving to adjacent services. here, there are two parallels for mobile money merchant payments
in Tanzania. The first is that the potential for merchant payment interoperability among players is significantly enhanced
with other forms of interoperability that are currently commercially available, such as P2P. The second is on the acquisition
models: mobile operators know that it is not financially viable for them to independently cover the same territory to acquire
merchants, particularly in rural areas, which are more expensive to serve. In fact, complementing geographic footprints
was the main reason that Vodacom Tanzania joined P2P interoperability in the first place: while it was the largest market
share, Tigo had a deeper reach in the rural areas, and Vodacom felt that it could take advantage of urban-rural transfers by
partnering with Tigo19.
Assessment of Mobile Money Merchant Payment Interoperability in Tanzania
In Tanzania, interoperable P2P transfers could currently be classified as being between Stage 3 and Stage 4. They have been
designed and launched in the market but have not been widely promoted to customers. On the other hand, merchant
payments are at Stage 0; providers are still assessing the viability of the product concept and have not (yet) had detailed
assessments of interoperating with other MnOs.
Based on interviews with each of the mobile money providers in Tanzania, the current focus is to “get the product right”:
providers understandably have many questions on the right customer experience, technology, pricing, user experience, and
other considerations at the product level. A balanced approach for the near-term may well be to aim for Stage 2 – allowing
each mobile operator to pursue their own initiatives, but ensuring that the core standards (e.g., the core technology used at
the point-of-sale, whether to charge the merchant and/or customer, or neither) are in place for when they decide to move
to Stage 3 and actually enable interoperability. We write “when” and not “if ” because, if each operator’s individual merchant
payment programs take off and small businesses begin to demand the ability to accept payments from the mobile wallets of all
customers regardless of operator, then interoperability is simply a matter of time. If, on the other hand, each solution is faring
poorly, then there may be no incentive amongst especially powerful players to pursue interoperability.
General Implications to Accelerate Mobile Money Merchant Payment Interoperability
Along the five stages, there exist a number of “friction points” that can hold back a market’s interest in developing interoperable
systems for merchant payments. While the case of Tanzania interoperability is fluid and some actions may already be in
development for merchant payment interoperability, based on this, a number of general recommendations are proposed that
can help accelerate the process, as detailed in the table below.
19 See blog by Selma Ribica, former head of interoperability for Vodafone M-Pesa, and Amitabh Saxena: http://nextbillion.net/mobile-money-interoperability/
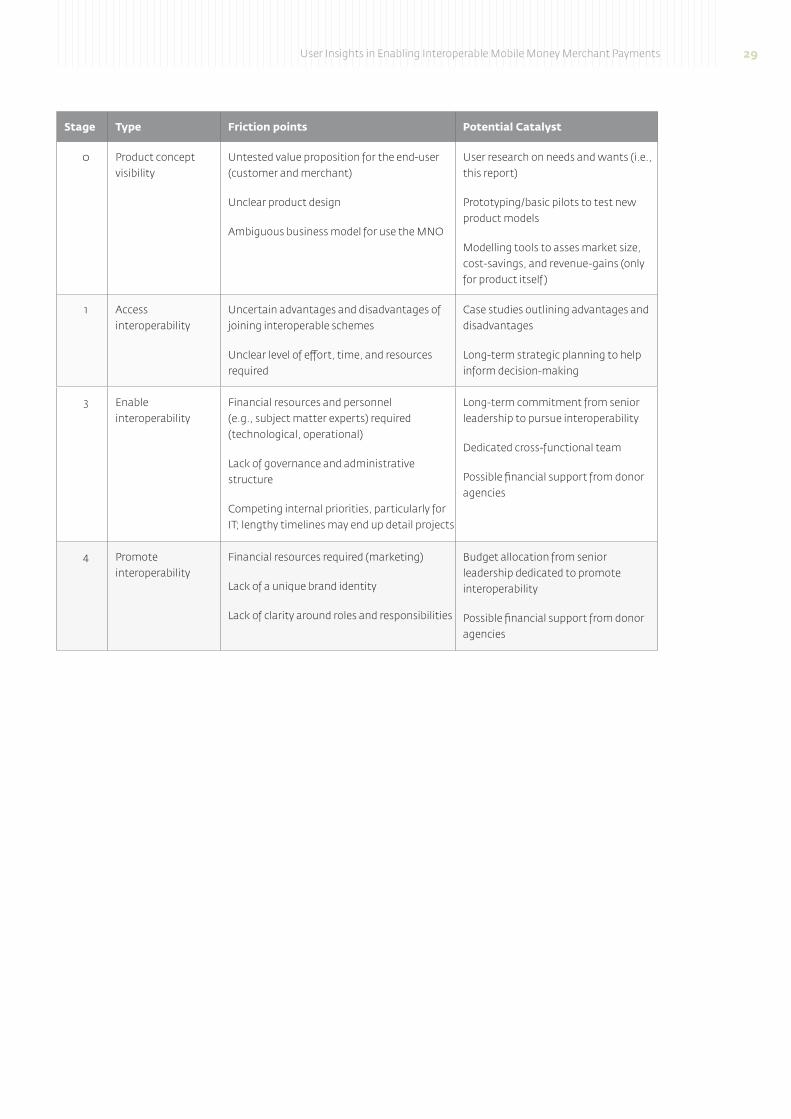
User Insights in Enabling Interoperable Mobile Money Merchant Payments 29
Stage Type Friction points Potential Catalyst
0 Product concept visibility
Untested value proposition for the end-user (customer and merchant)
Unclear product design
Ambiguous business model for use the MnO
User research on needs and wants (i.e., this report)
Prototyping/basic pilots to test new product models
Modelling tools to asses market size, cost-savings, and revenue-gains (only for product itself)
1 Access interoperability
Uncertain advantages and disadvantages of joining interoperable schemes
Unclear level of effort, time, and resources required
Case studies outlining advantages and disadvantages
Long-term strategic planning to help inform decision-making
3 Enable interoperability
Financial resources and personnel (e.g., subject matter experts) required (technological, operational)
Lack of governance and administrative structure
Competing internal priorities, particularly for IT; lengthy timelines may end up detail projects
Long-term commitment from senior leadership to pursue interoperability
Dedicated cross-functional team
Possible financial support from donor agencies
4 Promote interoperability
Financial resources required (marketing)
Lack of a unique brand identity
Lack of clarity around roles and responsibilities
Budget allocation from senior leadership dedicated to promote interoperability
Possible financial support from donor agencies
30 Tanzania
COuLd INTEROPERABILITY BE ACHIEvEd BEfORE PROduCT vIABILITY?
The Case of Peru
Since 2011, the banking association of Peru, ASBAnC, has been working on developing a ‘fully interoperable’ payment
scheme to boost financial inclusion, mainly in response to a perceived threat by the launch of a joint-venture between
MasterCard and Telefonica Peru, the country’s leading mobile operator. With the government promoting regulation
allowing non-banks to issue electronic money in 2012, the banks decided to form a committee under ASBAnC to lead
the design of the scheme.
Although the initiative was primarily spearheaded by the country’s four largest banks – Banco Credito de Peru (BCP),
BBVA, Scotiabank, and Interbank – it was decided that any bank would be eligible to join the scheme. Ericsson, a
technology provider, was chosen to build the platform through a competitive vendor selection process in 2014, and
the design of the product began later that September. A formal company, Pagos Digitales Peruanos, was born in early
2015, and the ‘build’ phase took place for the duration of the year to connect four institutions to the common platform
(through 16 technical integrations; some groups such as microfinance institutions and cooperatives were already
connected through a shared platform).
The product, called BIM, launched in February 2016. The product allows any customer to open a paperless account,
on any mobile network, and with any one of the 34 member banks participating in the consortium. It is backed by
a common brand, pricing structure, and registration process. The firm claims over 120,000 registered users as of
end of May, mainly with BCP, but have not disclosed activity rates or transaction volumes; one stakeholder close to
the process believed that usage rates were still low. Moreover, since customers choose which bank they want to be
associated with, it is not clear if all member banks are seeing activity.
While it is too early to assess the success of the Peru model, it is generally not advisable to create interoperable schemes
before full validation of the product concept. Interoperability tends to take significant time (nearly 5 years in ASBAnC’s
case), financing, and effort among participating members to come together, agree, and build the corresponding
technology and integration points. It is far more efficient to first ensure that end-users are generally receptive to the
core product concept through an actual pilot (rather than market research, which, while useful, is not a substitute for
‘real’ results). From there, the product design can be refined, more users can register and use the service, which in turn
leads to more stakeholders interested in joining the program. This itself will help inform discussions on how best to
design interoperability schemes.
User Insights in Enabling Interoperable Mobile Money Merchant Payments 31
The findings contained in this report indicate that there exists both a compelling user need for merchant payments and
that its interoperability among mobile operators should, and will, eventually occur. In addition to key elements on
product design, such as pricing, product features, and target market segments, a large, more strategic question looms
on how immediately to pursue interoperability. To help guide these decisions, three suggestions are proposed:
1. Refine the business case for merchant payments. As this is still a new area, providers and other stakeholders like IFC may
not have a clear financial understanding of the costs and benefits of pursuing merchant payments. In fact, one mobile operator
admitted that it was unsure of the main cost and revenue drivers associated with the product, and unsure what type of Key
Performance Indicators (KPIs) would be applied to measure success. A robust but simple financial modelling tool could be
developed to help both industry members (banks, MnOs) and market facilitators (such as IFC) quantify the projected gains in
launching merchant payments.
2. Make the user experience seamless. The ease with which individuals interact with their device (the ‘user interface’ – or UI
for short) as well as the overall user experience (Ux) is a main factor to promote adoption of mobile financial services. This is
especially true of merchant payments, given the requirement that both sides (customer and merchant) take off concurrently.
Moreover, as a new product in the market ‘unproven’ in the eyes of users, any experience short of simple can put them from
trying it a second time. Ideally, certain characteristics of the user experience (e.g., menu hierarchy) could be agreed upon
across all mobile operators, so that in the (eventual) interoperable world it is easier for customers to adapt.
3. determine the appropriate acquisition model. When it comes to merchant acquisition options, MnOs need to determine
the trade-off they want to make between risk and costs. While owning the entire merchant acquiring activity allows greater
ability to tailor and control, it also requires significant financial resources and personnel. If it is decided to outsource some
or all of the acquiring value-chain activities, MnO providers also need to consider whether it is more prudent to partner
with established players (such as a banks) or nimbler ones (such as start-ups). Ultimately the best decision will take into
consideration market forces and the provider’s preferences. Lastly, as in the user experience case above, it would be advisable
for MnOs to consider merchant acquisition models that may be more easily adjusted should interoperability among other
operators arise.
LOOkINg AHEAd
Acknowledgments
ABouT ThE AuThor
Amitabh SaxenaManaging Director, Digital Disruptions Amitabh is Managing Director of Digital Disruptions, a boutique consulting firm, and brings 14 years of hands-on experience in electronic payments and product innovation. Previously, as Vice-President for MasterCard’s Emerging Products team, he had overall responsibility for Mobile Money in Latin America, from strategy and business development to product design and implementation. Prior to that, he started and led the Alternative Channels practice area for ACCIOn International, consulting on mobile banking, prepaid cards, and banking agents to its network of banks in 25 countries globally. Amitabh also worked for the GSMA’s Mobile Money team in London on bank-mobile operator partnerships, and for Jamii Bora Bank in nairobi, Kenya. he started his career as a Product Manager in the Product Innovation Center at Capital One, launching over a dozen products for the Fortune 150 bank. he has spoken at several mobile payment conferences over the years and has been quoted in the American Banker, Washington Post, and The Guardian. Amitabh is fluent in English, French, and Spanish and holds an MBA from InSEAD (France/Singapore) and a Bachelor’s of Mechanical Engineering from McGill University from his native Montreal, Canada. he currently teaches Design Thinking at the University of Maryland’s Academy for Innovation and Entrepreneurship, as well as an MBA course on new Product Development at its Smith School of Business.
Please see www.digital-disruptions.com to learn more how we can help.

2016
www.ifc.org/financialinclusionafrica
IFC, a member of the World Bank Group, is the largest global development institution focused on the private sector in emerging markets. Working with 2,000 businesses worldwide, we use our six decades of experience to create opportunity where it’s needed most. In FY16, our long-term investments in developing countries rose to nearly $19 billion, leveraging our capital, expertise and influence to help the private sector end extreme poverty and boost shared prosperity. For more information, visit www.ifc.org