user modeling and churn prediction in over-the-top media
TRANSCRIPT
User Modeling and Churn Prediction inOver-the-top Media Services
Vineeth RakeshInterdigital AI Lab, USA
Ajith Pudiyavitil∗Lowe’s, USA
Jaideep ChandrashekarInterdigital AI Lab, USA
ABSTRACTWe address the problem of customer retention (churn) in applica-tions installed on over the top (OTT) streaming devices. In the firstpart of our work, we analyze various behavioral characteristicsof users that drive application usage. By examining a variety ofstatistical measures, we answer the following questions: (1) how dousers allocate time across various applications?, (2) how consistentlydo users engage with their devices? and (3) how likely are dormantusers liable to becoming active again? In the second part, we leveragethese insights to design interpretable churn prediction models thatlearn the latent characteristics of users by prioritizing the specifica-tions of the users. Specifically, we propose the following models:(1) Attention LSTM (ALSTM), where churn prediction is done usinga single level of attention by weighting on individual time frames(temporal-level attention) and (2) Neural Churn Prediction Model(NCPM), a more comprehensive model that uses two levels of atten-tions, one for measuring the temporality of each feature and anotherto measure the influence across features (feature-level attention).Using a series of experiments, we show that our models providegood churn prediction accuracy with interpretable reasoning. Webelieve that the data analysis, feature engineering and modelingtechniques presented in this work can help organizations betterunderstand the reason behind user churn on OTT devices.Reference Format:Vineeth Rakesh, Ajith Pudiyavitil, and Jaideep Chandrashekar. 2020. UserModeling and Churn Prediction in Over-the-top Media Services. In 3rdWorkshop on Online Recommender Systems and User Modeling (ORSUM 2020),in conjunction with the 14th ACM Conference on Recommender Systems,September 25th, 2020, Virtual Event, Brazil.
1 INTRODUCTIONIn recent years, users have increasingly taken to consuming stream-ing video services via applications (i.e. Netflix, Hulu, Youtube, etc.)on so called over the top (OTT) platforms (i.e. AppleTV, Roku,Amazon FireTV, etc.). Given the very large (and still growing) num-ber of streaming services, there is fierce competition to attractnew customers, while maintaining customer satisfaction. Unfortu-nately, there is significant cost to attracting new users; thus, serviceproviders are very invested in retaining end-users and keeping themengaged with their products. These customer retention efforts fo-cus on providing exclusive and engaging content, personalizedrecommendations and intuitive user interfaces. When such effortsfail, the operators experience customer churn, wherein a subscriber∗This work was done when the author was at Interdigital AI Lab.
ORSUM@ACM RecSys 2020, September 25th, 2020, Virtual Event, BrazilCopyright© 2020 for this paper by its authors. Use permitted under Creative CommonsLicense Attribution 4.0 International (CC BY 4.0).
stops using the service. By examining high level data collected onone such OTT hardware platform, we propose feature engineeringtechniques for modeling user behavior and leverage these featuresto develop application-level churn prediction models. Specifically,given a user u who installs an application a at a given time on theirOTT device, our model predicts whether u will be engaged (or notengaged) with a after a particular time window.
Users may decide to abandon a streaming service for any numberof reasons such as a limited time budget to consume content, anincreasing affinity for a different application or a lack of compellingnew content. Yet another reason may be that the user experiencesmore hardware faults (i.e. reboots, poor wifi, high memory us-age, etc.) when a particular service is being used. In such cases,the user perceives these faults as being caused by the applicationand quits out of frustration. The key observation here is that bothapplication-level and device-level behavior can influence user churn.Consequently, it is critical to model these heterogeneous factorsalong with temporally correlated features reflecting usage of differ-ent applications to accurately predict churn. To achieve this, we firstanalyze a dataset that captures high level events on OTT devicesand examine the signals of application churn. These events could beuser-initiated (i.e. opening or closing an application, restarting thedevice, putting the device to sleep, etc.) or device-specific events(i.e. automatic reboots, wifi drops, software/firmware updates, etc.)With this data, we examine questions such as: (1) how users allocatetime across applications on their OTT device, (2) how often and forhow long users engage with the device (specific applications), and(3) how long do users go dormant, and how likely is it for a dormantuser to become reactive. In the second part of our work, we leveragethese statistical insights to design interpretable models that areeffective in predicting churn across a wide range of scenarios.
The naive approach to building a model that predicts churnwould be to fix an observation time windowT , extract a number offeatures of interest |m | from this window and then deploy a suitableclassification algorithm that predicts whether a subscriber will quita service after a period of timeT . While this is entirely viable, thereare two important drawbacks. First, the data is inherently noisyand high-dimensional; OTT devices send out periodic device-leveland application level summaries (the start time and duration of anapplication session), and events observed on the box. This resultsin a feature space of size T × |m |. Second, there is significant inher-ent temporal correlation in the data; if a user spends a significantamount of time inside an application on successive days, there is astrong signal that he/she will engage with the same application onthe next day. Flattening data over the entire windowT into a singlerepresentation vector will lead to this information being lost. Analternative, more principled approach, is to learn latent attributes
ORSUM@ACM RecSys 2020, September 25th, 2020, Virtual Event, Brazil Vineeth Rakesh, et al.
of the data using time-series models such as recurrent neural net-works (RNN) [3] and use them as features for churn prediction. Apotential issue with this approach is that the compressed latentvector is inefficient at capturing all the necessary information thatleads to churn. Furthermore, it is extremely difficult to interpretthe results of vanilla RNNs.
In this paper, we propose a model that address the drawbacks ofthe more conventional approaches. First, we introduce AttentionLSTM (ALSTM), where we modify the neural machine transla-tion (NMT) model [2] for churn prediction; ALSTM models thelocal attention. Second, we propose Neural Churn Prediction Model(NCPM), which incorporates two levels of attention i.e., local andglobal. ALSTM uses temporal-level attention (local attention) wheredifferent (sub) observation windows contribute different weightstowards predicting churn. For example, in a particular week wemight observe the subscriber slowly starting to watch more andmore content on a new application, and spending less and less timein another in which they were previously engaged (and eventu-ally abandon). Thus, features collected in this week might requirehigher priority when compared to other time frames. NCPM onthe other hand is a more comprehensive model that captures eachfeature using a separate ALSTM. The individual ALSTMs are thencombined with a feature-level attention layer (global attention).Global attentions are much better at prioritizing weights acrossdifferent temporal features. For example, churning could be moreinfluenced by device-level issues such as periodic reboots ratherthan application engagement. Although attention-based RNNs havebeen extensively used in the field of natural language processing[7, 25], they have very rarely been applied to the problem of churnprediction. To our knowledge, the only work that appears to ad-dress this area is [26]; however, the attention mechanism used intheir work is quite different than ours. We summarize the majorcontributions of our work as follows:• Understanding user behavior: Through data engineering andstatistical analysis, we provide several insights that explain thebehavior of users in our OTT dataset.• Predicting Churn: We propose attention-based RNN modelsthat learn the characteristics of users in aweighted low-dimensionallatent space.• State-of-the-art performance: By conducting extensive exper-iments on a real-world dataset, we show that NCPM outperformsall other models over different test cases and achieves an accu-racy of upto 89% and AUC of 92%. Additionally, NCPM interpretsthe reason for churning by emphasizing on features such as inter-arrival time between the apps and consistency in app usage.We begin by introducing our dataset in Section 2 and in Section 3,
wemodel the behavior of OTT customers as observed in this dataset.The churn prediction models ALSTM and NCPM are proposed inSection 4 followed by the results of our experiments in Section 5.Finally, we review related work in Section 6 and conclude our paperin Section 7.
2 DATASETOur dataset consists of high level application session data (starttime and durations) and device level events that spans from Sept2018 to April 2019. The data was collected from a sample of 31k
AndroidTV based OTT devices deployed in homes and operatedby a large provider. Each of these devices comes pre-installed witha set of applications; apart from these, users (u) can downloadothers from a large catalog on the app store. We observed over3.7k distinct applications being used in the dataset. However, somedevices and applications are used very sporadically and accountfor very little data. To remove these, we pre-processed the datato filter out devices that were active for less than 90 days in total,and removed applications that were used on fewer than 15 devicesin our population. This filtering resulted in 14,082 unique users(i.e., OTT devices) 1 and 462 unique apps; this dataset is denotedby D. Note that the churn prediction model builds features overthe lifetime of the application on the device; this starts from thetime the application was installed, to when the user is deemed to haveabandoned it. Unfortunately, for the pre-installed applications suchas Netflix, YouTube and SlingTV there is no install date. One canexclude such apps from the data; however, this leads to removing asignificant number of users. This is because a large proportion ofusers tend to confine themselves to using the pre-installed apps (whichalso happens to be the popular streaming services). Alternatively,having all users in a single bin could lead to some serious bias inour modeling since for default apps, we do not have a clear signalon when it was downloaded. The user might have been using theapp well before the onset of our study. Therefore, besides D, wecreate a separate dataset De that completely excludes the defaultapps, while for (u,a) ∈ D that do not have a start date, we simplytake the first log entry of a by u as a proxy for the actual installdate. The subset De covers 8,223 unique devices using 397 distinctapplications.
Clearly, the earlier a service provider is able to predict churn(of u), the more effectively they can take action and address theunderlying reasons as to why a customer might be departing. Con-sequently, we divide D and De into different days of activities A,where A = {t |t ≤ T ,T ∈ {5, 10, 15, 20}}. For instance, T = 5 meanswe consider a maximum of five days of user activity to predictthe churn. Table 1 shows the characteristics of dataset D and Deacross different activity days. In the upcoming section, we explainthe methodology of determining the churners and non-churners(i.e., columns four and five in Table 1). Here, one can see that as Tincreases, the number of users decrease. This is because the numberof users that continuously use the OTT for say 20 days is far lessthan than those who use for just 5 days.
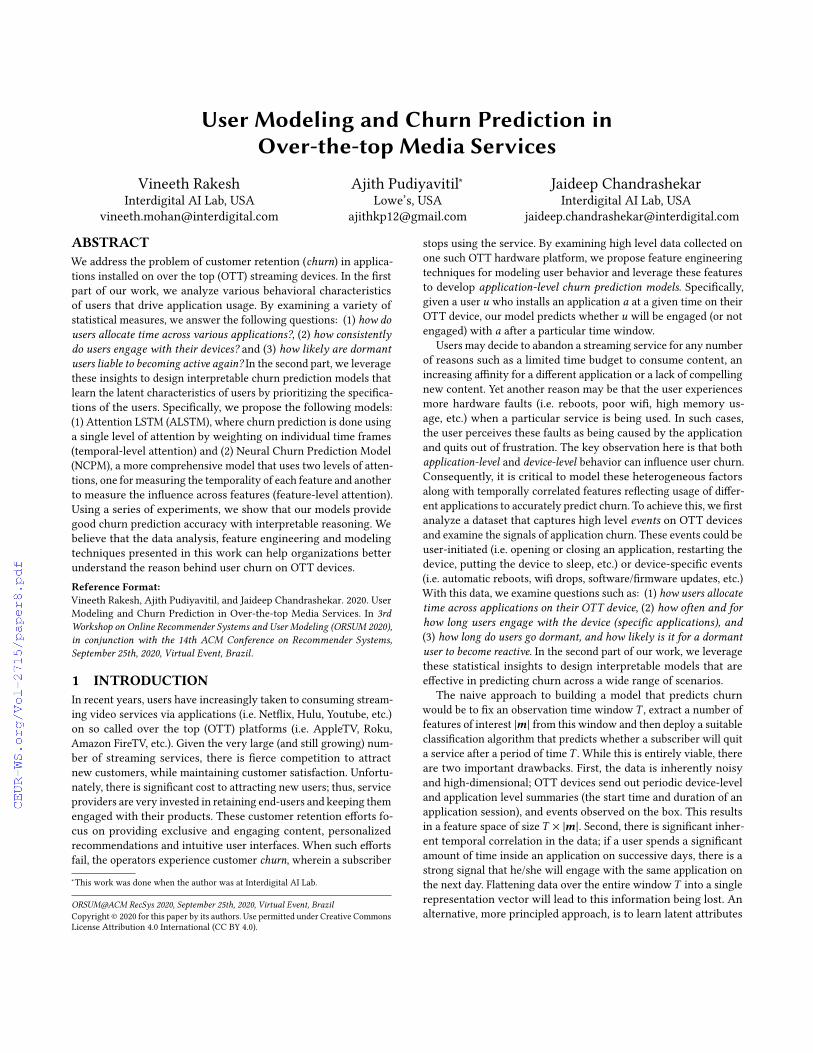
3 ANALYZING USER CHARACTERISTICSApp and Device Usage: Figure 1 (a) shows the ten most popularapps seen in our dataset, based on the number of users that regularlyuse them. Sling Tv, Netflix, Youtube and Google games occupy thetop four spots. Figure 1 (b) plots the distribution of daily time spentinside each of the applications. We find that users spend 3-4 hourson average with the OTT device, with a very small fraction ofusers that spend more than 8 hours. In fig. 1 (c), we break this dailyspend into four different parts of a day, corrsponding to morning(5am-12pm), afternoon (12pm-5pm), evening (5pm-10pm) and night(10pm-5am). Unsurprisingly, we observe that users tend to spendmore time in the evening when compared to other periods of a
1we use the words devices and users interchangeably

User Modeling and Churn Prediction inOver-the-top Media Services ORSUM@ACM RecSys 2020, September 25th, 2020, Virtual Event, Brazil
Dataset D Dataset DeT #Users #Apps #Churns #NonChurns #Users #Apps #Churns #NonChurns5 13082 402 9017 16044 6390 283 8712 942110 7954 347 6339 8596 5500 234 4661 753815 5440 256 4123 5932 4929 194 3088 642320 5009 179 3193 4067 4453 165 2231 5548
Table 1: Statistics of the churn prediction datasets D and De for different range of activity days T . For example, T = 5 impliesfor a given user-app (u,a) tuple, u actively used a upto 5 days before churning.
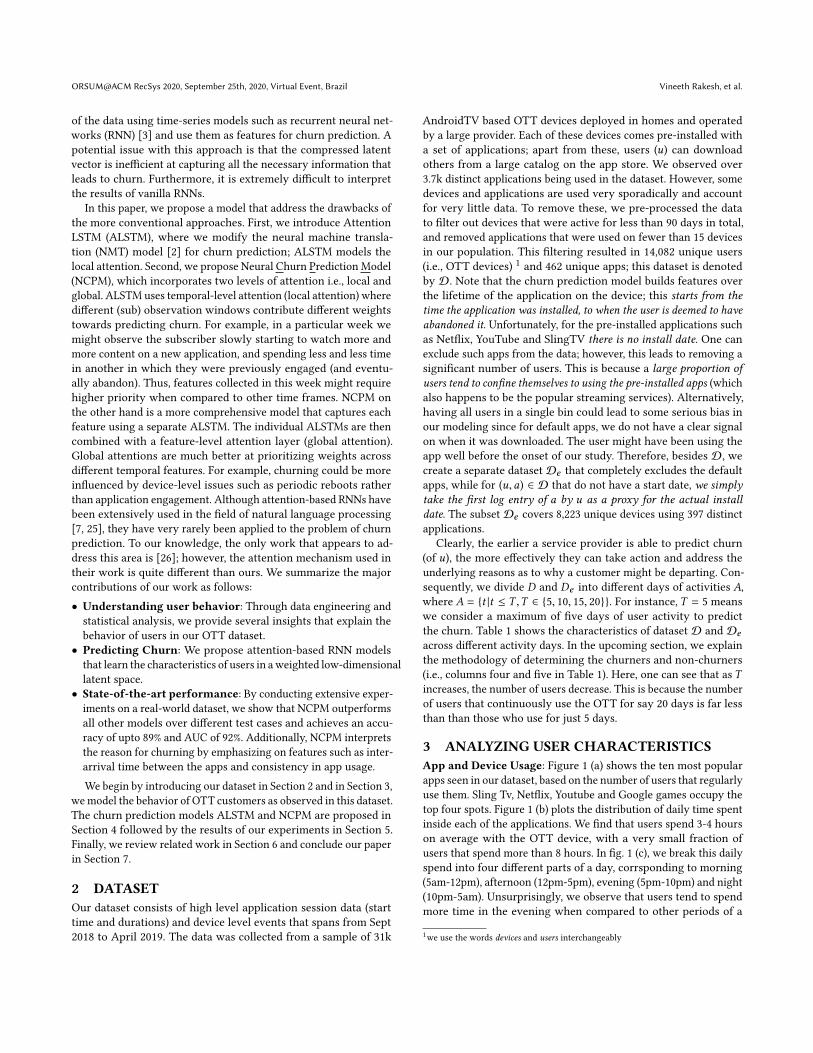
day (median of 2.2 hrs). However, it is not significantly higherthan afternoon, which has a median of 1.8 hrs and morning witha median of 1.4 hrs. Another key statistic of interest is the interarrival time between application sessions. Note that there may notbe an explicit indicator of a user quitting an application. Very often,users just stop using the application that is installed, or deactivatetheir accounts but keep the application installed. Thus, churn mustbe detected implicitly, i.e., by the fact of the application not beingstarted by the user for a sufficiently long time. We calculate thearrival time between successive start times of an application sessionon a device (across all applications) and plot the maximum values,across all the devices, in fig. 1 (d). We observe that users, after anabsence, return to the OTT applications within a median time of6 days (100-200 hours). The 75%-ile value of this distribution isabout 10 days. Later in this section, we leverage this to establish aninactivity threshold when we define churn more precisely.User Engagement Patterns: Here we try to understand how usersspend time on their OTT device. We wish to explore the followingaspects: (a) Are there users who consistently use the box for samenumber of hours every day? (b) Are there dormant users who don’tuse their device for a while, but then reactivate it? (c) Are thereusers that engage with their device, but only intermittently and forbrief periods of time? To answer these, we carry out the followinganalysis. First, for each day that our dataset spans, we compute thecumulative time (in terms of cummulative distribution function -CDF) that the user engaged with the device. Specifically, we com-pute (i, ci ) for each user, where i = 1, 2, .., |D| represents each dayin our dataset, and ci is the total number of hours spent on thedevice upto day i . Next, we carry out a non-linear fit on this datafor each user, recording the learned slope, intercept and standarderror as derived features for each user. Subsequently, we clusterthe derived features using K-means; the number of clusters is de-termined based on the silhouette score [23]. This analysis yieldsfour main behavior patterns that cover the vast majority of users,and are depicted in fig. 2. Each plot is based on the original data ofcumulative device engagement time (x-axis is days elapsed, y-axisis cumulative time spent). These four patterns can be labeled asfollows: (1)mid bloomers (a), these are users who are initially silentand do not use the OTT box heavily, but then suddenly start usingduring the middle phase of their total period. (2) late bloomers (b),these users remain dormant for a longer duration with minimalactivity, but suddenly start using the device towards the end. (3) po-tential churners (c), these are users who are of interest to us. As
explained by the plot, these users start using the device heavily atfirst, but then stop using the box for various reasons. Please notethat since y-axis is the CDF, the flat line here indicates minimal orno activity (also indicated by very low standard deviation, sincethere is no activity). (4) consistent users (d), finally, these are userswho are consistent and regularly use their OTT boxes to watchdifferent shows.Understanding Churning Behavior: Before introducing our pre-diction models, we briefly explain how we label a user (or device)having churned, i.e., left the service. This is fundamentally a difficulttask because there is no explicit signal for this behavior. Furthercomplicating things, (a) some users don’t use the app for a fewdays, but return back after a brief period of inactivity, and (b) someusers simply download the app once (or spend a brief amount oftime in it) and never use it again. Figure 3 depics, at a high level,all the information for a user (u) application (a). The dotted lines ateither end capture the time data was collected and each of the greenvertical lines in the middle indicate the start of application sessions(a1 is the first session, an is the last). Here, we see that the applica-tion was downloaded after the start of the data collection and usedseveral times, the last instance is at t3. Somewhat infrequently, wesee the device itself disappears from the dataset; we consider this asignal that the user has disconnected the device and is no longerusing it. In this scenario, we capture this event having occured at t4.With this depiction, we can now define churn in very specific termsby addressing the two challenges previously discussed. First, werequire that the application not be used for a period of time after thelast use. Following the example in fig. 3, we impose the condition∆2 ≥ T3q . Here T3q – an inactivity threshold – is the 3rd quartileof the distribution in fig. 1 (d) and turns out to be 10 days. Second,we require a minimum number of sessions to be recorded for anapplication and user. Specifically, u should have engaged with a atleast K times, i.e., n ≥ K and we set K = 3. Figure 4 illustrates thecharacteristics of devices that are exclusively labeled as churn. Wesee that the median inter-arrival times for the top 5 apps is around30 days (Figure 4 (b)), which is significantly higher than the genericinter-arrival characteristics shown in Figure 1 (d). In figure 4 (c)we notice that users who download more apps tend to have higherchurning rate, we obtained a Pearson correlation coefficient of 0.67.It is also interesting to observe that as the churn increases, userstend to switch between apps more frequently, where the app switchis indicated by the session feature (y-axis).
ORSUM@ACM RecSys 2020, September 25th, 2020, Virtual Event, Brazil Vineeth Rakesh, et al.
(a) (b)
(c) (d)
Figure 1: Generic characteristics of users in D (a) shows the top 10 most frequently used apps, (b) majority of the users spend2-6hrs per day, (c) users tend to spend more time in the evening and (d) majority of the users tend to return back to their OTTdevice within a maximum of 8-9 days (≈ 200 hrs)
Figure 2: The four types of users captured by our clustering framework. Clockwise from top left, (a) mid-bloomers, (b) late-bloomers, (c) potential-churners and (d) consistent users. The error bars show the standard deviation based on usage.
4 PREDICTING CHURNGiven a user u and an app a, our objective is to predict if u willcontinue or stop using a. We realize each user-app entity as a tuple(X ,Mx ,Y ) where X = {x1, ...,xt } is a stream of events (or logs)that spans a time t ∈ T . Each event x comprises of M features,and Y = {y1, ...,yt } are the binary labels that indicate churn (ornon-churn) at t . When designing our churn prediction model wehad two main objectives. First, since our data is highly temporal, itis important to learn the latent characteristics of churners (and non-churners) in such a way that it embeds the temporality of events.
Second, not only should we predict the churn with good accuracy,but also produce highly interpretable results. In other words, weshould reason out as to why a user is churning. To achieve this, wepropose the following models: (1) attention LSTM (ALSTM), whichis a simple modification of the neural machine translation (NMT)model [2] and (2) neural churn prediction model (NCPM): a morecomprehensive model that incorporates temporal-level attention(or local attention) and feature-level attention (or global attention).Both the models are based on recurrent neural network (RNNs)that have shown to be effective in modeling time-series data [5, 8].RNNs take a series of temporally dependent inputs and learn their

User Modeling and Churn Prediction inOver-the-top Media Services ORSUM@ACM RecSys 2020, September 25th, 2020, Virtual Event, Brazil
Figure 3: High level summary of user u interacting with application a
(a) (b)
(c) (d)
Figure 4: Characteristics of churning OTT devices (a) Most frequently churned applications for the dataset De (b) the medianinter-arrival is about 25-30 days for top-5 churning apps, (c) users tend to churn more when they download more apps and (d)users who churn for more apps tend to switch between apps more frequently.
latent representation (or hidden state vector) using the followingexpression:
ht = f (ht−1,xt ) (1)
where ht is the hidden layer at time t and f is some non linearfunction. For our application, we model f using long short-termmemory network (LSTM) [13]. LSTMhas four states that are definedas follows:
it = σ (Wi · [ht−1;xt ] + bi ) (2)ft = σ (Wf · [ht−1;xt ] + bf )ct = ft × ct−1 + it × tanh(Wc · [ht−1;xt ] + bc )ot = σ (Wo · [ht−1,xt ] + bo )ht = ot × tanh(ct )
where t is the time step (i.e, days) , ht is the hidden state at t , ctis the cell state at t , xt is the hidden state of the previous layer attime t , it , ft , ot are the input, forget and out gates, respectively.
Attention LSTM (ALSTM): Obviously one can predict churn bysimply providing the input X to a vanilla LSTM, get the latentvectorsh from the final layer, and use them as features for prediction.A potential issue with this approach is that the compressed (orlow dimensional) latent vector h is inefficient in capturing all thenecessary information that attributes to churn. As explained inSection 1, in a particular week we might observe the subscriberslowly starting to navigate towards a new application and spend lessand less time in one that they were previously engaged with (andeventually abandon). So, it is important to give high priority to thesetime windows when compared to other weeks. Modeling churnusing vanilla LSTM networks fails to prioritize such key events.Inspired by recent developments in neural machine translation(NMT) [2], we incorporate attentions into LSTM to overcome thisissue. Since our application is very different from natural languageprocessing, we introduce two modifications over NMT. First, wereplace the decoder part with a single layer neural network (NN)with sigmoid activation for churn prediction and second, we change

ORSUM@ACM RecSys 2020, September 25th, 2020, Virtual Event, Brazil Vineeth Rakesh, et al.
Figure 5: The end-to-end architecture of the proposed models (a) ALSTM that uses attentions on a single LSTM network tomodel churn (b) shows NCPM that uses separate LSTM networks for modeling individual features and predicts the churnusing weighted attentions.
the attention mechanism to suit our problem. The proposed ALSTMmodel is shown in Figure 5 (a). Here, the attention block A outputsa vector of weights α that emphasizes the importance of the latentvector h for a given time frame t . The weighted latent vector p isdefined as follows:
p =T∑t=1
αtht (3)
where the weight α j for a time instance t is defined by
α j =exp (sj )∑Tt=1 exp (st )
(4)
sj =K∑k=1
htk ·Wtk j
Neural churn prediction model (NCPM): One drawback of AL-STM is that it is unable to prioritize across features. For example,churning could be more influenced by the consistency of users (seeFigure 2), while the number of downloads might have little impor-tance. To overcome this problem, we incorporate both temporal-level attention and feature-level attention. As depicted in Figure5, instead of treating the features as a single vector, we decouplethe features and model them using individual ALSTMs. Similarto ALSTM, the attention block pm of an a featurem captures theinfluence (or weight) of the latent features from different slices oftime. On the other hand, the feature-level attention is capture bythe block B, which is defined by the following expressions:
д =M∑
m=1βmpm (5)
In the above expression, β denotes the individual attention weightsthat is defined as follows:
βm =exp (cm )∑M
m=1 exp (cm )
(6)
cmj =Z∑i=1
ziUi j (7)
where z = p1 ⊕ {pi }m2 is the concatenation (indicated by ⊕) of thefeature-level latent vectors . Finally, to predict the churn, a linearprojection with a sigmoid function is connected to the output ofthe last layer to produce user churn prediction as follows:
y = σ (Wд · д + bд ) (8)
The loss for both ALSTM and NCPM is computed using binarycross entropy, that is defined as follows:
L =∑i−yi loд(yi ) − (1 − yi )loд(1 − yi ) (9)
5 EXPERIMENTSObviously, from Table 1, one can notice that our dataset is biasedtowards negative samples (i.e., #non-churns). Therefore, to create abalanced dataset, for every positive data point (i.e, churns) for anapp a, we randomly sample a corresponding negative data point.We test our models by varying the number of days in the trainingsample (explained in Section 2). This helps us to see how quicklycan our models predict the churn. For all our experiments, we use10 fold cross validation, where eight folds are used for training, onefor validation, and one for testing. The deep learning models areimplemented using Keras with Tensorflow as the back-end.
5.1 BaselinesWe compare the performance of the proposed ALSTM and NCPMwith three baseline methods. Unlike the proposed models (i.e., AL-STM and NCPM) the following baselines do not capture the tem-porality in data. Therefore, the inputs to these model are flattenedvectors across the time frames.

User Modeling and Churn Prediction inOver-the-top Media Services ORSUM@ACM RecSys 2020, September 25th, 2020, Virtual Event, Brazil
Logistic Regression: the classic model for binary classificationproblem. Albeit simplistic, it helps us to understand if a lineardecision boundary is sufficient to capture the churners and thenon-churners. We use L2 norm as the regularizer and StochasticAverage Gradient (SAG) as the solver.Multi-layer Perceptron (MLP): We consider a simple two layerneural network and a dropout layer to avoid overfitting. A linearprojection with a sigmoid function is connected to the output ofthe last layer to produce user churn. Similar to logistic regression,MLP does not capture the temporal dependencies between the data.The number of neurons are set to 80 for each intermediate layer.Random Forest (RF): Despite the rapid advancements in the fieldof deep learning, ensemble techniques such as RF [4] remain highlycompetitive in producing excellent results on data with severalmodalities. In our experiments, the number of decision trees are setas 50 and the maximum depth as 10.
5.2 ResultsClassification accuracy: Tables 2-3 shows that NCPM outper-forms all other models for both datasets De and D, achieving anaccuracy of upto 92%. As we increase the number of days the accu-racy increases for all models (except logistic regression). Here, CA-5implies the classification accuracy with just 5 days of data, whileCA-20 implies 20 days of data. We can also see that the proposedALSTM is not as good as NCPM which proves the following: (1) itis important to learn the latent attributes of each individual featuresseparately and (2) incorporating both global and local attentionis necessary. That being said, ALSTM clearly outperforms MLP,which emphasizes the necessity of learning the temporal actions ofOTT users. The worst performing model is the logistic regression,which is just slightly better than a random selection. This illustratesthe difficulty of our churn prediction task. The performance of RF isvery close to that of ALSTM, which indicates that ensemble modelsare still a strong candidate for our problem.
In general, the performance of models over non-continuous datais much better than its continuous counterpart, this can be explainedusing the following example. let us say that u uses an app forsix days before churning and we have the following data for u{m1,m4,m6,m7,m8,m10}, wherem is some feature and the suffixindicates the day. Our objective is to predict the outcome on sixthday, using the first five days. Since the user does not use the OTT boxfor days two, three, and five, the continuous data that is fed to ourmodels (i.e., both NCPM and ALSTM) is essentially a sparse vector{m1, 0, 0,m4, 0}, which has several missing values. On the contrary,for non-continuous dataset, we will have the actual usage valuesfor five days. This obviously means that the model gets to trainwith more observed data points, which leads to better predictionaccuracy. Another interesting observation is that the performanceof all models (except logistic regression) is noticeably better on theall-apps dataset. One key reason for this outcome is the popularityof the default apps. Apps such as Sling TV, Netflix and Youtubeare significantly popular than other non-default apps. Therefore,the models are able to effectively learn the churn patterns for suchapps more effectively.AUC and ROC characteristics: Figures 6 and 7 compare the ROCcharacteristics of the proposed models with other baselines. The
corresponding AUC values are listed in Table 4, due to space con-straints, only the non-default case is furnished. Similar to the ac-curacy scores, for most scenarios, NCPM remains dominant overother models. We also notice that RF tends to perform better thanNCPM and ALSTM when the temporal length of data is low (i.e.,with just five days). However, as we incorporate more days fortraining, there is a clear increase in the performance of our models.The outcome for dataset D is much different than De where weare able to achieve an AUC of almost 89% with just five days ofdata; additionally, ALSTM seems to perform very similar to NCPM.Interpreting the churn prediction: One of the key strengths ofour model is interpretability. As explained in Section 1, ALSTMprovides single level of interpretability, which indicates which daysare important when predicting churn. NCPM on the other hand, hastwo levels; besides telling the important days, it also tells us whichfeatures are important. We present the interpretability scores asheatmaps in Figure 8. Due to the lack of space, we only furnish theresults of non-continuous dataset. Heat maps (a)-(d) explains thatthe influence of features are not uniform across apps; for instance,when we have less days for prediction, the churn is influencedby two main attributes namely, the number of downloads and thecluster types (Figures 8 (a) and (c)). As we incorporate more datafor training (i.e., the number of days) the attention tends to getmore focused towards a few key features. For non-default apps,there seems to be more attention on the inter-arrival time, whilefor all-apps the influence seems to be more towards the numberof reboots. It could be possible that these apps experience a highernumber of app crashes, which could lead to user rebooting thedevice. For non-default apps, Hulu, Plot Tv and Kodi is heavilyinfluenced by the cluster id feature that we engineered in Section 3.When it comes to temporal attention (Figures 8 (e)-(h)), for datasetD, the influence is mainly concentrated on a few selective days,i.e., day 4 for non-continuous case, and day 2 for continuous case.Contrary to this, for De this influence is spread across almost alldays.
In Section 3 we explained that the engagement pattern of userscould have a strong impact on churn. To show this effect, for eachuser, we get the final attention score from individual RNNs ofNCPM and plot the outcome in Figure 9 (a). Here, we can seethat consistent users are the highest indicators of non-churn, whilepotential churners are the highest indicators of churn. Interestingly,mid bloomers seem to have higher attention over late bloomerswhen it comes to predicting non-churners, while the opposite istrue for churners. Figure 9 (b) provides a more deeper look into thisoutcome by emphasizing on the importance of temporal progressionon the user types. Unsurprisingly, during the initial phase (elapsedduration of 10-20%) almost all types have less attention weights.This is because, during the early phase, we do not have enoughdata about the user type. As the time progresses, around 20-50%of the elapsed duration, we see that potential churners have thestrongest impact on the outcome followed by consistent users andlate bloomers. Around 50-80% , the impact of potential churnersdrastically reduces, while mid and late bloomers increase. At thefinal stage (i.e., 80-100%) almost all user types have less importance(or attention). This is because, during the last phase, there is moreavailable data in the form of other features such as number of

ORSUM@ACM RecSys 2020, September 25th, 2020, Virtual Event, Brazil Vineeth Rakesh, et al.
(a)
Model CA-5 CA-10 CA-15 CA-20Logistic 0.56 0.55 0.54 0.54RF 0.65 0.73 0.79 0.80MLP 0.6 0.66 0.72 0.78ALSTM 0.65 0.77 0.83 0.86NCPM 0.67 0.79 0.84 0.88
(b)
Model CA-5 CA-10 CA-15 CA-20Logistic 0.56 0.55 0.54 0.54RF 0.66 0.70 0.73 0.75MLP 0.58 0.63 0.70 0.74ALSTM 0.60 0.67 0.74 0.79NCPM 0.62 0.70 0.76 0.81
Table 2: Classification accuracy (CA) for (a) non-default and non-continuous data across 5-20 days and (b) non-default andcontinuous data across 5-20 days.
(a)
Model CA-5 CA-10 CA-15 CA-20Logistic 0.56 0.55 0.54 0.54RF 0.73 0.78 0.85 0.89MLP 0.7 0.72 0.73 0.74ALSTM 0.78 0.83 0.87 0.91NCPM 0.78 0.84 0.89 0.92
(b)
Model CA-5 CA-10 CA-15 CA-20Logistic 0.56 0.55 0.54 0.54RF 0.72 0.78 0.78 0.83MLP 0.62 0.70 0.71 0.74ALSTM 0.74 0.79 0.83 0.86NCPM 0.76 0.82 0.84 0.89
Table 3: Classification accuracy (CA) for (a) all apps and non-continuous data across 5-20 days and (b) all apps and continuousdata across 5-20 days.
(a) 5 days (b) 10 days (c) 15 days (d) 20 days
(e) 5 days (f) 10 days (g) 15 days (h) 20 days
Figure 6: Receiver operating characteristic curve (ROC) of the proposed ALSTM and NCPMmodel along for non-default apps.Curves (a)-(d) represent the ROC for non-continuous dataset and (e)-(h) represents the continuous dataset.
downloads and inter-arrival time between apps. Consequentially,the model is able to rely on better indicators at the later stage.
6 RELATEDWORKThe problem tackled in this paper is related to the following topics:(1) churn prediction (2) user behavior modeling and (3) interpretableneural networks. We now detail some existing research that corre-spond to these topics.Churn Prediction: User retention (or churn) has been extensivelystudied in the field of social computing and human computer inter-action (HCI) [9, 14, 27]. However, developing predictive models for
churn is still at infancy. Au et. al. [1] adopt a rule based learningtechnique for early churn prediction. In [29], the authors tacklethe problem of churn prediction in mobile apps. They find thatapplication performance such as energy consumption and latencyhave a significant impact on retention. [16] use a social influencebased approach for churn prediction. Recently, [26] develop an in-terpretable framework that constraints the objective of RNN withthe outcome of K-means clustering to predict the retention of usersin Snap Chat.Modeling user behavior: There are numerous research on be-havior modeling [10, 15, 21]. For example, [6] predict user intents

User Modeling and Churn Prediction inOver-the-top Media Services ORSUM@ACM RecSys 2020, September 25th, 2020, Virtual Event, Brazil
(a)
Model AUC-5 AUC-10 AUC-15 AUC-20Logistic 0.56 0.55 0.55 0.55
RF 0.71 0.81 0.87 0.89MLP 0.65 0.72 0.79 0.84
ALSTM 0.66 0.76 0.85 0.89NCPM 0.72 0.85 0.9 0.91
(b)
Model AUC-5 AUC-10 AUC-15 AUC-20Logistic 0.55 0.53 0.53 0.54
RF 0.71 0.77 0.83 0.86MLP 0.62 0.69 0.77 0.83
ALSTM 0.6 0.66 0.71 0.78NCPM 0.66 0.76 0.84 0.88
Table 4: Area under theROC curve (AUC) for (a) non-default apps andnon-continuous data across 5-20 days and (b) non-defaultapps and continuous data across 5-20 days.
(a) 5 days (b) 10 days (c) 15 days (d) 20 days
(e) 5 days (f) 10 days (g) 15 days (h) 20 days
Figure 7: Receiver operating characteristic curve (ROC) of the proposed ALSTM and NCPM model along for all apps. Curves(a)-(d) represent the ROC for non-continuous dataset and (e)-(h) represents the continuous dataset.
(a) De , 10 days (b) De , 20 days (c) D, 10 days (d) D, 20 days
(e) De , 10 days (f) D, 20 days (g) De , 10 days (h) D, 20 days
Figure 8: The feature-level (a-d) and the temporal-level (e-h) influences on churn prediction for non-continuous dataset. Thegradient of colors denote the proabability scores, where red denotes the highest weight and green denotes the lowest influence.
by leveraging the activity logs in Pinterest. [12] predict the like-lihood of a successful search in web search queries. They showthat user behavior are more predictive of goal success than thoseusing document relevance.[22] model the behavior of users in the
Kickstarter crowdfunding domain using a heterogeneous combina-tion of social communities, popularity of projects and the impactof reward categories. Studies such as [11, 24] and [21] model userbehavior from sequencial actions such as click streams and social

ORSUM@ACM RecSys 2020, September 25th, 2020, Virtual Event, Brazil Vineeth Rakesh, et al.
(a) (b)
Figure 9: The attention weights of mid bloomers (MB), late bloomers (LB), potential churners (PC), and consistent users (CU):(a) indicates the overall attention-scores during the final phase of prediction and (b) indicates the attention scores at differentstages of temporal progression.
network activities. [24] use a combination of Mahalanobis distance(for detecting outlines) and Markov Chains to model sessions inclick streams, while [21] use a temporal LDA based approach fortour recommendation in Foursquare.Interpretable SequenceModeling: RNNs have become the state-of-the-art technique for sequential modeling [5, 13]. Albeit a plethoraof research in the NLP domain [2, 19], extending interpretable RNNsfor other real world applications is still an emerging field of research.In a recent work, [18] predict the engagement of users in the SnapChat app by capturing the in-app action transition patterns as atemporally evolving action graph. [17] develop an interpretableLSTM to learn multi-level graph structures in a progressive andstochastic manner. [20] propose a dual stage attention model formedical diagnostics such as heart failure prediction. Zhou et. al.[28] propose an attention-based RNN that predicts the purchaseprobability of users for targeted ads. Albeit having a similar NNarchitecture as ours, their problem is quite different than churnprediction. Additionally, they modeling of local and global atten-tion is quite different than ours. To the best of our knowledge, theonly research that closely resembles our work is the churn predic-tion model proposed by Yang et. al. [26]. However, the attentionmechanism used in their work is quite different than ours.
7 CONCLUSIONIn this paper we proposed interpretable recurrent neural networkbased models for prediction churn in over the top media (OTT)devices. In the first part of the paper, we analyzed the behavioralcharacteristics of users and found that they can be categorized intofour main types: mid bloomer, late bloomers, potential churnersand consistent users. In the second part, we introduced two modelsfor churn prediction, namely Attention LSTM (ALSTM) and NeuralChurn Prediction Model (NCPM). In ALSTM, the prediction ofchurn was done by weighting on individual time frames (temporal-level attention) and (2) NCPM, we used two levels of attentionsnamely, feature-level and temporal-level. We showed that NCPMoutperforms all other models over a wide range of test cases andachieves an accuracy of upto 89% and AUC of 92%.
REFERENCES[1] Wai-Ho Au, Keith CC Chan, and Xin Yao. 2003. A novel evolutionary data mining
algorithmwith applications to churn prediction. IEEE transactions on evolutionarycomputation 7, 6 (2003), 532–545.
[2] Dzmitry Bahdanau, Kyunghyun Cho, and Yoshua Bengio. 2014. Neural ma-chine translation by jointly learning to align and translate. arXiv preprintarXiv:1409.0473 (2014).
[3] Yoshua Bengio, Patrice Simard, Paolo Frasconi, et al. 1994. Learning long-termdependencies with gradient descent is difficult. IEEE transactions on neuralnetworks 5, 2 (1994), 157–166.
[4] Leo Breiman. 2001. Random forests. Machine learning 45, 1 (2001), 5–32.[5] Zhengping Che, Sanjay Purushotham, Kyunghyun Cho, David Sontag, and Yan
Liu. 2018. Recurrent neural networks for multivariate time series with missingvalues. Scientific reports 8, 1 (2018), 6085.
[6] Justin Cheng, Caroline Lo, and Jure Leskovec. 2017. Predicting intent usingactivity logs: How goal specificity and temporal range affect user behavior. InProceedings of the 26th International Conference on World Wide Web Companion.International World Wide Web Conferences Steering Committee, 593–601.
[7] Kyunghyun Cho, Bart Van Merriënboer, Caglar Gulcehre, Dzmitry Bahdanau,Fethi Bougares, Holger Schwenk, and Yoshua Bengio. 2014. Learning phraserepresentations using RNN encoder-decoder for statistical machine translation.arXiv preprint arXiv:1406.1078 (2014).
[8] Edward Choi, Andy Schuetz, Walter F Stewart, and Jimeng Sun. 2016. Usingrecurrent neural networkmodels for early detection of heart failure onset. Journalof the American Medical Informatics Association 24, 2 (2016), 361–370.
[9] Giovanni Luca Ciampaglia and Dario Taraborelli. 2015. MoodBar: Increasing newuser retention in Wikipedia through lightweight socialization. In Proceedingsof the 18th ACM Conference on Computer Supported Cooperative Work & SocialComputing. ACM, 734–742.
[10] Gideon Dror, Dan Pelleg, Oleg Rokhlenko, and Idan Szpektor. 2012. Churnprediction in new users of Yahoo! answers. In Proceedings of the 21st InternationalConference on World Wide Web. ACM, 829–834.
[11] Şule Gündüz and M Tamer Özsu. 2003. A web page prediction model based onclick-stream tree representation of user behavior. In Proceedings of the ninth ACMSIGKDD international conference on Knowledge discovery and data mining. ACM,535–540.
[12] Ahmed Hassan, Rosie Jones, and Kristina Lisa Klinkner. 2010. Beyond DCG: userbehavior as a predictor of a successful search. In Proceedings of the third ACMinternational conference on Web search and data mining. ACM, 221–230.
[13] Sepp Hochreiter and Jürgen Schmidhuber. 1997. Long short-termmemory. Neuralcomputation 9, 8 (1997), 1735–1780.
[14] Selim Ickin, Katarzyna Wac, Markus Fiedler, Lucjan Janowski, Jin-Hyuk Hong,and Anind K Dey. 2012. Factors influencing quality of experience of commonlyused mobile applications. IEEE Communications Magazine 50, 4 (2012), 48–56.
[15] Marcel Karnstedt, Matthew Rowe, Jeffrey Chan, Harith Alani, and Conor Hayes.2011. The effect of user features on churn in social networks. In Proceedings ofthe 3rd International Web Science Conference. ACM, 23.
[16] Jaya Kawale, Aditya Pal, and Jaideep Srivastava. 2009. Churn prediction inMMORPGs: A social influence based approach. In 2009 International Conferenceon Computational Science and Engineering, Vol. 4. IEEE, 423–428.
[17] Xiaodan Liang, Liang Lin, Xiaohui Shen, Jiashi Feng, Shuicheng Yan, and Eric PXing. 2017. Interpretable structure-evolving LSTM. In Proceedings of the IEEEConference on Computer Vision and Pattern Recognition. 1010–1019.

User Modeling and Churn Prediction inOver-the-top Media Services ORSUM@ACM RecSys 2020, September 25th, 2020, Virtual Event, Brazil
[18] Yozen Liu, Xiaolin Shi, Lucas Pierce, and Xiang Ren. 2019. Characterizingand Forecasting User Engagement with In-app Action Graph: A Case Studyof Snapchat. arXiv preprint arXiv:1906.00355 (2019).
[19] Tomáš Mikolov, Martin Karafiát, Lukáš Burget, Jan Černocky, and Sanjeev Khu-danpur. 2010. Recurrent neural network based language model. In Eleventhannual conference of the international speech communication association.
[20] Yao Qin, Dongjin Song, Haifeng Chen, Wei Cheng, Guofei Jiang, and GarrisonCottrell. 2017. A dual-stage attention-based recurrent neural network for timeseries prediction. arXiv preprint arXiv:1704.02971 (2017).
[21] Vineeth Rakesh, Niranjan Jadhav, Alexander Kotov, and Chandan K Reddy. 2017.Probabilistic social sequential model for tour recommendation. In Proceedings ofthe Tenth ACM International Conference on Web Search and Data Mining. ACM,631–640.
[22] Vineeth Rakesh, Wang-Chien Lee, and Chandan K Reddy. 2016. Probabilisticgroup recommendation model for crowdfunding domains. In Proceedings of theNinth ACM International Conference on Web Search and Data Mining. ACM, 257–266.
[23] Peter J Rousseeuw. 1987. Silhouettes: a graphical aid to the interpretation andvalidation of cluster analysis. Journal of computational and applied mathematics20 (1987), 53–65.
[24] Narayanan Sadagopan and Jie Li. 2008. Characterizing typical and atypical usersessions in clickstreams. In Proceedings of the 17th international conference onWorld Wide Web. ACM, 885–894.
[25] Ilya Sutskever, Oriol Vinyals, and Quoc V Le. 2014. Sequence to sequence learningwith neural networks. In Advances in neural information processing systems. 3104–3112.
[26] Carl Yang, Xiaolin Shi, Luo Jie, and Jiawei Han. 2018. I Know You’ll Be Back:Interpretable New User Clustering and Churn Prediction on a Mobile SocialApplication. In Proceedings of the 24th ACM SIGKDD International Conference onKnowledge Discovery & Data Mining. ACM, 914–922.
[27] Igor Zakhlebin, Em Horvát, et al. 2019. Investor Retention in Equity Crowdfund-ing. In Proceedings of the 10th ACM Conference on Web Science. ACM, 343–351.
[28] Yichao Zhou, Shaunak Mishra, Jelena Gligorijevic, Tarun Bhatia, and NarayanBhamidipati. 2019. Understanding Consumer Journey using Attention basedRecurrent Neural Networks. In Proceedings of the 25th ACM SIGKDD InternationalConference on Knowledge Discovery & Data Mining. ACM, 3102–3111.
[29] Agustin Zuniga, Huber Flores, Eemil Lagerspetz, Petteri Nurmi, Sasu Tarkoma,Pan Hui, and Jukka Manner. 2019. Tortoise or Hare? Quantifying the Effects ofPerformance on Mobile App Retention. In The World Wide Web Conference. ACM,2517–2528.