using 3d spatial visualisation to interpret the coverage
TRANSCRIPT
heritage
Article
Using 3D Spatial Visualisation to Interpret theCoverage of Anti-Aircraft Batteries on a World WarII Battlefield
Dirk H.R. Spennemann 1,*,† and Craig Poynter 2,†
1 Institute for Land, Water and Society, Charles Sturt University, P.O. Box 789, Albury, NSW 2640, Australia2 Spatial Analysis Network, Charles Sturt University, Locked Bag 588, Wagga Wagga, NSW 2678, Australia;
[email protected]* Correspondence: [email protected]† These authors contributed equally to this work.
Received: 30 May 2019; Accepted: 20 August 2019; Published: 26 August 2019�����������������
Abstract: Heritage Building Information Modeling (HBIM) focuses on the documentation andvisualization of heritage properties which are confined in their permanent terrestrial space. This paperextended the concept of Heritage Building Information Modeling to the airspace above the sites.It presented a methodology for the 3D spatial visualisation of the aerial space controlled by anti-aircraft(AA) guns, taking into account the masking effects of the underlying terrain and the technologicalcapabilities of the guns (rate of fire, projectile weight, etc.). The tool permits a nuanced analysis ofthe interplay between attacking aircraft and the siting of anti-aircraft guns and thus, allows for theanalysis of the cultural landscape of World War II-era battle fields, which has to take into accountthe influence of aerial warfare. The applicability was illustrated by the case example of the JapaneseWWII base on Kiska (Aleutian Islands).
Keywords: heritage management; spatial modelling; 3D visualization; battlefield studies
1. Introduction
Technological advances in digital recording techniques combined with sophisticated visualizationtechniques allow for complex Heritage Building Information Modeling (HBIM). HBIM focusses on thedigital documentation and visualization of heritage properties, allowing practitioners to documentextant structures [1] to visualize interior architectural elements [2] and identify structural commonalitiesbetween different buildings [3], to visualize past known states of an extant structure [4,5], to visualizeno longer extant structures and sites [6], to run structural simulations [7], to plan for conservationactions [8,9], including recovery from natural disasters [10–12], and to facilitate virtual tours of sites [13].Consequently, HBIM has proven to be a powerful tool for cultural heritage managers.
Common to all approaches is that the site under consideration is confined in and constrained byits permanent terrestrial space. This paper extended the concept of Heritage Building InformationModeling to the airspace above the documented sites. The aim of this paper was to present amethodology for the 3D spatial visualization of the aerial space controlled by anti-aircraft (AA) guns.This is aerial space, in effect an ephemeral site, which is created when the guns are fired, but isotherwise non-existent.
This visualization was required in a hind-casting analysis of decisions made by a battlefieldcommander during World War II. The existing models, representing the AA fire as simple domes, weretoo inaccurate, as they did not take into account the masking effects of the underlying terrain, nor didthey consider the technological capabilities of the guns (rate of fire, projectile weight, etc.). The matteris further complicated by the deep structuring of AA defenses with guns of different calibers.
Heritage 2019, 2, 2457–2479; doi:10.3390/heritage2030151 www.mdpi.com/journal/heritage
Heritage 2019, 2 2458
Rather than building a task-specific application for just this project, the approach taken here was todraw on a widely available commercial program, Esri ArcGIS 10.0, and to develop a methodology thatallowed the modelling of a range of spatial patterns of gun positioning. As the performance data of, inthis case, Japanese AA weapons are standardized, this methodology now permits the examinationother battle fields in a similar fashion.
2. The Problem
A recent assessment of the cultural landscape of the World War II battlefield of Kiska (AleutianIslands, Alaska) examined the extent to which the extant heritage items and sites represented thevarious phases of the Battle for Kiska and made recommendations on how the cultural landscapeshould be managed [14]. Prior fieldwork on Kiska had shown the presence of a wealth of World War IImaterial culture and landscape features, all in an excellent state of preservation [15,16].
In the historic preservation setting, the analysis of a historic battlefield requires hindcasting abattle commander’s view of the battlefield in the hopes of being able to reconcile the physical remainsencountered on the actual battlefield with the historic accounts of the battle. Geographical featureswhich represent obstacles or allow for fields of fire and concealment of approach or withdrawal,etc., must be examined in the light of the military doctrine of the day, as well as in the light of thethen-available technology. In an ideal world, this approach would allow (a) a better interpretation ofthe battlefield to an audience; and (b) the identification of aspects of the battlefield that may not haveseen the level of management attention they deserve.
These approaches have been successfully implemented in Geographical Information Systems(GIS) to analyze historic battlefields and manifestation in the cultural landscape they created and inwhich they are embedded [17–20].
However, all battles analyzed to date were terrestrial battles only. All the battles of the War ofIndependence, the Civil War, and the Indian Wars were land warfare, pure and simple, on occasionaugmented by naval action bombarding shore installations.
The battle for Kiska is a situation in which an opposing force held an island, but where no actualperson-to-person ground combat occurred. As all enemy contact occurred through aerial warfare,some adjustments to the methodology were required. Thus, 3D spatial modeling was drawn on toprovide solutions.
3. Background of Kiska and Its WWII History
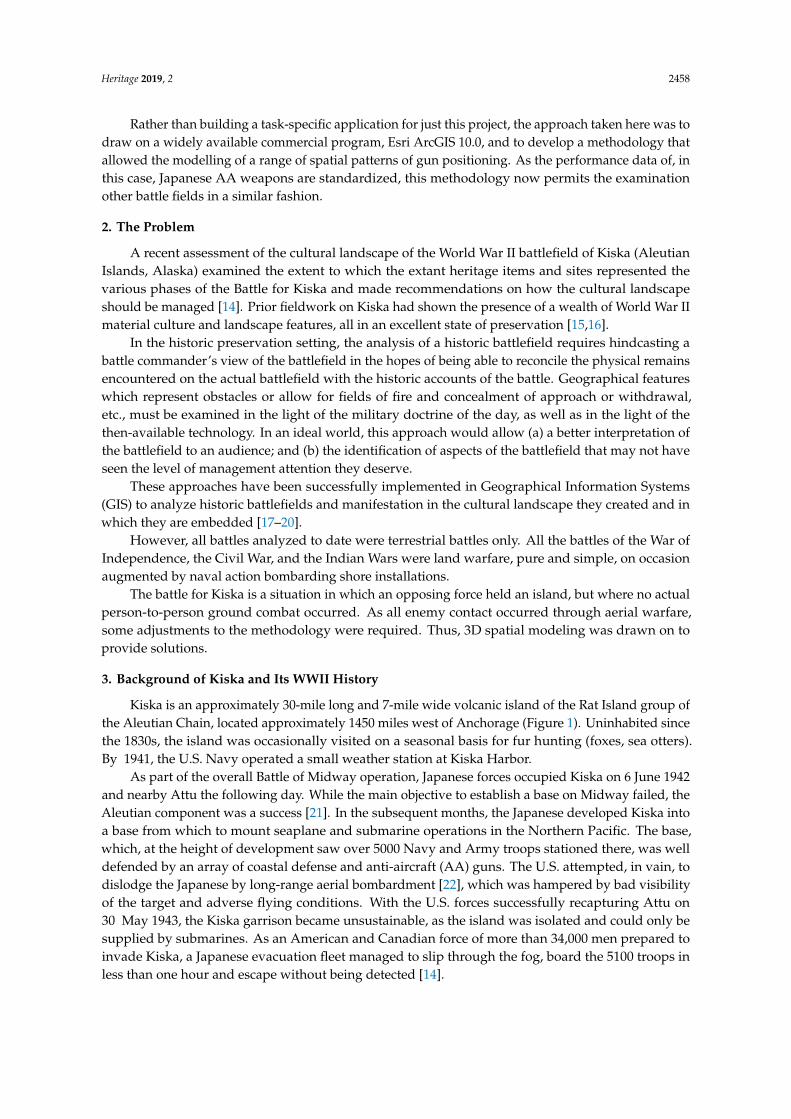
Kiska is an approximately 30-mile long and 7-mile wide volcanic island of the Rat Island group ofthe Aleutian Chain, located approximately 1450 miles west of Anchorage (Figure 1). Uninhabited sincethe 1830s, the island was occasionally visited on a seasonal basis for fur hunting (foxes, sea otters).By 1941, the U.S. Navy operated a small weather station at Kiska Harbor.
As part of the overall Battle of Midway operation, Japanese forces occupied Kiska on 6 June 1942and nearby Attu the following day. While the main objective to establish a base on Midway failed, theAleutian component was a success [21]. In the subsequent months, the Japanese developed Kiska intoa base from which to mount seaplane and submarine operations in the Northern Pacific. The base,which, at the height of development saw over 5000 Navy and Army troops stationed there, was welldefended by an array of coastal defense and anti-aircraft (AA) guns. The U.S. attempted, in vain, todislodge the Japanese by long-range aerial bombardment [22], which was hampered by bad visibilityof the target and adverse flying conditions. With the U.S. forces successfully recapturing Attu on30 May 1943, the Kiska garrison became unsustainable, as the island was isolated and could only besupplied by submarines. As an American and Canadian force of more than 34,000 men prepared toinvade Kiska, a Japanese evacuation fleet managed to slip through the fog, board the 5100 troops inless than one hour and escape without being detected [14].
Heritage 2019, 2 2459Heritage 2019, 2 FOR PEER REVIEW 3
Figure 1. Location of Kiska.
When the U.S./Canadian assault occurred three weeks later, they found the island deserted. To deny the Japanese the future use of the island, the U.S. established their own garrison there, which operated in increasingly scaled-down size until the end of the Pacific War [14].
Kiska forms a unique cultural landscape because with the exception of a few prehistoric indigenous Aleut sites, the island represents a battlefield pure and simple. When the Japanese evacuated the island, they had to leave all their major equipment behind. All of this, as well as personnel shelters and revetments for barracks, is still in situ, except where the U.S. and Canadian garrison forces had competing land use (and cleared the debris) or where U.S. intelligence removed some equipment for testing. In addition to the Japanese component, the battle field encompasses evidence of the U.S. bombing, wrecks of U.S. aircraft shot down, as well as evidence of the U.S. base development, including an airfield (which had been started by the Japanese), piers, collapsed Quonset huts, and the like [14–16,23].
3.1. The Role of Anti-Aircraft Fire
The World War II history of Kiska can be broken up into six phases: (i) Preparing for War; (ii) Attack Phase; (iii) Occupation Period; (iv) Retaking Phase; (v) Garrisoning; and (vi) Abandonment [14]. Kiska was not a single decisive battle, but a prolonged 14-months engagement of trying, by means of air attacks, to dislodge the Japanese after they had gained their foothold. As the 1944 U.S. Intelligence Assessment noted, “[t]he fourteen-month battle for Kiska was largely an engagement between the Eleventh Air Force and Japanese AA fire” [24]. For the analysis of the AA, we only need to be concerned with phases II (Attack) and III (Occupation).
U.S. bombing commenced on 10 June 1942, as soon as the presence of the Japanese on Kiska had been discovered. The first bombing runs were carried out from Cold Bay via Umnak, necessitating long distance flights which were hard on the crews and the aircraft. Over time, U.S. forces built a range of airfields ever closer to Kiska. U.S. bombing runs on Kiska had to be carried out by B-17 and B-24 heavy bombers, dropping their loads from medium to high altitude. While fighter escorts to suppress Japanese AA fire were possible once the base on Adak was operational, this was not very effective, as fighters operated near the end of their range. This changed in February 1942, with the opening of an airfield on nearby Amchitka. Not only could fighters routinely accompany the bombers, but the U.S. could also use medium bomber for medium- and low-altitude attacks. In the final phase of the battle, ironically after the Japanese had already abandoned Kiska, the U.S. used dive-bombers for high precision bombing of specific targets (mainly gun installations).
From the Japanese defenders’ perspective, the changing U.S. attack strategies required an adaptation of their responses. These were primarily the development and positioning of the AA and the deployment of the fighter aircraft. While the sea-plane base had been developed for Kawanishi
Figure 1. Location of Kiska.
When the U.S./Canadian assault occurred three weeks later, they found the island deserted.To deny the Japanese the future use of the island, the U.S. established their own garrison there, whichoperated in increasingly scaled-down size until the end of the Pacific War [14].
Kiska forms a unique cultural landscape because with the exception of a few prehistoric indigenousAleut sites, the island represents a battlefield pure and simple. When the Japanese evacuated theisland, they had to leave all their major equipment behind. All of this, as well as personnel sheltersand revetments for barracks, is still in situ, except where the U.S. and Canadian garrison forces hadcompeting land use (and cleared the debris) or where U.S. intelligence removed some equipmentfor testing. In addition to the Japanese component, the battle field encompasses evidence of theU.S. bombing, wrecks of U.S. aircraft shot down, as well as evidence of the U.S. base development,including an airfield (which had been started by the Japanese), piers, collapsed Quonset huts, and thelike [14–16,23].
3.1. The Role of Anti-Aircraft Fire
The World War II history of Kiska can be broken up into six phases: (i) Preparing for War; (ii)Attack Phase; (iii) Occupation Period; (iv) Retaking Phase; (v) Garrisoning; and (vi) Abandonment [14].Kiska was not a single decisive battle, but a prolonged 14-months engagement of trying, by means ofair attacks, to dislodge the Japanese after they had gained their foothold. As the 1944 U.S. IntelligenceAssessment noted, “[t]he fourteen-month battle for Kiska was largely an engagement between theEleventh Air Force and Japanese AA fire” [24]. For the analysis of the AA, we only need to be concernedwith phases II (Attack) and III (Occupation).
U.S. bombing commenced on 10 June 1942, as soon as the presence of the Japanese on Kiska hadbeen discovered. The first bombing runs were carried out from Cold Bay via Umnak, necessitatinglong distance flights which were hard on the crews and the aircraft. Over time, U.S. forces built a rangeof airfields ever closer to Kiska. U.S. bombing runs on Kiska had to be carried out by B-17 and B-24heavy bombers, dropping their loads from medium to high altitude. While fighter escorts to suppressJapanese AA fire were possible once the base on Adak was operational, this was not very effective,as fighters operated near the end of their range. This changed in February 1942, with the opening ofan airfield on nearby Amchitka. Not only could fighters routinely accompany the bombers, but theU.S. could also use medium bomber for medium- and low-altitude attacks. In the final phase of thebattle, ironically after the Japanese had already abandoned Kiska, the U.S. used dive-bombers for highprecision bombing of specific targets (mainly gun installations).
From the Japanese defenders’ perspective, the changing U.S. attack strategies required anadaptation of their responses. These were primarily the development and positioning of the AA and
Heritage 2019, 2 2460
the deployment of the fighter aircraft. While the sea-plane base had been developed for Kawanishi H6K(‘Mavis’), Aichi D13A1 (‘Jake’) and Mitsubishi F2M1 (‘Pete’) long- and medium-range reconnaissanceplanes, the Japanese responded to the developing threat by U.S. bombers with the deployment ofNakajima A6M2-N (‘Rufe’) floatplane fighters, a brand-new floatplane adaptation of the ‘Zero’ fighter,which had just become available in small numbers [14,25].
3.2. Problems in Interpreting Anti-Aircraft Fire
When examining the interactions between attacking aircraft and opposing anti-aircraft fire, wecan work from the known entity, the location of the AA gun batteries. It seems more sensible toprovide data on the practical rate of fire rather than the theoretical maximum. This takes into accountthe number of barrels as well. Furthermore, the effective ceiling where hits could be expected, isgiven, rather than the maximum ceiling. On Kiska, these were mapped during World War II on thebomb target maps, and have since been verified in the field during surveys carried out in 2007 and2009 [14,15].
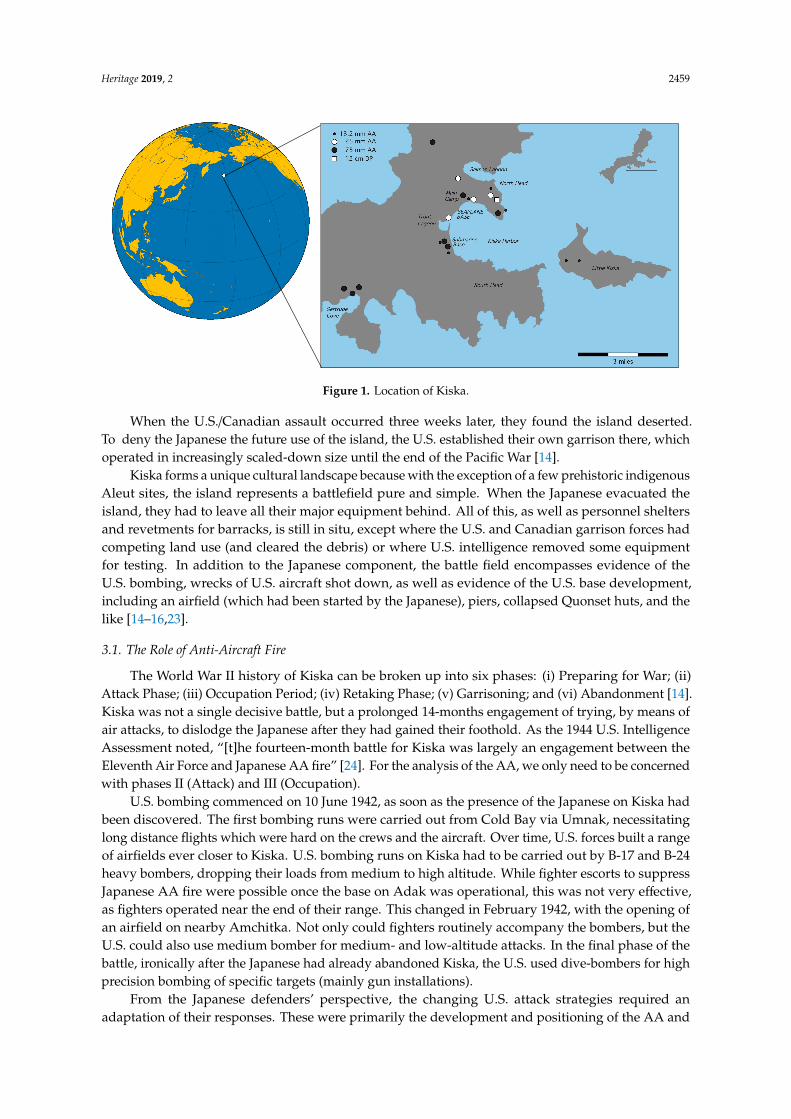
The principal Japanese AA gun types are summarized in Table 1. The key weapons in the early partof the battle were 25-mm twin-barreled medium AA, 75-mm Type 88 heavy AA (Figure 2), and 120-mmdual-purpose guns. The latter also served as surface weapons against naval targets. Once fighterscame into play, smaller calibers, notably the 13.2-mm Type 93, were used. These, however, were alsosubject to direct strafing fire by attacking aircrafts and their effectiveness seems to have been low.
Heritage 2019, 2 FOR PEER REVIEW 4
H6K (‘Mavis’), Aichi D13A1 (‘Jake’) and Mitsubishi F2M1 (‘Pete’) long- and medium-range reconnaissance planes, the Japanese responded to the developing threat by U.S. bombers with the deployment of Nakajima A6M2-N (‘Rufe’) floatplane fighters, a brand-new floatplane adaptation of the ‘Zero’ fighter, which had just become available in small numbers [14,25].
3.2. Problems in Interpreting Anti-Aircraft Fire
When examining the interactions between attacking aircraft and opposing anti-aircraft fire, we can work from the known entity, the location of the AA gun batteries. It seems more sensible to provide data on the practical rate of fire rather than the theoretical maximum. This takes into account the number of barrels as well. Furthermore, the effective ceiling where hits could be expected, is given, rather than the maximum ceiling. On Kiska, these were mapped during World War II on the bomb target maps, and have since been verified in the field during surveys carried out in 2007 and 2009 [14,15].
The principal Japanese AA gun types are summarized in Table 1. The key weapons in the early part of the battle were 25-mm twin-barreled medium AA, 75-mm Type 88 heavy AA (Figure 2), and 120-mm dual-purpose guns. The latter also served as surface weapons against naval targets. Once fighters came into play, smaller calibers, notably the 13.2-mm Type 93, were used. These, however, were also subject to direct strafing fire by attacking aircrafts and their effectiveness seems to have been low.
Figure 2. Example of a 75-mm Type 88 anti-aircraft (AA) gun at North Head, Kiska Harbor.
The Japanese sited their AA weapons in order to protect their key assets at Kiska Harbor, initially the sea-plane base at the north-western beach and soon after, the submarine base on the south-western shore. A range of AA weapons was emplaced, each with different capabilities (Table 1), to provide an in-depth defense. As is evident from the above, this system of AA was not static, but responsive to changes in U.S. tactics. To adequately analyze this defense system, GIS was drawn on to visualize the capabilities of the guns in a three-dimensional space.
Figure 2. Example of a 75-mm Type 88 anti-aircraft (AA) gun at North Head, Kiska Harbor.
Heritage 2019, 2 2461
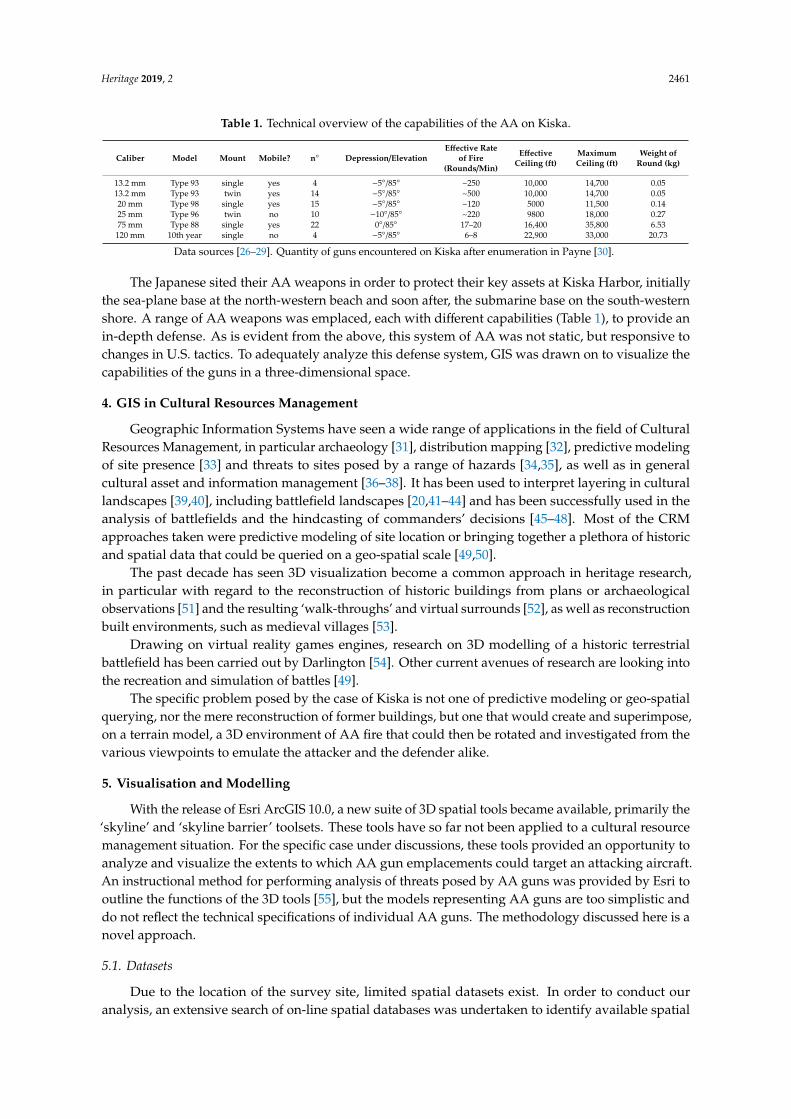
Table 1. Technical overview of the capabilities of the AA on Kiska.
Caliber Model Mount Mobile? n◦ Depression/ElevationEffective Rate
of Fire(Rounds/Min)
EffectiveCeiling (ft)
MaximumCeiling (ft)
Weight ofRound (kg)
13.2 mm Type 93 single yes 4 −5◦/85◦ ~250 10,000 14,700 0.0513.2 mm Type 93 twin yes 14 −5◦/85◦ ~500 10,000 14,700 0.0520 mm Type 98 single yes 15 −5◦/85◦ ~120 5000 11,500 0.1425 mm Type 96 twin no 10 −10◦/85◦ ~220 9800 18,000 0.2775 mm Type 88 single yes 22 0◦/85◦ 17–20 16,400 35,800 6.53120 mm 10th year single no 4 −5◦/85◦ 6–8 22,900 33,000 20.73
Data sources [26–29]. Quantity of guns encountered on Kiska after enumeration in Payne [30].
The Japanese sited their AA weapons in order to protect their key assets at Kiska Harbor, initiallythe sea-plane base at the north-western beach and soon after, the submarine base on the south-westernshore. A range of AA weapons was emplaced, each with different capabilities (Table 1), to provide anin-depth defense. As is evident from the above, this system of AA was not static, but responsive tochanges in U.S. tactics. To adequately analyze this defense system, GIS was drawn on to visualize thecapabilities of the guns in a three-dimensional space.
4. GIS in Cultural Resources Management
Geographic Information Systems have seen a wide range of applications in the field of CulturalResources Management, in particular archaeology [31], distribution mapping [32], predictive modelingof site presence [33] and threats to sites posed by a range of hazards [34,35], as well as in generalcultural asset and information management [36–38]. It has been used to interpret layering in culturallandscapes [39,40], including battlefield landscapes [20,41–44] and has been successfully used in theanalysis of battlefields and the hindcasting of commanders’ decisions [45–48]. Most of the CRMapproaches taken were predictive modeling of site location or bringing together a plethora of historicand spatial data that could be queried on a geo-spatial scale [49,50].
The past decade has seen 3D visualization become a common approach in heritage research,in particular with regard to the reconstruction of historic buildings from plans or archaeologicalobservations [51] and the resulting ‘walk-throughs’ and virtual surrounds [52], as well as reconstructionbuilt environments, such as medieval villages [53].
Drawing on virtual reality games engines, research on 3D modelling of a historic terrestrialbattlefield has been carried out by Darlington [54]. Other current avenues of research are looking intothe recreation and simulation of battles [49].
The specific problem posed by the case of Kiska is not one of predictive modeling or geo-spatialquerying, nor the mere reconstruction of former buildings, but one that would create and superimpose,on a terrain model, a 3D environment of AA fire that could then be rotated and investigated from thevarious viewpoints to emulate the attacker and the defender alike.
5. Visualisation and Modelling
With the release of Esri ArcGIS 10.0, a new suite of 3D spatial tools became available, primarily the‘skyline’ and ‘skyline barrier’ toolsets. These tools have so far not been applied to a cultural resourcemanagement situation. For the specific case under discussions, these tools provided an opportunity toanalyze and visualize the extents to which AA gun emplacements could target an attacking aircraft.An instructional method for performing analysis of threats posed by AA guns was provided by Esri tooutline the functions of the 3D tools [55], but the models representing AA guns are too simplistic anddo not reflect the technical specifications of individual AA guns. The methodology discussed here is anovel approach.
5.1. Datasets
Due to the location of the survey site, limited spatial datasets exist. In order to conduct ouranalysis, an extensive search of on-line spatial databases was undertaken to identify available spatial
Heritage 2019, 2 2462
datasets. As a basis to conduct our analysis, two spatial datasets were required: a Kiska Island elevationmodel and the point locations of AA gun emplacements surveyed on Kiska Island. All other spatialdatasets involved in the analysis were derivative products of these initial datasets.
The ASTER Global DEM version 1 was sourced for the elevation model for Kiska Island.The ASTER Global Digital Elevation Model (ASTER GDEM) is a joint product developed madeavailable to the public by the Ministry of Economy, Trade, and Industry (METI) of Japan and theUnited States National Aeronautics and Space Administration (NASA). It was generated from datacollected from the Advanced Spaceborne Thermal Emission and Reflection Radiometer (ASTER), asatellite-based Earth-observing optical instrument. It has an along-track stereoscopic capability usingits near infrared spectral band and nadir-viewing and backward-viewing telescopes to acquire stereoimage data with a base-to-height ratio of 0.6. The spatial resolution is 15 m in the horizontal plane.One nadir-looking ASTER VNIR scene consists of 4100 samples by 4200 lines, corresponding to abouta 60-km-by-60-km ground area [56].
The ASTER GDEM covers land surfaces between 83◦ N and 83◦ S and is composed of 22,6001◦-by-1◦ tiles. Tiles that contained at least 0.01% land area were included. The ASTER GDEM is inGeoTIFF format with geographic lat/long coordinates and a 1 arc-second (30 m) grid of elevationpostings. It is referenced to the WGS84/EGM96 geoid. Pre-production estimated accuracies forthis global product were 20 m at 95% confidence for vertical data and 30 m at 95 % confidence forhorizontal data.
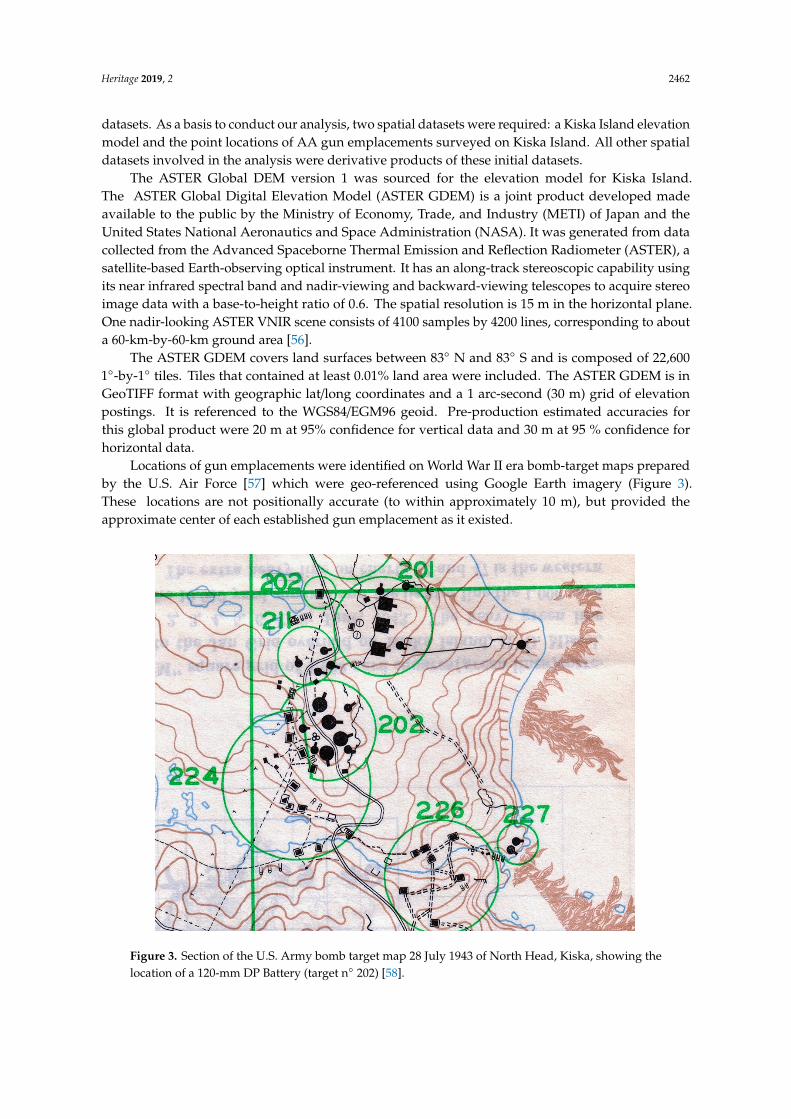
Locations of gun emplacements were identified on World War II era bomb-target maps preparedby the U.S. Air Force [57] which were geo-referenced using Google Earth imagery (Figure 3).These locations are not positionally accurate (to within approximately 10 m), but provided theapproximate center of each established gun emplacement as it existed.
Heritage 2019, 2 FOR PEER REVIEW 6
The ASTER Global DEM version 1 was sourced for the elevation model for Kiska Island. The ASTER Global Digital Elevation Model (ASTER GDEM) is a joint product developed made available to the public by the Ministry of Economy, Trade, and Industry (METI) of Japan and the United States National Aeronautics and Space Administration (NASA). It was generated from data collected from the Advanced Spaceborne Thermal Emission and Reflection Radiometer (ASTER), a satellite-based Earth-observing optical instrument. It has an along-track stereoscopic capability using its near infrared spectral band and nadir-viewing and backward-viewing telescopes to acquire stereo image data with a base-to-height ratio of 0.6. The spatial resolution is 15 m in the horizontal plane. One nadir-looking ASTER VNIR scene consists of 4100 samples by 4200 lines, corresponding to about a 60-km-by-60-km ground area [56].
The ASTER GDEM covers land surfaces between 83° N and 83° S and is composed of 22,600 1°-by-1° tiles. Tiles that contained at least 0.01% land area were included. The ASTER GDEM is in GeoTIFF format with geographic lat/long coordinates and a 1 arc-second (30 m) grid of elevation postings. It is referenced to the WGS84/EGM96 geoid. Pre-production estimated accuracies for this global product were 20 m at 95% confidence for vertical data and 30 m at 95 % confidence for horizontal data.
Locations of gun emplacements were identified on World War II era bomb-target maps prepared by the U.S. Air Force [57] which were geo-referenced using Google Earth imagery (Figure 3). These locations are not positionally accurate (to within approximately 10 m), but provided the approximate center of each established gun emplacement as it existed.
Figure 3. Section of the U.S. Army bomb target map 28 July 1943 of North Head, Kiska, showing the location of a 120-mm DP Battery (target nº 202) [58].
5.2. AA Technical Data
The technical specifications of the surveyed gun types were utilized to form the basis of 3D models of the range and elevation of AA guns utilized in the defense of Kiska Island. The required technical data for the altitude and radius of the AA fire at different elevations (‘fire dome’) were drawn from intelligence sources. The 25 mm, 75 mm and 120 mm detailed fire domes had been compiled by U.S. sources based on data contained in Japanese documents as well as tests carried out by U.S. forces with captured equipment [27] (Table 2). No such data existed for the 13.2 mm AA, but
Figure 3. Section of the U.S. Army bomb target map 28 July 1943 of North Head, Kiska, showing thelocation of a 120-mm DP Battery (target n◦ 202) [58].
Heritage 2019, 2 2463
5.2. AA Technical Data
The technical specifications of the surveyed gun types were utilized to form the basis of 3D modelsof the range and elevation of AA guns utilized in the defense of Kiska Island. The required technicaldata for the altitude and radius of the AA fire at different elevations (‘fire dome’) were drawn fromintelligence sources. The 25 mm, 75 mm and 120 mm detailed fire domes had been compiled by U.S.sources based on data contained in Japanese documents as well as tests carried out by U.S. forces withcaptured equipment [27] (Table 2). No such data existed for the 13.2 mm AA, but an approximatedome could be constructed drawing on dispersed intelligence commentary. To permit the constructionof required spatial features within the GIS, the data were converted from feet and yards to meters.
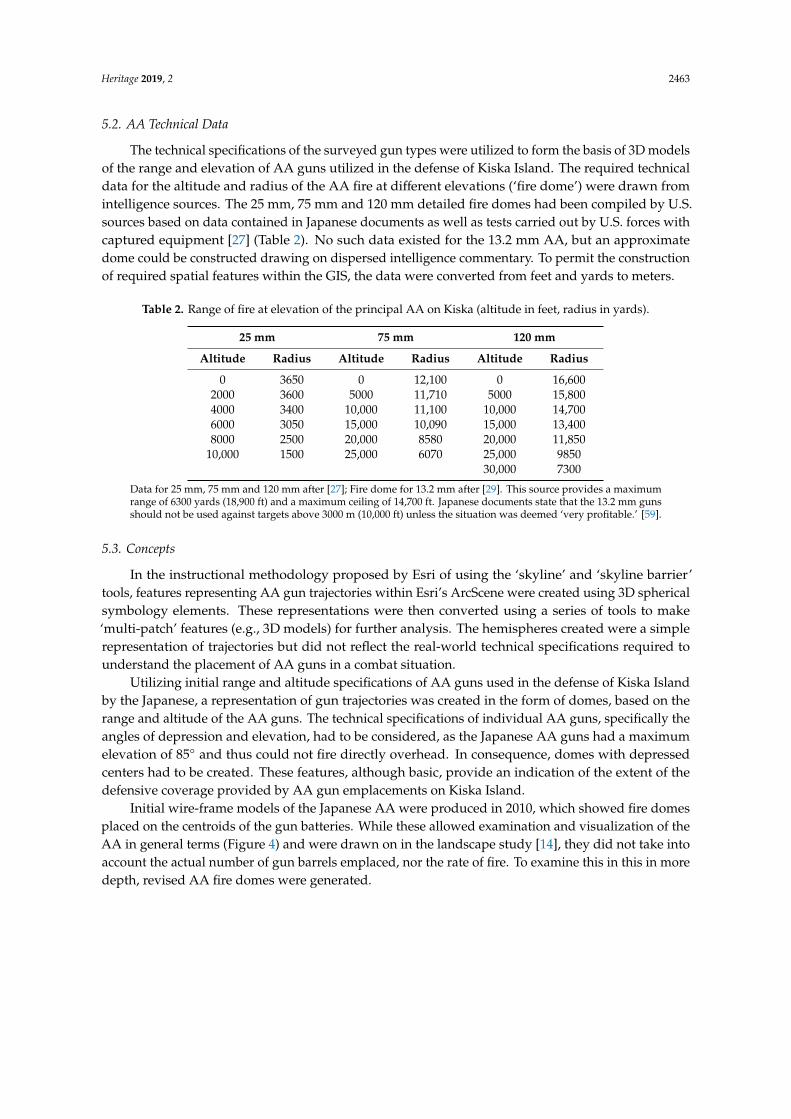
Table 2. Range of fire at elevation of the principal AA on Kiska (altitude in feet, radius in yards).
25 mm 75 mm 120 mm
Altitude Radius Altitude Radius Altitude Radius
0 3650 0 12,100 0 16,6002000 3600 5000 11,710 5000 15,8004000 3400 10,000 11,100 10,000 14,7006000 3050 15,000 10,090 15,000 13,4008000 2500 20,000 8580 20,000 11,850
10,000 1500 25,000 6070 25,000 985030,000 7300
Data for 25 mm, 75 mm and 120 mm after [27]; Fire dome for 13.2 mm after [29]. This source provides a maximumrange of 6300 yards (18,900 ft) and a maximum ceiling of 14,700 ft. Japanese documents state that the 13.2 mm gunsshould not be used against targets above 3000 m (10,000 ft) unless the situation was deemed ‘very profitable.’ [59].
5.3. Concepts
In the instructional methodology proposed by Esri of using the ‘skyline’ and ‘skyline barrier’tools, features representing AA gun trajectories within Esri’s ArcScene were created using 3D sphericalsymbology elements. These representations were then converted using a series of tools to make‘multi-patch’ features (e.g., 3D models) for further analysis. The hemispheres created were a simplerepresentation of trajectories but did not reflect the real-world technical specifications required tounderstand the placement of AA guns in a combat situation.
Utilizing initial range and altitude specifications of AA guns used in the defense of Kiska Islandby the Japanese, a representation of gun trajectories was created in the form of domes, based on therange and altitude of the AA guns. The technical specifications of individual AA guns, specifically theangles of depression and elevation, had to be considered, as the Japanese AA guns had a maximumelevation of 85◦ and thus could not fire directly overhead. In consequence, domes with depressedcenters had to be created. These features, although basic, provide an indication of the extent of thedefensive coverage provided by AA gun emplacements on Kiska Island.
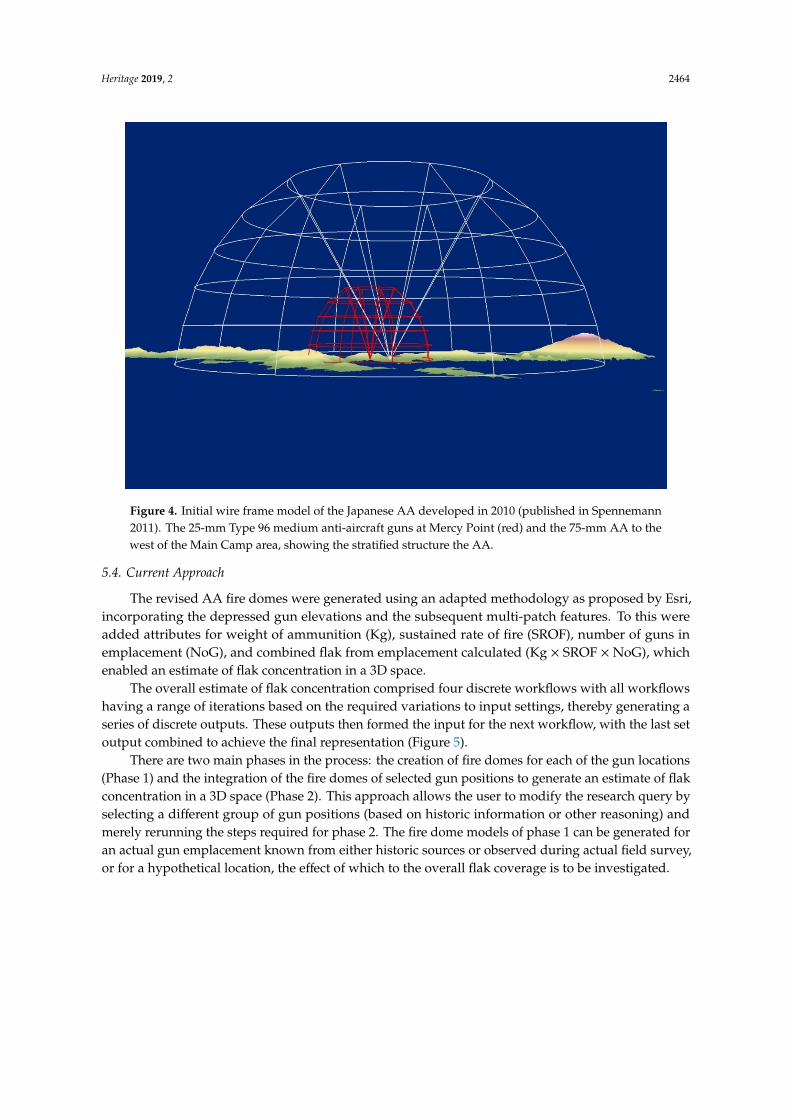
Initial wire-frame models of the Japanese AA were produced in 2010, which showed fire domesplaced on the centroids of the gun batteries. While these allowed examination and visualization of theAA in general terms (Figure 4) and were drawn on in the landscape study [14], they did not take intoaccount the actual number of gun barrels emplaced, nor the rate of fire. To examine this in this in moredepth, revised AA fire domes were generated.
Heritage 2019, 2 2464
Heritage 2019, 2 FOR PEER REVIEW 8
Figure 4. Initial wire frame model of the Japanese AA developed in 2010 (published in Spennemann 2011). The 25-mm Type 96 medium anti-aircraft guns at Mercy Point (red) and the 75-mm AA to the west of the Main Camp area, showing the stratified structure the AA.
There are two main phases in the process: the creation of fire domes for each of the gun locations (Phase 1) and the integration of the fire domes of selected gun positions to generate an estimate of flak concentration in a 3D space (Phase 2). This approach allows the user to modify the research query by selecting a different group of gun positions (based on historic information or other reasoning) and merely rerunning the steps required for phase 2. The fire dome models of phase 1 can be generated for an actual gun emplacement known from either historic sources or observed during actual field survey, or for a hypothetical location, the effect of which to the overall flak coverage is to be investigated.
Phase 1: The initial step was to generate a model of the airspace for each gun emplacement that could be targeted by the gun (Figures 6 and 7). These outputs form the primary data set for further analysis. The actual elevation, as derived from the ASTER GDEM, was used for all terrestrial emplacements. For the assessment of ship-borne AA, the approximate location of the ship was determined using historical imagery with the elevation of the gun set at 5 m above sea-level. In the next step, sampled fire dome features were calculated for the gun emplacements selected for analysis (Figures 8 and 9). These now form the foundations for all future analyses of the effects of the flak.
Figure 4. Initial wire frame model of the Japanese AA developed in 2010 (published in Spennemann2011). The 25-mm Type 96 medium anti-aircraft guns at Mercy Point (red) and the 75-mm AA to thewest of the Main Camp area, showing the stratified structure the AA.
5.4. Current Approach
The revised AA fire domes were generated using an adapted methodology as proposed by Esri,incorporating the depressed gun elevations and the subsequent multi-patch features. To this wereadded attributes for weight of ammunition (Kg), sustained rate of fire (SROF), number of guns inemplacement (NoG), and combined flak from emplacement calculated (Kg × SROF × NoG), whichenabled an estimate of flak concentration in a 3D space.
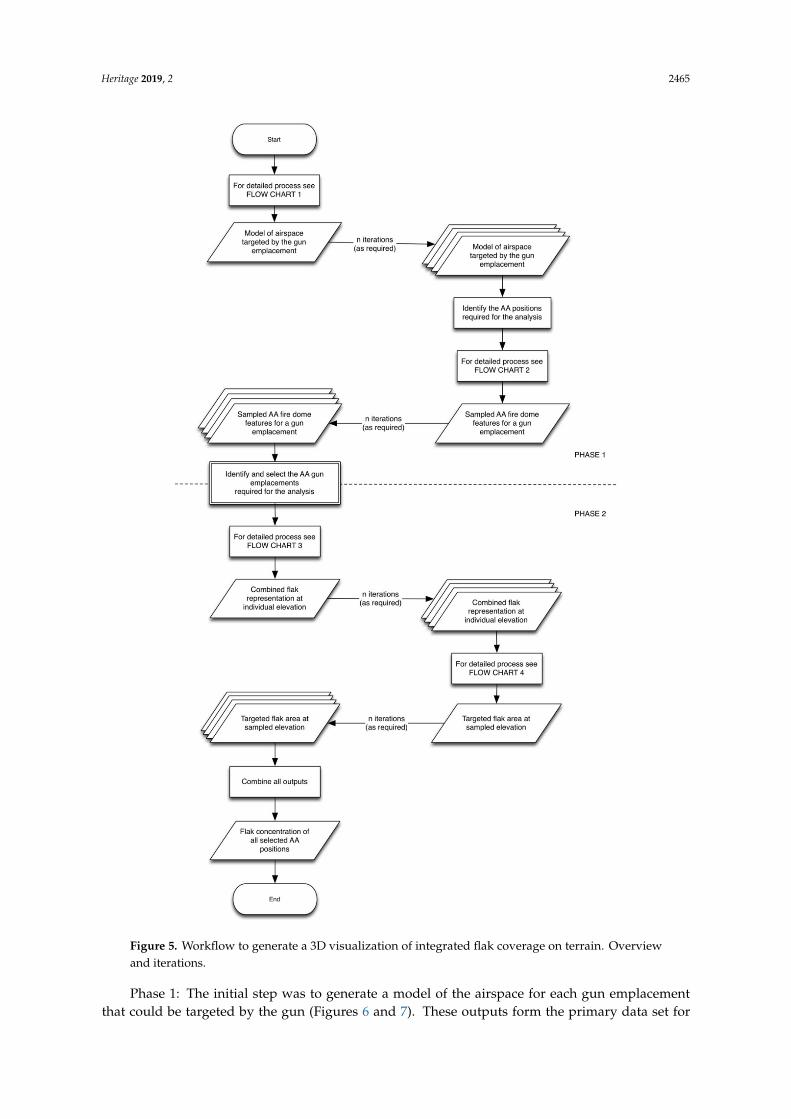
The overall estimate of flak concentration comprised four discrete workflows with all workflowshaving a range of iterations based on the required variations to input settings, thereby generating aseries of discrete outputs. These outputs then formed the input for the next workflow, with the last setoutput combined to achieve the final representation (Figure 5).
There are two main phases in the process: the creation of fire domes for each of the gun locations(Phase 1) and the integration of the fire domes of selected gun positions to generate an estimate of flakconcentration in a 3D space (Phase 2). This approach allows the user to modify the research query byselecting a different group of gun positions (based on historic information or other reasoning) andmerely rerunning the steps required for phase 2. The fire dome models of phase 1 can be generated foran actual gun emplacement known from either historic sources or observed during actual field survey,or for a hypothetical location, the effect of which to the overall flak coverage is to be investigated.
Heritage 2019, 2 2465Heritage 2019, 2 FOR PEER REVIEW 9
Figure 5. Workflow to generate a 3D visualization of integrated flak coverage on terrain. Overview and iterations.
Figure 5. Workflow to generate a 3D visualization of integrated flak coverage on terrain. Overviewand iterations.
Phase 1: The initial step was to generate a model of the airspace for each gun emplacementthat could be targeted by the gun (Figures 6 and 7). These outputs form the primary data set for
Heritage 2019, 2 2466
further analysis. The actual elevation, as derived from the ASTER GDEM, was used for all terrestrialemplacements. For the assessment of ship-borne AA, the approximate location of the ship wasdetermined using historical imagery with the elevation of the gun set at 5 m above sea-level. In thenext step, sampled fire dome features were calculated for the gun emplacements selected for analysis(Figures 8 and 9). These now form the foundations for all future analyses of the effects of the flak.Heritage 2019, 2 FOR PEER REVIEW 10
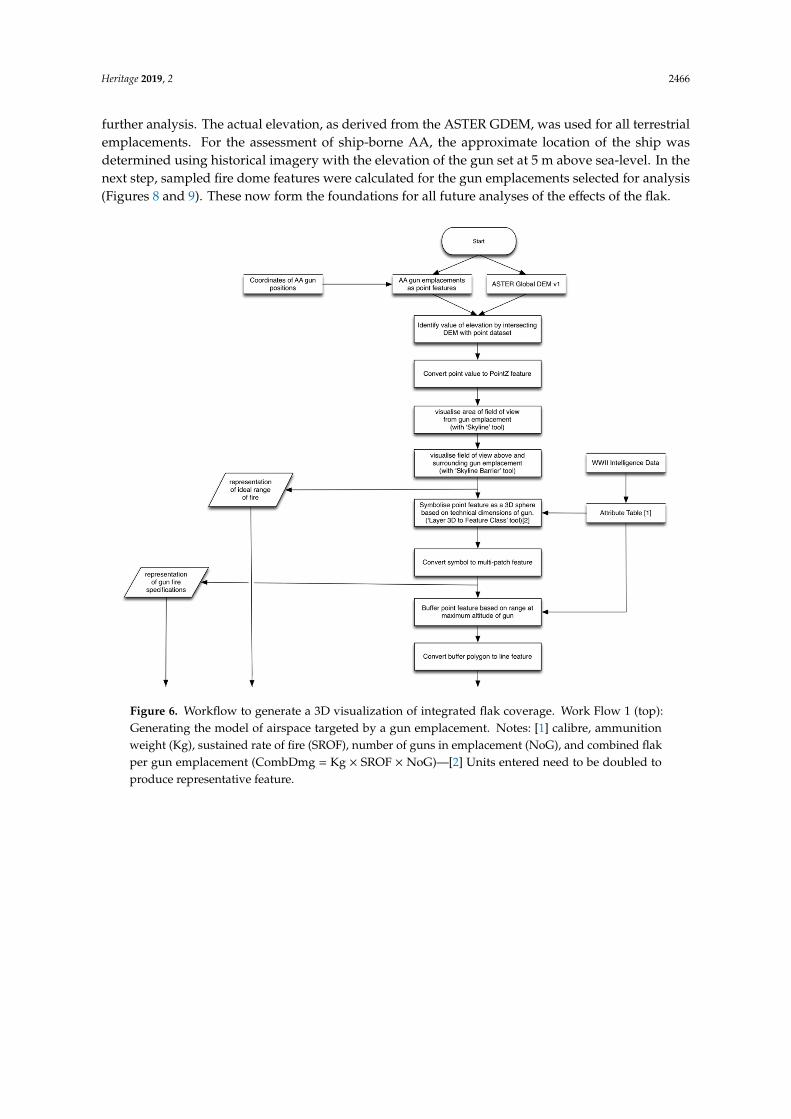
Figure 6. Workflow to generate a 3D visualization of integrated flak coverage. Work Flow 1 (top): Generating the model of airspace targeted by a gun emplacement. Notes: [1] calibre, ammunition weight (Kg), sustained rate of fire (SROF), number of guns in emplacement (NoG), and combined flak per gun emplacement (CombDmg = Kg × SROF × NoG)—[2] Units entered need to be doubled to produce representative feature.
Figure 6. Workflow to generate a 3D visualization of integrated flak coverage. Work Flow 1 (top):Generating the model of airspace targeted by a gun emplacement. Notes: [1] calibre, ammunitionweight (Kg), sustained rate of fire (SROF), number of guns in emplacement (NoG), and combined flakper gun emplacement (CombDmg = Kg × SROF × NoG)—[2] Units entered need to be doubled toproduce representative feature.
Heritage 2019, 2 2467Heritage 2019, 2 FOR PEER REVIEW 11
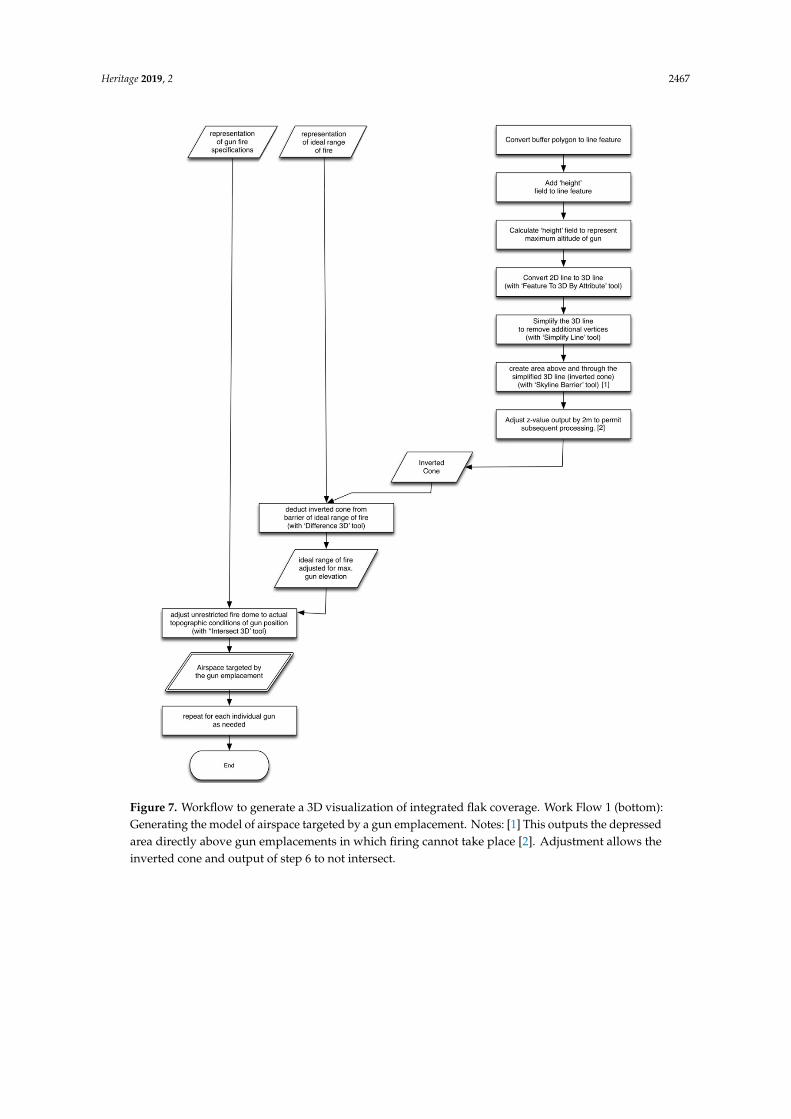
Figure 7. Workflow to generate a 3D visualization of integrated flak coverage. Work Flow 1 (bottom): Generating the model of airspace targeted by a gun emplacement. Notes: [1] This outputs the depressed area directly above gun emplacements in which firing cannot take place [2]. Adjustment allows the inverted cone and output of step 6 to not intersect.
Figure 7. Workflow to generate a 3D visualization of integrated flak coverage. Work Flow 1 (bottom):Generating the model of airspace targeted by a gun emplacement. Notes: [1] This outputs the depressedarea directly above gun emplacements in which firing cannot take place [2]. Adjustment allows theinverted cone and output of step 6 to not intersect.
Heritage 2019, 2 2468Heritage 2019, 2 FOR PEER REVIEW 12
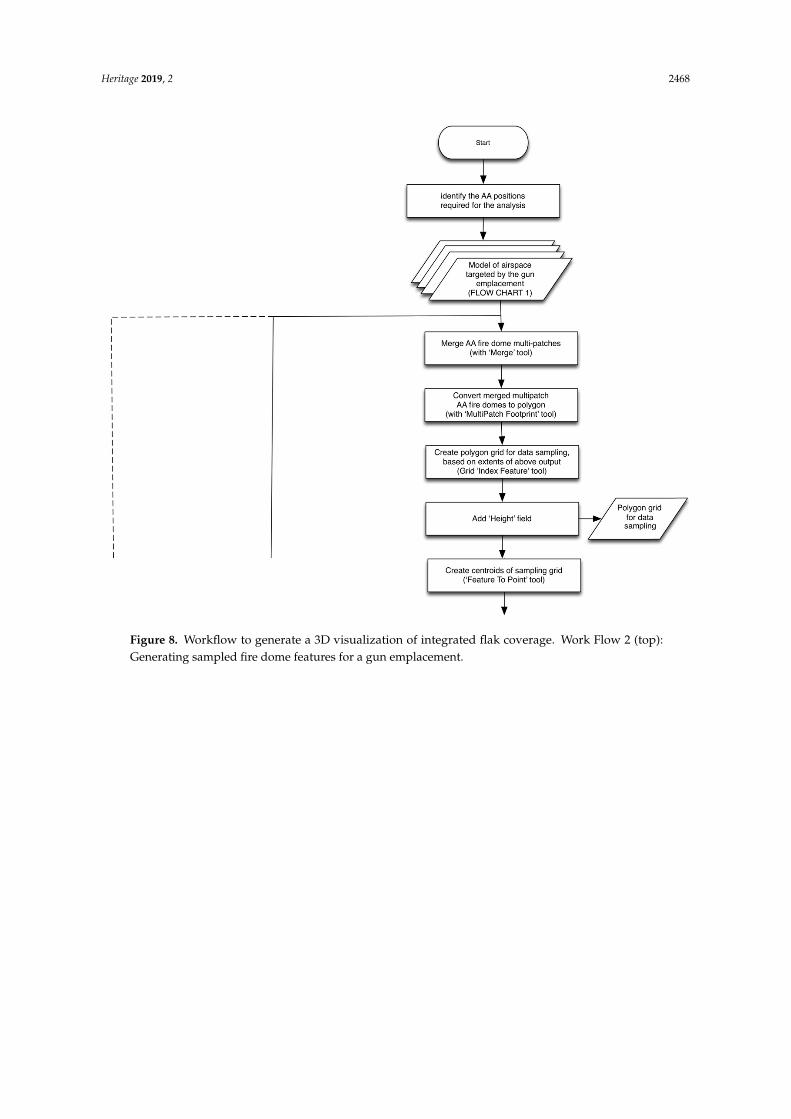
Figure 8. Workflow to generate a 3D visualization of integrated flak coverage. Work Flow 2 (top): Generating sampled fire dome features for a gun emplacement.
Figure 8. Workflow to generate a 3D visualization of integrated flak coverage. Work Flow 2 (top):Generating sampled fire dome features for a gun emplacement.
Heritage 2019, 2 2469Heritage 2019, 2 FOR PEER REVIEW 13
Figure 9. Workflow to generate a 3D visualization of integrated flak coverage. Work Flow 2 (bottom): Generating sampled fire dome features for a gun emplacement.
Phase 2: Following the selection of the AA positions to be used in the flak analysis, the combined flak representation was calculated for an individual elevation for a grid point (Figures 10 and 11), which were then integrated to provide the targeted flak area at a sampled elevation (Figure 12). When these were combined, an estimate of the total flak concentration in a 3D space could be generated (Figure 5).
Figure 9. Workflow to generate a 3D visualization of integrated flak coverage. Work Flow 2 (bottom):Generating sampled fire dome features for a gun emplacement.
Phase 2: Following the selection of the AA positions to be used in the flak analysis, the combinedflak representation was calculated for an individual elevation for a grid point (Figures 10 and 11),which were then integrated to provide the targeted flak area at a sampled elevation (Figure 12). Whenthese were combined, an estimate of the total flak concentration in a 3D space could be generated(Figure 5).
Heritage 2019, 2 2470Heritage 2019, 2 FOR PEER REVIEW 14
Figure 10. Workflow to generate a 3D visualization of integrated flak coverage. Work Flow 3 (top): Generating the combined flak representation at an individual elevation for a grid point. Note: [1] Selection performed by alphabetical letter iteration, due to the large quantity of sampling points generated by specified sampling regime. Trying to sample entire sample space at one time may lead to computational resources diminishing, disabling the analysis process.
Figure 10. Workflow to generate a 3D visualization of integrated flak coverage. Work Flow 3 (top):Generating the combined flak representation at an individual elevation for a grid point. Note: [1]Selection performed by alphabetical letter iteration, due to the large quantity of sampling pointsgenerated by specified sampling regime. Trying to sample entire sample space at one time may lead tocomputational resources diminishing, disabling the analysis process.
Heritage 2019, 2 2471
Heritage 2019, 2 FOR PEER REVIEW 15
Figure 11 Workflow to generate a 3D visualization of integrated flak coverage. Work Flow 3 (bottom): Generating the combined flak representation at an individual elevation for a grid point. Figure 11. Workflow to generate a 3D visualization of integrated flak coverage. Work Flow 3 (bottom):Generating the combined flak representation at an individual elevation for a grid point.
Heritage 2019, 2 2472Heritage 2019, 2 FOR PEER REVIEW 16
Figure 12. Workflow to generate a 3D visualization of integrated flak coverage. Work Flow 4: Generating the targeted flak area at a sampled elevation.
6. Results
The operational commander on the ground had years of technical military training and could readily visualize the situation as it presented itself to him in 1942; the modern-day researcher, however, is not intuitively cognizant of the capabilities and limitations of the Japanese AA systems in a given setting—a problem that influences the ability to hind-cast the Japanese operational commander’s decisions.
The resulting three-dimensional models clearly show that the AA coverage during the initial occupation phase was insufficient to properly protect the Japanese base and associated shipping in the Harbor (Figure 13). While the AA in the main valley provided a protective dome over part of the harbor, including its approaches, it could be readily circumnavigated. Large sections of the base area
Figure 12. Workflow to generate a 3D visualization of integrated flak coverage. Work Flow 4:Generating the targeted flak area at a sampled elevation.
6. Results
The operational commander on the ground had years of technical military training and couldreadily visualize the situation as it presented itself to him in 1942; the modern-day researcher,however, is not intuitively cognizant of the capabilities and limitations of the Japanese AA systemsin a given setting—a problem that influences the ability to hind-cast the Japanese operationalcommander’s decisions.
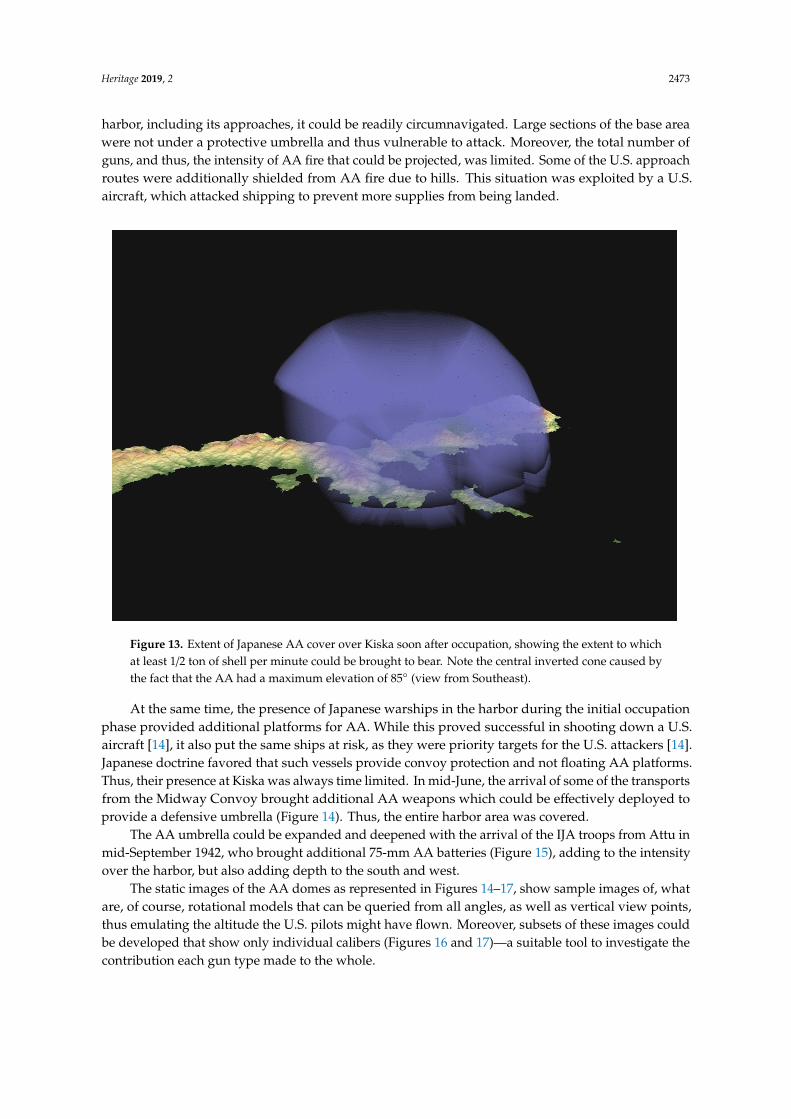
The resulting three-dimensional models clearly show that the AA coverage during the initialoccupation phase was insufficient to properly protect the Japanese base and associated shipping inthe Harbor (Figure 13). While the AA in the main valley provided a protective dome over part of the
Heritage 2019, 2 2473
harbor, including its approaches, it could be readily circumnavigated. Large sections of the base areawere not under a protective umbrella and thus vulnerable to attack. Moreover, the total number ofguns, and thus, the intensity of AA fire that could be projected, was limited. Some of the U.S. approachroutes were additionally shielded from AA fire due to hills. This situation was exploited by a U.S.aircraft, which attacked shipping to prevent more supplies from being landed.
Heritage 2019, 2 FOR PEER REVIEW 17
were not under a protective umbrella and thus vulnerable to attack. Moreover, the total number of guns, and thus, the intensity of AA fire that could be projected, was limited. Some of the U.S. approach routes were additionally shielded from AA fire due to hills. This situation was exploited by a U.S. aircraft, which attacked shipping to prevent more supplies from being landed.
Figure 13. Extent of Japanese AA cover over Kiska soon after occupation, showing the extent to which at least 1/2 ton of shell per minute could be brought to bear. Note the central inverted cone caused by the fact that the AA had a maximum elevation of 85° (view from Southeast).
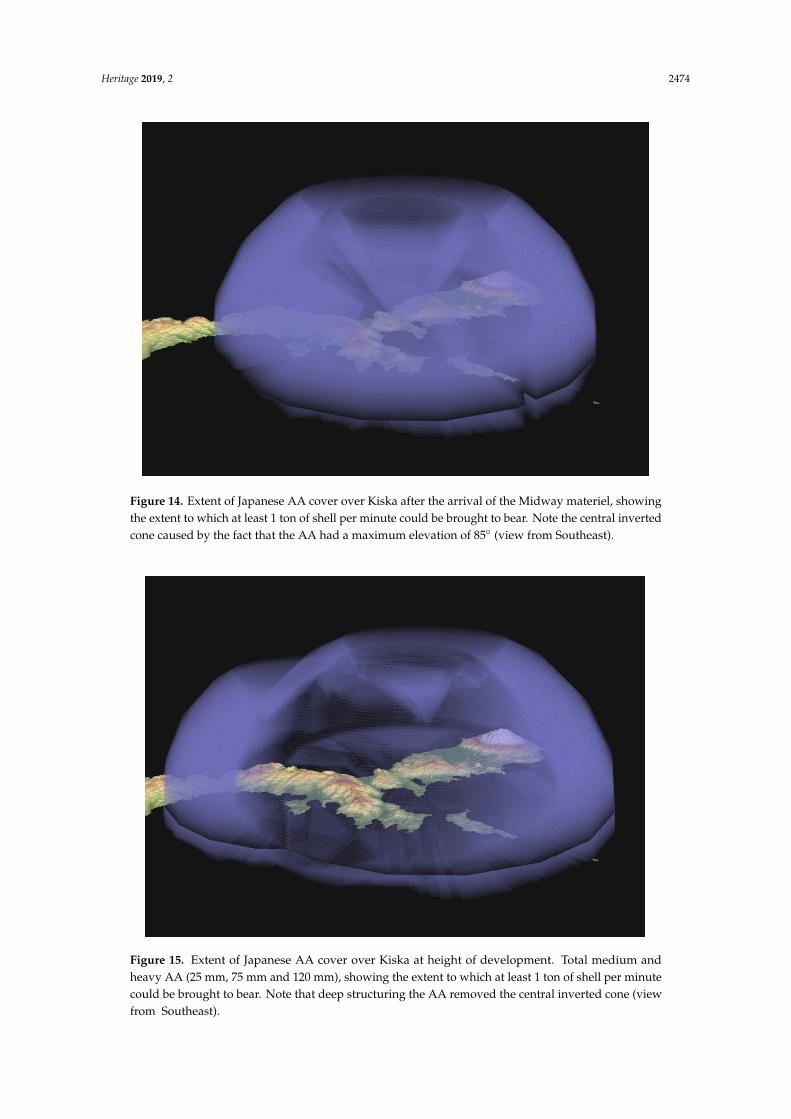
At the same time, the presence of Japanese warships in the harbor during the initial occupation phase provided additional platforms for AA. While this proved successful in shooting down a U.S. aircraft [14], it also put the same ships at risk, as they were priority targets for the U.S. attackers [14]. Japanese doctrine favored that such vessels provide convoy protection and not floating AA platforms. Thus, their presence at Kiska was always time limited. In mid-June, the arrival of some of the transports from the Midway Convoy brought additional AA weapons which could be effectively deployed to provide a defensive umbrella (Figure 14). Thus, the entire harbor area was covered.
The AA umbrella could be expanded and deepened with the arrival of the IJA troops from Attu in mid-September 1942, who brought additional 75-mm AA batteries (Figure 15), adding to the intensity over the harbor, but also adding depth to the south and west.
The static images of the AA domes as represented in Figures 14–18, show sample images of, what are, of course, rotational models that can be queried from all angles, as well as vertical view points, thus emulating the altitude the U.S. pilots might have flown. Moreover, subsets of these images could be developed that show only individual calibers (Figures 16 and 17)—a suitable tool to investigate the contribution each gun type made to the whole.
The 3D spatial visualization developed for Kiska represents ideal conditions, however, as it does not consider the effect of cloud cover, which was a major limiting factor encountered by U.S. aircrews, with the Aleutian Chain experiencing broken to overcast conditions for more than 90% of the time [60]. Moreover, while the 3D spatial visualization allowed for a dispassionate forensic analysis of the pros and cons of siting AA positions at a given terrain location, and thus their relative chances of
Figure 13. Extent of Japanese AA cover over Kiska soon after occupation, showing the extent to whichat least 1/2 ton of shell per minute could be brought to bear. Note the central inverted cone caused bythe fact that the AA had a maximum elevation of 85◦ (view from Southeast).
At the same time, the presence of Japanese warships in the harbor during the initial occupationphase provided additional platforms for AA. While this proved successful in shooting down a U.S.aircraft [14], it also put the same ships at risk, as they were priority targets for the U.S. attackers [14].Japanese doctrine favored that such vessels provide convoy protection and not floating AA platforms.Thus, their presence at Kiska was always time limited. In mid-June, the arrival of some of the transportsfrom the Midway Convoy brought additional AA weapons which could be effectively deployed toprovide a defensive umbrella (Figure 14). Thus, the entire harbor area was covered.
The AA umbrella could be expanded and deepened with the arrival of the IJA troops from Attu inmid-September 1942, who brought additional 75-mm AA batteries (Figure 15), adding to the intensityover the harbor, but also adding depth to the south and west.
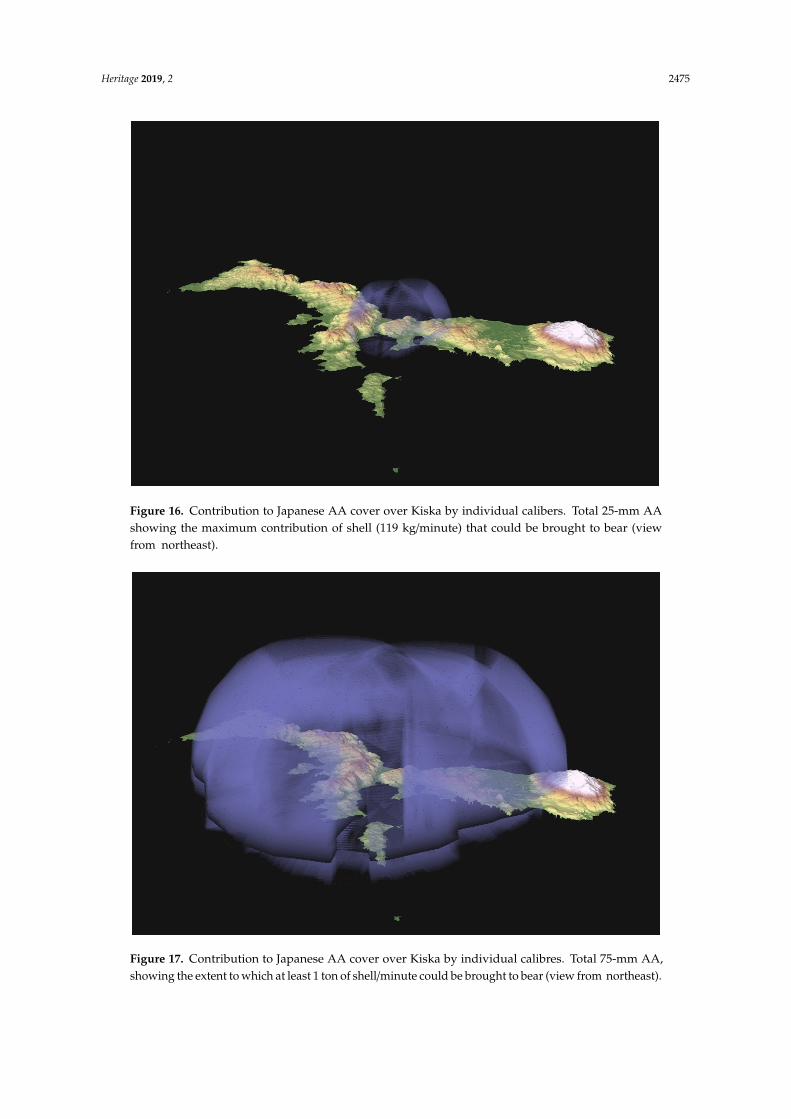
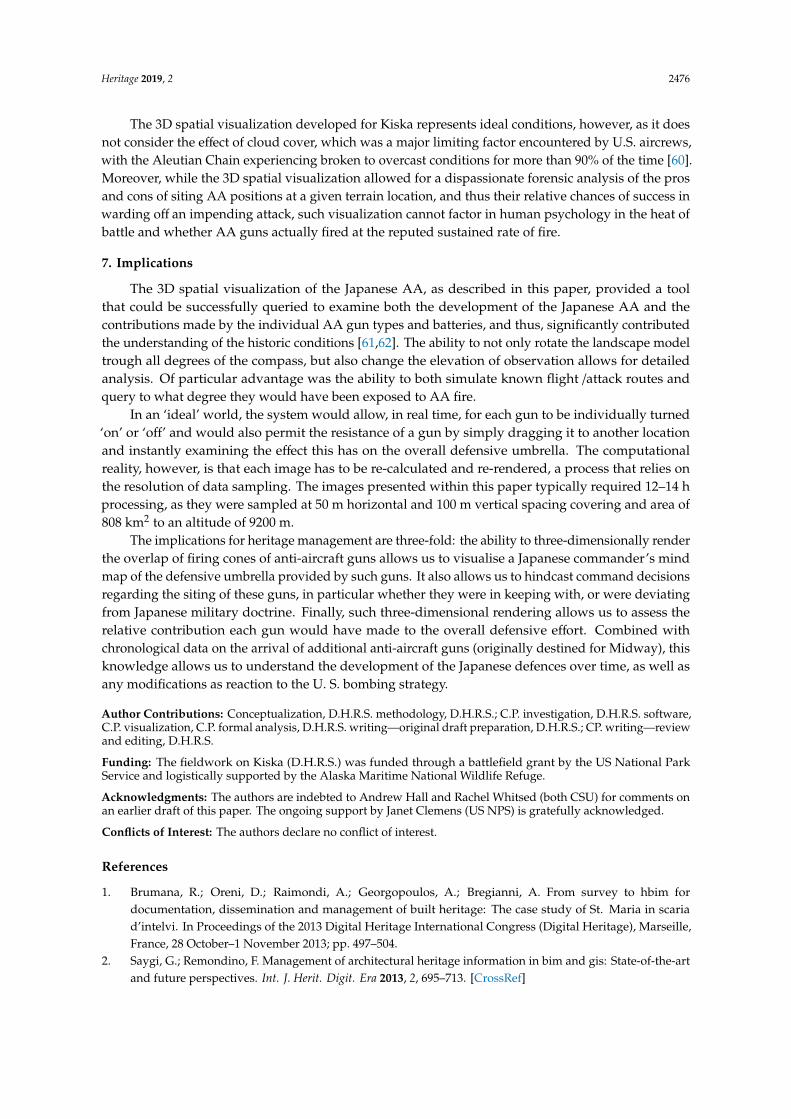
The static images of the AA domes as represented in Figures 14–17, show sample images of, whatare, of course, rotational models that can be queried from all angles, as well as vertical view points,thus emulating the altitude the U.S. pilots might have flown. Moreover, subsets of these images couldbe developed that show only individual calibers (Figures 16 and 17)—a suitable tool to investigate thecontribution each gun type made to the whole.
Heritage 2019, 2 2474
Heritage 2019, 2 FOR PEER REVIEW 18
success in warding off an impending attack, such visualization cannot factor in human psychology in the heat of battle and whether AA guns actually fired at the reputed sustained rate of fire.
Figure 14. Extent of Japanese AA cover over Kiska after the arrival of the Midway materiel, showing the extent to which at least 1 ton of shell per minute could be brought to bear. Note the central inverted cone caused by the fact that the AA had a maximum elevation of 85° (view from Southeast).
Figure 15. Extent of Japanese AA cover over Kiska at height of development. Total medium and heavy AA (25 mm, 75 mm and 120 mm), showing the extent to which at least 1 ton of shell per minute could be brought to bear. Note that deep structuring the AA removed the central inverted cone (view from Southeast).
Figure 14. Extent of Japanese AA cover over Kiska after the arrival of the Midway materiel, showingthe extent to which at least 1 ton of shell per minute could be brought to bear. Note the central invertedcone caused by the fact that the AA had a maximum elevation of 85◦ (view from Southeast).
Heritage 2019, 2 FOR PEER REVIEW 18
success in warding off an impending attack, such visualization cannot factor in human psychology in the heat of battle and whether AA guns actually fired at the reputed sustained rate of fire.
Figure 14. Extent of Japanese AA cover over Kiska after the arrival of the Midway materiel, showing the extent to which at least 1 ton of shell per minute could be brought to bear. Note the central inverted cone caused by the fact that the AA had a maximum elevation of 85° (view from Southeast).
Figure 15. Extent of Japanese AA cover over Kiska at height of development. Total medium and heavy AA (25 mm, 75 mm and 120 mm), showing the extent to which at least 1 ton of shell per minute could be brought to bear. Note that deep structuring the AA removed the central inverted cone (view from Southeast).
Figure 15. Extent of Japanese AA cover over Kiska at height of development. Total medium andheavy AA (25 mm, 75 mm and 120 mm), showing the extent to which at least 1 ton of shell per minutecould be brought to bear. Note that deep structuring the AA removed the central inverted cone (viewfrom Southeast).
Heritage 2019, 2 2475
Heritage 2019, 2 FOR PEER REVIEW 19
Figure 16. Contribution to Japanese AA cover over Kiska by individual calibers. Total 25-mm AA showing the maximum contribution of shell (119 kg/minute) that could be brought to bear (view from northeast).
Figure 17. Contribution to Japanese AA cover over Kiska by individual calibres. Total 75-mm AA, showing the extent to which at least 1 ton of shell/minute could be brought to bear (view from northeast).
Figure 16. Contribution to Japanese AA cover over Kiska by individual calibers. Total 25-mm AAshowing the maximum contribution of shell (119 kg/minute) that could be brought to bear (viewfrom northeast).
Heritage 2019, 2 FOR PEER REVIEW 19
Figure 16. Contribution to Japanese AA cover over Kiska by individual calibers. Total 25-mm AA showing the maximum contribution of shell (119 kg/minute) that could be brought to bear (view from northeast).
Figure 17. Contribution to Japanese AA cover over Kiska by individual calibres. Total 75-mm AA, showing the extent to which at least 1 ton of shell/minute could be brought to bear (view from northeast).
Figure 17. Contribution to Japanese AA cover over Kiska by individual calibres. Total 75-mm AA,showing the extent to which at least 1 ton of shell/minute could be brought to bear (view from northeast).
Heritage 2019, 2 2476
The 3D spatial visualization developed for Kiska represents ideal conditions, however, as it doesnot consider the effect of cloud cover, which was a major limiting factor encountered by U.S. aircrews,with the Aleutian Chain experiencing broken to overcast conditions for more than 90% of the time [60].Moreover, while the 3D spatial visualization allowed for a dispassionate forensic analysis of the prosand cons of siting AA positions at a given terrain location, and thus their relative chances of success inwarding off an impending attack, such visualization cannot factor in human psychology in the heat ofbattle and whether AA guns actually fired at the reputed sustained rate of fire.
7. Implications
The 3D spatial visualization of the Japanese AA, as described in this paper, provided a toolthat could be successfully queried to examine both the development of the Japanese AA and thecontributions made by the individual AA gun types and batteries, and thus, significantly contributedthe understanding of the historic conditions [61,62]. The ability to not only rotate the landscape modeltrough all degrees of the compass, but also change the elevation of observation allows for detailedanalysis. Of particular advantage was the ability to both simulate known flight /attack routes andquery to what degree they would have been exposed to AA fire.
In an ‘ideal’ world, the system would allow, in real time, for each gun to be individually turned‘on’ or ‘off’ and would also permit the resistance of a gun by simply dragging it to another locationand instantly examining the effect this has on the overall defensive umbrella. The computationalreality, however, is that each image has to be re-calculated and re-rendered, a process that relies onthe resolution of data sampling. The images presented within this paper typically required 12–14 hprocessing, as they were sampled at 50 m horizontal and 100 m vertical spacing covering and area of808 km2 to an altitude of 9200 m.
The implications for heritage management are three-fold: the ability to three-dimensionally renderthe overlap of firing cones of anti-aircraft guns allows us to visualise a Japanese commander’s mindmap of the defensive umbrella provided by such guns. It also allows us to hindcast command decisionsregarding the siting of these guns, in particular whether they were in keeping with, or were deviatingfrom Japanese military doctrine. Finally, such three-dimensional rendering allows us to assess therelative contribution each gun would have made to the overall defensive effort. Combined withchronological data on the arrival of additional anti-aircraft guns (originally destined for Midway), thisknowledge allows us to understand the development of the Japanese defences over time, as well asany modifications as reaction to the U. S. bombing strategy.
Author Contributions: Conceptualization, D.H.R.S. methodology, D.H.R.S.; C.P. investigation, D.H.R.S. software,C.P. visualization, C.P. formal analysis, D.H.R.S. writing—original draft preparation, D.H.R.S.; CP. writing—reviewand editing, D.H.R.S.
Funding: The fieldwork on Kiska (D.H.R.S.) was funded through a battlefield grant by the US National ParkService and logistically supported by the Alaska Maritime National Wildlife Refuge.
Acknowledgments: The authors are indebted to Andrew Hall and Rachel Whitsed (both CSU) for comments onan earlier draft of this paper. The ongoing support by Janet Clemens (US NPS) is gratefully acknowledged.
Conflicts of Interest: The authors declare no conflict of interest.
References
1. Brumana, R.; Oreni, D.; Raimondi, A.; Georgopoulos, A.; Bregianni, A. From survey to hbim fordocumentation, dissemination and management of built heritage: The case study of St. Maria in scariad’intelvi. In Proceedings of the 2013 Digital Heritage International Congress (Digital Heritage), Marseille,France, 28 October–1 November 2013; pp. 497–504.
2. Saygi, G.; Remondino, F. Management of architectural heritage information in bim and gis: State-of-the-artand future perspectives. Int. J. Herit. Digit. Era 2013, 2, 695–713. [CrossRef]
Heritage 2019, 2 2477
3. Oreni, D.; Brumana, R.; Georgopoulos, A.; Cuca, B. Hbim for conservation and management of built heritage:Towards a library of vaults and wooden bean floors. ISPRS Ann. Photogramm. Remote Sens. Spat. Inf. Sci.2013, 5. [CrossRef]
4. Fai, S.; Graham, K.; Duckworth, T.; Wood, N.; Attar, R. Building information modelling and heritagedocumentation. In Proceedings of the 23rd International Symposium, International Scientific Committee forDocumentation of Cultural Heritage (CIPA), Prague, Czech Republic, 12–16 September 2011; pp. 12–16.
5. Stefani, C.; De Luca, L.; Véron, P.; Florenzano, M. Reasoning about space-time changes: An approach formodeling the temporal dimension in architectural heritage. In Proceedings of the IADIS InternationalConference, Freiburg, Germany, 13–15 October 2008; pp. 287–292.
6. Grün, A.; Remondino, F.; Zhang, L. Photogrammetric reconstruction of the great buddha of bamiyan,afghanistan. Photogramm. Rec. 2004, 19, 177–199. [CrossRef]
7. Dore, C.; Murphy, M.; McCarthy, S.; Brechin, F.; Casidy, C.; Dirix, E. Structural simulations and conservationanalysis-historic building information model (hbim). Int. Arch. Photogramm. Remote Sens. Spat. Inf. Sci. 2015,40, 351. [CrossRef]
8. Khodeir, L.M.; Aly, D.; Tarek, S. Integrating hbim (heritage building information modeling) tools in theapplication of sustainable retrofitting of heritage buildings in egypt. Procedia Environ. Sci. 2016, 34, 258–270.[CrossRef]
9. Biagini, C.; Capone, P.; Donato, V.; Facchini, N. Towards the bim implementation for historical buildingrestoration sites. Autom. Constr. 2016, 71, 74–86. [CrossRef]
10. Oreni, D.; Brumana, R.; Della Torre, S.; Banfi, F.; Previtali, M. Survey turned into hbim: The restorationand the work involved concerning the basilica di collemaggio after the earthquake (l’aquila). ISPRS Ann.Photogramm. Remote Sens. Spatial Inf. Sci. 2014, 2, 267. [CrossRef]
11. Oreni, D.; Brumana, R.; Della Torre, S.; Banfi, F. Survey, hbim and conservation plan of a monumentalbuilding damaged by earthquake. Int. Arch. Photogramm. Remote Sens. Spat. Inf. Sci. 2017, 42, 337–342.[CrossRef]
12. Brusaporci, S.; Maiezza, P.; Tata, A. A framework for architectural heritage hbim semantization anddevelopment. Int. Arch. Photogramm. Remote Sens. Spat. Inf. Sci. 2018, 42, 179–184. [CrossRef]
13. Napolitano, R.K.; Scherer, G.; Glisic, B. Virtual tours and informational modeling for conservation of culturalheritage sites. J. Cult. Herit. 2018, 29, 123–129. [CrossRef]
14. Spennemann, D.H.R. The Cultural Landscape of the World War II Battlefield of Kiska, Aleutian Islands. Findingsof a Cultural Heritage Survey, Carried out in June 2009; Institute for Land, Water and Society, Charles SturtUniversity: Albury, Australia, 2011; p. 552.
15. Spennemann, D.H.R. The Present and Future Management of the Japanese Guns on Kiska I, Aleutians, Alaska.Conservation Management Plan. Study Prepared for the Us Fish and Wildlife Service, Alaska; Heritage FuturesAustralia: Shepparton, Australia, 2008.
16. Mobley, C. Cultural Resource Investigations at Kiska, Little Kiska, and Semisopochnoi, Aleutian Islands. ReportPrepared by Charles m. Mobley Associates, Anchorage, Alaska, Under Contract to Dames Moore, Anchorage Alaskafor the U.S. Army Corps of Engineers, Alaska District; Dames Moore: Anchorage, AK, USA, 1996.
17. Bleed, P.; Scott, D.D. Contexts for conflict: Conceptual tools for interpreting archaeological reflections ofwarfare. J. Confl. Archaeol. 2011, 6, 42–64. [CrossRef]
18. Fonzo, S. Key Terrain; Observation and Fields of Fire; Cover and Concealment; Obstacles; and Avenues of Approachand Retreat at the Battle of Buckland Mills 19 October 1863; Fauquier County Administration: Warrenton, VA,USA, 2008.
19. Vicksburg. Vicksburg National Military Park, Vicksburg, Mississippi. Cultural Landscape Report. Chapter 5 Ocoka;National Park Service, Southeast Regional Office: Atlanta, GA, USA, 2009.
20. Maio, C.V.; Tenenbaum, D.E.; Brown, C.J.; Mastone, V.T.; Gontz, A.M. Application of geographic informationtechnologies to historical landscape reconstruction and military terrain analysis of an american revolutionbattlefield: Preservation potential of historic lands in urbanized settings, boston, massachusetts, USA. J. Cult.Herit. 2013, 14, 317–331. [CrossRef]
21. Parshall, J.; Tully, A. Shattered Sword: The Untold Story of the Battle of Midway; Potomac Books: Dulles, VA,USA, 2005.
22. Cloe, J.H. The Aleutian Warriors: A History of the 11th Air Force and Fleet Air Wing 4; Pictorial HistoriesPublishing Co.: Missoula, MO, USA, 1990.
Heritage 2019, 2 2478
23. Spennemann, D.H.R.; Clemens, J.; Kozlowski, J. Scars on the tundra: The cultural landscape of the kiskabattlefield, aleutians. Alsk. Park Sci. 2011, 10, 16–21.
24. HQ AA AC. Japanese aa Defenses of Kiska; AA-2 Section; Headquarters Anti-Aircraft Artillery Command,E.D.C: Fort Trotten, NY, USA, 1944.
25. Spennemann, D.H.R. The Remains of a Japanese Plane at Salmon Lagoon, Kiska Island, Aleutian Chain, Alaska.Identification and Condition Assessment. Report Prepared for the us National Park Service and the Us Fish andWildlife Service, Alaska; Institute for Land, Water and Society, Charles Sturt University: Albury, Australia,2009.
26. OPNAV. Japanese Antiaircraft Coastal Defense Guns; Air Intelligence Group, Division of Naval Intelligence,Office of the Chief of Naval Operations, Navy Department: Washington, DC, USA, 1945.
27. CinCPac-CinCPOA. Japanese Anti-Aircraft Materiel. Flak Intelligence Memorandum n◦ 4; United States PacificFleet and Pacific Ocean Areas: Washington, DC, USA, 1945.
28. Unit, P.I. Japanese Antiaircraft Coastal Defense Positions. October 1, 1943; Photographic Interpretation Unit; U.S.Navy: Anacostia, DC, USA, 1943.
29. CinCPac-CinCPOA. Table of characteristics of principal weapons. translation of captured japanese documentjicpoa item 7164, captured at kwajalein atoll. Jicpoa serial and-191355, 19 june 1944. CinCPac-CinCPOA Spec.Transl. 1944, 61, 1–12.
30. Payne, I.P. The Enemy on Kiska. Us Naval Intelligence, Section g-2. Ac/g-2; Advance Command Post, Hdqtrs.Alaska Defense Command, and Advance Intelligence Center, North Pacific Area: Adak, AK, USA, 1943.
31. Wheatley, D.; Gillings, M. Spatial Technology and Archaeology: The Archaeological Applications of Gis; CRC Press:Boca Raton, FL, USA, 2013.
32. González-Tennant, E. Recent directions and future developments in geographic information systems forhistorical archaeology. Hist. Archaeol. 2016, 50, 24–49. [CrossRef]
33. Verhagen, P.; Drăgut, L. Object-based landform delineation and classification from dems for archaeologicalpredictive mapping. J. Archaeol. Sci. 2012, 39, 698–703. [CrossRef]
34. Kamermans, H.; Van Leusen, M.; Verhagen, P. Archaeological Prediction and Risk Management; Leiden University:Leiden, The Netherlands, 2009.
35. Romão, X.; Paupério, E.; Pereira, N. A framework for the simplified risk analysis of cultural heritage assets. J.Cult. Herit. 2016, 20, 696–708. [CrossRef]
36. Kaimaris, D.; Sylaiou, S.; Georgoula, O.; Patias, P. Gis of landmarks management. J. Cult. Herit. 2011, 12,65–73. [CrossRef]
37. Rodríguez-Gonzálvez, P.; Muñoz-Nieto, A.L.; Pozo, S.D.; Sanchez-Aparicio, L.J.; Gonzalez-Aguilera, D.;Micoli, L.; Barsanti, S.G.; Guidi, G.; Mills, J.; Fieber, K.; et al. 4D Reconstruction and Visualization of CulturalHeritage: Analyzing Our Legacy Through Time; Copernicus GmbH: Gottingen, Germany, 2017; pp. 609–616.
38. Sansoni, G.; Trebeschi, M.; Docchio, F. State-of-the-art and applications of 3d imaging sensors in industry,cultural heritage, medicine, and criminal investigation. Sensors 2009, 9, 568–601. [CrossRef]
39. Alexakis, D.; Sarris, A.; Astaras, T.; Albanakis, K. Integrated gis, remote sensing and geomorphologicapproaches for the reconstruction of the landscape habitation of thessaly during the neolithic period. J.Archaeol. Sci. 2011, 38, 89–100. [CrossRef]
40. Meyer, É.; Grussenmeyer, P.; Perrin, J.-P.; Durand, A.; Drap, P. A web information system for the managementand the dissemination of cultural heritage data. J. Cult. Herit. 2007, 8, 396–411. [CrossRef]
41. Gheyle, W.; Dossche, R.; Bourgeois, J.; Stichelbaut, B.; Van Eetvelde, V. Integrating archaeology and landscapeanalysis for the cultural heritage management of a World War I militarised landscape: The german fielddefences in antwerp. Landsc. Res. 2014, 39, 502–522. [CrossRef]
42. Stichelbaut, B. The application of great war aerial photography in battlefield archaeology: The example offlanders. J. Confl. Archaeol. 2005, 1, 235–243. [CrossRef]
43. McNutt, R.K. Finding Forgotten Fields: A Theoretical and Methodological Framework for Historic LandscapeReconstruction and Predictive Modelling of Battlefield Locations in Scotland, 1296–1650. Ph.D. Thesis,University of Glasgow, Glasgow, UK, 2014.
44. Janata, T.; Zimová, R. Using gis and methods of digital cartography for analyzing battlefield engravings of17th century. Geoinformat. FCE CTU 2016, 15, 47–59. [CrossRef]
45. Nolan, T.J. Battlefield Landscapes: Geographic Information Science as a Method of Integrating History andArchaeology for Battlefield Interpretation. Ph.D. Thesis, Texas State University, San Marcos, TX, USA, 2007.
Heritage 2019, 2 2479
46. Selig, R.A.; Harris, M.; Catts, W.P. Archaeology, computer technology, and the battle of princeton as across-cultural, trans-atlantic encounter. In The Archaeology of Interdependence; Springer: Berlin/Heidelberg,Germany, 2013; pp. 15–39.
47. Smith, S.D.; Clement, C.O.; Wise, S.R. Gps, gis and the civil war battlefield landscape: A south carolina lowcountry example. Hist. Archaeol. 2003, 37, 14–30. [CrossRef]
48. Knowles, A.K.; Roush, W.; Abshere, C.; Farrell, L.; Feinberg, A.; Humber, T. What Could Lee See at Gettysburg;Esri Press: Beijing, China, 2008; pp. 235–266.
49. Wittek, P.; Rubio-Campillo, X. Military reconstructive simulation in the cloud to aid battlefield excavations.In Proceedings of the 4th IEEE International Conference on Cloud Computing Technology and ScienceProceedings, Taipei, Taiwan, 3–6 December 2012; pp. 869–874.
50. Campillo, X.R.; Cela, J.M.; Cardona, F.X.H. Simulating archaeologists? Using agent-based modelling toimprove battlefield excavations. J. Archaeol. Sci. 2012, 39, 347–356. [CrossRef]
51. Unver, E.; Taylor, A. Virtual Stonehenge Reconstruction; Euro-Mediterranean Conference; Springer:Berlin/Heidelberg, Germany, 2012; pp. 449–460.
52. Gruen, A. Reality-based virtual models in cultural heritage. In Archaeologizing Heritage? Springer:Berlin/Heidelberg, Germany, 2013; pp. 109–126.
53. Wüst, T.; Nebiker, S.; Landolt, R. Applying the 3d gis dilas to archaeology and cultural heritage projectsrequirements and first results. Int. Arch. Photogramm. Remote Sens. Spat. Inf. Sci. 2004, 35, 407–412.
54. Darlington, J. Battlefield interpretation: The Creation of a Program Design Document Utilising 3d VisualisationTechniques for use in the Investigation and Exploration of Historic Conflict. Master’s Thesis, University ofHuddersfield, Huddersfield, UK, 2012.
55. Shephard, N. Using 3d Volumetric Analysis Techniques in Arcgis 10; ArcUser: Redlands, CA, USA, 2010;pp. 7–12.
56. NASA. Aster—Advanced Spaceborne Thermal Emission and Reflection Radiometer; Jet Propulsion Laboratory:Pasadena, CA, USA, 2004.
57. Spennemann, D.H.R. Interpreting wwii intelligence data for cultural heritage studies. J. Confl. Archaeol. 2012,7, 105–132. [CrossRef]
58. Photographic Interpretation Unit 11th AAF. ‘Kiska Island’ Sheet n◦ 20. Second Edition 28 July 1943. Based onKiska Map by Corps of Engineers, U.S. Army; Photographic Interpretation Unit, Advanced Intelligence Center,North Pacific Force and Photographic Intelligence section A-2, 11th Air Force: Anchorage, AK, USA, 1943.
59. JICPOA. Gilbert Area Defense Force Order. Gilbert Area Defense Force Secret Order #8. Dated Tarawa (Kiribati) 15September 1943. Translation of Captured Japanese Document. Captured Tarawa 24 November 1943, Received Jicpoa11 dec 1943. Jicpoa Item 5067; Australian War Memorial: Canberra, Australia, 1943.
60. Fett, R.W.; Englebretson, R.E.; Perryman, D. Forecasters Handbook for the Bering Sea, Aleutian Islands, and Gulf ofAlaska; U.S. Naval Research Laboratory: Washington, DC, USA, 1993.
61. Spennemann, D.H.R. The use of 3-d spatial visualisation in the interpretation of the World War II battlefieldof kiska. Int. J. Mil. Hist. 2017, 37, 201–222. [CrossRef]
62. Spennemann, D.H.R. Dead reckoning: Bombing kiska through the clouds. Sabretache 2017, 58, 26–36.
© 2019 by the authors. Licensee MDPI, Basel, Switzerland. This article is an open accessarticle distributed under the terms and conditions of the Creative Commons Attribution(CC BY) license (http://creativecommons.org/licenses/by/4.0/).