using bayesian networks to analyze expression data · using bayesian networks to analyze expression...
TRANSCRIPT

Using Bayesian Networks to Analyze Expression
Data
Xu Siwei, s0789023Muhammad Ali Faisal, s0677834
Tejal Joshi, s0677858
Outline Introduction Bayesian Networks Equivalence Classes Applying to Expression data Experimental Analysis Discussion & Future work
Biological Background
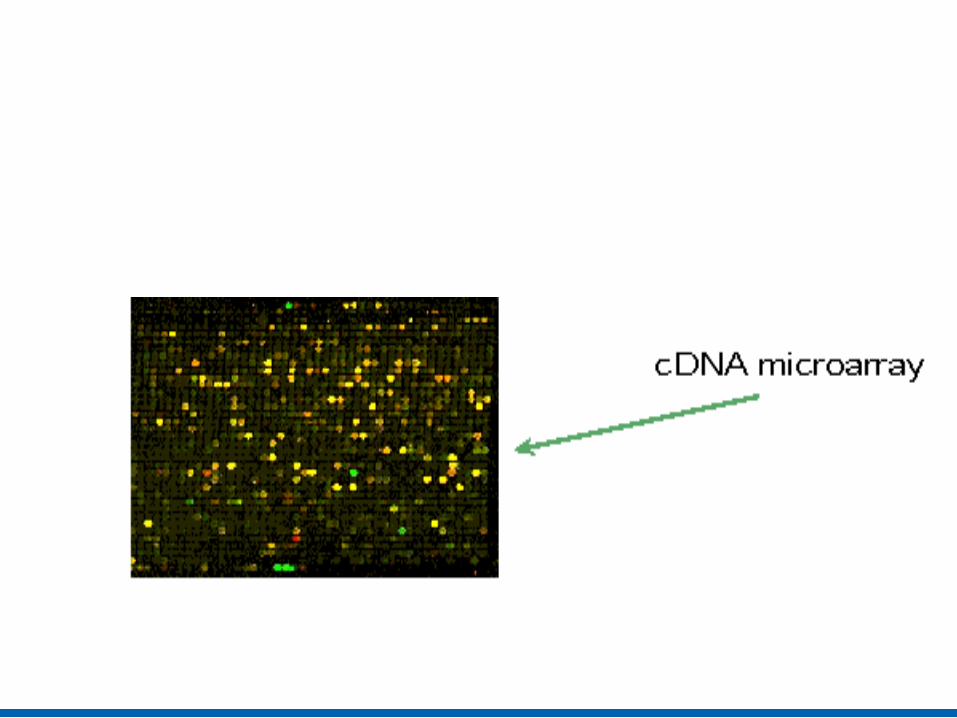
Recently developed technologies (e.g. DNA microarrays) allow parallel measurement of the expression level of thousands of genes/proteins
This allow biologists to view the cell as a complete system

Challenge Extracting meaningful information from
the expression data: Infer regulatory mechanisms Reveal function of proteins
Experiment planning
Prior Work Clustering of expression data
Groups together genes with similar expression patterns Disadvantage: does not reveal structural relations
between genes
Boolean Network Deterministic models of the logical interactions between
genes Disadvantage: Deterministic, impractical for real data
Outline Introduction Bayesian Networks Equivalence Classes Applying to Expression data Experimental Analysis Discussion & Future work

Bayesian Networks A BN is a graphical representation of a joint
probability distribution Advantages:
Useful for describing processes composed of locally interacting components
Statistical foundations for learning BN from observations, and computational algorithms to do so are well understood and successfully used
Provide models of causal influence Capable of handling noise and estimating the
confidence in the different feature of the networks.

Informal Introduction to BN
Each variable is described as a stochastic function of its parents The biological processes we want to model are stochastic The measurements of the underlying biological system are noisy

Representing Distributions with BN
Representation G, a directed acyclic graph Describes a conditional distribution on each variable,
given G Markov Assumption: Product form: Generally: BNs are flexible and can accommodate
many forms of conditional distribution, including various continuous model
Learning BNs Common approach Efficient algorithms exist for learning a BN
from data Learning a BN can:
Reveal underlying structure of domain Direct relations between variable Find causal influence Discover hidden variables
Learning Causal Patterns
Why? The difference between causal network and BN:
Causal network interprets the parents of a variable as its immediate cause
Causal Markov Assumption: given the values of a variable’s immediate causes, it is independent of its earlier causes
X→Y≠X←Y
Outline Introduction Bayesian Networks Equivalence Classes Applying to Expression data Experimental Analysis Discussion & Future work
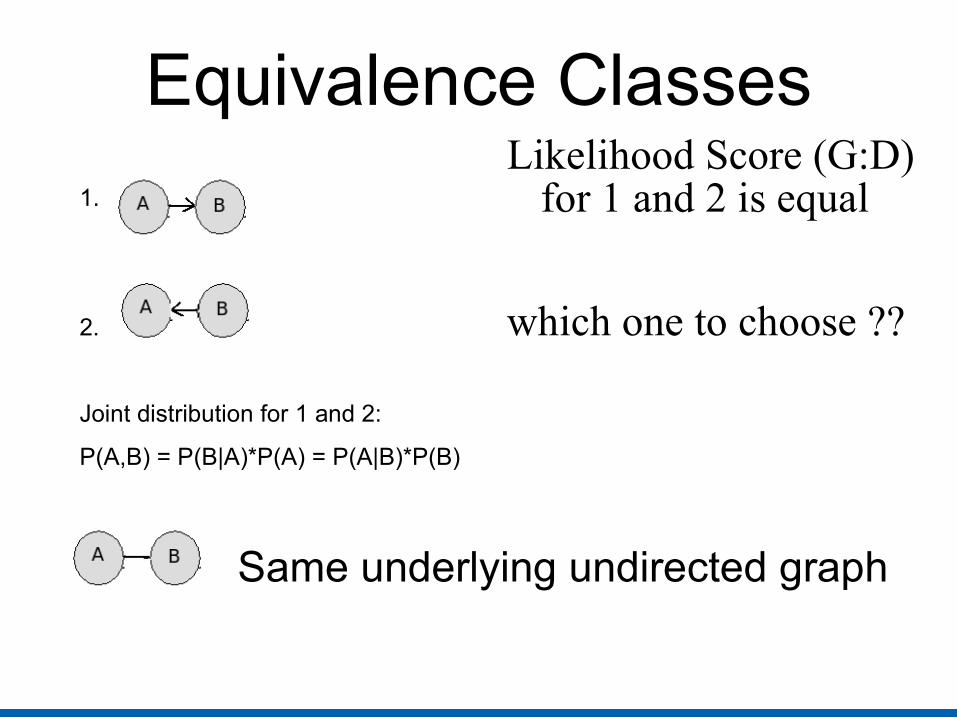
Equivalence ClassesLikelihood Score (G:D)
for 1 and 2 is equal
which one to choose ??
1.
2.
Joint distribution for 1 and 2:
P(A,B) = P(B|A)*P(A) = P(A|B)*P(B)
Same underlying undirected graph

Equivalent Classes... cont For equivalent networks DAGs have the same underlying undirected graphs PDAGS are used to represent them

Outline Introduction Bayesian Networks Equivalence Classes Applying to Expression data Experimental Analysis Discussion & Future work

Applying to expression data
Images taken from: (Werhli, et al., 2006 Comparative Analysis of Graphical Modelling techniques: BioSS Scotland)
E.g.: Flow cytometry
experiments

Applying to expression data
Images taken from: (Werhli, et al., 2006 Comparative Analysis of Graphical Modelling techniques: BioSS Scotland)
possibly completely unknown
Machine Learning
Statistical methods
Applying to expression data
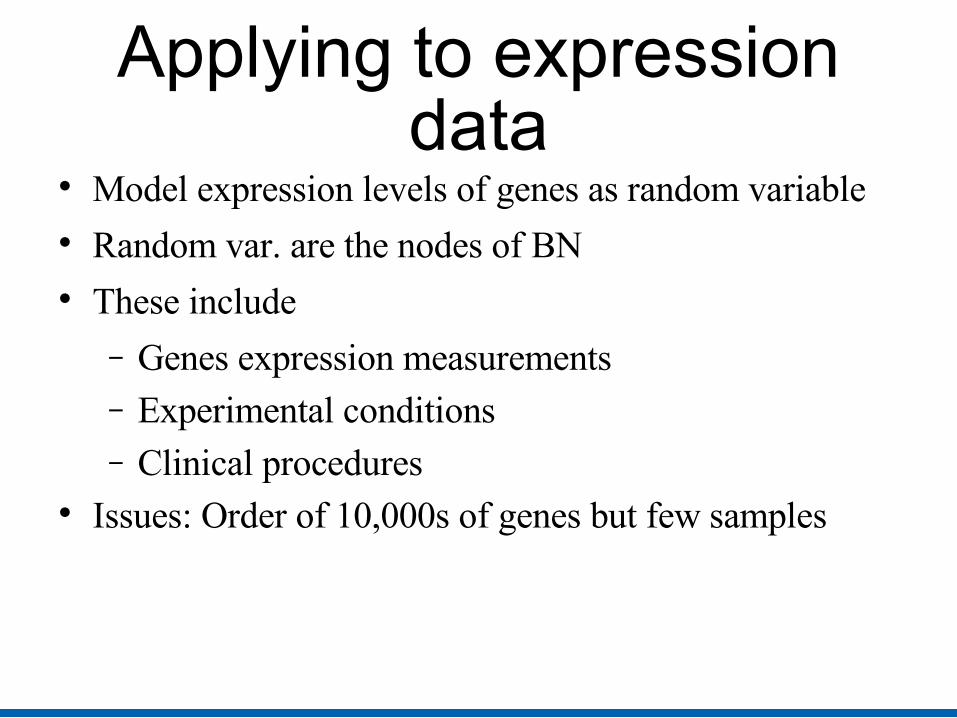
Model expression levels of genes as random variable Random var. are the nodes of BN These include
− Genes expression measurements− Experimental conditions− Clinical procedures
Issues: Order of 10,000s of genes but few samples
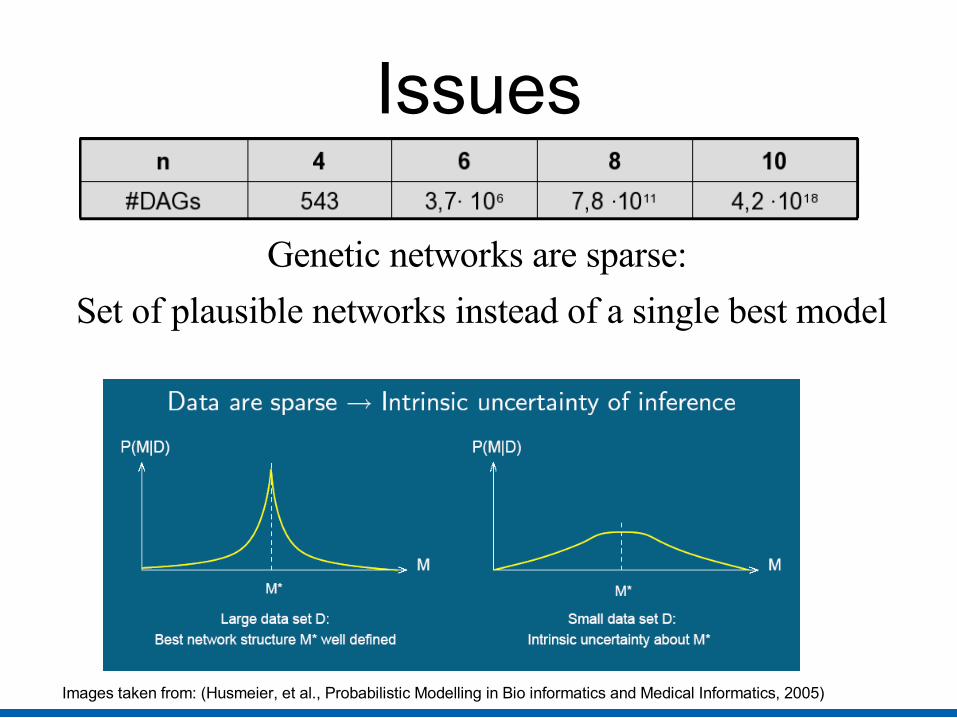
Issues
Genetic networks are sparse:
Set of plausible networks instead of a single best model
Images taken from: (Husmeier, et al., Probabilistic Modelling in Bio informatics and Medical Informatics, 2005)

Solution: Feature Modelling
Learn Common features in plausible networks instead of predicting the whole regulatory networks
2 different “Common Features”− Markov Relations (Biological interaction process)
Local Property
− Order Relations (Causality) Global Property
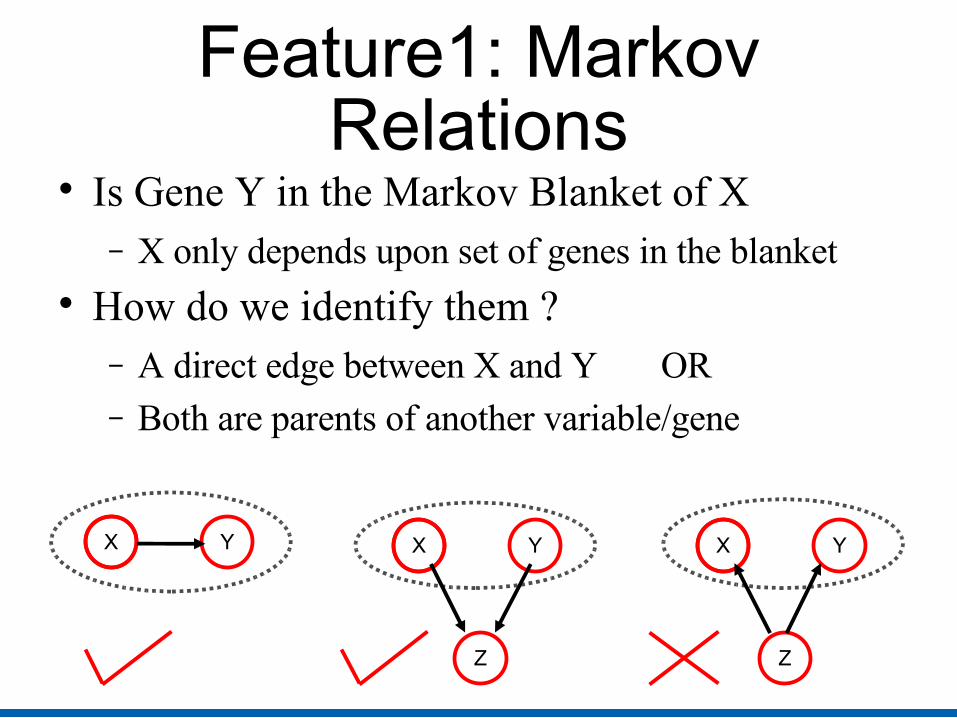
Feature1: Markov Relations
Is Gene Y in the Markov Blanket of X− X only depends upon set of genes in the blanket
How do we identify them ?− A direct edge between X and Y OR− Both are parents of another variable/gene
X Y
Z
X Y
Z
X Y
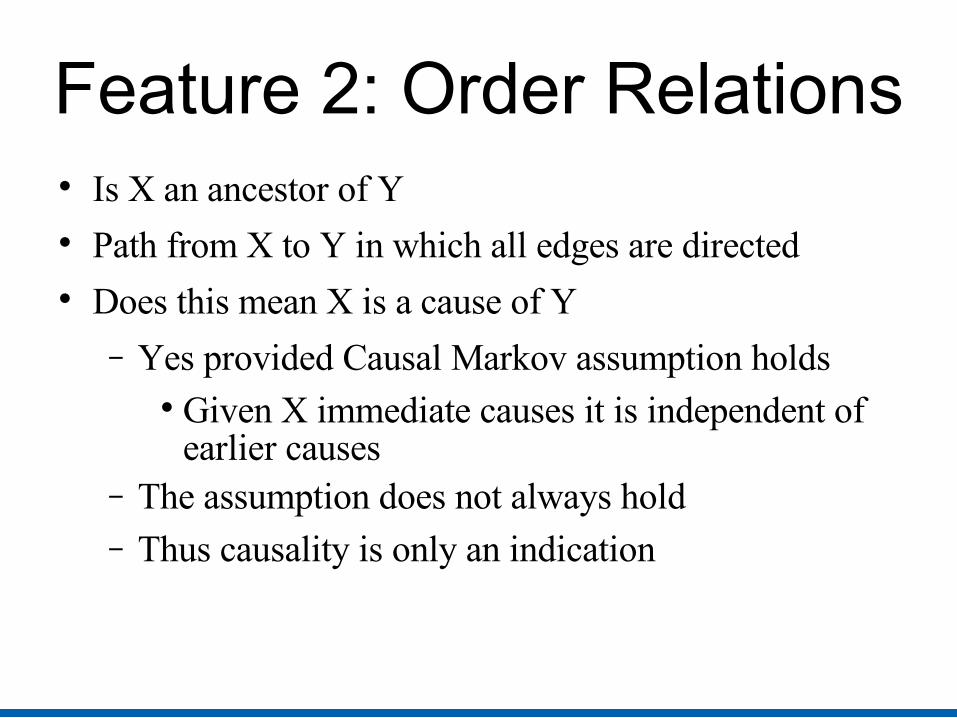
Feature 2: Order Relations Is X an ancestor of Y Path from X to Y in which all edges are directed Does this mean X is a cause of Y
− Yes provided Causal Markov assumption holds Given X immediate causes it is independent of
earlier causes− The assumption does not always hold− Thus causality is only an indication
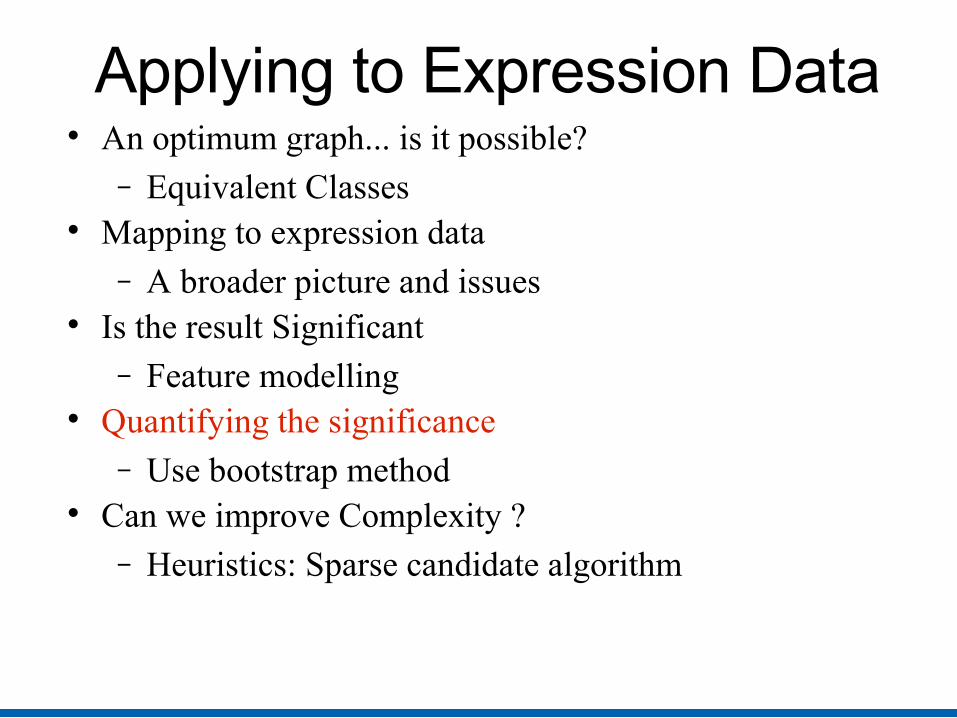
Applying to Expression Data An optimum graph... is it possible?
− Equivalent Classes Mapping to expression data
− A broader picture and issues Is the result Significant
− Feature modelling Quantifying the significance
− Use bootstrap method Can we improve Complexity ?
− Heuristics: Sparse candidate algorithm
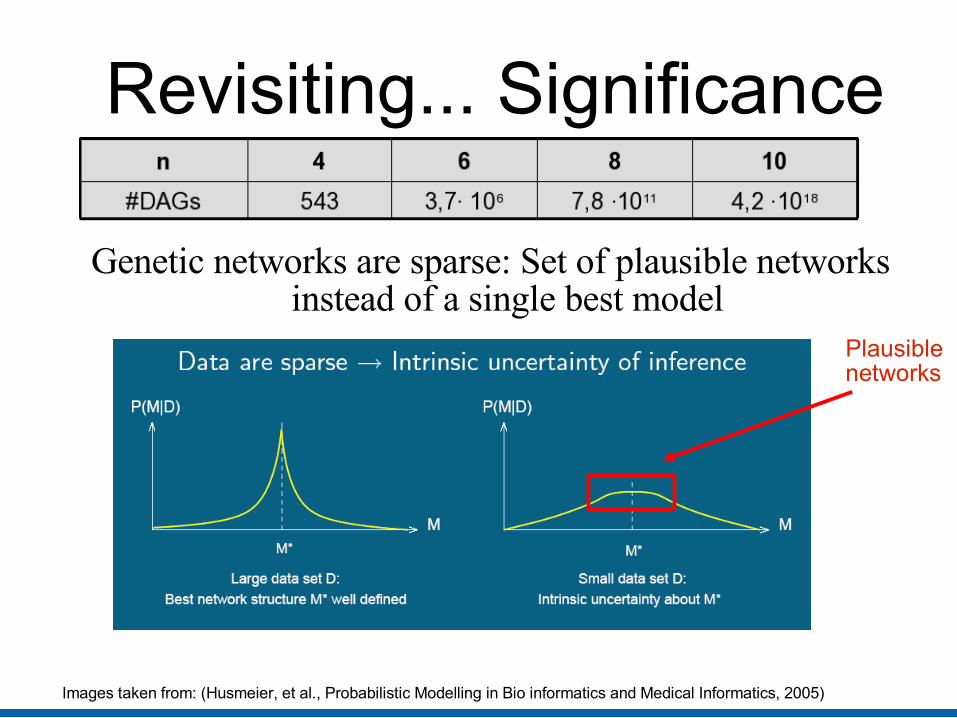
Revisiting... Significance
Genetic networks are sparse: Set of plausible networks instead of a single best model
Images taken from: (Husmeier, et al., Probabilistic Modelling in Bio informatics and Medical Informatics, 2005)
Plausiblenetworks

Quantifying significance Ideally we should compute
P( f |D ) = ΣG f(G)P(G|D)
f(G) = 1 if G satisfies the feature 0 otherwise
But plausible G are v.high A Heuristic - Bootstrap method (Efron et al, 1993)
for i = 1 to m (m=200)Re sample with replacement, N instances from D – D
i
Apply learning procedure on Di to produce G
i
for each featureconfidence C(f) = 1/m Σm
i=1 f(G
i)
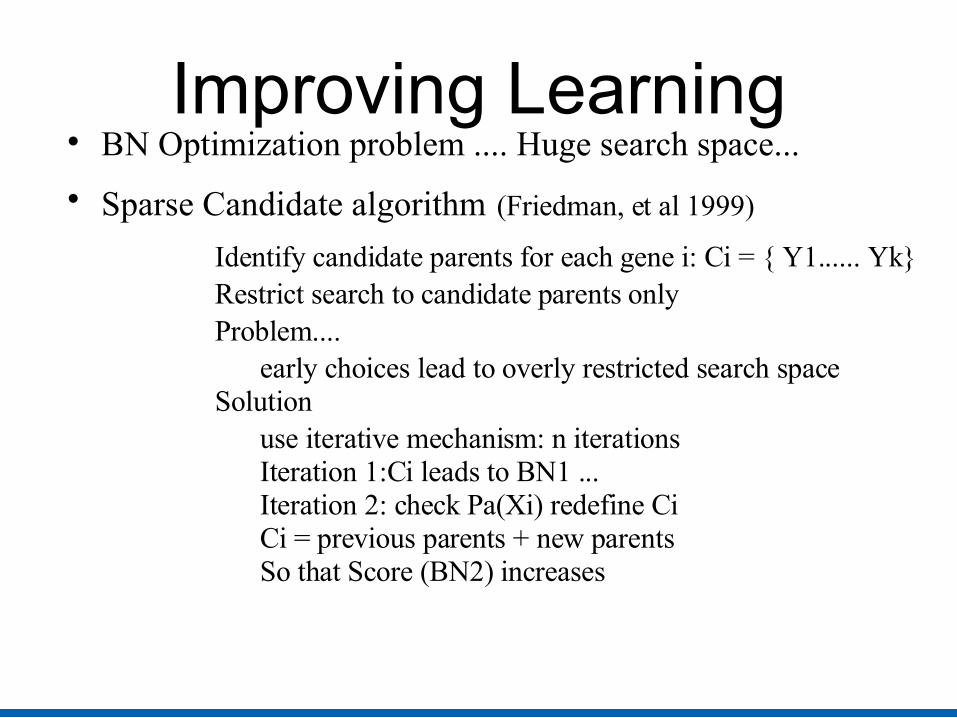
Improving Learning BN Optimization problem .... Huge search space...
Sparse Candidate algorithm (Friedman, et al 1999)
Identify candidate parents for each gene i: Ci = { Y1...... Yk}Restrict search to candidate parents onlyProblem....
early choices lead to overly restricted search spaceSolution
use iterative mechanism: n iterationsIteration 1:Ci leads to BN1 ... Iteration 2: check Pa(Xi) redefine CiCi = previous parents + new parentsSo that Score (BN2) increases

Outline Introduction Bayesian Networks Equivalence Classes Applying to Expression data Experimental Analysis Discussion & Future work
Experimental Analysis• Dataset• Robustness analysis• Biological Analysis

Dataset• 800 genes of S. Cerevisiae (Yeast) at various cell-cycle
stages• Each gene has 76 expression levels• Discretized gene expression values according to
threshold Under expressed (-1), Normal (0), Over expressed (1)
• Bayesian Network having 800 + a root variable (representing cell-cycle phase)
• Sparse candidate algorithm with 200-fold bootstrap• Computation of confidence in predictions
Robustness Analysis• Testing credibility of confidence estimates
– Perturbations in dataset – Addition of genes in dataset– Change of threshold
Robustness Analysis
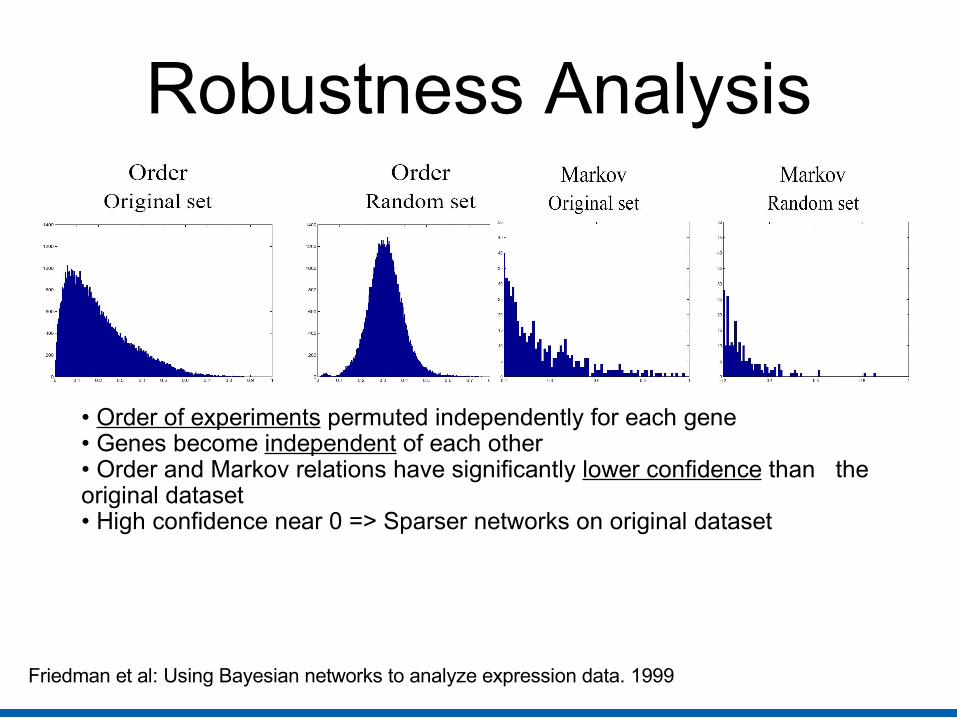
• Order of experiments permuted independently for each gene• Genes become independent of each other• Order and Markov relations have significantly lower confidence than the original dataset• High confidence near 0 => Sparser networks on original dataset
Friedman et al: Using Bayesian networks to analyze expression data. 1999
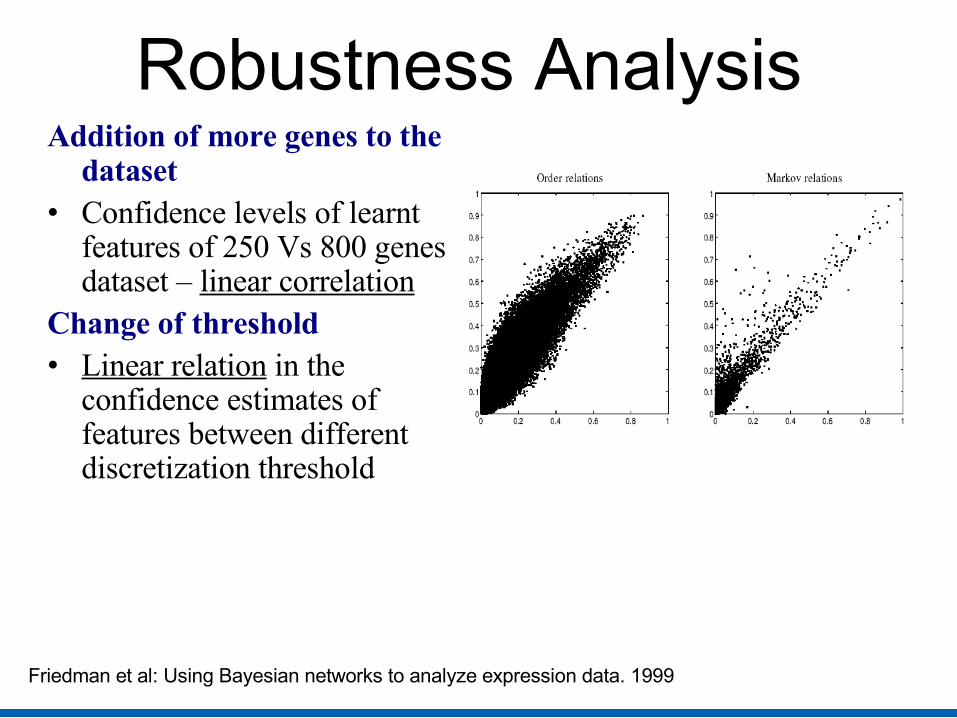
Robustness Analysis Addition of more genes to the
dataset • Confidence levels of learnt
features of 250 Vs 800 genes dataset – linear correlation
Change of threshold• Linear relation in the
confidence estimates of features between different discretization threshold
Friedman et al: Using Bayesian networks to analyze expression data. 1999
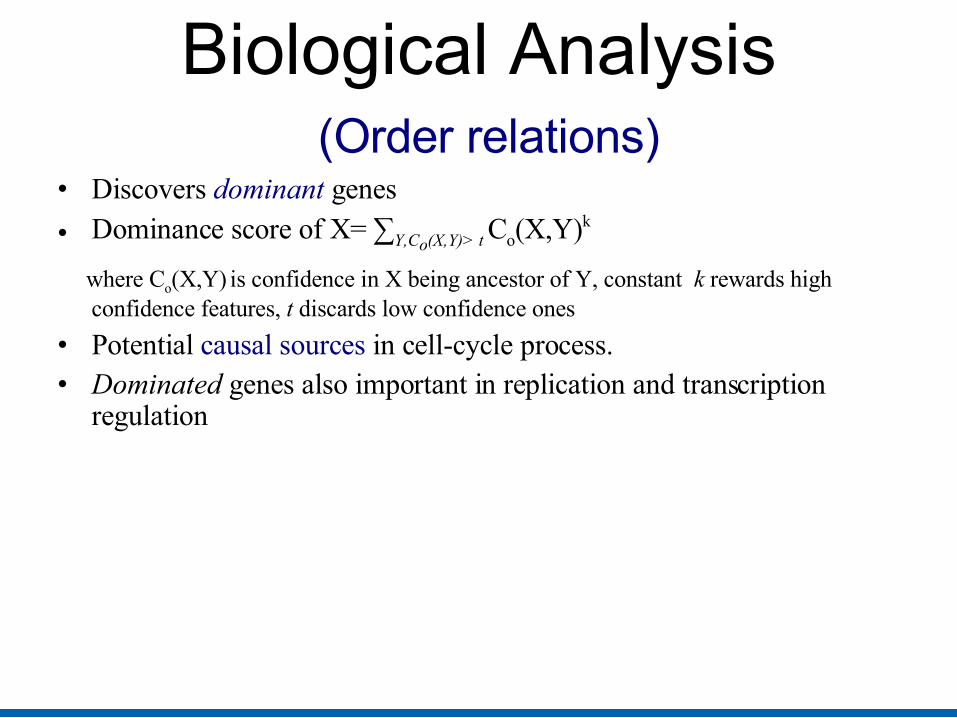
Biological Analysis (Order relations)
• Discovers dominant genes
• Dominance score of X= ∑Y,Co(X,Y)> t Co(X,Y)k
where Co(X,Y) is confidence in X being ancestor of Y, constant k rewards high confidence features, t discards low confidence ones
• Potential causal sources in cell-cycle process. • Dominated genes also important in replication and transcription
regulation

Image from Friedman et al: Using Bayesian networks to analyze expression data. 1999
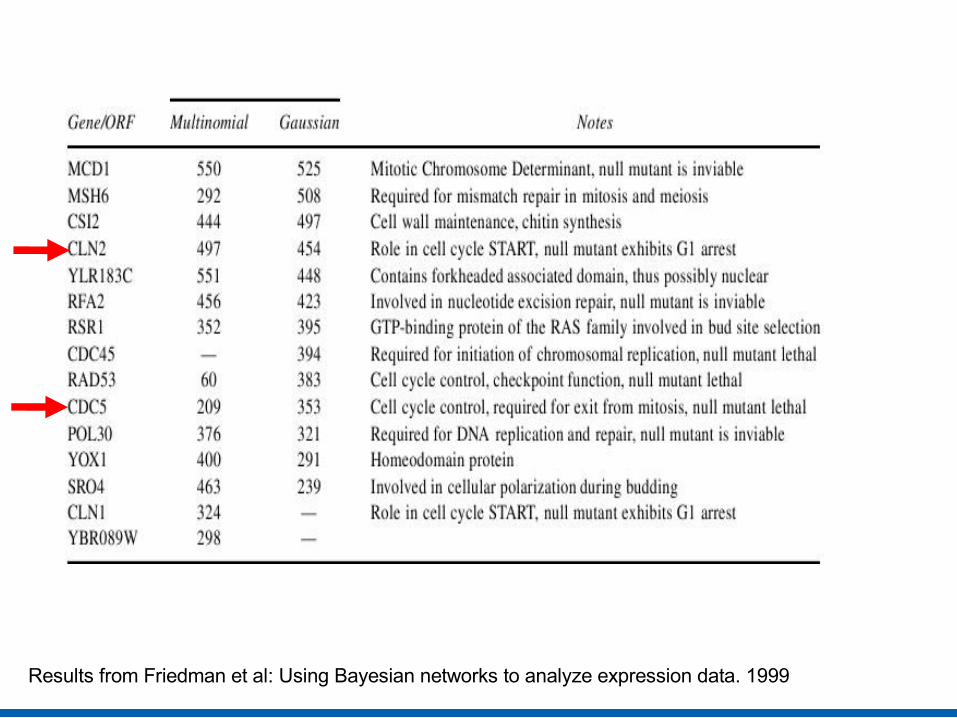
Results from Friedman et al: Using Bayesian networks to analyze expression data. 1999
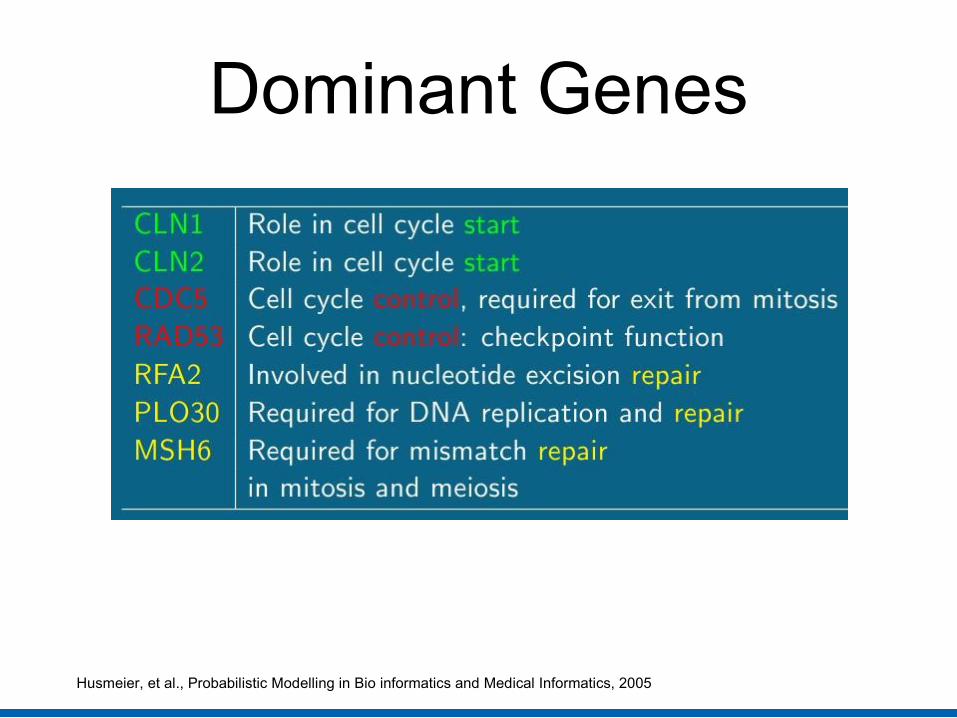
Dominant Genes
Husmeier, et al., Probabilistic Modelling in Bio informatics and Medical Informatics, 2005
Biological Analysis (Markov relations)
Pairs of genes related in joint biological interaction 1) Pairs of functionally related known genes (50% of pairs) 2) Unknown-known pairs – Firm homologies between known and other
unknown gene 3) Unknown gene pairs were physically adjacent to each other on the
chromosome, and so regulated by same mechanism
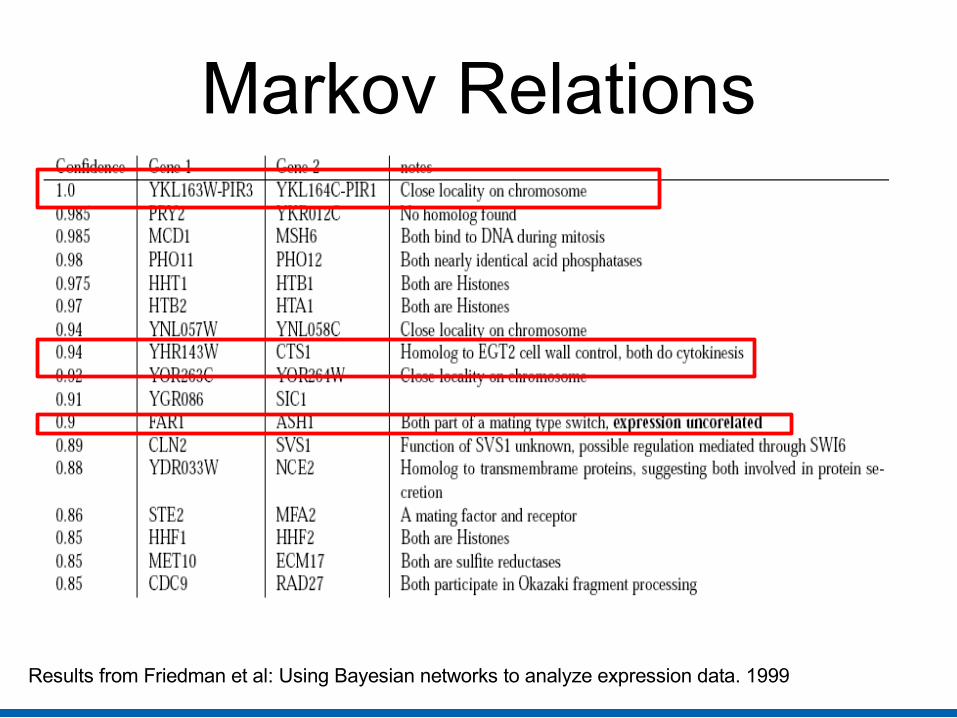
Markov Relations
Results from Friedman et al: Using Bayesian networks to analyze expression data. 1999

Image from Friedman et al: Using Bayesian networks to analyze expression data. 1999
Summary• Successful and novel application of Bayesian networks
for gene expression analysis• Discretized gene expression data, based on
multinomial distribution • Discovers biologically significant dependencies, gene
interactions and positive correlation• Overcomes clustering by discovering relationship
between genes having lower correlation• Uses no prior biological knowledge
Future Work• Incorporation of biological knowledge• Time phase as a root of network – how about time-series data ?
(Murphy et. al)• Can we identify hidden causes of regulations - such as protein
activation/inhibition ?• Learning causality based on interventions rather than
observations (knock-out experiments) (Cooper & Yoo)• Improvement of search heuristics and confidence estimation

Thank You

???