using california maternity data to drive quality improvement
TRANSCRIPT

Using California Maternity Datato Drive Quality Improvement
Elliott Main, MD Jeffrey Gould, MD MPHMedical Director, CMQCC Medical Director, CPQCCmain@ .org [email protected] Professor, OB/GYNProfessor, Pediatrics andUC San Francisco, andStanford University
NeonatologyStanford University 11

CPQCC and CMQCCMission: Improving care for moms and newbornsCalifornia Perinatal Quality Care Collaborative (CPQCC) Expertise in data capture from hospitals Established Neonatal Database in 1996 Data use agreements in place with 130 hospitals with NICUs Model of working with state agencies to provide data of value
California Maternal Quality Care Collaborative (CMQCC) Expertise in maternal data analysis Developer of maternal QI toolkits Host of collaborative learning communities Established Maternal Data Center in 2011
: Transforming Maternity Care

CMQCC Key Partner/StakeholdersState Agencies: MCAH, Dept Public Health OSHPD Healthcare Information Division Office of Vital Records (OVR) Regional Perinatal Programs of California (RPPC) DHCS, Medi-CalPublic and Consumer Groups California Hospital Accountability and Reporting Taskforce (CHART) California HealthCare Foundation Kaiser Family Foundation March of Dimes (MOD)Professional groups American College of Obstetrics and Gynecology (ACOG) Association of Women’s Health, Obstetric and Neonatal Nurses (AWHONN) American College of Nurse Midwives (ACNM), American Academy of Family Physicians (AAFP)Key Medical and Nursing Leaders Universities and Hospital Systems Kaisers, Sutter, Sharp, Dignity, Scripps, Providence, Public hospitals,
: Transforming Maternity Care
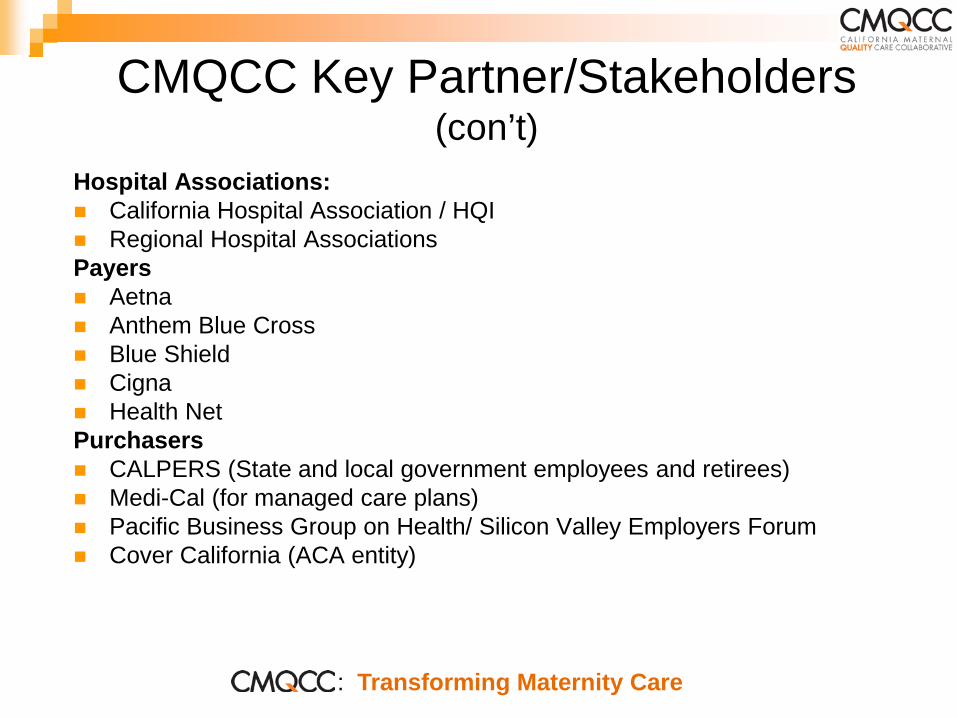
CMQCC Key Partner/Stakeholders(con’t)
Hospital Associations: California Hospital Association / HQI Regional Hospital AssociationsPayers Aetna Anthem Blue Cross Blue Shield Cigna Health NetPurchasers CALPERS (State and local government employees and retirees) Medi-Cal (for managed care plans) Pacific Business Group on Health/ Silicon Valley Employers Forum Cover California (ACA entity)
: Transforming Maternity Care
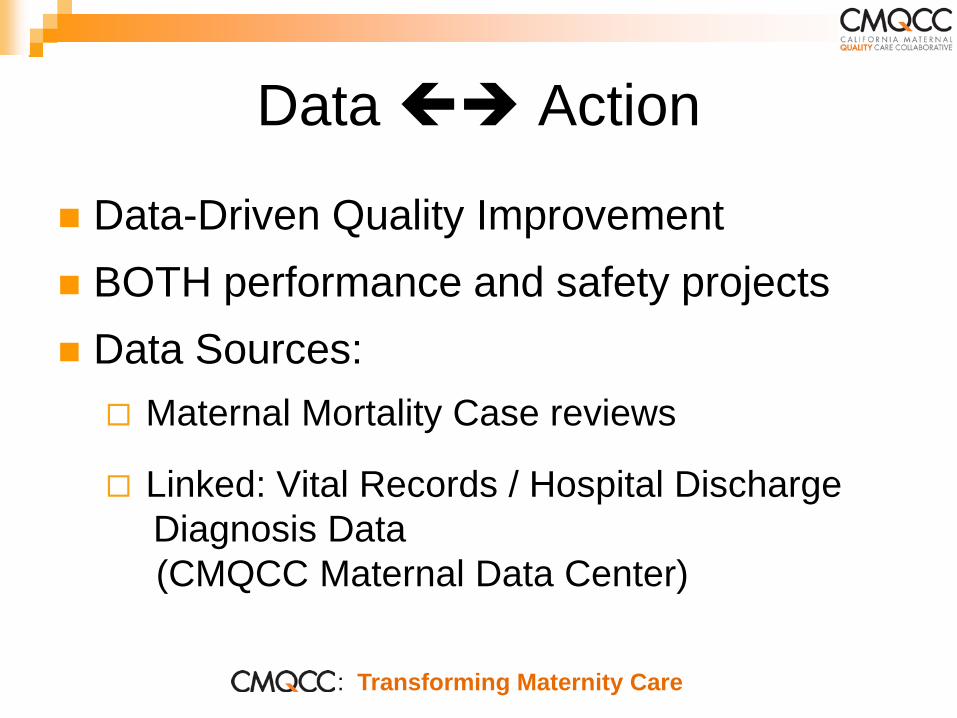
Data Action
Data-Driven Quality Improvement BOTH performance and safety projects Data Sources: Maternal Mortality Case reviews
Linked: Vital Records / Hospital DischargeDiagnosis Data(CMQCC Maternal Data Center)
: Transforming Maternity Care

CMQCC Toolkits and Collaboratives
Maternal Mortalityand Morbidity
National QualityMeasures
Hemorrhage Preventing EarlyElective Delivery(MOD National)
Preeclampsia CV Disease* DVT Prevention* Antenatal Steroids
First BirthCesarean Delivery*
*Currently under development
: Transforming Maternity Care 6
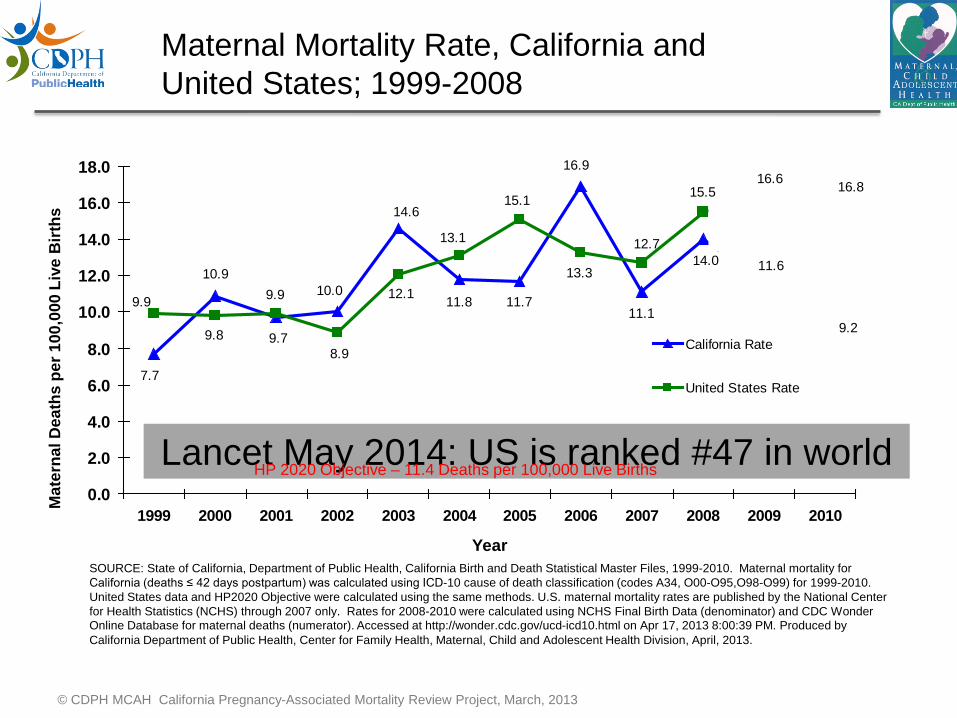
Maternal Mortality Rate, California andUnited States; 1999-2008
18.0 16.9
16.0 15.1 15.516.6 16.8
Mat
erna
l Dea
ths
per 1
00,0
00 L
ive
Birt
hs 14.6
14.0 13.1 12.7
12.0 10.9 13.314.0 11.6
9.9 9.9 10.0 12.1 11.8 11.710.0 11.19.2
8.09.8 9.7 California Rate
7.78.9
6.0 United States Rate
4.0
Lancet May 2014: US is ranked #47 in world2.0HP 2020 Objective – 11.4 Deaths per 100,000 Live Births
0.01999 2000 2001 2002 2003 2004 2005 2006 2007 2008 2009 2010
YearSOURCE: State of California, Department of Public Health, California Birth and Death Statistical Master Files, 1999-2010. Maternal mortality forCalifornia (deaths ≤ 42 days postpartum) was calculated using ICD-10 cause of death classification (codes A34, O00-O95,O98-O99) for 1999-2010.United States data and HP2020 Objective were calculated using the same methods. U.S. maternal mortality rates are published by the National Centerfor Health Statistics (NCHS) through 2007 only. Rates for 2008-2010 were calculated using NCHS Final Birth Data (denominator) and CDC WonderOnline Database for maternal deaths (numerator). Accessed at http://wonder.cdc.gov/ucd-icd10.html on Apr 17, 2013 8:00:39 PM. Produced byCalifornia Department of Public Health, Center for Family Health, Maternal, Child and Adolescent Health Division, April, 2013.
© CDPH MCAH California Pregnancy-Associated Mortality Review Project, March, 2013
THE CALIFORNIAPREGNANCY-ASSOCIATEDMORTALITY REVIEW (CA-PAMR)
Report from 2001-2003Maternal Death Reviews
This project was supported by thefederal Title V MCH block grant fromthe California Department of PublicHealth; Center for Family Health;Maternal, Child and Adolescent
Health Division
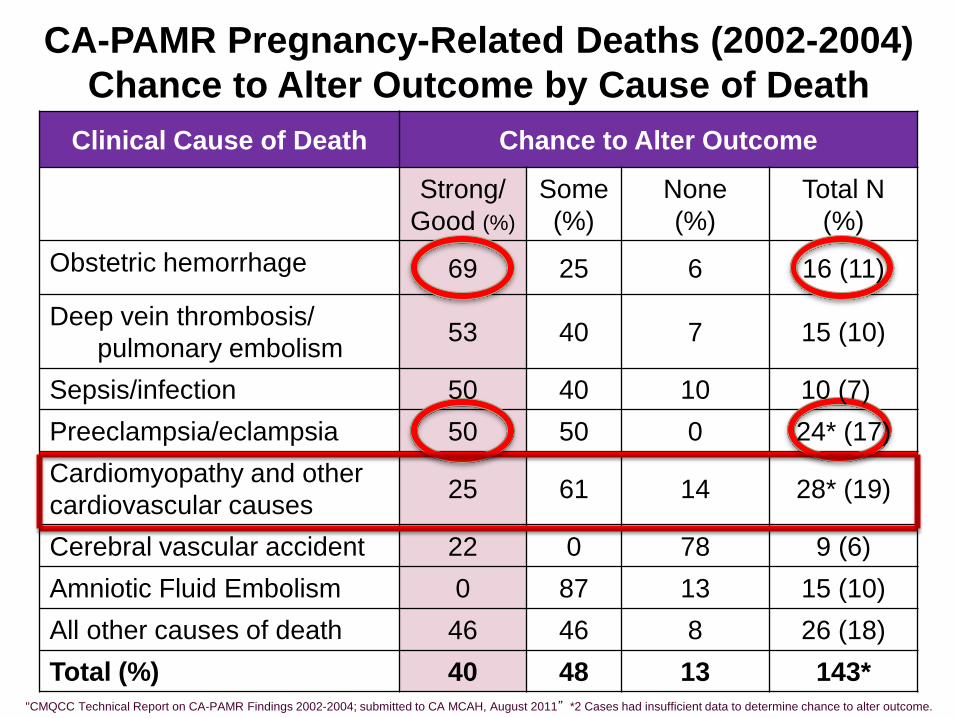
CA-PAMR Pregnancy-Related Deaths (2002-2004)Chance to Alter Outcome by Cause of Death
Clinical Cause of Death Chance to Alter Outcome
Strong/Good (%)
Some(%)
None(%)
Total(%)
N
Obstetric hemorrhage 69 25 6 16 (11)
Deep vein thrombosis/pulmonary embolism 53 40 7 15 (10)
Sepsis/infection 50 40 10 10 (7)Preeclampsia/eclampsia 50 50 0 24* (17)Cardiomyopathy and othercardiovascular causes 25 61 14 28* (19)
Cerebral vascular accident 22 0 78 9 (6)Amniotic Fluid Embolism 0 87 13 15 (10)All other causes of death 46 46 8 26 (18)Total (%) 40 48 13 143*
"CMQCC Technical Report on CA-PAMR Findings 2002-2004; submitted to CA MCAH, August 2011” *2 Cases had insufficient data to determine chance to alter outcome.
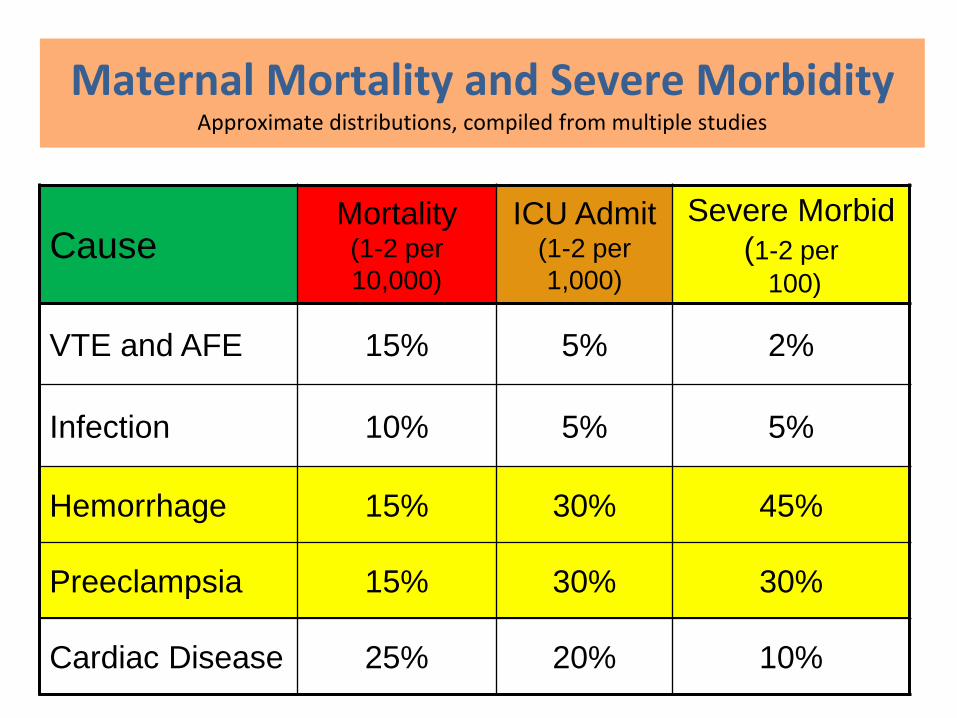
Maternal Mortality and Severe MorbidityApproximate distributions, compiled from multiple studies
Severe Morbid(1-2 per
Mortality ICU AdmitCause (1-2 per
10,000)(1-2 per1,000) 100)
VTE and AFE 15% 5% 2%
Infection 10% 5% 5%
Hemorrhage 15% 30% 45%
Preeclampsia 15% 30% 30%
Cardiac Disease 25% 20% 10%
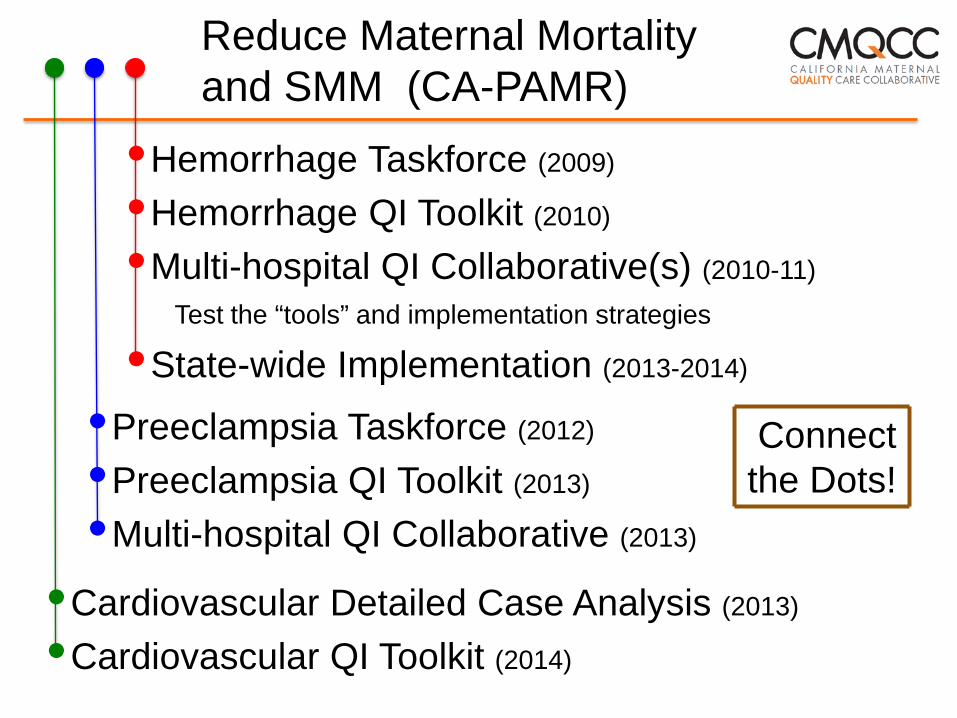
Reduce Maternal Mortalityand SMM (CA-PAMR)
•Hemorrhage Taskforce (2009)
•Hemorrhage QI Toolkit (2010)
•Multi-hospital QI Collaborative(s) (2010-11)
Test the “tools” and implementation strategies
•State-wide Implementation (2013-2014)
•Preeclampsia Taskforce (2012)
•Preeclampsia QI Toolkit (2013)
Connectthe Dots!
•Multi-hospital QI Collaborative (2013)
ardiovascular Detailed Case Analysis (2013)•C•Cardiovascular QI Toolkit (2014)

Maternal Mortality Rate, California andUnited States; 1999-2010
18.0 16.9
16.0 15.1 15.516.6 16.8
Mat
erna
l Dea
ths
per 1
00,0
00 L
ive
Birt
hs 14.6
14.0 13.1 12.7
12.0 10.9 13.314.0 11.6
9.9 9.9 10.0 12.1 11.8 11.710.0 11.19.2
8.09.8 9.7 California Rate
7.78.9
6.0 United States Rate
4.0
2.0HP 2020 Objective – 11.4 Deaths per 100,000 Live Births
0.01999 2000 2001 2002 2003 2004 2005 2006 2007 2008 2009 2010
YearSOURCE: State of California, Department of Public Health, California Birth and Death Statistical Master Files, 1999-2010. Maternal mortality forCalifornia (deaths ≤ 42 days postpartum) was calculated using ICD-10 cause of death classification (codes A34, O00-O95,O98-O99) for 1999-2010.United States data and HP2020 Objective were calculated using the same methods. U.S. maternal mortality rates are published by the National Centerfor Health Statistics (NCHS) through 2007 only. Rates for 2008-2010 were calculated using NCHS Final Birth Data (denominator) and CDC WonderOnline Database for maternal deaths (numerator). Accessed at http://wonder.cdc.gov/ucd-icd10.html on Apr 17, 2013 8:00:39 PM. Produced byCalifornia Department of Public Health, Center for Family Health, Maternal, Child and Adolescent Health Division, April, 2013.
© CDPH MCAH California Pregnancy-Associated Mortality Review Project, March, 2013

Severe Maternal Morbidity(SMM)
Mortality is difficult to measure anduncommon (<1/10,000)
Working with HRSA MCH-B and CDC totest ways to define and measure SMM
SMM Collabortive to examine the CDCmetric using ICD9 codes, and others usingblood bank data, ICU admission, LOS
The Maternal Data Center is at the center
: Transforming Maternity Care
The CMQCC MaternalData Center (CMDC)
Data Action
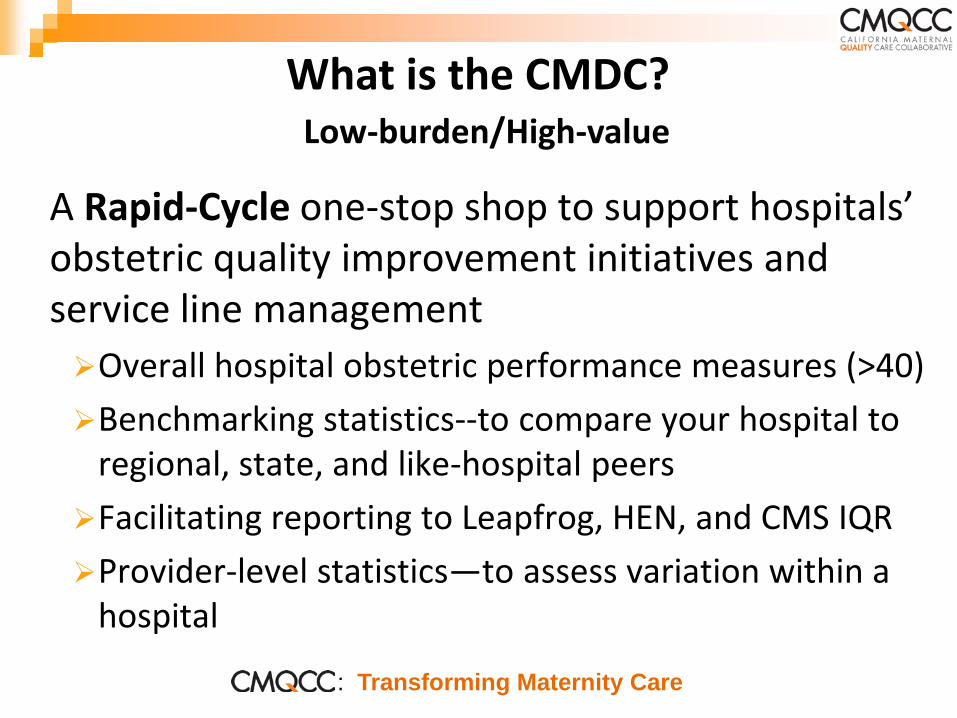
What is the CMDC?Low-burden/High-value
A Rapid-Cycle one-stop shop to support hospitals’obstetric quality improvement initiatives andservice line managementOverall hospital obstetric performance measures (>40)Benchmarking statistics--to compare your hospital to
regional, state, and like-hospital peersFacilitating reporting to Leapfrog, HEN, and CMS IQRProvider-level statistics—to assess variation within a
hospital
: Transforming Maternity Care
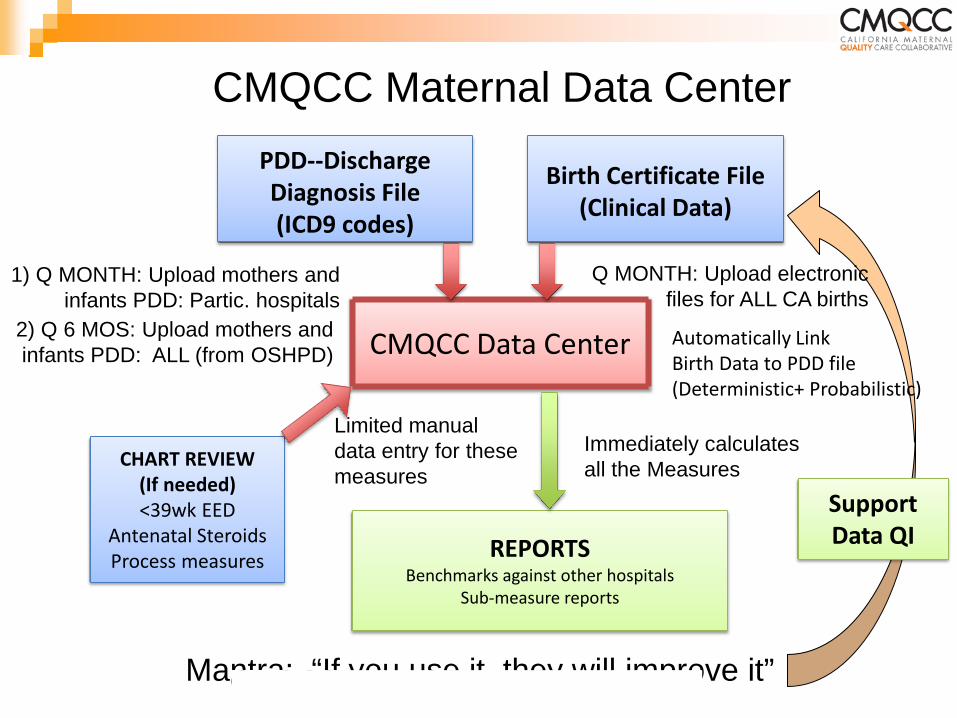
CMQCC Maternal Data CenterPDD--DischargeDiagnosis File(ICD9 codes)
Birth Certificate File(Clinical Data)
1) Q MONTH: Upload mothers andinfants PDD: Partic. hospitals
Q MONTH: Upload electronicfiles for ALL CA births
2) Q 6 MOS: Upload mothers andinfants PDD: ALL (from OSHPD) CMQCC Data Center Automatically Link
Birth Data to PDD file(Deterministic+ Probabilistic)
Limited manualthesedata entry for
measuresImmediately calculates
the MeasuresCHART REVIEW(If needed)
all
Support<39wk EEDAntenatal SteroidsProcess measures REPORTS Data QI
Benchmarks against other hospitalsSub-measure reports
Mantra: “If you use it, they will improve it”: Transforming Maternity Care
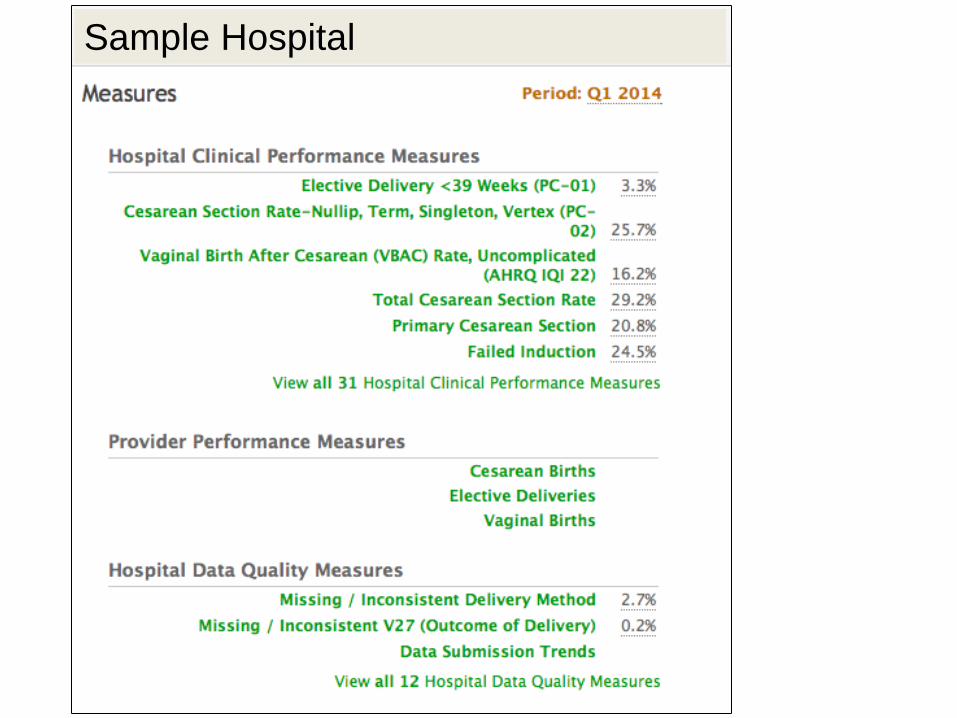
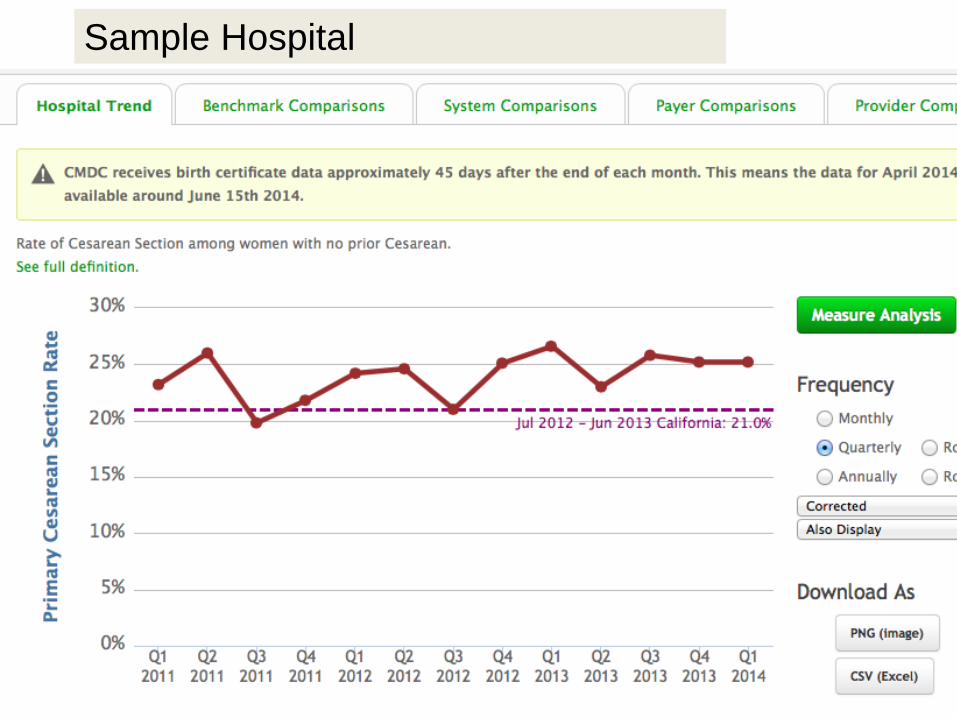
Sample Hospital
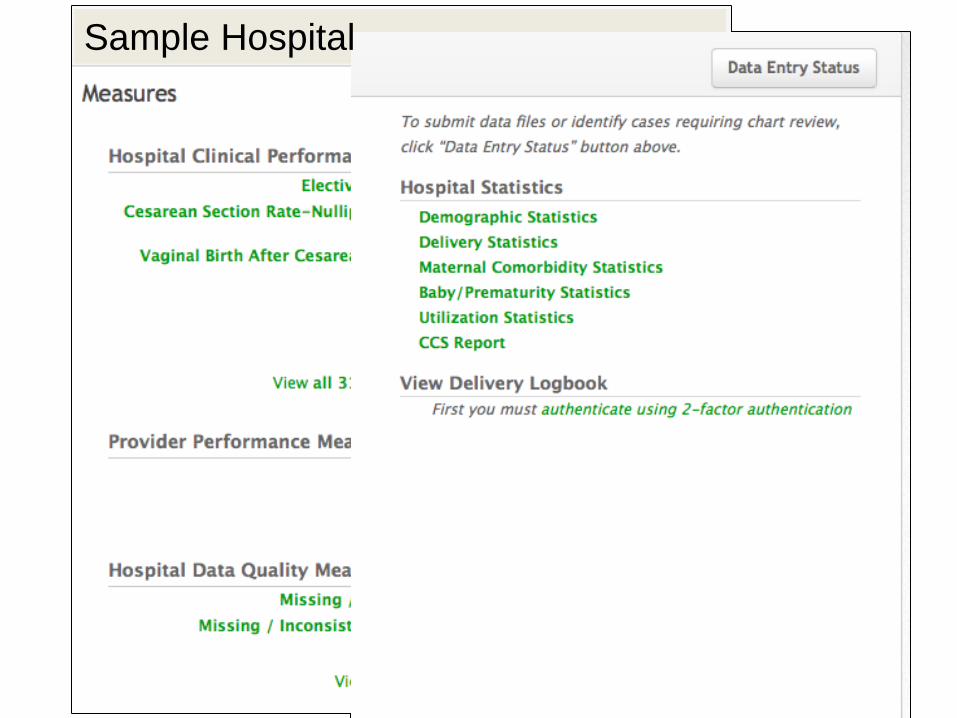
Sample Hospital
Data Action
Reducing Early Elective Delivery Reducing Primary CS—First birth, Low
Risk or NTSV CS TaskforceToolkitCollabortive The Data Center is designed to report
measures by region, payer, purchaser,hospital, medical group and provider
: Transforming Maternity Care
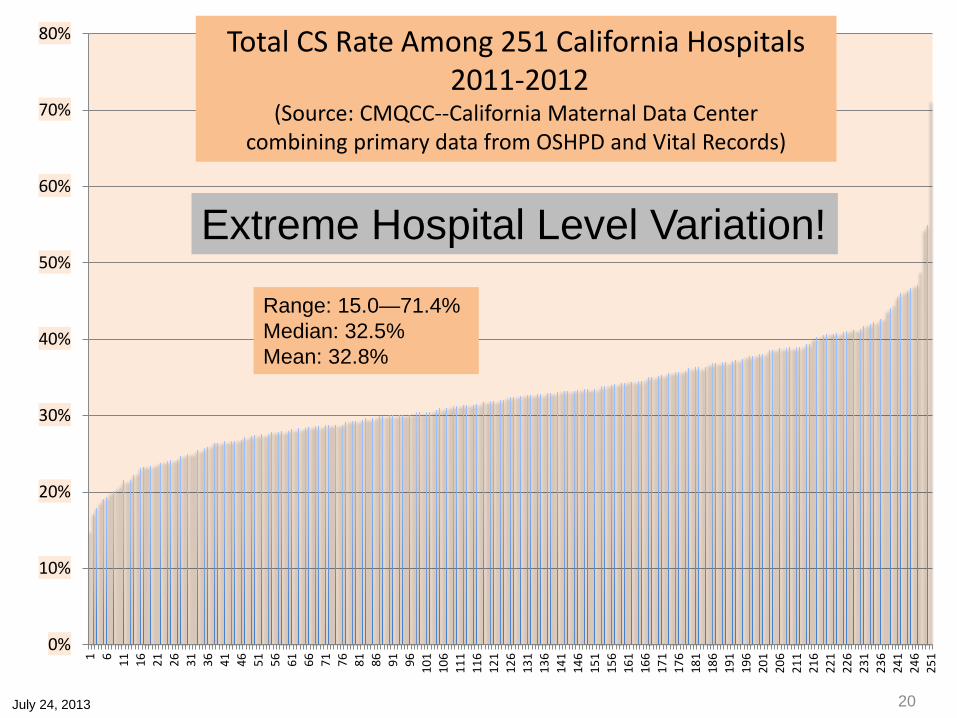
80% Total CS Rate Among 251 California Hospitals2011-2012
70% (Source: CMQCC--California Maternal Data Centercombining primary data from OSHPD and Vital Records)
60%
Extreme Hospital Level Variation!50%
Range: 15.0—71.4%Median: 32.5%Mean: 32.8%
40%
30%
20%
10%
0%
1 6 11 16 21 26 31 36 41 46 51 56 61 66 71 76 81 91 96 101
106
111
116
121
126
131
136
141
146
151
156
161
166
171
176
181
186
191
196
201
206
211
216
221
226
231
236
241
246
251
July 24, 2013 20
86
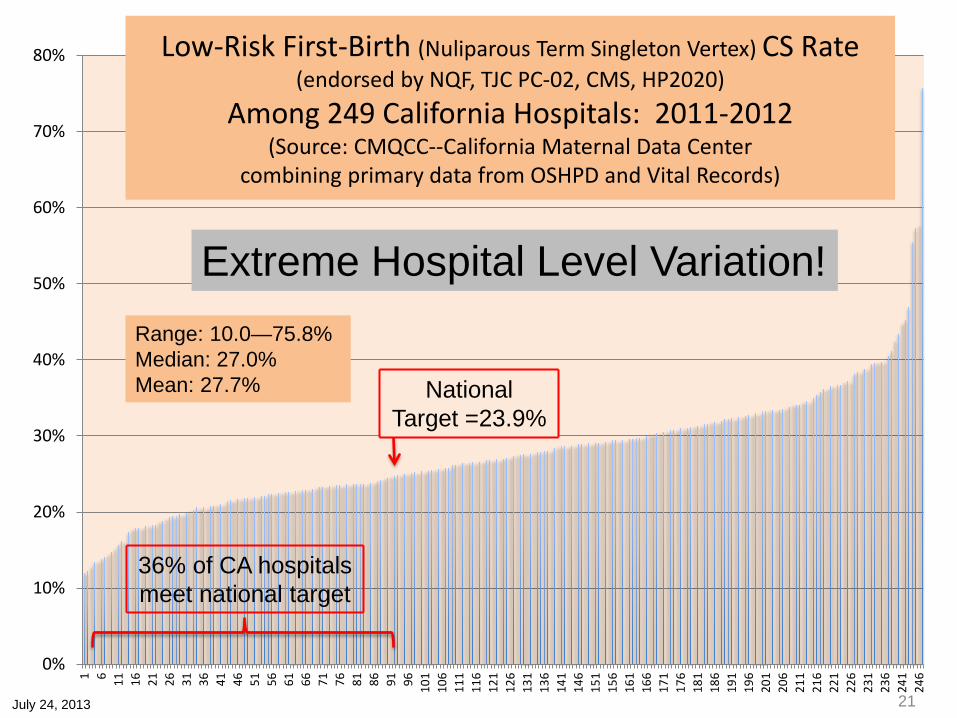
Low-Risk First-Birth (Nuliparous Term Singleton Vertex) CS Rate80%(endorsed by NQF, TJC PC-02, CMS, HP2020)
Among 249 California Hospitals: 2011-201270%
(Source: CMQCC--California Maternal Data Centercombining primary data from OSHPD and Vital Records)
60%
Extreme Hospital Level Variation!50%
Range: 10.0—75.8%40% Median: 27.0%
Mean: 27.7% NationalTarget =23.9%
30%
20%
36% of CA hospitalsmeet national target10%
0%
1 6 11 16 21 26 31 36 41 46 51 56 61 66 71 76 81 86 91 96 101
106
111
116
121
126
131
136
141
146
151
156
161
166
171
176
181
186
191
196
201
206
211
216
221
226
231
236
241
246
July 24, 2013 21

Beyond Reporting Rates(Numerator/Denominator)
Automated Measure analysis using nestedsub-measures to guide and focus your QIjourney
Drill-down to the patient level with CaseReview Worksheets to understand qualityimprovement opportunities—for bothclinical quality and data quality
Trend analyses of both measures andsub-measures
: Transforming Maternity Care
Sample Hospital
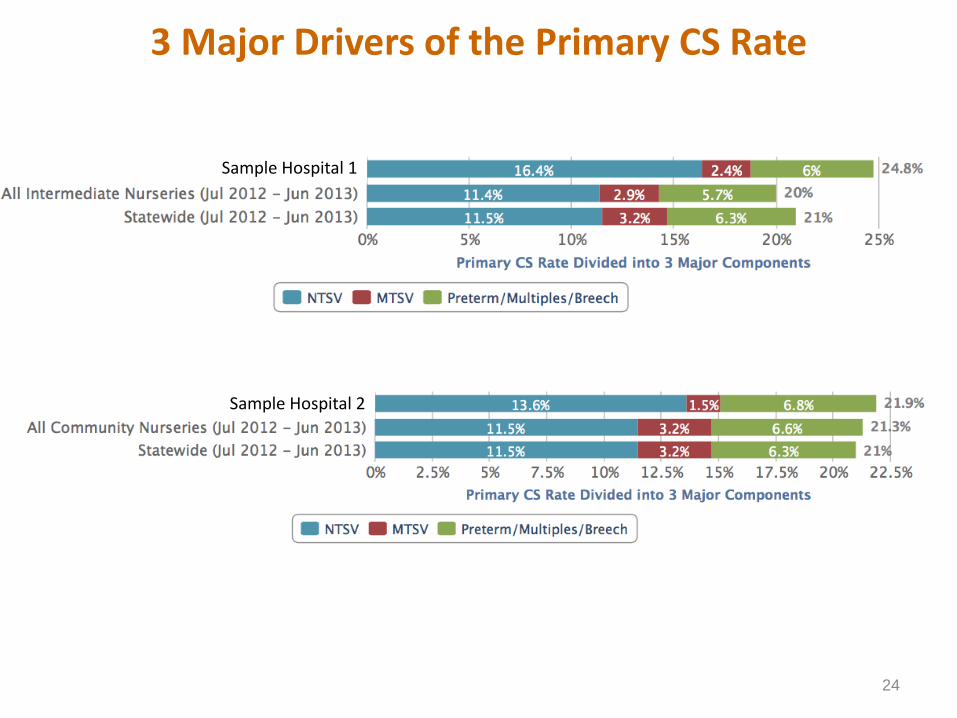
3 Major Drivers of the Primary CS Rate
Sample Hospital 1
Sample Hospital 2
24
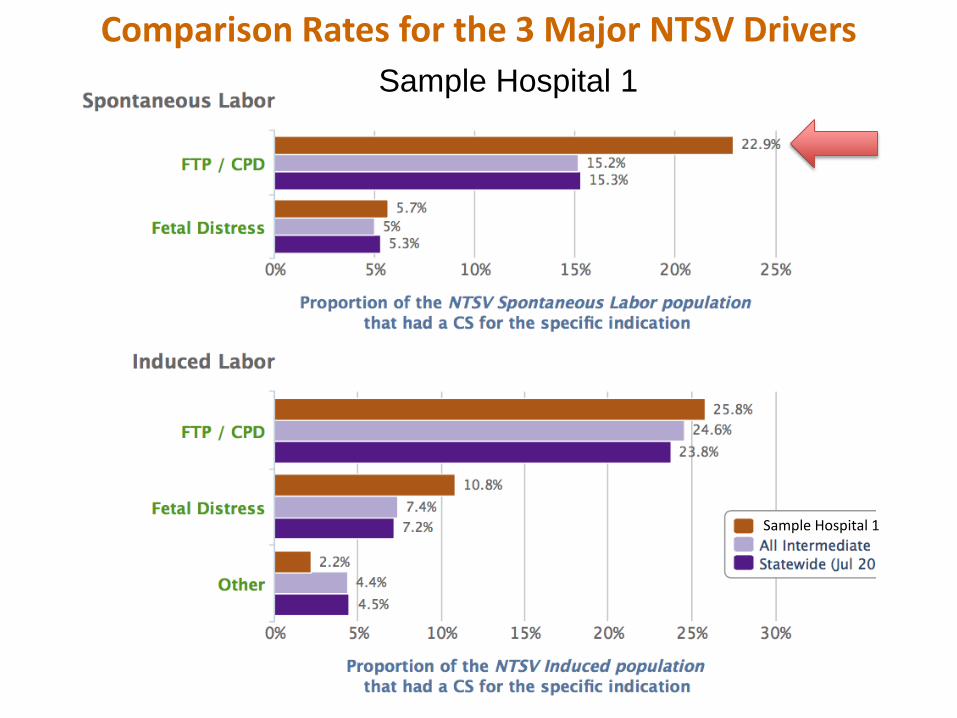
Comparison Rates for the 3 Major NTSV DriversSample Hospital 1
Sample Hospital 1
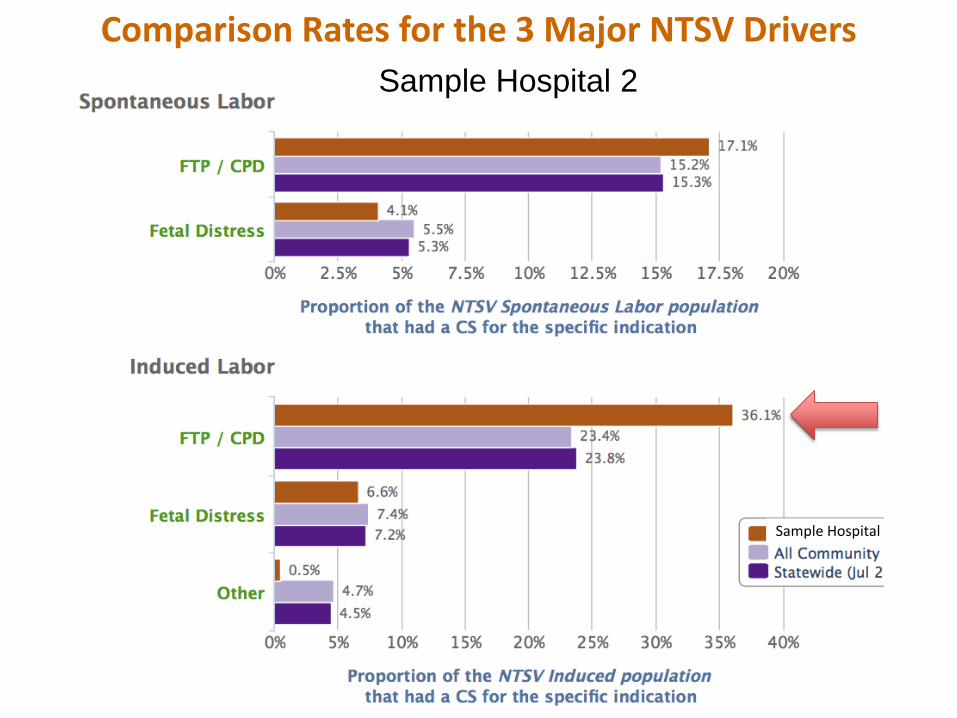
Comparison Rates for the 3 Major NTSV DriversSample Hospital 2
Sample Hospital

Comparison Rates for the 3 Major NTSV DriversSample Hospital 2
Sample Hospital 2
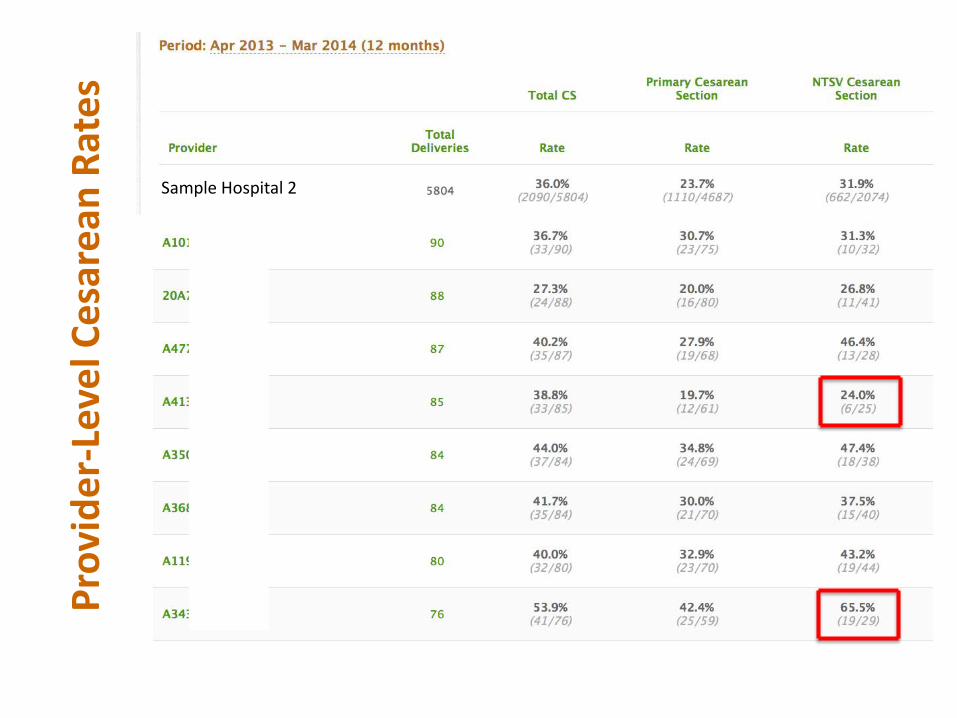
Prov
ider
-Lev
el C
esar
ean
Rate
s
Sample Hospital 2
CMQCC Data-Driven QI: NTSV CS
Preliminary Data
: Transforming Maternity Care 29
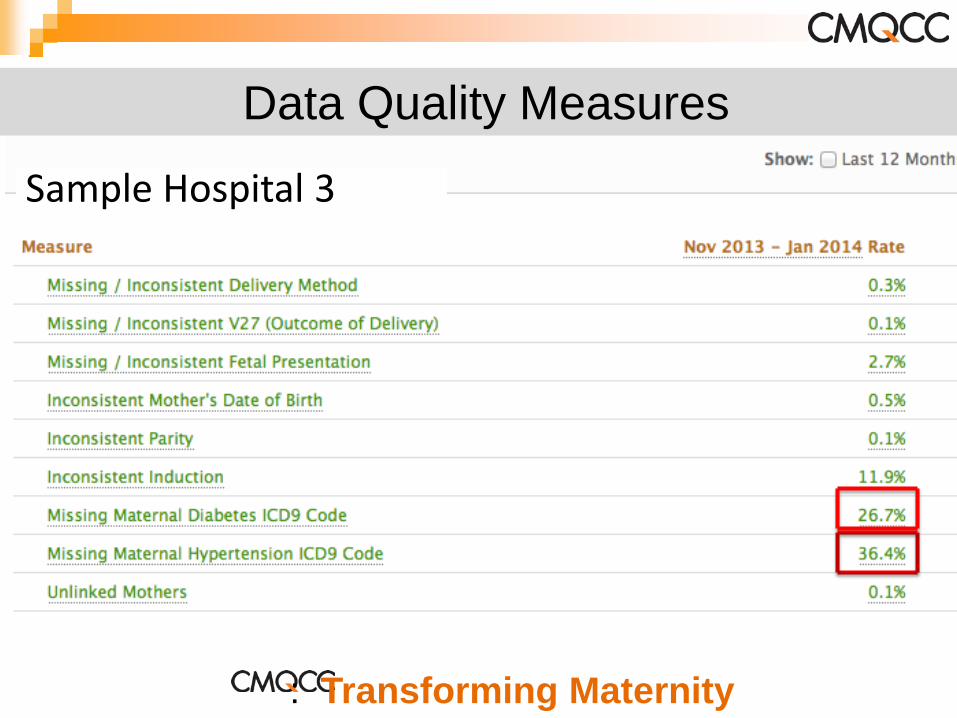
Data Quality Measures
Sample Hospital 3
: Transforming Maternity
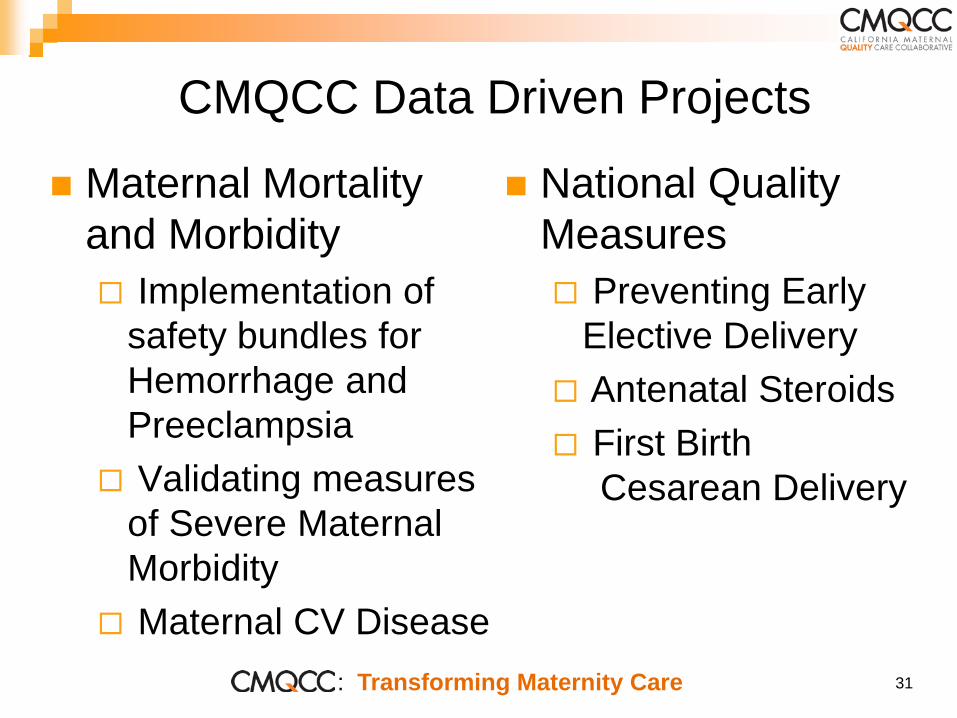
CMQCC Data Driven Projects
Maternal Mortalityand Morbidity
National QualityMeasures
Implementation ofsafety bundles forHemorrhage andPreeclampsia
Preventing EarlyElective Delivery
Antenatal Steroids First Birth
Cesarean Delivery Validating measuresof Severe MaternalMorbidity
Maternal CV Disease: Transforming Maternity Care 31
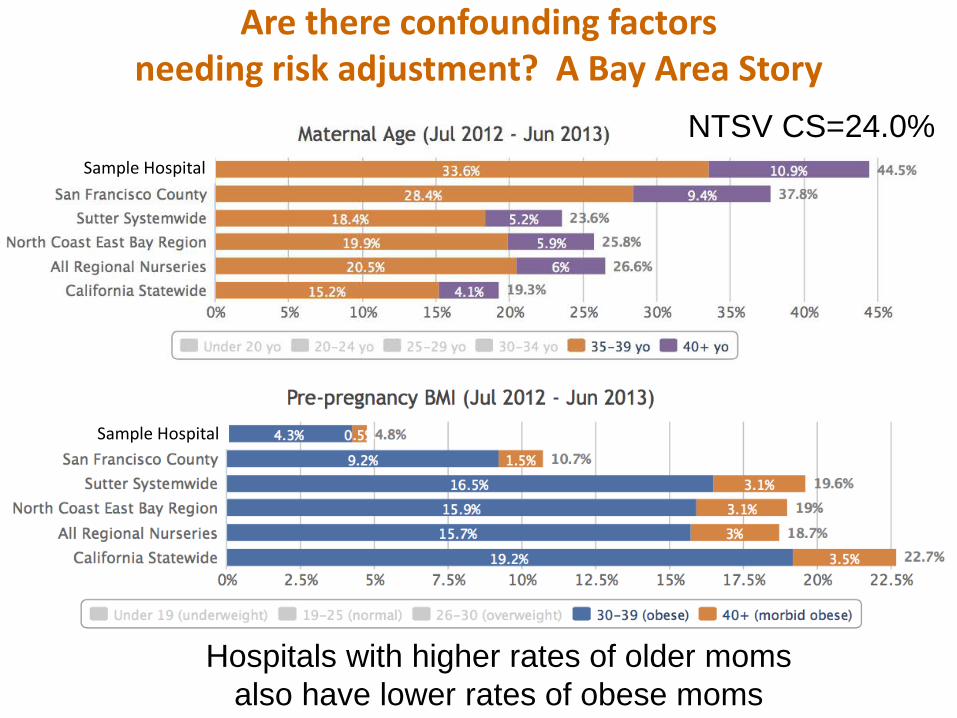
Are there confounding factorsneeding risk adjustment? A Bay Area Story
NTSV CS=24.0%Sample Hospital
Sample Hospital
Hospitals with higher rates of older momsalso have lower rates of obese moms