using electron microscopy to calculate optical … electron microscopy to calculate optical . ......
TRANSCRIPT
Using electron microscopy to calculate optical properties of biological samples
WENLI WU,1 ANDREW J. RADOSEVICH,2 ADAM ESHEIN,2 THE-QUYEN NGUYEN,2 JI YI,3 LUSIK CHERKEZYAN,2 HEMANT K. ROY,4 IGAL SZLEIFER,2,5 VADIM BACKMAN
2,5,* 1Applied Physics Program, Northwestern University, Evanston, Illinois 60208, USA 2Department of Biomedical Engineering, Northwestern University, Evanston, Illinois 60208, USA 3Department of Medicine, Boston University, Boston, Massachusetts 02118, USA 4Section of Gastroenterology, Boston Medical Center/Boston University School of Medicine,
Boston, Massachusetts 02118, USA 5Chemistry of Life Processes Institute, Northwestern University, Evanston, Illinois 60208, USA
Abstract: The microscopic structural origins of optical properties in biological media are still
not fully understood. Better understanding these origins can serve to improve the utility of
existing techniques and facilitate the discovery of other novel techniques. We propose a novel
analysis technique using electron microscopy (EM) to calculate optical properties of specific
biological structures. This method is demonstrated with images of human epithelial colon cell
nuclei. The spectrum of anisotropy factor g, the phase function and the shape factor D of the
nuclei are calculated. The results show strong agreement with an independent study. This
method provides a new way to extract the true phase function of biological samples and
provides an independent validation for optical property measurement techniques.
© 2016 Optical Society of America
OCIS codes: (170.3660) Light propagation in tissues; (000.1430) Biology and medicine; (160.4760) Optical
properties; (170.3660) Light propagation in tissues; (170.4580) Optical diagnostics for medicine.
References and links
1. B. C. Wilson and S. L. Jacques, “Optical reflectance and transmittance of tissues: principles and applications,”
Quantum Electronics, IEEE Journal of 26(12), 2186–2199 (1990). 2. V. Backman, R. Gurjar, K. Badizadegan, I. Itzkan, R. R. Dasari, L. T. Perelman, and M. S. Feld, “Polarized light
scattering spectroscopy for quantitative measurement of epithelial cellular structures in situ,” Selected Topics in
Quantum Electronics, IEEE Journal of 5(4), 1019–1026 (1999). 3. M. S. Patterson, B. Chance, and B. C. Wilson, “Time resolved reflectance and transmittance for the non-invasive
measurement of tissue optical properties,” Appl. Opt. 28(12), 2331–2336 (1989).
4. A. J. Radosevich, N. N. Mutyal, A. Eshein, T.-Q. Nguyen, B. Gould, J. D. Rogers, M. J. Goldberg, L. K.Bianchi, E. F. Yen, V. Konda, D. K. Rex, J. Van Dam, V. Backman, and H. K. Roy, “Rectal Optical Markers for
In Vivo Risk Stratification of Premalignant Colorectal Lesions,” Clin. Cancer Res. 21(19), 4347–4355
(2015).Nature 5. N. N. Mutyal, A. J. Radosevich, S. Bajaj, V. Konda, U. D. Siddiqui, I. Waxman, M. J. Goldberg, J. D. Rogers, B.
Gould, A. Eshein, S. Upadhye, A. Koons, M. Gonzalez-Haba Ruiz, H. K. Roy, and V. Backman, “In vivo risk
analysis of pancreatic cancer through optical characterization of duodenal mucosa,” Pancreas 44(5), 735–741(2015).
6. J. Yi and V. Backman, “Imaging a full set of optical scattering properties of biological tissue by inverse
spectroscopic optical coherence tomography,” Opt. Lett. 37(21), 4443–4445 (2012). 7. T. C. Zhu, J. C. Finlay, and S. M. Hahn, “Determination of the distribution of light, optical properties, drug
concentration, and tissue oxygenation in-vivo in human prostate during motexafin lutetium-mediated
photodynamic therapy,” J. Photochem. Photobiol. B 79(3), 231–241 (2005). 8. B. C. Wilson and M. S. Patterson, “The physics of photodynamic therapy,” Phys. Med. Biol. 31(4), 327–360
(1986).
9. S. T. Flock, S. L. Jacques, B. C. Wilson, W. M. Star, and M. J. van Gemert, “Optical properties of Intralipid: aphantom medium for light propagation studies,” Lasers Surg. Med. 12(5), 510–519 (1992).
10. Y. L. Kim, Y. Liu, R. K. Wali, H. K. Roy, and V. Backman, “Low-coherent backscattering spectroscopy for
tissue characterization,” Appl. Opt. 44(3), 366–377 (2005). 11. Y. L. Kim, Y. Liu, V. M. Turzhitsky, R. K. Wali, H. K. Roy, and V. Backman, “Depth-resolved low-coherence
enhanced backscattering,” Opt. Lett. 30(7), 741–743 (2005).
Vol. 7, No. 11 | 1 Nov 2016 | BIOMEDICAL OPTICS EXPRESS 4749
#275078 Journal © 2016
http://dx.doi.org/10.1364/BOE.7.004749 Received 15 Sep 2016; revised 20 Oct 2016; accepted 20 Oct 2016; published 27 Oct 2016
12. Y. L. Kim, Y. Liu, V. M. Turzhitsky, H. K. Roy, R. K. Wali, and V. Backman, “Coherent backscattering
spectroscopy,” Opt. Lett. 29(16), 1906–1908 (2004). 13. H. K. Roy, Y. L. Kim, Y. Liu, R. K. Wali, M. J. Goldberg, V. Turzhitsky, J. Horwitz, and V. Backman, “Risk
stratification of colon carcinogenesis through enhanced backscattering spectroscopy analysis of the uninvolved
colonic mucosa,” Clin. Cancer Res. 12(3), 961–968 (2006). 14. A. J. Radosevich, J. Yi, J. D. Rogers, and V. Backman, “Structural length-scale sensitivities of reflectance
measurements in continuous random media under the Born approximation,” Opt. Lett. 37(24), 5220–5222
(2012). 15. J. Yi, A. J. Radosevich, J. D. Rogers, S. C. Norris, I. R. Çapoğlu, A. Taflove, and V. Backman, “Can OCT be
sensitive to nanoscale structural alterations in biological tissue?” Opt. Express 21(7), 9043–9059 (2013).
16. V. Backman and H. K. Roy, “Advances in biophotonics detection of field carcinogenesis for colon cancer risk stratification,” J. Cancer 4(3), 251–261 (2013).
17. H. Subramanian, H. K. Roy, P. Pradhan, M. J. Goldberg, J. Muldoon, R. E. Brand, C. Sturgis, T. Hensing, D.
Ray, A. Bogojevic, J. Mohammed, J. S. Chang, and V. Backman, “Nanoscale cellular changes in field carcinogenesis detected by partial wave spectroscopy,” Cancer Res. 69(13), 5357–5363 (2009).
18. J. W. Pickering, S. A. Prahl, N. van Wieringen, J. F. Beek, H. J. Sterenborg, and M. J. van Gemert, “Double-
integrating-sphere system for measuring the optical properties of tissue,” Appl. Opt. 32(4), 399–410 (1993). 19. J. A. Jacquez and H. F. Kuppenheim, “Theory of the integrating sphere,” JOSA 45(6), 460–466 (1955).
20. J. B. Fishkin, O. Coquoz, E. R. Anderson, M. Brenner, and B. J. Tromberg, “Frequency-domain photon
migration measurements of normal and malignant tissue optical properties in a human subject,” Appl. Opt. 36(1), 10–20 (1997).
21. J. Mandarino, “The Gladstone-Dale relationship. Part I: derivation of new constants,” Can. Mineral. 14, 498–502
(1976). 22. A. J. Radosevich, N. N. Mutyal, J. Yi, Y. Stypula-Cyrus, J. D. Rogers, M. J. Goldberg, L. K. Bianchi, S. Bajaj,
H. K. Roy, and V. Backman, “Ultrastructural alterations in field carcinogenesis measured by enhanced
backscattering spectroscopy,” J. Biomed. Opt. 18(9), 097002 (2013). 23. J. Yi, A. J. Radosevich, Y. Stypula-Cyrus, N. N. Mutyal, S. M. Azarin, E. Horcher, M. J. Goldberg, L. K.
Bianchi, S. Bajaj, H. K. Roy, and V. Backman, “Spatially resolved optical and ultrastructural properties of colorectal and pancreatic field carcinogenesis observed by inverse spectroscopic optical coherence tomography,”
J. Biomed. Opt. 19(3), 036013 (2014).
24. R. M. Doornbos, R. Lang, M. C. Aalders, F. W. Cross, and H. J. Sterenborg, “The determination of in vivo human tissue optical properties and absolute chromophore concentrations using spatially resolved steady-state
diffuse reflectance spectroscopy,” Phys. Med. Biol. 44(4), 967–981 (1999).
25. A. J. Radosevich, A. Eshein, T. Q. Nguyen, and V. Backman, “Subdiffusion reflectance spectroscopy to measure tissue ultrastructure and microvasculature: model and inverse algorithm,” J. Biomed. Opt. 20(9), 097002 (2015).
26. T. Binzoni, T. Leung, A. Gandjbakhche, D. Rüfenacht, and D. Delpy, “The use of the Henyey–Greenstein phase
function in Monte Carlo simulations in biomedical optics,” Phys. Med. Biol. 51(17), 313 (2006).
27. J. D. Rogers, A. J. Radosevich, J. Yi, and V. Backman, “Modeling Light Scattering in Tissue as Continuous
Random Media Using a Versatile Refractive Index Correlation Function,” IEEE J. Sel. Top. Quantum Electron.
20(2), 7000514 (2013). 28. İ. R. Capoğlu, J. D. Rogers, A. Taflove, and V. Backman, “Accuracy of the Born approximation in calculating
the scattering coefficient of biological continuous random media,” Opt. Lett. 34(17), 2679–2681 (2009).
29. W.-F. Cheong, S. A. Prahl, and A. J. Welch, “A review of the optical properties of biological tissues,” IEEE J. Quantum Electron. 26(12), 2166–2185 (1990).
30. J. Mourant, A. Hielscher, J. Freyer, A. Eick, D. Shen, and T. Johnson, “Scattering properties of biological cells,”
in Biomedical Optical Spectroscopy and Diagnostics(Optical Society of America1998), p. BMA4. 31. A. Ishimaru, Wave Propagation and Scattering in Random Media (Academic Press, 1978).
32. R. Barer, and S. Tkaczyk, “Refractive index of concentrated protein solutions,” (1954).
33. T. Tan, A. Taflove, and V. Backman, “Single realization stochastic FDTD for weak scattering waves in biological random media,” IEEE Trans. Antenn. Propag. 61(2), 818–828 (2013).
34. J. D. Rogers, A. J. Radosevich, J. Yi, and V. Backman, “Modeling Light Scattering in Tissue as Continuous
Random Media Using a Versatile Refractive Index Correlation Function,” IEEE J. Sel. Top. Quantum Electron. 20(2), 7000514 (2013).
35. L. Cherkezyan, Y. Stypula-Cyrus, H. Subramanian, C. White, M. Dela Cruz, R. K. Wali, M. J. Goldberg, L. K.
Bianchi, H. K. Roy, and V. Backman, “Nanoscale changes in chromatin organization represent the initial steps
of tumorigenesis: a transmission electron microscopy study,” BMC Cancer 14(1), 189 (2014).
36. J. D. Rogers, İ. R. Capoğlu, and V. Backman, “Nonscalar elastic light scattering from continuous random media
in the Born approximation,” Opt. Lett. 34(12), 1891–1893 (2009). 37. M. Xu and R. R. Alfano, “Fractal mechanisms of light scattering in biological tissue and cells,” Opt. Lett.
30(22), 3051–3053 (2005).
38. C. J. Sheppard, “Fractal model of light scattering in biological tissue and cells,” Opt. Lett. 32(2), 142–144 (2007).
39. E. Lukasova, F. Jelen, and E. Palecek, “Electrochemistry of osmium nucleic-acid complexes-a probe for single-
stranded and distorted double-stranded regions in DNA,” Gen. Physiol. Biophys. 1, 53–70 (1982).
Vol. 7, No. 11 | 1 Nov 2016 | BIOMEDICAL OPTICS EXPRESS 4750
40. B. H. Johnston and A. Rich, “Chemical probes of DNA conformation: detection of Z-DNA at nucleotide
resolution,” Cell 42(3), 713–724 (1985). 41. J. M. Schmitt and G. Kumar, “Turbulent nature of refractive-index variations in biological tissue,” Opt. Lett.
21(16), 1310–1312 (1996).
42. L. Perelman, V. Backman, M. Wallace, G. Zonios, R. Manoharan, A. Nusrat, S. Shields, M. Seiler, C. Lima, T. Hamano, I. Itzkan, J. Van Dam, J. M. Crawford, and M. S. Feld, “Observation of periodic fine structure in
reflectance from biological tissue: a new technique for measuring nuclear size distribution,” Phys. Rev. Lett.
80(3), 627–630 (1998). 43. C. L. Curl, C. J. Bellair, T. Harris, B. E. Allman, P. J. Harris, A. G. Stewart, A. Roberts, K. A. Nugent, and L. M.
Delbridge, “Refractive index measurement in viable cells using quantitative phase-amplitude microscopy and
confocal microscopy,” Cytometry A 65(1), 88–92 (2005). 44. J.-R. Daban, “Physical constraints in the condensation of eukaryotic chromosomes. Local concentration of DNA
versus linear packing ratio in higher order chromatin structures,” Biochemistry 39(14), 3861–3866 (2000).
45. B. Bohrmann, M. Haider, and E. Kellenberger, “Concentration evaluation of chromatin in unstained resin-embedded sections by means of low-dose ratio-contrast imaging in STEM,” Ultramicroscopy 49(1-4), 235–251
(1993).
46. J. S. Kim and I. Szleifer, “Crowding-induced formation and structural alteration of nuclear compartments: insights from computer simulations,” Int. Rev. Cell Mol. Biol. 307, 73–108 (2014).
47. A. Bancaud, S. Huet, N. Daigle, J. Mozziconacci, J. Beaudouin, and J. Ellenberg, “Molecular crowding affects
diffusion and binding of nuclear proteins in heterochromatin and reveals the fractal organization of chromatin,” EMBO J. 28(24), 3785–3798 (2009).
48. H. Davies, M. Wilkins, J. Chayen, and L. La Cour, “The use of the interference microscope to determine dry
mass in living cells and as a quantitative cytochemical method,” Q. J. Microsc. Sci. 3, 271–304 (1954). 49. D. W. Leonard and K. M. Meek, “Refractive indices of the collagen fibrils and extrafibrillar material of the
corneal stroma,” Biophys. J. 72(3), 1382–1387 (1997).
50. A. J. Radosevich, “Generate random media according to the Whittle Matern model in Matlab,” http://biophotonics.bme.northwestern.edu/resources/index.html.
51. L. Liu, J. A. Gardecki, S. K. Nadkarni, J. D. Toussaint, Y. Yagi, B. E. Bouma, and G. J. Tearney, “Imaging the subcellular structure of human coronary atherosclerosis using micro-optical coherence tomography,” Nat. Med.
17(8), 1010–1014 (2011).
52. W. Drexler, U. Morgner, F. X. Kärtner, C. Pitris, S. A. Boppart, X. D. Li, E. P. Ippen, and J. G. Fujimoto, “In vivo ultrahigh-resolution optical coherence tomography,” Opt. Lett. 24(17), 1221–1223 (1999).
53. K. W. Calabro and I. J. Bigio, “Influence of the phase function in generalized diffuse reflectance models: review
of current formalisms and novel observations,” J. Biomed. Opt. 19(7), 075005 (2014). 54. M. Hammer, D. Schweitzer, B. Michel, E. Thamm, and A. Kolb, “Single scattering by red blood cells,” Appl.
Opt. 37(31), 7410–7418 (1998).
55. M. Adrian, J. Dubochet, J. Lepault, and A. W. McDowall, “Cryo-electron microscopy of viruses,” Nature 53, 32–
36 (1984).
56. P. A. Penczek, R. A. Grassucci, and J. Frank, “The ribosome at improved resolution: new techniques for merging
and orientation refinement in 3D cryo-electron microscopy of biological particles,” Ultramicroscopy 53(3), 251–270 (1994).
57. J. R. Mourant, J. P. Freyer, A. H. Hielscher, A. A. Eick, D. Shen, and T. M. Johnson, “Mechanisms of light
scattering from biological cells relevant to noninvasive optical-tissue diagnostics,” Appl. Opt. 37(16), 3586–3593 (1998).
58. J. R. Mourant, T. Fuselier, J. Boyer, T. M. Johnson, and I. J. Bigio, “Predictions and measurements of scattering
and absorption over broad wavelength ranges in tissue phantoms,” Appl. Opt. 36(4), 949–957 (1997). 59. S. A. Prahl, M. Keijzer, S. L. Jacques, and A. J. Welch, “A Monte Carlo model of light propagation in tissue,”
Dosimetry of laser radiation in medicine and biology 5, 102–111 (1989).
1. Introduction
Optical properties have been investigated in numerous studies due to the emergence of optical
techniques used in diagnosis [1–6], therapy [7, 8] and surgery [9]. Specifically for diagnostic
applications, changes in optical properties in tissues and cells can be detected far earlier than
any available histological, molecular or genetic markers for many diseases [10–13]. It has
been shown that optical properties have the ability to sense sub-diffractional structures down
to 30 nm [14, 15]. While conventional optical imaging is constrained by the diffraction limit
of light, optical properties are not because they quantify the propagation and scattering of
light in tissue. At these small length scales, it is possible to detect the subtle alterations of
tissue structure presenting in numerous diseases, which are impossible to observe by
traditional optical imaging techniques [16, 17]. The great utility of characterizing optical
properties has stimulated the development of a myriad of measurement techniques including
Vol. 7, No. 11 | 1 Nov 2016 | BIOMEDICAL OPTICS EXPRESS 4751

integrating sphere [18, 19], frequency-domain photon migration [20, 21], spatially resolved
transmittance and spatially resolved reflectance spectroscopy [3, 22–25].
Unfortunately, there are three major limitations among prevalent optical property
measurement techniques. First, they do not allow direct nanoscale visualization of the
structures they are sensitive to. Second, the optical properties usually average the nanoscale
information over a relatively large volume (μm3 to mm
3), so conventional optical property
measurements do not isolate optical properties to small structures (e.g. organelles) within
intact tissue. Lastly, many optical property extraction methods are based on approximated
scattering phase function models [6, 26], which make the measured optical properties
vulnerable to the accuracy of the chosen model. These limitations hinder optical property
measurement techniques from having insight into the underlying biology presenting the
properties being measured. Overcoming these limitations becomes crucial when trying to
improve techniques using optical properties as diagnostic markers.
The major technical challenge to overcome these limitations comes from the lack of
optical imaging techniques that resolve structures responsible for light scattering (organelles,
collagen fibers, chromatin, etc.). Fortunately, the development of nanoscale imaging
techniques such as electron microscopy (EM) provides a way to overcome this challenge. EM
has the ability to achieve resolution better than 100 pm, and thus can be a great imaging
technique to isolate specific structures in biological samples and study the contribution from
each structure to the optical properties. While EM has been used extensively in biomedical
research, to our knowledge there is no report of using EM to extract optical properties from
biological media.
In this work, we present a methodology to use EM to directly extract the optical properties
of specific biological structures using the Born approximation. The Born approximation, also
known as Rayleigh-Gans-Debye approximation, or weak scattering approximation is a valid
predictive model for scattering in tissue and cells due to their weakly scattering properties
[22, 27, 28]. We use the Born approximation and the known refractive indexes of cellular
components to calculate the optical properties of nuclei from human epithelial cells measured
by Transmission Electron Microscopy (TEM), taken from the rectal mucosa of patients with
and without precancerous lesions in their colon. In the results, we first show the spectrum of
anisotropy factor g and the phase function of colon cell nuclei. Then, the calculated optical
properties are compared with the optical properties of epithelial cells measured by Inverse
Spectroscopic Optical Coherence Tomography (ISOCT), a technique capable of measuring
the spatially resolved optical properties of cells and tissues [6, 23]. The directly calculated
phase function of colon cells is compared with the Henyey-Greenstein (HG) phase function,
which is commonly used in biological media [26, 29, 30].
The paper is organized as follows: In section 2 we show the basic theory we used to
develop our method. In section 3 we describe the method we used to calculate the optical
properties from TEM nuclei images in detail. Section 4 shows the results from human
epithelial cells and comparison with an independent study. Finally, in Section 5 we discuss
our conclusions and the potential impact of this work.
2. Theory: application of the Born approximation to calculate optical properties
The Born approximation, also known as Rayleigh-Gans-Debye approximation, has been used
to calculate optical properties in biological media [27, 31]. Here we give a brief review of this
theory. A scattering event happens in media when there is a heterogeneous distribution of
refractive index ( )n r . The refractive index of a medium has a linear relationship with its
mass density ( )r , which can be expressed by the Gladstone-Dale relationship [21, 32]:
( ) ( )watern r n r (1)
Vol. 7, No. 11 | 1 Nov 2016 | BIOMEDICAL OPTICS EXPRESS 4752
where watern is the refractive index of water and is the incremental constant for a specific
structure. This is the reason why optical scattering phenomena (originating from ( )n r ) can be
related to the structural information of the media (represented by ( )r ).
Under the Born approximation, the incident electromagnetic wave is the driving field for
the scattering event. This approximation is valid in biological media since its refractive index
follows the weak scattered condition, which requires / 1 1n n and 2ka / 1 1n n ,
where n is the refractive index of the media, n is the averaged refractive index of the
background, k is the free-space wavenumber and a is the size of the scattering particle. Under
this condition, the scattered field is very small compared to the incident field and its
contribution to the total field can be neglected. We will apply the Born approximation in the
calculation of the scattering electric field because of its high efficiency compared to more
accurate, but more time-consuming computational methods like the Finite-Difference Time-
Domain method (FDTD) [33]. Under the Born approximation, the relationship between the
differential scattering cross section and autocorrelation function of the refractive index
distribution from the sample is simplified to a Fourier Transform [34, 35].
Here, as an example, we will use a cell nucleus to illustrate how to apply this
approximation in the scattering calculation, though this method can be expanded to any
organelle. Since a scattering event happening in the randomly distributed nucleus is in the
weak scattering range, we can consider the nucleus as a particle with a finite size and a
random distribution of mass density inside the particle. In this case, the origin of the
scattering comes from the relative excess refractive index in the form of
( ) /n cyt cytr rn n n n , where nn r is the refractive index distribution inside the
nuclei and cytn is the averaged refractive index of cytoplasm. The autocorrelation function
of the nucleus is represented in Eq. (2):
3( ) ( ) ( )drn d d
v
B r n r n r r (2)
By considering that the random media is statistically isotropic, the Fourier Transform of
( )dnB r in 1-D form is:
2 0
sin1
2
s d
s s n d d d
s
k rk B r r dr
k
(3)
where 2 sin( / 2)s cytk n k , θ is the azimuth angle and s sk is the power spectral
density (PSD) of the refractive index. According to the Born approximation, the differential
scattering cross section σ(θ, ,k) , where is the polar angle in spherical coordinate, is
proportional to the PSD. So, we can calculate the differential scattering cross section as:
4
2 2, , 2 1 sin coscyt s sk n k k (4)
Because we assume unpolarized light, is independent of , and the differential
scattering cross section can be simplified to its 1-D form:
4
2, 2 1 coscyt s sk n k k (5)
With this expression of the differential scattering cross section, we can now calculate the
anisotropy factor g as the first moment of σ(θ,k) :
Vol. 7, No. 11 | 1 Nov 2016 | BIOMEDICAL OPTICS EXPRESS 4753
1
1
1
1
cos cos , cos( )
cos , cos
k dg k
k d
(6)
As well as the transport mean free path:
*
1
1
1
cos , cos 1 ( )sl k
k d g k
(7)
The “shape factor” D is another optical property measured in many studies [22, 35–37],
and has been found to have a power law relation with the spectrum of incident light is in the
biological tissue in these measurements:
* 4 , 4D
sl k k D (8)
This power law relation can be derived under a number of analytical autocorrelation
function models such as the Whittle-Matern (WM) model [38]. The WM model is an
autocorrelation family which actually encompasses many models including the mass-fractal
model and HG phase function and is often used to model biological samples [22, 27]:
3
2
3
2
D
d d
n d n D
n n
r rB r A K
l l
(9)
where nA is a normalization factor,
nl is the length scale factor of the modeled sample,
( 3)/2K ( / )D d nr l is the modified Bessel function of the second kind. The power law relation is
only valid when k 1nl . The details of this relation can be found in [36].
Since we are only studying the property of single nuclei, whose size is much smaller than
mean free path, we can assume that there is only single scattering in nuclei. Therefore, *
sl
does not have physical meaning but the relation with D is still valid. To calculate a physically
meaningful value of *
sl , we would also need to measure the number density of nuclei in a
volume of tissue, which is not within the scope of this study.
3. Method
Section 2 shows that optical properties g, D, and any other phase function dependent
parameters can be calculated from ( )n dB r extracted from a 3D nanoscale image of a sample.
However, to our knowledge, there is no well-established direct imaging technique which
provides 3D nano-scale (down to 10 nm) visualization of structures in biological samples.
Here we will present a method to calculate the optical properties from the ( )n dB r extracted
from 2D TEM images of cell nuclei.
3.1.1 Acquire nuclei TEM images
The biopsy preparation protocol and TEM measurement parameters are described in detail in
[35]. Briefly, ten patients who had undergone colonoscopy were recruited into this study. Five
patients had no signs of dysplasia or adenomas (precancerous lesions) throughout the colon
and were considered a control group. Five patients presented with advanced adenomas (AA
group) or adenomas larger than 9mm in diameter. A biopsy was taken from each patient’s
colon and was then stained with osmium tetraoxide (OsO4, which is commonly used to target
DNA [39, 40]). TEM images of tissue sections from the biopsies were acquired after excision.
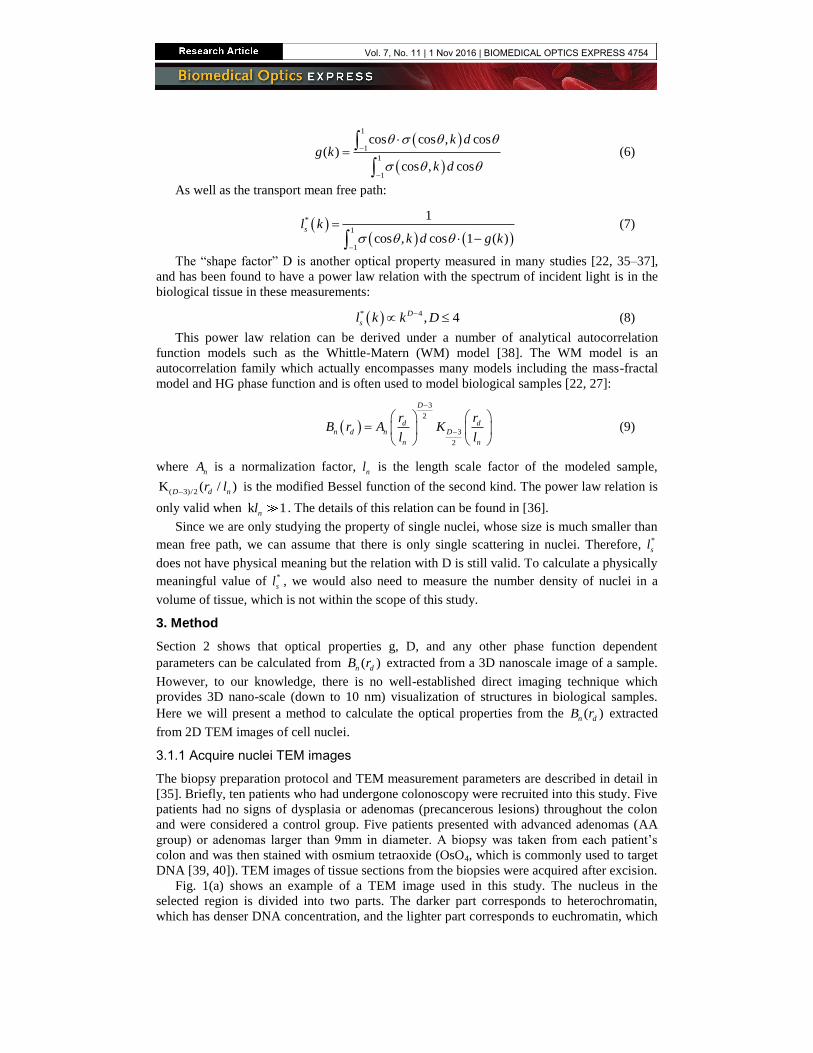
Fig. 1(a) shows an example of a TEM image used in this study. The nucleus in the
selected region is divided into two parts. The darker part corresponds to heterochromatin,
which has denser DNA concentration, and the lighter part corresponds to euchromatin, which
Vol. 7, No. 11 | 1 Nov 2016 | BIOMEDICAL OPTICS EXPRESS 4754
has a lower DNA concentration. These two parts are the largest components in nuclei. To
isolate nuclei and their contribution to the optical properties, we cropped each nucleus out of
the image and set the background outside the nuclei to be uniform cytoplasm, as shown in
Fig. 1(b)-1(c).
Fig. 1. Nuclei in a TEM image. (a) is the original TEM image of the biopsy. (b) is the selected
nucleus in TEM image. (c) is the cropped out nucleus. The background of the image is taken as
uniform cytoplasm. (d) is the nuclear refractive index distribution ( , )n x y after binarization.
The refractive index is 1.35 for euchromatin, 1.36 for cytoplasm and 1.39 for heterochromatin.
The scale bar in (a) is 2μm , the scale bar in (b-c) is 2.5 μm .
3.1.2 2D Refractive index autocorrelation function of nuclei TEM image
The TEM images provide the structural distribution information inside the nuclei but not the
direct refractive index distribution. However, since the nuclei mainly consist of
heterochromatin and euchromatin, dividing the nuclei images into those two parts and
assigning the appropriate refractive indexes to each part can provide a good approximation of
the refractive index distribution inside nuclei [41]. Note that, this method of approximating
refractive index distribution might not be applicable for all the sample types when the
refractive indexes of the components inside the sample are unknown. The refractive index
outside nuclei is taken as the averaged refractive index of cytoplasm, which we set to 1.36.
This value was taken from direct refractive index measurements [42, 43]. We use 1.35 and
1.39 as the refractive index values for euchromatin and heterochromatin, respectively. These
values are based on their respective mass densities and using the Gladstone-Dale relation
since, to our knowledge, there is no direct measurement of their refractive indices. The term
mass density in this work refers to the mass density only of chromatin (i.e., in the absence of
water). Thus, the mass density of euchromatin is 0.1 g/ml and the heterochromatin is 0.3 g/ml
[44–47], in the Gladstone-Dale relationship is 0.2 ml/g [48, 49] for chromatin, and the
refractive index for water is 1.33. The final 2D refractive index distribution n x, y is shown
in Fig. 1(d).
Using convolution theorem, we calculate the autocorrelation function of n x, y , where
n x, y n x, y cytn :
2
1
, , ,
,
nB x y n x y n x x y y dxdy
F F n x y
(10)
By assuming that the samples from the same region of the same patient are statistically
isotropic, we convert this 2D autocorrelation function ,nB x y into the 1D autocorrelation
function ( )n dB r :
2 , cos , sinD
n d n n d dB r B x y d B r r d (11)
Vol. 7, No. 11 | 1 Nov 2016 | BIOMEDICAL OPTICS EXPRESS 4755
where 2D
n dB r denotes the autocorrelation function from 2D images.
3.1.3 Extract 3D autocorrelation function from 2D TEM images
Note that the 2D
n dB r obtained in the last subsection is from 2D images. However,
scattering happens in 3D and n dB r cannot fully represent the statistics of 2D
n dB r . This is
because the 2D image is only one slice of the full 3D nucleus. A 3D image of the nucleus
would consists of many 2D slices, depending on the thickness of the slices and nucleus. So
the statistical information in the 2D image of the sample is not enough to represent the full
statistical properties of the 3D sample. The difference between 2D
n dB r and n dB r is
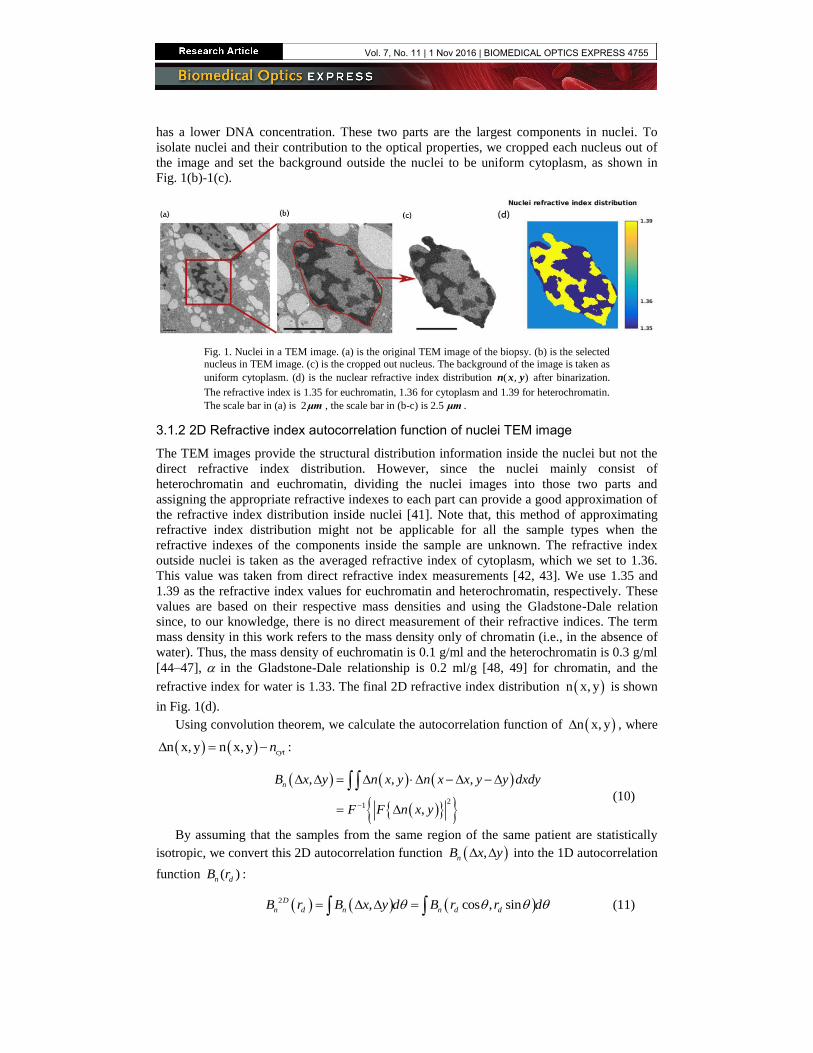
shown in Fig. 2(b). The 3D random media (RM) in Fig. 2 is generated using the WM model
through a publicly available MATLAB code [50]. We assume biological media is statistically
homogeneous, therefore we can average a sufficiently large number (N) of 2D
n dB r to
represent n dB r . Figure 2(c) shows the convergence of 2D
n dB r and n dB r with average N
= 1000 2D
n dB r . We present a method to determine the minimum N of 2D
n dB r images
needed to average over to accurately represent n dB r of biological samples. The minimum
N is dependent on the sample properties and image parameters. To best model the biological
sample, we model tissue using the versatile WM correlation family discussed in Sec. 2 with
biologically relevant parameters, D = 3 and 1nl m [23]. For the image parameters, the
resolution and grid size of our TEM images are dx 10nm and grid_size 801 . We
generated the RM with these four inputs. To determine the minimum N needed to represent
n dB r from a 3D sample, we compared n dB r from 3D media to 2D
n dB r averaged over
1 to 15 2D images of RM. The results from these steps show that after averaging 2D
n dB r
from 10 RM 2D slides, 2D
n dB r converges to n dB r with 2R > 99%. Figure 2(c), 2(e), and
2(f) shows these results. Based on these observed results, we divide all the TEM images in
each group into subgroups and each subgroup contains 10 TEM images of nuclei. The n dB r
of each subgroup is averaged over 10 2D
n dB r of TEM images in that subgroup.
Vol. 7, No. 11 | 1 Nov 2016 | BIOMEDICAL OPTICS EXPRESS 4756
Fig. 2. Extracting ( )n d
B r from 2D images. (a) is an example of numerically generated random
media. (b) shows the difference between ( )n d
B r from 3D random media and 2D random
media. (c) shows the 2
( )D
n dB r from 2D slides of random media converge to ( )
n d B r from 3D
RM. (d) is one example of RM with biological parameters of the nuclei TEM images. (e)
shows the R2 between ( )n d
B r and N averaged2
( )D
n dB r . This result shows that when 10N ,
R2 between ( )n d
B r and ( )n d
B r from averaging over N 2
( )D
n dB r is larger than 99% and the
difference is negligible. (f) is an example of ( )n d
B r after averaging over 10 2
( )D
n dB r of
nuclei TEM images(RI represents refractive index).
3.2 Calculate optical properties from the autocorrelation function
The differential scattering cross section σ(θ,k) and the spectrum of g, g(λ) , for the
measured sample can be calculated from n dB r using Eqs. (3)-(6), with the relation
k 2π / λ . The phase function measure from TEM images P (θ)TEM at a specific wavelength
0λ will be:
0 0( ) ( ,2 / )TEMP A (12)
where A0 is a normalization factor so that:
2
0 0( )sin 1TEMP d d
(13)
The shape factor D can be calculated with the exponential relationship between *
sl and D-
4, as shown in Eq. (8). We fit the spectrum of *
sl in the range of k corresponding to 600 nm
to 700 nm to find D. To simplify the calculation, we take the log of both sides of Eq. (8) to
get Eq. (14).
Vol. 7, No. 11 | 1 Nov 2016 | BIOMEDICAL OPTICS EXPRESS 4757
*log( ( )) ( 4)logsl k D k C (14)
where C is a constant independent of D and k. We fit the data with a linear regression and the
slope of the line is equal to D-4.
4. Result
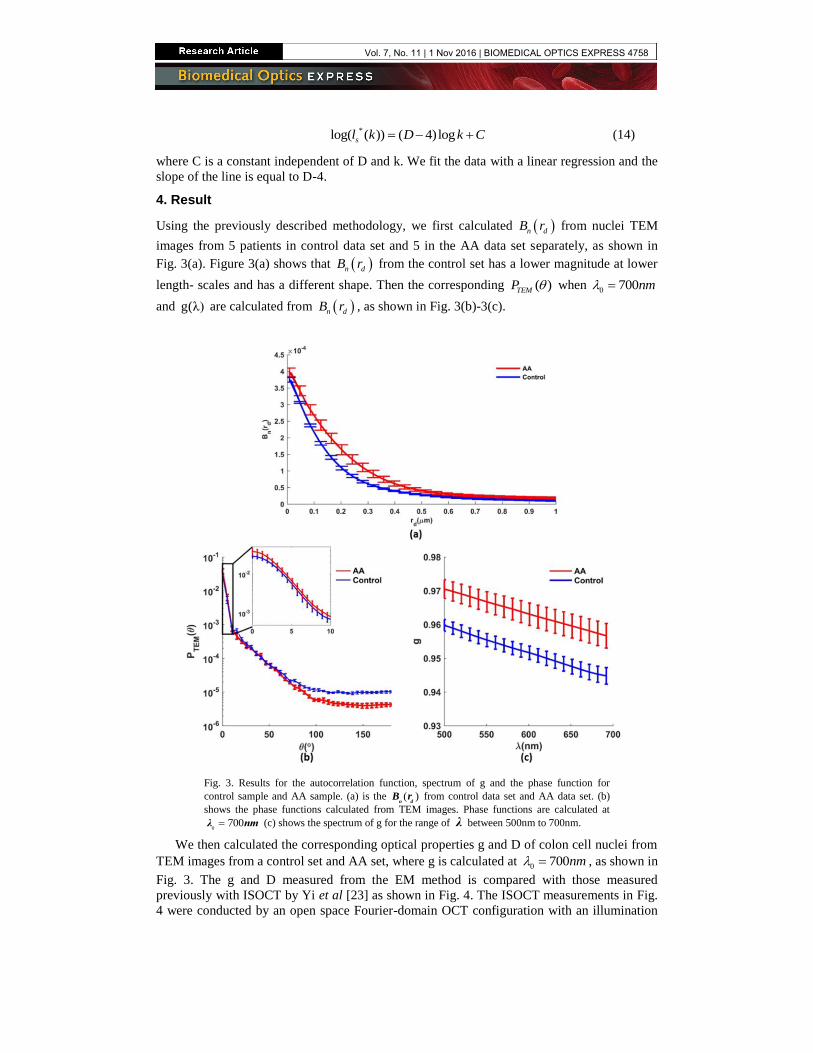
Using the previously described methodology, we first calculated n dB r from nuclei TEM
images from 5 patients in control data set and 5 in the AA data set separately, as shown in
Fig. 3(a). Figure 3(a) shows that n dB r from the control set has a lower magnitude at lower
length- scales and has a different shape. Then the corresponding ( )TEMP when 0 700nm
and g(λ) are calculated from n dB r , as shown in Fig. 3(b)-3(c).
Fig. 3. Results for the autocorrelation function, spectrum of g and the phase function for
control sample and AA sample. (a) is the ( )n d
B r from control data set and AA data set. (b)
shows the phase functions calculated from TEM images. Phase functions are calculated at
0700λ nm (c) shows the spectrum of g for the range of λ between 500nm to 700nm.
We then calculated the corresponding optical properties g and D of colon cell nuclei from
TEM images from a control set and AA set, where g is calculated at 0 700nm , as shown in
Fig. 3. The g and D measured from the EM method is compared with those measured
previously with ISOCT by Yi et al [23] as shown in Fig. 4. The ISOCT measurements in Fig.
4 were conducted by an open space Fourier-domain OCT configuration with an illumination
Vol. 7, No. 11 | 1 Nov 2016 | BIOMEDICAL OPTICS EXPRESS 4758

wavelength ranging from 650 to 800 nm. The samples measured were colonic mucosa
biopsies consisting of a 20 to 30 μm epithelial cell layer surrounded by the lamina propria
from 85 patients with and without colorectal adenomas. The epithelial layer is segmented out
of the image to isolate the ISOCT signal from its constituent cells as described by Yi et al
[23]. The cell segmentation gives ISOCT the ability to quantify the average optical properties
of multiple cells.
Because of the differences in n dB r shown in Fig. 3(a), the optical properties calculated
from each set are significantly different. Both g and D increase from control set to AA set.
The comparison in Fig. 4 shows agreement in the values of D and g between the two studies
with differences less than 5% and 10% respectively. The differences between the two studies
likely originate from the fact that ISOCT averages the optical property over whole cells and
many organelles. While it lacks the resolution to isolate the nucleus; the largest contribution
to the average optical properties of the cell is likely from the nucleus. Assuming most of the
OCT signal measured from epithelial cells originates from their nuclei [51, 52], the agreement
of the results between this method and ISOCT measurements illustrates the accuracy of our
method. The increase in g and D in the AA set originates from the flatter slope of n dB r .
Since the rate of change in n dB r describes how rapidly the structure is changing, the
structures sharing similar refractive index should be larger in the AA set. This is explained by
the increase in the volume fraction of heterochromatin in the AA set, as previously observed
by Cherkezyan et al [35]. While the increase of heterochromatin implies a decrease of
euchromatin, the volume fraction of heterochromatin is smaller compared with euchromatin
[35]. This means that the heterochromatin’s volume change would cause more dramatic
change to the autocorrelation function.
Fig. 4. Results of the optical property calculated from colon cell nuclei TEM images, compared with ISOCT result.’*’ indicates the p-value is smaller than 0.05. The result from
TEM image shows significant difference in g and D between control data set and AA set.
Compared with ISOCT measurement, the TEM method shows the same trend between control and AA for g and D. In the case of D, the values between two methods match with each other
within 5%.
One great advantage of this analytical technique is that it calculates the real phase function
from the sample, without fitting to any analytical model. For instance, the HG phase function
is one of the commonly used models to represent the scattering phase function for biological
samples and has the following form:
2
2 3/2
1 1( )
4 [1 2 cos( )]HG
gP
g g
(15)
Vol. 7, No. 11 | 1 Nov 2016 | BIOMEDICAL OPTICS EXPRESS 4759
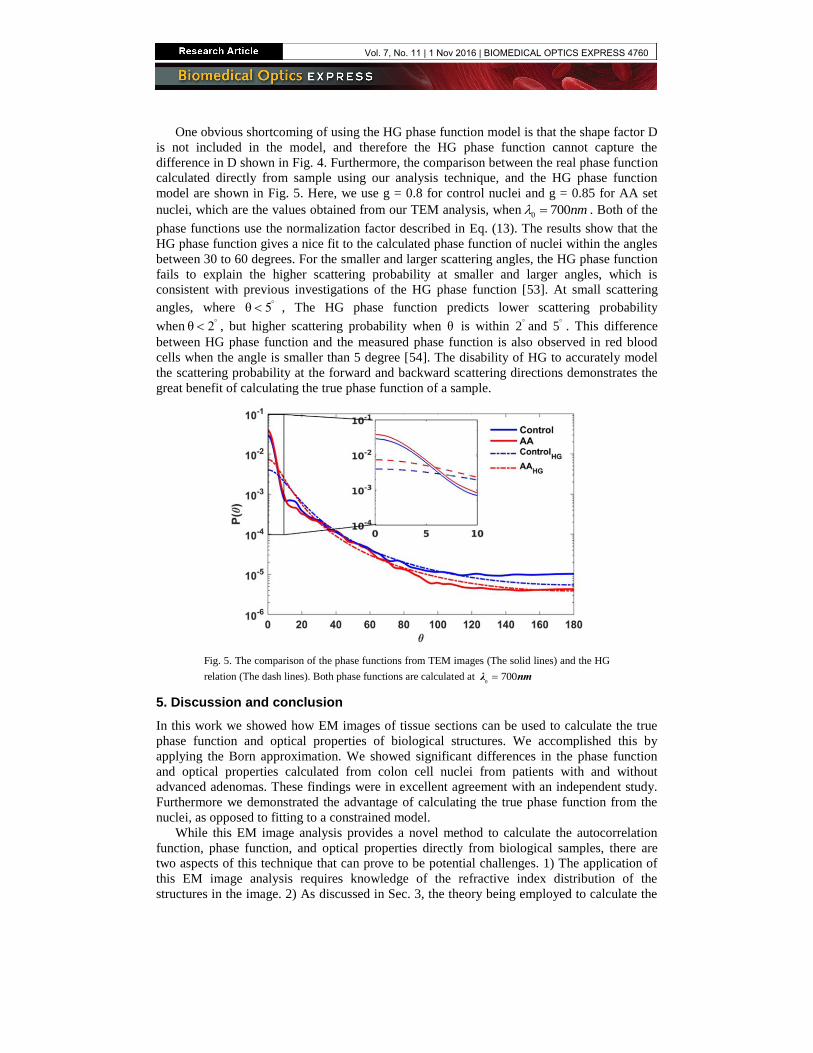
One obvious shortcoming of using the HG phase function model is that the shape factor D
is not included in the model, and therefore the HG phase function cannot capture the
difference in D shown in Fig. 4. Furthermore, the comparison between the real phase function
calculated directly from sample using our analysis technique, and the HG phase function
model are shown in Fig. 5. Here, we use g = 0.8 for control nuclei and g = 0.85 for AA set
nuclei, which are the values obtained from our TEM analysis, when0 700nm . Both of the
phase functions use the normalization factor described in Eq. (13). The results show that the
HG phase function gives a nice fit to the calculated phase function of nuclei within the angles
between 30 to 60 degrees. For the smaller and larger scattering angles, the HG phase function
fails to explain the higher scattering probability at smaller and larger angles, which is
consistent with previous investigations of the HG phase function [53]. At small scattering
angles, where θ 5 , The HG phase function predicts lower scattering probability
when θ 2 , but higher scattering probability when θ is within 2 and 5 . This difference
between HG phase function and the measured phase function is also observed in red blood
cells when the angle is smaller than 5 degree [54]. The disability of HG to accurately model
the scattering probability at the forward and backward scattering directions demonstrates the
great benefit of calculating the true phase function of a sample.
Fig. 5. The comparison of the phase functions from TEM images (The solid lines) and the HG
relation (The dash lines). Both phase functions are calculated at 0
700λ nm
5. Discussion and conclusion
In this work we showed how EM images of tissue sections can be used to calculate the true
phase function and optical properties of biological structures. We accomplished this by
applying the Born approximation. We showed significant differences in the phase function
and optical properties calculated from colon cell nuclei from patients with and without
advanced adenomas. These findings were in excellent agreement with an independent study.
Furthermore we demonstrated the advantage of calculating the true phase function from the
nuclei, as opposed to fitting to a constrained model.
While this EM image analysis provides a novel method to calculate the autocorrelation
function, phase function, and optical properties directly from biological samples, there are
two aspects of this technique that can prove to be potential challenges. 1) The application of
this EM image analysis requires knowledge of the refractive index distribution of the
structures in the image. 2) As discussed in Sec. 3, the theory being employed to calculate the
Vol. 7, No. 11 | 1 Nov 2016 | BIOMEDICAL OPTICS EXPRESS 4760
power spectral density function requires calculation of a 3D autocorrelation function from the
sample (i.e., it requires a 3D nanoscale image of the sample).
The first aspect was a challenge in this study due to the dying process the tissue sections
underwent during sample preparation. This process does not necessarily allow a linear
relationship between the refractive index distribution and the image intensity. However, since
the refractive index of chromatin is known, the binary process described in Sec. 3 allowed us
to overcome this challenge. The binary process will reduce the real fluctuations of the
refractive index distribution, and consequently decrease the absolute value of the
autocorrelation function. However, these fluctuations are not significant compared with the
drastic difference in refractive index between euchromatin and heterochromatin. This binary
method can be used in many different biological structures with the caveat that it requires
knowledge of the refractive index of each component in the sample image. This means that
measuring the optical properties of larger biological samples like whole cells and bulk tissue
with this same technique could be challenging because of the lack of experimental
measurements of the refractive index of the different components in the samples. For samples
with many components with unknown refractive indexes, the recently developed EM
techniques that require no staining might open the door to measuring the refractive index
distribution directly of the sample [55, 56]. In these unstained EM images, the intensity of
EM image will have an approximately linear relationship with the mass density of the sample.
The refractive index distribution of the sample can be easily calculated by applying the
Gladstone-Dale relationship.
As discussed in Sec. 3, we overcame the second challenge by using 2D TEM images and
averaging them to represent the 3D autocorrelation function. This solution is valid under the
assumption that the sample is statistically isotropic. This was necessary due to the lack of 3D
nanoscale imaging data sets of biological samples. In the case of measuring a statistically
anisotropic sample, the direct 3D nanoscale imaging is needed to calculate the optical
properties accurately.
With the possibility of unstained EM techniques, the refractive index distribution of the
sample can be measured directly with EM without prior knowledge of the refractive index of
each component in the sample. This would allow the EM analysis technique to provide an
independent validation of optical property measurements and better understanding of the
microscopic origins of the optical properties of cells and tissues in diseased and healthy
states. This understanding is crucial for the development, validation and implementation of
biomedical optics diagnostic techniques. Specifically, the further application and
development of this method can bring us three key benefits: 1) Extraction of the real phase
function from any tissue type. 2) The optical properties of each organelle in tissue can be
measured independently. 3) Establishing a connection between optical properties and
nanoscale structure (e.g. organelles) allows in-depth investigation of the nano-architecture of
cells and tissue using optical techniques.
The difference between the real phase function calculated from TEM nuclei images and
the HG phase function model indicates that the HG model cannot capture the phase function
of the biological sample at small and large angles. This is partially because the HG model
does not have a dipole factor, which leads to an observed non-monotonic shape at smaller
angles [27, 57, 58]. With the development of experimental methods measuring different
optical properties, a method that can retrieve the real phase function is necessary to explain
the observed data. There is no phase function model which is capable of precisely modeling
all biological samples. To extract the true optical properties of any biological sample, the real
phase function is necessary. Extracting the real phase function is also very useful for
simulation methods (e.g. Monte Carlo) that use the phase function as an input. These
simulations traditionally make assumptions about the shape of the phase function by using
models like the HG model [26, 29, 30, 59]. However, inputting the real phase function of a
Vol. 7, No. 11 | 1 Nov 2016 | BIOMEDICAL OPTICS EXPRESS 4761
sample from this EM analysis will significantly improve the accuracy of light transport
simulations.
The isolation of optical properties of organelles can improve the accuracy of optical
diagnostic tools. Many existing diagnostic instruments use optical properties as a marker of
disease progression and as the disease progresses this biomarker becomes altered. Our
method can isolate the source of this alteration in terms of changes to the organelle structures.
This allows researcher to build a direct connection between their optical measurements, and
the subcellular alterations in their studies. This can lead to better understanding of disease
progression, and improve the development of optical instruments and help improve their
ability to target specific structural alterations in disease progression.
Using optical measurements to interpret the nanostructure of biological samples can
largely reduce the need for nanoscale imaging. Once the connection between optical
properties and the nanostructure of biological samples is built, the repeated measurements of
samples by using nanoscale imaging techniques will not be necessary. In other words, the
results from optical property measurements can be remapped to the nanostructure information
of the sample, which will save time and consumable cost from using nanoscale imaging
techniques.
In summary, we developed a methodology of using EM to calculate the optical properties
of biological samples from their nano-scale images. The optical properties of cell nuclei
measured by this method are validated by an independent optical technique, ISOCT. With
further development, we envision this technique could become a standardized method to
validate new experimental instruments that measure optical properties. Also, this EM analysis
technique provides a way to gain a crucial understanding of the structural origins of optical
properties for a given sample. In this work we validated the assumption that changes in
chromatin organization are primarily responsible for the optical property changes in colon
epithelia observed in a separate study. To investigate other structures responsible for the
altered optical properties, we can extend these investigations to other cellular structures such
as mitochondria and other organelles.
Funding
National Institutes of Health (NIH) (R01CA183101, F31EB022414); National Science
Foundation (NSF) (EFRI-1240416); National Cancer Institute (NCI) (U54CA193419)
Acknowledgment
The authors would like to acknowledge Graham Spicer and Benjamin Keane for their help in
reviewing the manuscript.
Vol. 7, No. 11 | 1 Nov 2016 | BIOMEDICAL OPTICS EXPRESS 4762