using fast data to improve fleet management presenters adlore chaudier ph.d., mercury associates...
TRANSCRIPT
Government Executive Today, May 23, 2012• Even as more federal agencies embrace the idea of increased
data analysis, many don’t know what to do with this newfound information.
Association of Government Accountants and Accenture survey• 67 % of federal officials said their organization analyzes datause the findings to make fact-based decisions 46 % of the “yes” responses reported a “low” integration of
analytics into agency managementlow level defined as data analytic processes conducted in silos
with little consistency or standardizationA process known as “data analytics”
2
Develop and implement fleet management processes and tools to meet your fleet
management reporting and management needs at all organizational levels.
Implement a set of standard performances measures that provide on-going benchmarks and
improvement goals for fleet management.
3
Performance measurement is part of a strategic (that is, planned and forward looking) approach to fleet management.
Counterproductive to have a plan but not know whether the plan is being followed and producing desired results.
Performance measurement allows an organization to:◦Reduce reliance on subjective judgment and speculation◦ Track performance against standards and benchmarks◦Hone in on areas that require improvement◦ Track trends over time
4
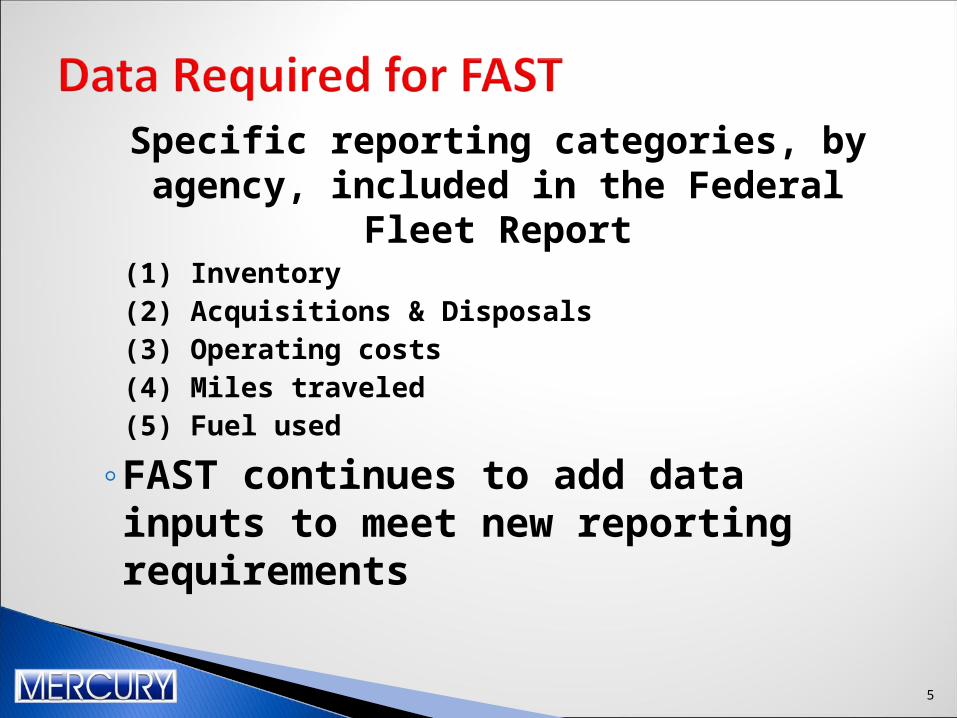
Specific reporting categories, by agency, included in the Federal Fleet Report
(1) Inventory(2) Acquisitions & Disposals(3) Operating costs(4) Miles traveled(5) Fuel used
◦FAST continues to add data inputs to meet new reporting requirements
5

No FMIS in place to standardize data-gathering and reporting
Insufficient information gathered by the field FAST reporter (need a FAST Handbook)
Unaware of FAST reports available on GSA Reports Carryout
No standard processes for gathering and reporting data No standard performance measures Unaware of the FAST Data Quality Consistency Report
or how to read and apply the data tables and charts Increased data demands but no increase in personnel Everyone is too busy as data moves up the hierarchy
6

Because reporting FAST data has become an end in itself rather than a means to an end
In other words . . .Use FAST data
to improve fleet management!
7

8
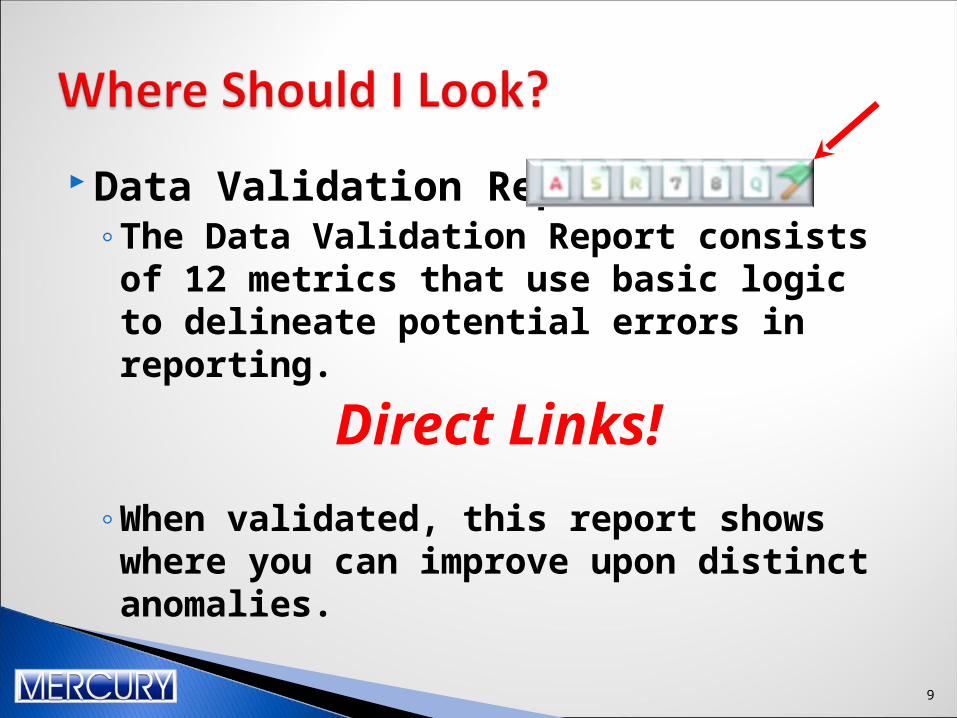
Data Validation Report◦The Data Validation Report consists of 12 metrics
that use basic logic to delineate potential errors in reporting.
Direct Links!◦When validated, this report shows where you can
improve upon distinct anomalies.
9
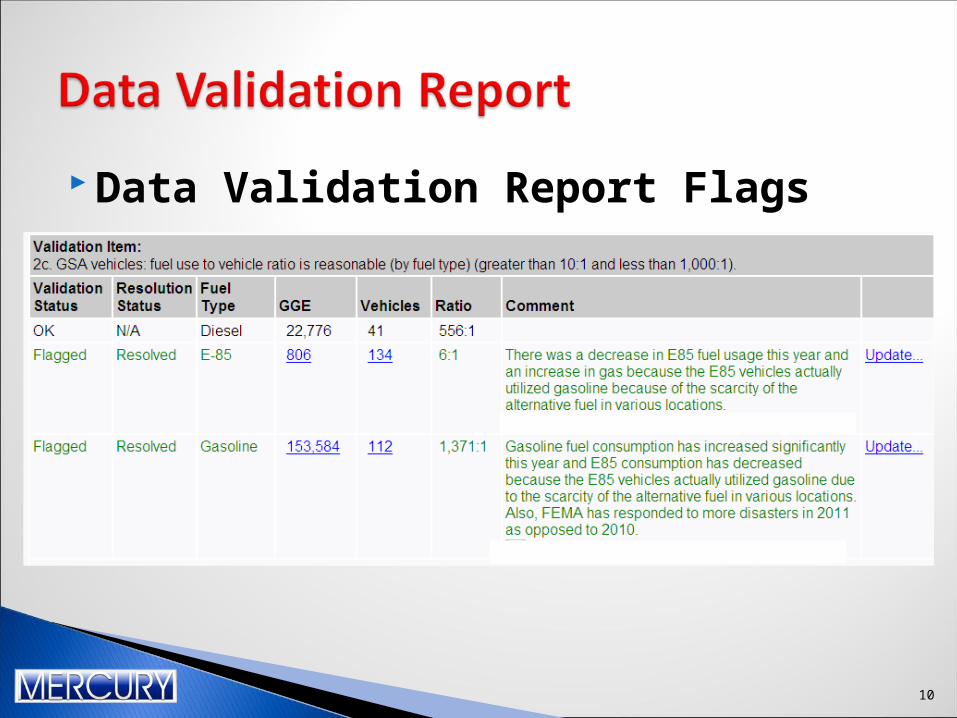
Data Validation Report Flags
10

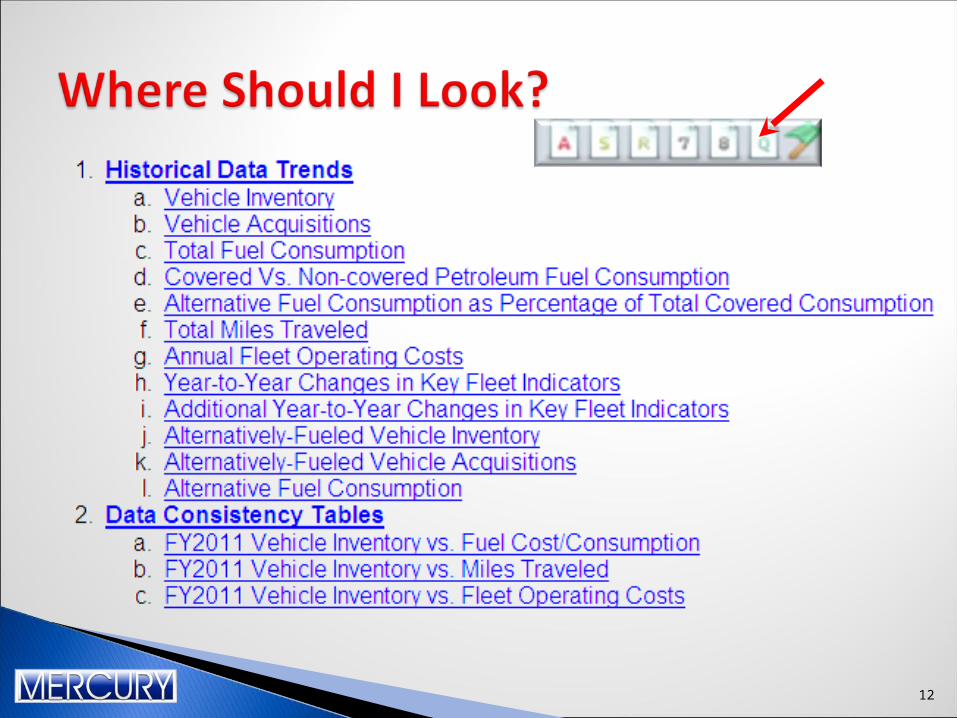
Data Quality and Consistency Report◦Presents overview trends and supporting data tables
◦ Includes your agency and subordinate fleet elements within the FAST reporting hierarchy
◦Starts FY2003 through the current FY
◦Goal is to help ensure consistency and quality of the data for corresponding fleet element(s), both across years and within different data segments (vehicles, fuel, costs, and mileage) for the current FY.
11
12

Cleanliness of Sub-Agency/Sub-Component Reporting◦High confidence level in data◦Drives succinct conversation◦Site-visits◦Best practices◦FMIS potential adoption
13
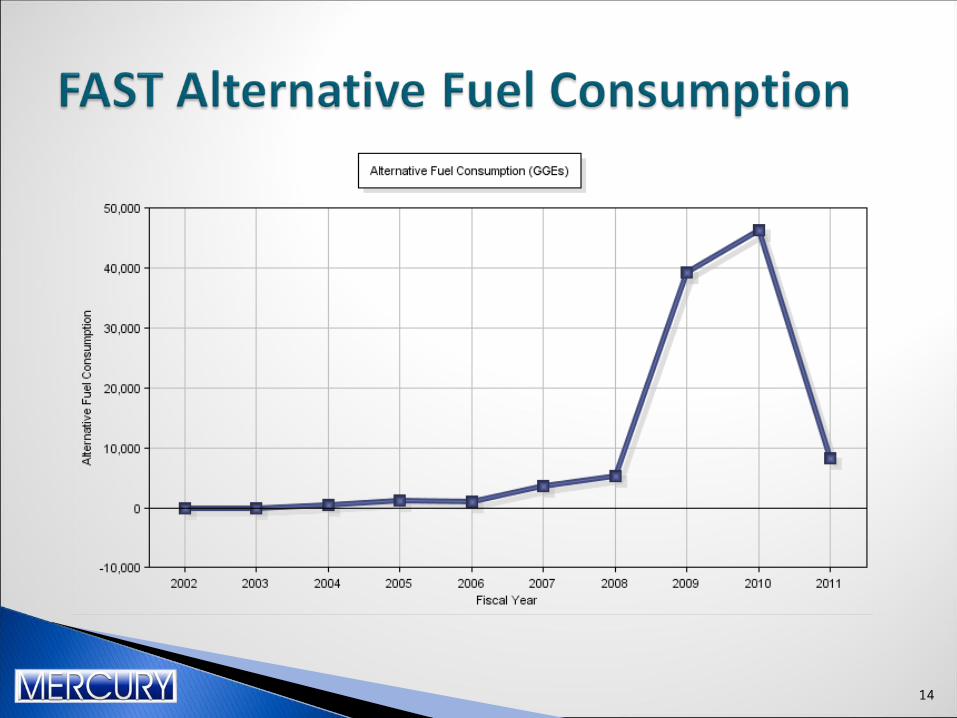
14

15

16
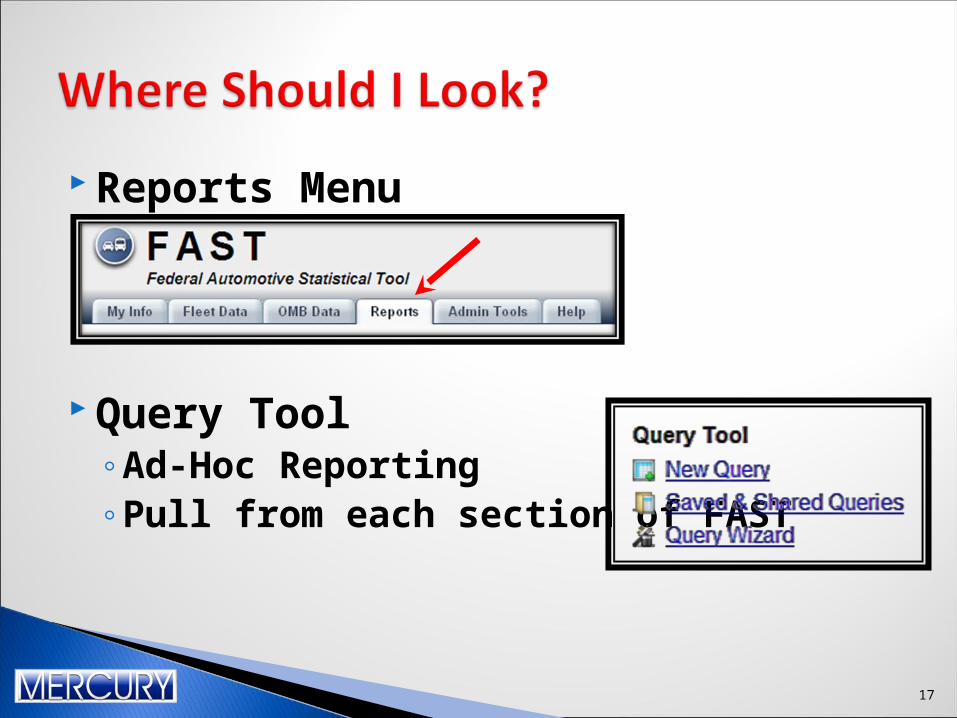
Reports Menu
Query Tool◦Ad-Hoc Reporting◦Pull from each section of FAST
17

18
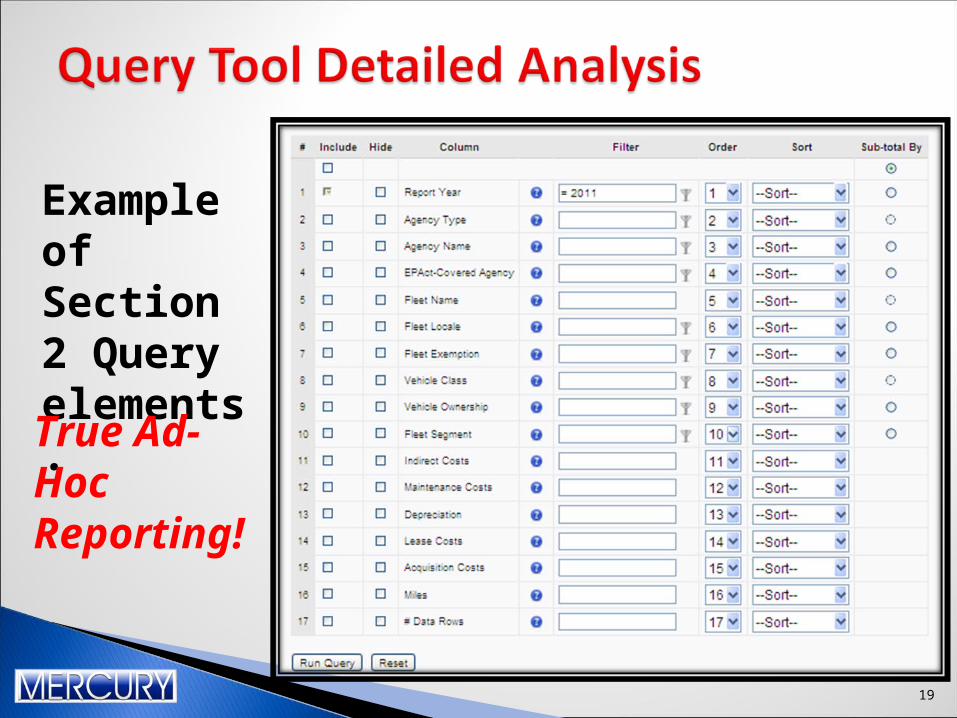
Example of Section 2 Query elements.
True Ad-HocReporting!
19
20

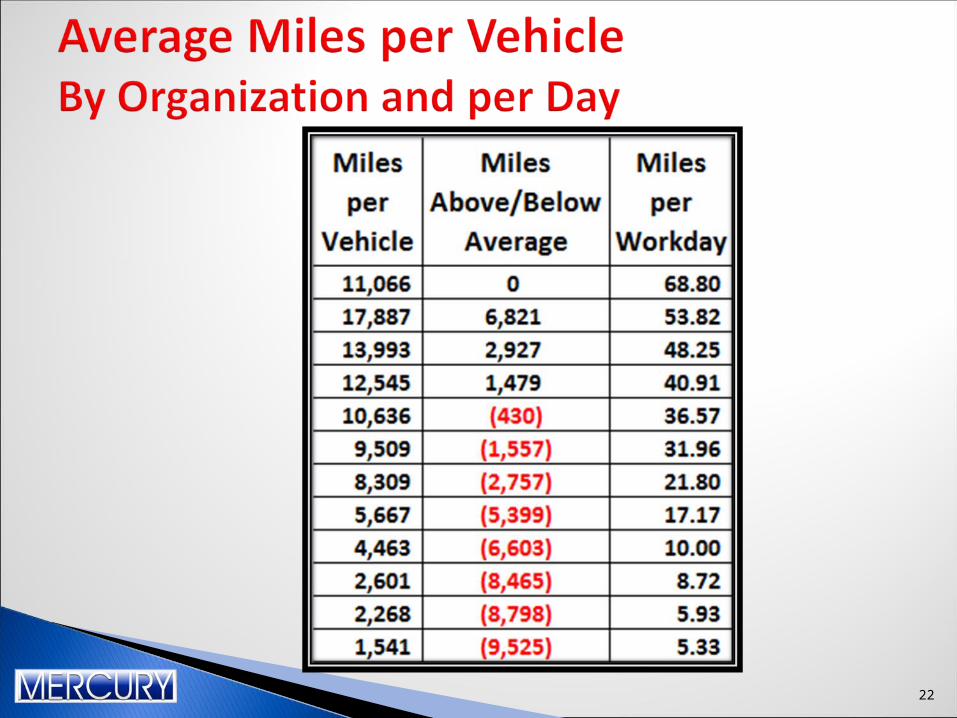
21
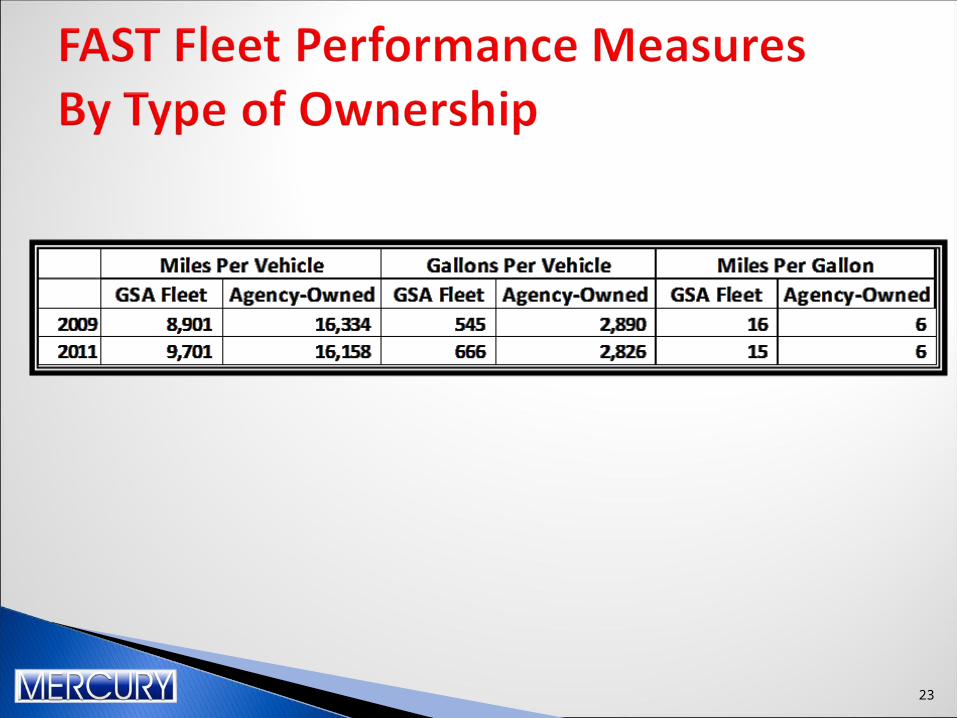
22
23
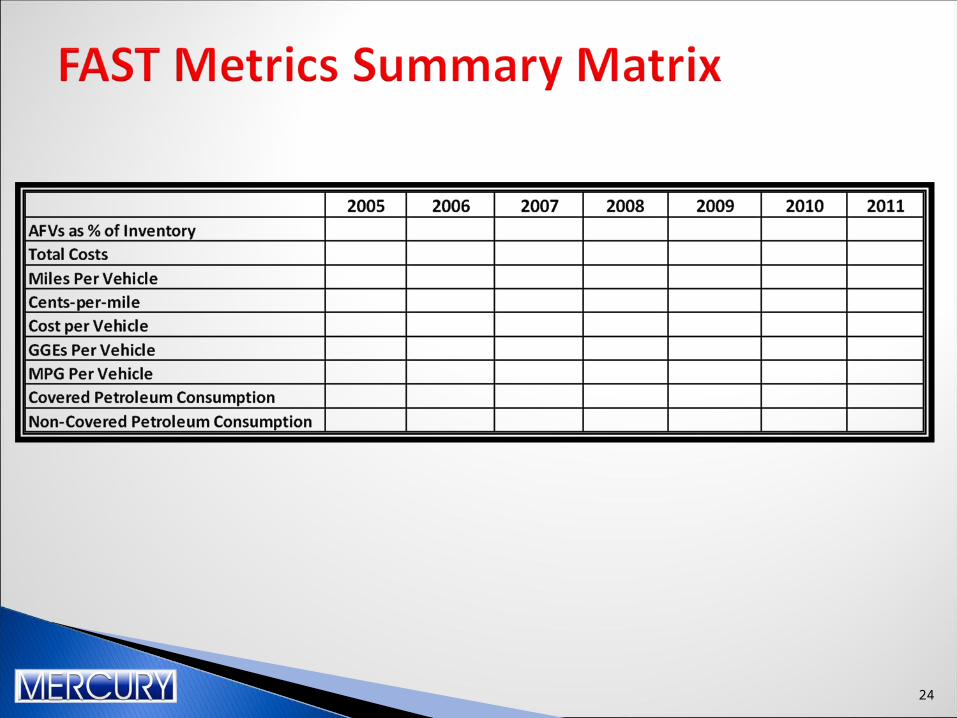
24
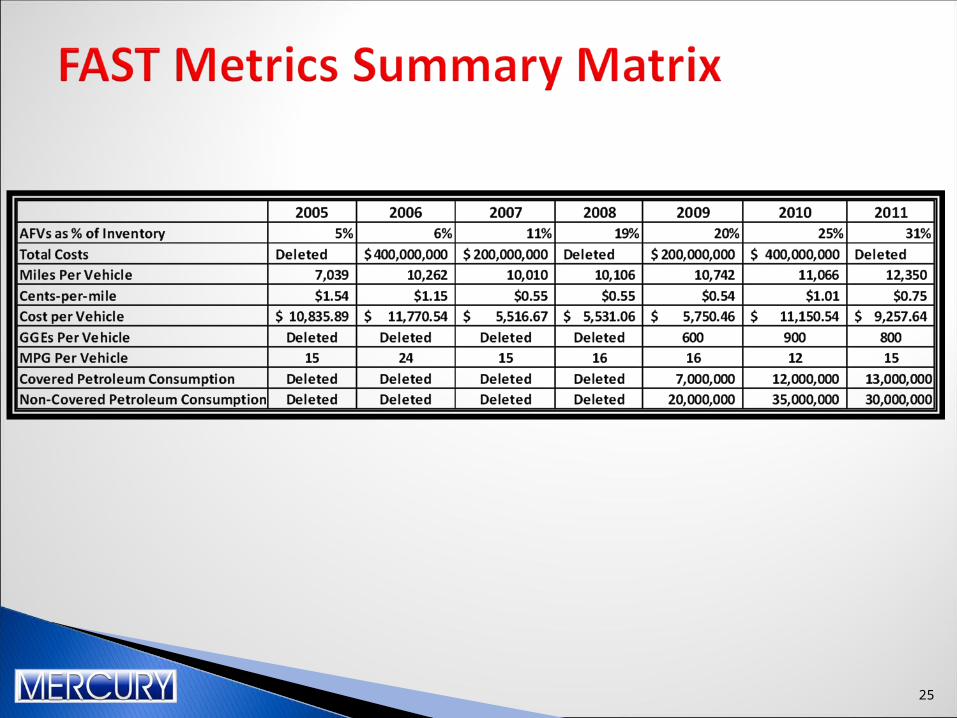
25
26

27
28
29
30

31
32
33
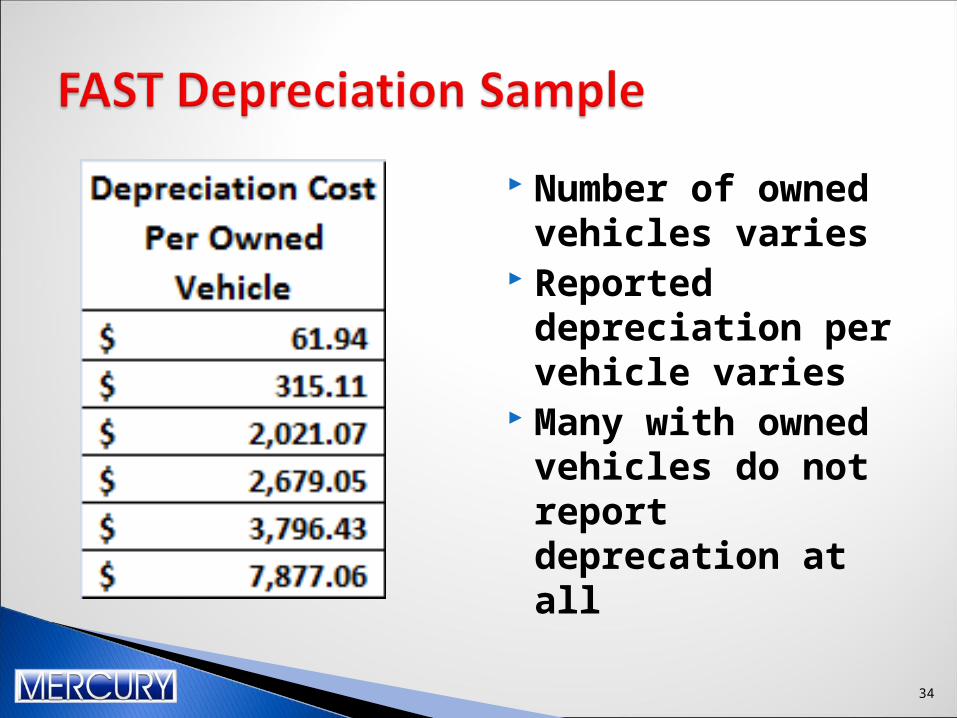
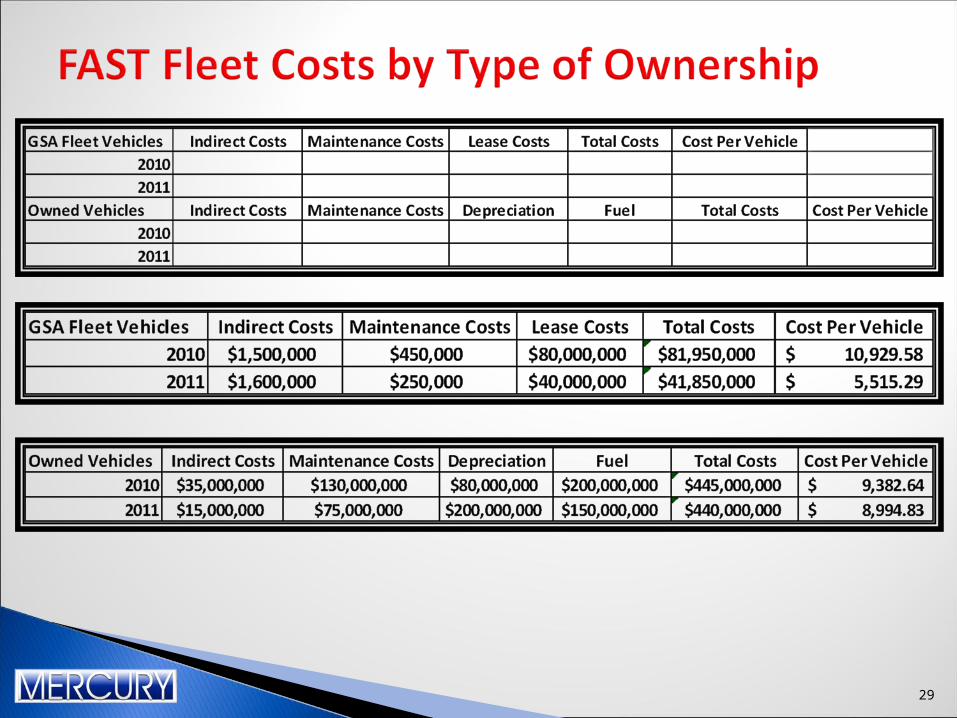
Number of owned vehicles varies
Reported depreciation per vehicle varies
Many with owned vehicles do not report deprecation at all
34
35
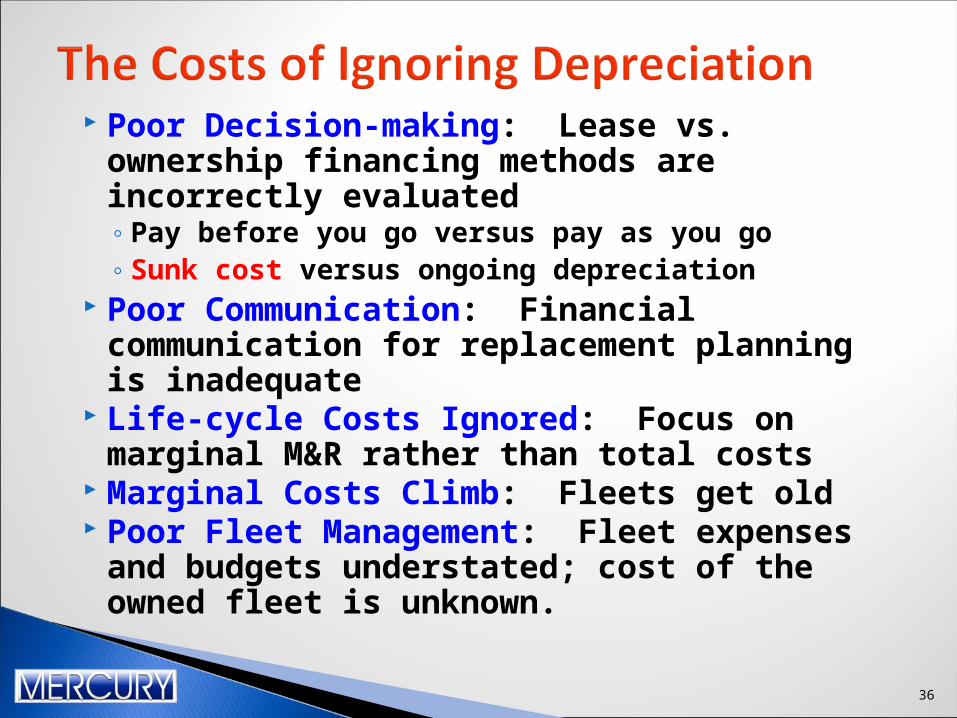
Poor Decision-making: Lease vs. ownership financing methods are incorrectly evaluated◦ Pay before you go versus pay as you go◦ Sunk cost versus ongoing depreciation
Poor Communication: Financial communication for replacement planning is inadequate
Life-cycle Costs Ignored: Focus on marginal M&R rather than total costs
Marginal Costs Climb: Fleets get old Poor Fleet Management: Fleet expenses and
budgets understated; cost of the owned fleet is unknown.
36
What gets measured, gets managed.
Does your organization manage depreciation?
37
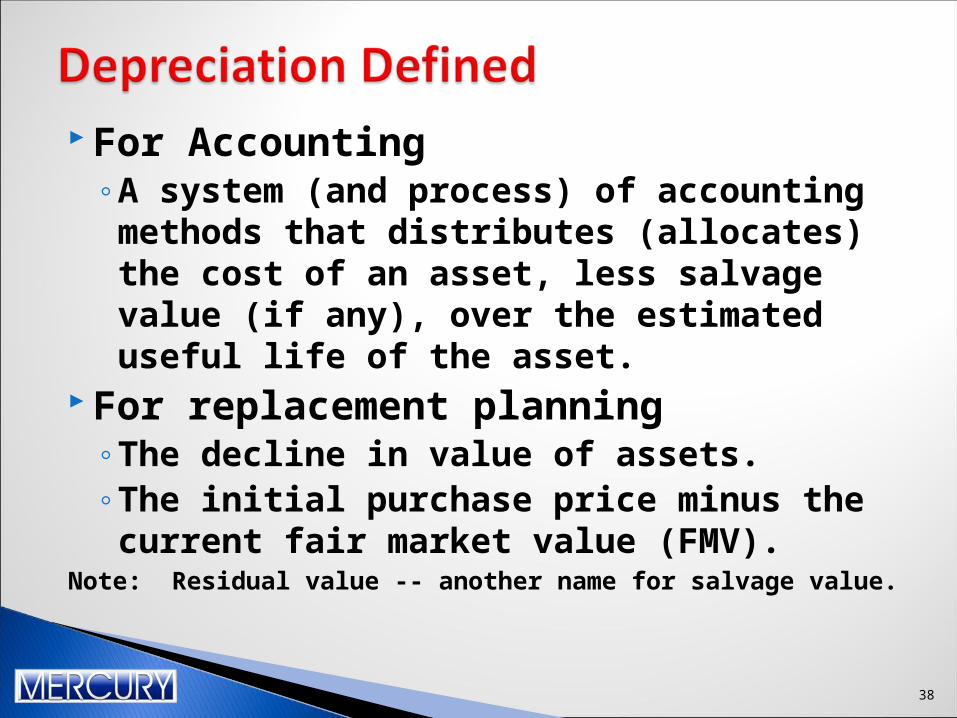
For Accounting◦A system (and process) of accounting methods
that distributes (allocates) the cost of an asset, less salvage value (if any), over the estimated useful life of the asset.
For replacement planning ◦The decline in value of assets.◦The initial purchase price minus the current fair
market value (FMV).Note: Residual value -- another name for salvage value.
38

39

• Click on the Help Tab• Select the Section II Simplified Depreciation
Worksheet
40
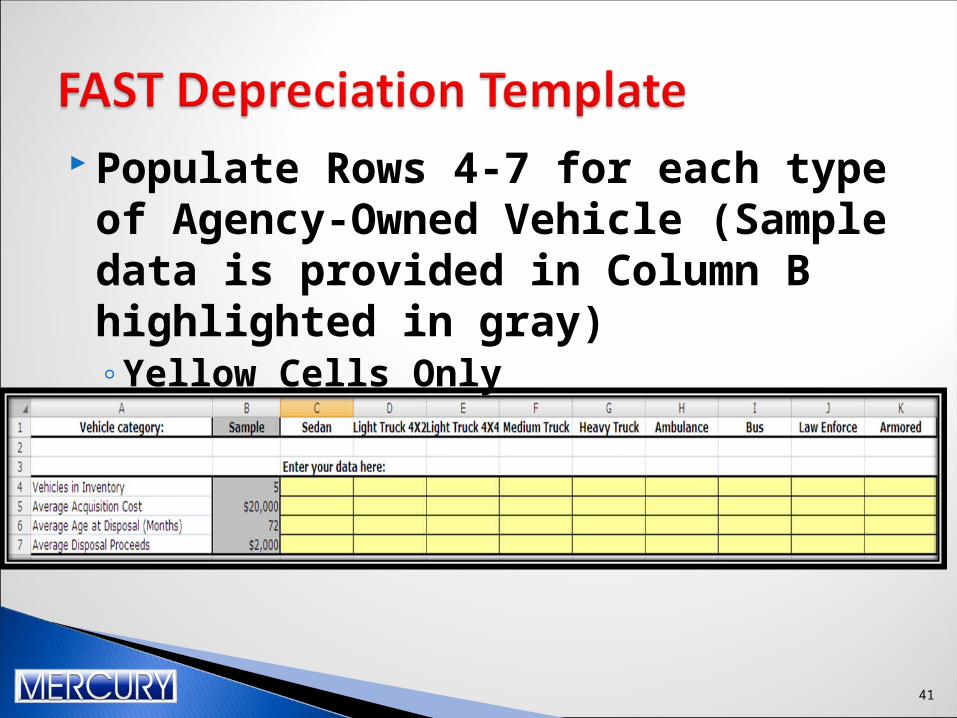
Populate Rows 4-7 for each type of Agency-Owned Vehicle (Sample data is provided in Column B highlighted in gray)◦Yellow Cells Only
41
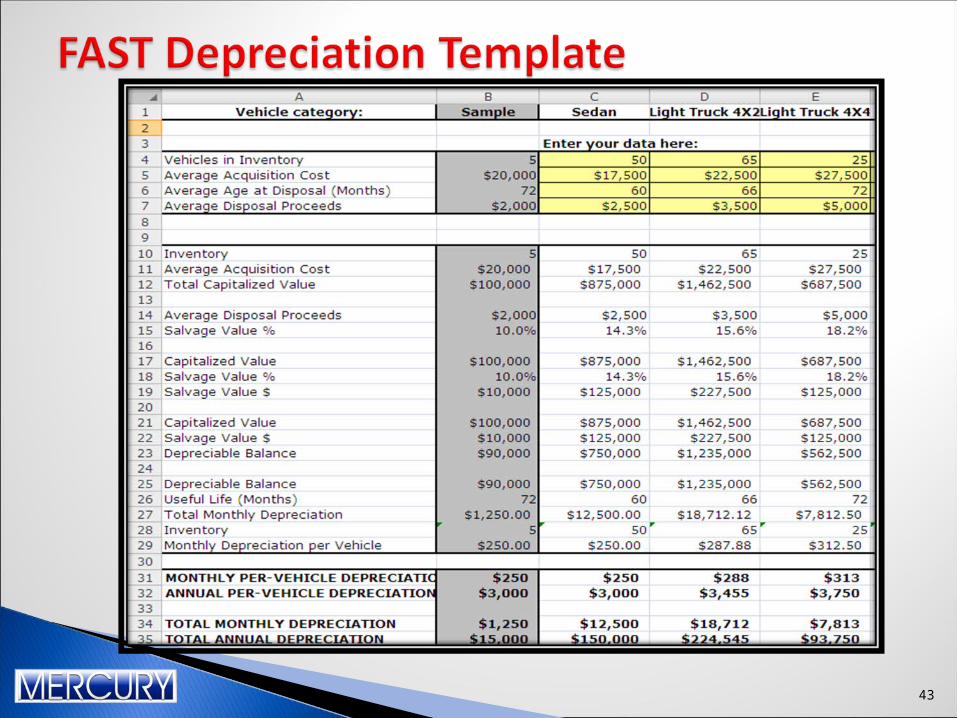
The remainder of the values will be auto-populated from populating rows 4-7.◦The totals on row 35 should be reported in
FAST.
42
43
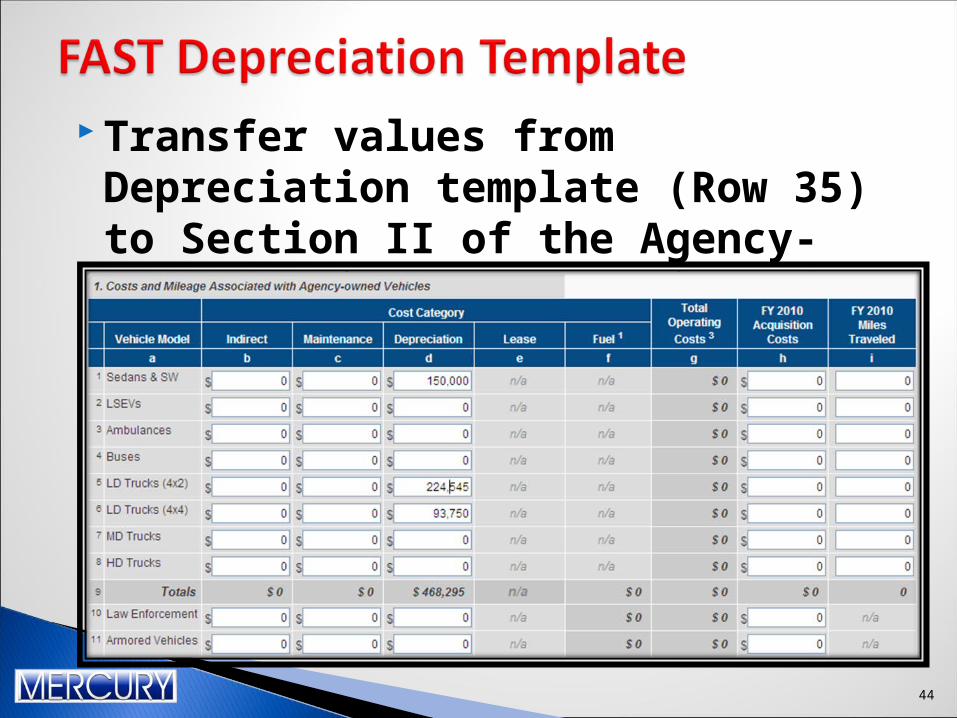
Transfer values from Depreciation template (Row 35) to Section II of the Agency-Owned vehicle calculations for depreciation.
44
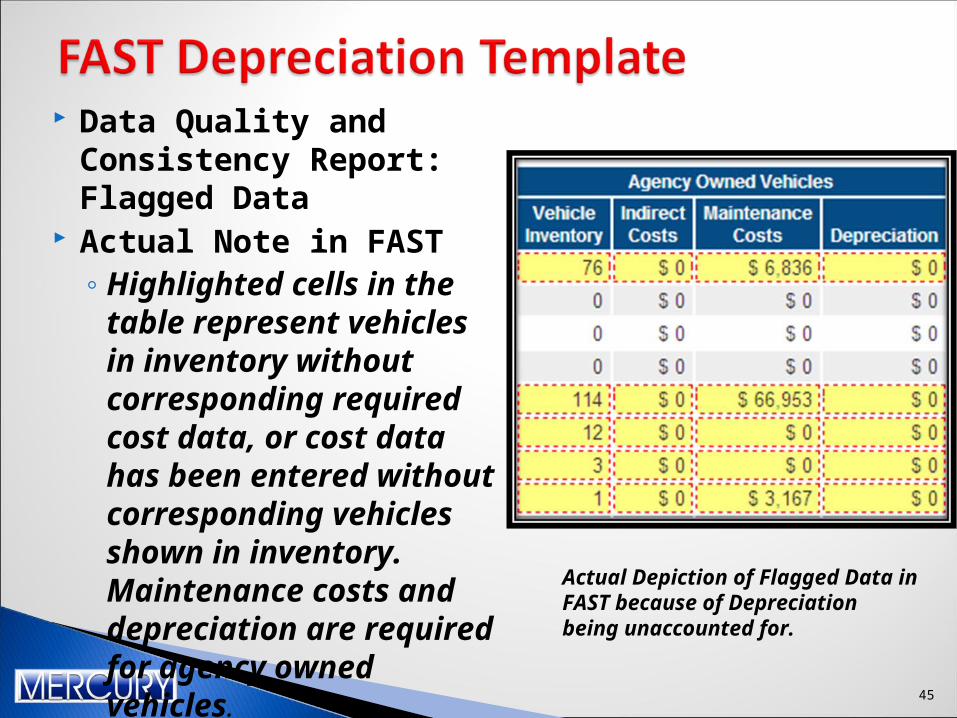
Data Quality and Consistency Report: Flagged Data
Actual Note in FAST◦Highlighted cells in the table
represent vehicles in inventory without corresponding required cost data, or cost data has been entered without corresponding vehicles shown in inventory. Maintenance costs and depreciation are required for agency owned vehicles.
Actual Depiction of Flagged Data in FAST because of Depreciation being unaccounted for.
45

MERCURY ASSOCIATES, INC.“Specializing in the science of fleet management.”
For more information, contact:
Adlore Chaudier Ph.D.Director, Federal Fleet [email protected]
262-215-5566 (cell)
Justin McLeod Fleet Management [email protected]
202-573-4254 (cell)