using humans as sensors: an estimation-theoretic perspective
TRANSCRIPT
Using Humans as Sensors: An Estimation-theoreticPerspective
Dong Wang1, Md Tanvir Amin1, Shen Li1, Tarek Abdelzaher1, Lance Kaplan2,Siyu Gu1, Chenji Pan1, Hengchang Liu6, Charu C. Aggarwal3, Raghu Ganti3,
Xinlei Wang4, Prasant Mohapatra4, Boleslaw Szymanski5, Hieu Le71Department of Computer Science, University of Illinois at Urbana Champaign, Urbana, IL 61801
2Networked Sensing and Fusion Branch, US Army Research Labs, Adelphi, MD 207833IBM Research, Yorktown Heights, NY 10598
4Department of Computer Science, University of California, Davis, CA 956165Department of Computer Science, Rensselaer Polytechnic Institute, Troy, NY 12180
6Department of Computer Science, University of Science and Technology of China, Hefei, Anhui 2300277Caterva, Inc. Champaign, IL 61820
Abstract—The explosive growth in social network contentsuggests that the largest “sensor network” yet might be human.Extending the participatory sensing model, this paper exploresthe prospect of utilizing social networks as sensor networks,which gives rise to an interesting reliable sensing problem. In thisproblem, individuals are represented by sensors (data sources)who occasionally make observations about the physical world.These observations may be true or false, and hence are viewedas binary claims. The reliable sensing problem is to determinethe correctness of reported observations. From a networkedsensing standpoint, what makes this sensing problem formulationdifferent is that, in the case of human participants, not only isthe reliability of sources usually unknown but also the originaldata provenance may be uncertain. Individuals may reportobservations made by others as their own. The contribution ofthis paper lies in developing a model that considers the impactof such information sharing on the analytical foundations ofreliable sensing, and embed it into a tool called Apollo that usesTwitter as a “sensor network” for observing events in the physicalworld. Evaluation, using Twitter-based case-studies, shows goodcorrespondence between observations deemed correct by Apolloand ground truth.
Categories and Subject DescriptorsH.4 [Information Systems Applications:] Miscellaneous
Keywords—humans as sensors, social sensing, data reliability,uncertain data provenance, maximum likelihood estimation, expec-tation maximization
I. INTRODUCTION
The advent of online social networks, such as Twitter, wherehumans volunteer free information at scale about the physicalworld, begs the question of whether or not they can be lever-aged as a category of sensor networks. Indeed, for example, inthe aftermath of the Boston Marathon bombing in the US, inApril 2013, individuals as well as authorities turned to Twitterfor real-time information on the evolving event. Twitter alsocarried some of the first descriptions of damage from the JapanTsunami, in March 2011. The Japan government later issueda study encouraging the use of social networks to assist withdisaster recovery. An interesting research question is whetherestimation-theoretic approaches can be used to reconstruct
the accurate state of the physical environment from socialobservations?
The reader must be cautioned that social networks carrya lot of extraneous information as well, such as subjectiveopinions (e.g., “It is an inspiring day!”) and personal emotions(e.g., “I am depressed”). These are not the topic of this paper asthey fall outside the scope of sensing applications that obserevethe external physical world.
We are interested in participatory sensing of external physi-cal state. In the aftermath of important events, many microblogentries offer physical descriptions of the event (e.g., “Shootingerupts on Libery Square!”). Such reporting is an act of sensingof the physical environment that is external to the (human)sensor. In this case, the physical environment has a uniquestate, leading to a unique ground truth, according to whichthese descriptions are either true or false (e.g., either therewas shooting on Liberty Square or not). It is this category ofclaims about the physical environment that the current paperis concerned with.
The paper formulates a reliable sensing problem focusingon three related research questions from a networked sensingperspective; namely, (i) how can one model networked humansources (who report observations about the physical world)as participatory sensors, (ii) given this model, how can onefilter out “bad data”, reported by such sources, and (iii) sincethe human sensor model is necessarily a simplified abstraction,how good is the filtering algorithm at distinguishing good datafrom bad when tested on real human observations in the field?We address these questions by suggesting a simple abstractionthat models human participants as sources of unknown reliabil-ity generating binary measurements of uncertain provenance.We show that a rigorous estimation-theoretic problem can beformulated based on the above model to optimize filtering ofcorrect observations in a maximum likelihood sense. We thenempirically demonstrate that, despite its simplicity, our humansensing model is indeed useful at enabling the reconstructionof ground truth from noisy human observations in practice.
For practical validation on real-world examples, we in-tegrated our results into a tool, called Apollo, that triages
real-time Twitter feeds. Apollo computes the probability ofcorrectness of individual tweets based on the aforementionedestimation-theoretic optimization problem formulation, takinguncertain provenance into account. As an example use-case, weused Apollo to collect Twitter feeds about gas availability fromNew York City during and shortly after Hurricane Sandy (inOctober 2012), when gas availability was severely disrupteddue to hurricane damage. Tens of thousands of tweets werecollected by Apollo about (rumored) availability of gas atdifferent locations. Apollo determined the likelihood of cor-rectness of individual tweets, taking into account unknownsource reliability and uncertain provenance as described later inthe paper. The top ranked tweets (by likelihood of correctness)were then manually compared to ground truth, made availableafter the fact from sources such as credit card gas purchasetransaction data. The evaluation shows great correspondencebetween Apollo estimation results and ground truth, suggestingthat over 90% of “top tweets”, believed by Apollo, are actuallytrue, compared to less than 50% of actual true observations inthe original data. We also show a significant improvement overthe state of the art [45], [52]. We report similar results fromother use-cases as well.
The rest of this paper is organized as follows: We firstreview related work in Section II to put the contribution incontext. In Section III, we present a model of humans assensors. Section IV introduces the Apollo tool, and outlinesour problem and solution approach. The proposed maximumlikelihood estimation algorithm is detailed in Section V. Eval-uation results are presented in Section VI. The limitation andfuture work are discussed in Section VII. Finally, we concludethe paper in Section VIII.
II. RELATED WORK
Our paper builds on recent work on assessing correctnessof observations from sources of unknown reliability [45],[47]–[49], [52] and deriving analytic performance boundsfor the resulting maximum likelihood estimator [50], [51].Specifically, we extend the previous work by addressing thechallenge of uncertain provenance as well, which is a maindistinguishing factor between networked physical sensors andnetworked humans. In prior sensing literature on sources ofunknown reliability, uncertain provenance was either ignoredaltogether [47], [48], [52], or addressed via admission controlthat selects only independent sources [45]. We show, in ourevaluation, that such limitations lead to an inferior assessmentof observation correctness in the case of humans as sensors.This is because humans can “gossip” about their observations,creating non-independent errors, which throw off algorithmsthat assume error independence.
The paper should not be confused with work from so-ciology and statistics on opinion polling, opinion sampling,influence analysis and surveys. Opinion polling and samplingare usually carefully designed and engineered by the expertsto create appropriate questionnaires and select representativeparticipants [25], [41]. These are often controlled experiments,and the provenance of the information is also controllable [57].Moreover, data cleaning is domain specific and semanticknowledge is required [15]. In contrast, in the reliable sensingproblem studied in this paper, the data collection is open toall. We assume no control over both the participants (data
sources) and the measurements in their reports. The reliabilityof sources and their data provenance is usually unknown to theapplications. The approach proposed in this paper is designedto be general and not require domain specific knowledge toclean the data.
Influence analysis and surveys are often subjective [6].They tend to survey personal facts, or individual emotions andsentiments [13]. This is as opposed to assessing physical statethat is external to the human (sensor). For example, a surveyquestion may ask “Was the customer service representativeknowledgeable?” or it may ask “Do you support government’sdecision to increase tax?”. Survey participants answer the ques-tions with their own ideas independently, and the responses areoften private [44]. Source dependency is not the main issue inthese studies [2]. In contrast, in this paper, it is not our goal todetermine what individuals feel, think, or support, or to extractwho is influential, popular, or trending. Instead of assessinghumans’ own beliefs, opinions, popularity, or influence, wefocus on applications concerned with the observation andstate estimation of an external environment. That externalstate has a unique ground truth that is independent of humanbeliefs. Humans act merely as sensors of that state. Thereis therefore an objective and unambiguous notion of sensingerror, leading to a clear optimization problem whose goal isto reconstruct ground truth with minimum error from reportedhuman observations.
Remote sensing generally refers to detecting, monitoringand identifying objects on Earth using aerial sensor technol-ogy [26]. Remote sensing applications include environmentmonitoring, natural resource management, national security,and reports of nature disasters [1], [19]. In these applications,specific physical sensors are chosen and large scale data acqui-sition and processing infrastructure is built [46]. In contrast,this paper takes the first step to model humans as sensors.Compared to physical sensors, humans are able to observea much broader spectrum of physical and social events atmuch lower costs (e.g., disaster tracking using online socialmedia). However, humans are not as reliable as well testedinfrastructure sensors and humans can propagate observationsthrough the social network. This paper addressed these uniquechallenges brought by taking humans as sensors to report thestatus of the physical world.
The work extends the ideas of participatory [4], oppor-tunistic [24] and human-centric [20] sensing, where humansplay a key role in the sensing process. These ideas wereinvestigated at length in projects such as MetroSense [5]and Urban Sensing [8]. Examples of some early applicationsinclude CarTel [21], BikeNet [12], and CabSense [37]. Thesuggestion that this people-centric genre of sensing shouldalso cover humans as the sensors themselves (as opposed tobeing sensor carriers and operators) did not come until morerecently [42].
A recent survey of human-centric sensing [42] covers manysensing challenges in human context such as accommodatingenergy constraints of mobile sensing devices [28], protectingthe privacy of participants [3], and promoting social inter-actions in different environments [35]. It also suggests thathumans are the most versatile sensors, listing new challengesthat stem from the fact that observations may propagate among
such “sensors”, leading to correlated noise and bias; a problemwe refer to in this paper as uncertain provenance.
Sakaki et al. modeled twitter users as social sensors toreport earthquake in Japan [36]. Zhao et al. reported theirexperience of using Twitter to monitor the US National Foot-ball League (NFL) games in real-time [56]. Our paper isinspired by these results. We propose a more general modelfor humans as sensors that includes the uncertain provenanceaspect and accounts for the resuling source non-independencein the theoretical problem formulation.
When considering uncertain provenance, we should notethat much work has addressed the challenge of ascertainingthe authenticity of data and source devices. For example, theTrusted Platform Module (TPM), commonly used in com-modity PCs, provides a certain level of assurance that thesource device and software application are who they claimto be [27]. Similarly, YouProve [17] ensures authenticity ofdata (such as images taken by a phone), even after certainmeaning-preserving modifications, such as cropping, have beenperformed. Such solutions, however, do not help with ouruncertain provenance problem when humans are the sensorsbecause authenticating Bob or his email client as the sourceof a reported observation about the physical world does nottell me whether Bob made the observation himself, or heardit from Sally. The real nature of our problem, therefore, isthat information may propagate among sources along socialnetwork routes before it is reported to our “base station”.
Techniques for deriving accurate conclusions from sourceswhose reliability is unknown are traced back to data miningand machine learning literature on fact-finding. One of theearly papers on the topic was Hubs and Authorities [23] thatallows one to iteratively compute both source trustworthinessand claim credibility, hence overcoming the unknown sourcereliability problem. Other instances of this iterative modelinclude TruthFinder [54], and the Investment and Average·Logalgorithms [32]. More general frameworks have been proposedto enhance the above basic model: Pasternack et al. [33]incorporate prior knowledge of the claims into fact-findingto leverage what the user already knows. Gupta et al. [18]accounted for a source’s expertise across different topics.Galland et al. [14] considered the notion of hardness of factsby rewarding sources that correctly assert highly disputedclaims. While such prior work was essentially heuristic innature, an optimal solution to (a simplified version of) theproblem was recently proposed [52], and compared to fourof the best fact-finders in literature in the context of a socialsensing model, demonstrating improved performance. In turn,we outperform this winning approach from [52] by takinguncertain provenance into account in a rigorous maximum-likelihood problem formulation. Our algorithm requires knowl-edge of source dependencies. The source dependency detectionproblem was discussed in past literature and several solutionswere proposed [11], [34].
The uncertain provenance problem addressed in this paperis not new to social networks work, which addressed therelated challenge of rumor detection. Nel et al. [29] propose amethod to detect rumors by using the information publishingbehavior of the sources and clustering sources with similarbehavior. Shah and Zaman [39] propose “rumor centrality”as a maximum likelihood estimator to detect the source of
rumors. Jin et al. [22] applied epidemiological models to studyinformation cascades in twitter resulting from both news andrumors. Castillo et al. [7] develop a method that uses source,content, and propagation patterns to classify rumors from non-rumors. Seo et al. [38] use a number of specialized “monitor-nodes” and the social network to identify possible rumorsand the rumor source. The work on rumor-detection is largelycomplementary to ours. Our contribution lies in incorporatingthe social (and information dissemination) network topologyinto a framework for evaluating the likelihood of correctnessof claims.
Finally, security is an important problem that we defer tofuture work. In this work, we do not cover mitigation measuresagainst potential security attacks such as collusion or sybilattacks, limiting ourselves instead to an empirical evaluationusing actual Twitter traces as a representation of the real world.We believe security is important and should be addressed infuture publications. For example, recently proposed algorithmsfor collusion and sybil attack detection in social networks [40],[55] may be incorporated as additional filters that identifyand drop “bad sources” from consideration before employingtechniques described in this paper on the remaining data.
III. A BINARY MODEL OF HUMAN SENSING
We model humans as sources of (i) unknown reliability, gener-ating (ii) binary observations of (iii) uncertain provenance. Ofthe these three features, the first is perhaps the most intuitive.Unlike physical sensors whose characteristics, calibration, andfailure modes are known, we do not, in general, know thereliability of human observers and hence cannot assume itin our problem formulation. In the following subsections, weexplain the remaining two model features; namely, binaryobservations and uncertain provenance.
A. A Binary Sensor Model
From a sensor modeling perspective, an obvious differencebetween physical sensors and human observations is one offunctional specialization versus breadth. Humans, are muchbroader in what they can observe, albeit less accurate. Table Igives examples of actual observations made on Twitter.
Crash blocking lanes on I-5S @ McBean Pkwy in Santa ClaritaBREAKING NEWS: Shots fired in Watertown; source says
Boston Marathon terror bomb suspect has been pinned downThe police chief of Afghanistan’s southern Kandahar
province has died in a suicide attack on his headquarters.Yonkers mayor has lifted his gas rationing order. Fill it up!
TABLE I. EXAMPLES OF TWITTER OBSERVATIONS
Such observations can be thought of as measurementsof different binary variables. They are binary because theobservation reported can either be true or false. In a sys-tem featuring a collaboration of sensors and humans, it istherefore meaningful to collect from humans these binarystates, whereas collect from sensors exact continuous valuesof related variables of interest. This has been the practice inparticipatory sensing, where participants were asked to makebinary observations, such as “there is garbage here”, whereas sensors, such as GPS, would provide the correspondingcontinuous variable (e.g., location).
With the above in mind, in this paper, we focus on abinary observation model, common to geotagging applications.Generalizing from participatory sensing, each human reportsan arbitrary number of observations, we call claims that canbe individually either true or false. Different individuals havedifferent reliability, expressed as the probability of producingtrue claims. In this model, the physical world is just a col-lection of mention-worthy facts. For example, “Main Streetis flooded”, “The BP gas station on University Ave. is outof gas”, or “Police are shooting people on Market Square”.Human observers report some of the facts they observe (e.g.,on Twitter). The problem of reliable sensing is to infer whichof the reported human observations match ground truth in thephysical world.1
B. Uncertain Provenance
A feature that lends novelty to our sensor model, is the notionof uncertain data provenance. Namely, it is not unusual for aperson to report observations they received from others as ifthey were his/her own. Such rumor spreading behavior has noanalogy in correctly functioning physical sensors. We call thisproblem one of uncertain data provenance because when Bobtweets that “Main Street is flooded”, even if we authenticateBob as the actual source of the tweet, we do not know if Bobtruely observed that first-hand or heard it from Sally. From asensing perspective, this means that errors in “measurements”across “sensors” may be non-independent, as one erroneousobservation may be propagated by other sources without beingverified.
C. A Word on Simplicity
To conclude our introduction of the model, it is worth notingthat the exercise this paper undertakes is to evaluate theefficacy of the simplest viable abstraction of humans as sensorsfirst. The reader will legitimately find several key ways oursimplified model can be extended. One can think of thispaper as offering a performance baseline against which suchfuture potential enhancements can be benchmarked. Clearly,the performance of the baseline sheds light on the utility ofsuch enhancements. To emphasize its simplicity, we call ourbaseline model the binary model of human sensing and showin our evaluation that the resulting ground truth reconstructionalgorithm does very well.
IV. A SOLUTION ARCHITECTURE
To enable reconstruction of ground truth information fromdata reported by human sources, we need to (i) collect datafrom the “sensor network”, (ii) structure the data for analysis,(iii) understand how sources are related, and (iv) use thiscollective information to estimate the probability of correctnessof individual observations. These steps are described in thefollowing subsections, respectively. We focus on Twitter asthe underlying “sensor network”.
1One should mention that the reliable sensing problem, in the case of binaryvariables, is in fact harder than its counterpart in the case of continuousmeasurements. When sensors report 10-bit numbers on a scale from 0 to 1023,all bits are related as part of the same number. One can thus exploit propertiesof numbers such as ordering to eliminate outliers, average the results, orcompute medians. If the 10 bits, however, are independent binary variables,they are not related and there is less that one can exploit to remove noise andbad data.
A. Data Collection
We perform data collection using Apollo. In principle, Apollocan collect data from any participatory sensing front end, suchas a smart phone application. In this paper, we report oncollecting data from Twitter. Tweets are collected through along-standing query via the exported Twitter API to matchgiven query terms (keywords) and an indicated geographicregion on a map. These can either be anded or ored. In essence,Apollo acts as the “base station” for a participatory sensingnetwork, where the query defines the scope of informationcollected from paricipants.
B. Computing the Source-claim Graph
Next, we need to determine the internal consistency in reportedobservations. For this reason, observations are clustered basedon a distance function. This function, distance (t1, t2),takes two reported observations, t1 and t2, as input and returnsa measure of similarity between them, represented by a logicaldistance. The more dissimilar the observations, the larger thedistance. In the case of data collection from Twitter, weregard individual tweets as individual observations, and borrowfrom natural language processing literature a simple cosinesimilarity function [43] that returns a measure of similaritybased on the number of matching tokens in the two inputs. Thedistance function nicely separates natural language processingconcerns from sensing concerns, and is not the contribution ofthis paper.
As distances are computed, the set of input observationsis transformed to a graph where vertices are individual obser-vations and links represent similarity among them. We thencluster the graph, causing similar observations to be clusteredtogether. We call each such cluster a claim. Hence, the claimrepresents a piece of information that several sources reported.We can now construct a source-claim graph, SC, in whicheach source, Si, is connected to all claims they made (i.e.,clusters they contributed to), and each claim, Cj , is connectedto all sources who espoused it (i.e., all sources of tweets inthe corresponding cluster). We say that SiCj = 1 if sourceSi makes claim Cj . Each claim can either be true or false.The claim is true if it is consistent with ground truth in thephysical world. Otherwise, it is false. The source-claim graphconstitutes an input to our analysis algorithm.
C. Adding the Social Dissemination Graph
Next, we need to account for uncertain provenance. Sourcesmay have reported either their own observations or obser-vations they heard from others. We assume the existenceof a latent social information dissemination graph, SD, thatestimates how information might propagate from one person toanother. A recent Sigmetrics paper [30] describes an algorithmto infer the latent contagion network underlying epidemiccascades, given the time when each node got infected. For ourexperiments, we construct the epidemic cascade (EC) socialgraph using the iterative greedy strategy described in theirpaper, where each distinct observation is modeled as a cascadeand the time of contagion of a source describes when thesource mentioned this observation. We call the resulting graph,the EC network. Specific to Twitter, we also try three otherways to estimate potential information dissemination among
sources. The first is to construct this graph based on thefollower-followee relationship. A directed link (Si, Sk) existsin the social graph from source Si to source Sk if Sk is afollower of Si. We call this graph the FF network. The secondoption is to construct the social network from the retweetingbehavior of twitter users. In this case, a directed link (Si, Sk)exists in the social graph if source Sk retweets some tweetsfrom source Si. We call this graph the RT network. The thirdoption combines the above two, forming a network where adirected link (Si, Sk) exists when either Sk follows Si or Skretweets what Si said. We call the third type of social networkthe RT+FF network.
D. Solving the Estimation Problem
With inputs computed, the next stage is to perform theanalysis that estimates correctness of claims. For each claim,Cj , Apollo determines if it is true or false. Apollo uses asliding window approach for analyzing received tweets. Letthe total number of claims computed from tweets receivedin the last window be N . A trivial solution would be tocount the number of sources, Si, that made each claim. Inother words, for each Cj , where 1 ≤ j ≤ N , count allSi, where SiCj = 1. The idea being that claims with moresupport are more believable. This solution is called voting, inan analogy with counting the number of votes. Unfortunately,it is suboptimal for two reasons. First, different sources havedifferent degrees of reliability. Hence, their “votes” do not havethe same weight. Second, sources may not be independent.When a source simply repeats what they heard from others,their “vote” does not add to the credibility of the claim.
Since the only information we have (other than the reportedobservations themselves) is the source claim graph, SC, andthe social dissemination graph, SD, computed from the twosteps above, the question becomes: Given graphs SC andSD what is the likelihood that claim Cj is true, for each j?Formally, we compute:
∀j, 1 ≤ j ≤ N : P (Cj = 1|SC, SD) (1)
where P (Cj = 1|SC, SD) is the conditional probability thatCj is true given SC and SD. With the aforementioned proba-bility computed, Apollo forwards to the user those tweets thatmeet a specified (user configurable) probability of correctness.This feed is the solution to the reliable sensing problem.
V. EXPECTATION MAXIMIZATION
It remains to show how to cast the problem of computing theprobability of correctness of claims as a maximum likelihoodestimation problem when sources have unknown reliability anddata has uncertain provenance. Let m be the total number ofsources in our system from which we have data. Let us describeeach source (i.e., “sensor”), Si, 1 ≤ i ≤ m, by two parameters;the odds of true positives, ai = P (SiCj = 1|Cj = 1) and theodds of false positives, bi = P (SiCj = 1|Cj = 0), neitherof which are known in advance. Let us also denote by d theunknown expected ratio of correct claims in the system, d =P (Cj = 1). Let us now define the vector θ to be the vectorof the above unknowns:
θ = [a1...amb1...bmd] (2)
A maximum likelihood estimator finds the values of theunknowns that maximize the probability of observations, SC,given the social network SD. Hence, we would like to find θthat maximizes P (SC|SD, θ). The probability P (SC|SD, θ)depends on which claims are true and which are false. Let ustherefore introduce the vector Z where element zj = 1 if Cjis true and zero otherwise. Using the total probability theorem,we can now rewrite the expression we want to maximize,namely P (SC|SD, θ), as follows:
P (SC|SD, θ) =∑z
P (SC, z|SD, θ) (3)
We solve this problem using the expectation maximization(EM) algorithm [9], [10]. We note that authors in [9] used theEM algorithm in a crowdsourcing application to estimate theerror rate of data sources. They assume the sources indepen-dently report their data and the data provenance is known tothe application. However, such assumptions no longer hold inour applications where social networks are modeled as sensornetworks and the information propagation between sourcesis common. In this paper, we explicitly model the sourcedependency and uncertain data provenance in our maximumlikelihood estimator and present an enhanced EM algorithmin this section to address these challenges. The proposedEM scheme starts with some initial guess for θ, say θ0 anditeratively updates it using the formula:
θn+1 = argmaxθ{Ez|SC,θn{ln P (SC, z|SD, θ)}} (4)
The above breaks down into three quantities that need to bederived:
• The log likelihood function, ln P (SC, z|SD, θ)
• The expectation step, Qθ =Ez|SC,θn{ln P (SC, z|SD, θ)}
• The maximization step, θn+1 = argmaxθ{Qθ}
Note that, the latter two steps are computed iteratively until thealgorithm converges. The above functions are derived below.
A. Deriving the Likelihood
The key contribution of this paper lies in incorporating therole of uncertain provenance into the maximum likelihoodestimation algorithm. To compute the log likelihood, we firstcompute the function P (SC, z|SD, θ). Let us divide the sourceclaim graph SC into subsets, SCj , one per claim Cj . Thesubset describes which sources espoused the claim and whichdid not. Since claims are independent, we can re-write:
P (SC, z|SD, θ) =N∏j=1
P (SCj , zj |SD, θ) (5)
which can in turn be re-written as:

P (SC, z|θ) =N∏j=1
P (SCj |SD, θ, zj)P (zj) (6)
where P (SCj |SD, θ, zj) is the joint probability of all observa-tions involving claim Cj . Unfortunately, in general, the sourcesthat make these observations may not be independent sincethey may be connected in the social network leading to apossibility that one repeated the observation of another. Letpik = P (SiCj |SkCj) be the probability that source Si makesclaim Cj given that his parent Sk (in the social disseminationnetwork) makes that claim. We call pik a repeat ratio and canapproximately compute it from graph SC, for pairs of nodesconnected in graph SD, as follows:
pik =number of times Si and Sk make same claim
number of claims Sk makes(7)
Hence, the joint probability that a parent Sp and itschildren Si make the same claim is given by P (SpCj)∏i P (SiCj |SpCj) which is P (SpCj)
∏i pip. This probability
accounts for the odds of one source repeating claims byanother. For illustration, let us now consider the special case ofsocial network topology SD, where the network is given by aforest of two-level trees 2. Hence, when considering claim Cj ,sources can be divided into a set Mj of independent subgraphs,where a link exists in subgraph g ∈Mj between a parent andchild only if they are connected in the social network andthe parent claimed Cj . The link implies source dependencyas far as the claim in question is concerned. The intuition isthat if the parent does not make the claim, then the childrenact as if they are independent sources. If the parent makes theclaim, then each child repeats it with a given repeat probability.The assumed repeat probability determines the degree to whichthe algorithm accounts for redundant claims from dependentsources. The higher it is, the less credence is given to thedependent source. Two scenarios are illustrated by the twosimple examples in Figure 1, showing the situation wheresource S1, who has children S2, S3, and S4, makes claim C1
and when it does not make it, respectively. Note the differencesin the computed probabilities of its children making claim C1.In general, let Sg denote the parent of subgraph g and cgdenote the set of its children, if any. Equation 6 can then berewritten as follows:
P (SC, z|SD, θ) =N∏j=1
P (zj)×
{∏g∈Mj
P (SgCj |θ, zj)∏i∈cg
P (SiCj |SgCj)} (8)
where
2The derivation can be easily extended to the network of multi-level treeand DAG
P (zj) =
{d zj = 1
(1− d) zj = 0
P (SgCj |θ, zj) =
ag zj = 1, SgCj = 1
(1− ag) zj = 1, SgCj = 0
bg zj = 0, SgCj = 1
(1− bg) zj = 0, SgCj = 0
P (SiCj |SgCj) ={pig SgCj = 1, SiCj = 1
1− pig SgCj = 1, SiCj = 0(9)
Fig. 1. Simple Illustrative Examples for Proof
B. Deriving the E-step and M-step
Given the above formulation, substitute the likelihood func-tion defined in Equation (8) into the definition of Q functionof Expectation Maximization. The Expectation step (E-step)becomes:
Q(θ|θ(n)
)=
N∑j=1
{Z(n, j)×
[{ ∑g∈Mj
(logP (SgCj |θ, zj)
+∑i∈cg
logP (SiCj |SgCj))}
+ log d]
+ (1− Z(n, j))×[{ ∑
g∈Mj
(logP (SgCj |θ, zj)
+∑i∈cg
logP (SiCj |SgCj))}
+ log(1− d)]}
(10)
where Z(n, j) is the conditional probability of claim Cj tobe true given the observed source claim subgraph SCj andcurrent estimation on θ. It is given by:
Z(n, j) = p(zj = 1|SCj , θ(n)) =p(zj = 1;SCj , θ
(n))
p(SCj , θ(n))
=p(SCj , θ
(n)|zj = 1)p(zj = 1)
p(SCj , θ(n)|zj = 1)p(zj = 1) + p(SCj , θ(n)|zj = 0)p(zj = 0)
where
p(SCj , θ(n)|zj = 1 or 0)
=∏g∈Mj
P (SgCj |θ(n), zj)∏i∈cg
P (SiCj |SgCj) (11)
where P (SgCj |θ(n), zj), P (SiCj |SgCj) and P (zj) are de-fined in Equation 9.
We choose θ∗ (i.e., a∗1, ..., a∗m, b
∗1, ..., b
∗m, d
∗) that maxi-mizes the Q
(θ|θ(n)
)function in each iteration to be the θ(n+1)
of the next iteration. To get θ∗ that maximizes Q(θ|θ(n)
), we
set the derivatives ∂Q∂ag
= 0, ∂Q∂ai
= 0, ∂Q∂bg
= 0, ∂Q∂bi
= 0,∂Q∂d = 0 which yields:
a(n+1)g = a∗g =
∑j∈SJg Z(n, j)∑Nj=1 Z(n, j)
a(n+1)i = a∗i =
∑j∈SJg∩SJi Z(n, j)∑j∈SJg
Z(n, j)for i ∈ cg
b(n+1)g = b∗g =
∑j∈SJg (1− Z(n, j))∑Nj=1(1− Z(n, j))
b(n+1)i = b∗i =
∑j∈SJg∩SJi(1−Z(n,j))∑j∈SJg
(1− Z(n, j))for i ∈ cg
d(n+1) = d∗ =
∑Nj=1 Z(n, j)
N(12)
where N is the total number of claims in the source claimgraph SC. Z(n, j) is defined in Equation (11). SJg denotesthe set of claims the group parent Sg makes in SC, and SJgdenotes the set of claims Sg does not make. Similar definitionsapply to the children sources in the group (i.e., SJi and SJ i).One should note that the computation of repeat ratios (i.e.,pig ) falls out of the estimation step in the EM algorithm andthe result is not dependent on previous values of θ during theiteration.
Given the above, The E-step and M-step of EM optimiza-tion reduce to simply calculating Equation (11) and Equa-tion (12) iteratively until they converge. The convergence anal-ysis has been done for EM scheme and it is beyond the scopeof this paper [53]. In practice, we can run the algorithm untilthe difference of estimation parameter between consecutiveiterations becomes insignificant. Since the claim is binary, wecan classify the correctness of claims based on the convergedvalue of Z(n, j). Specially, Cj is true if Z(n, j) ≥ 0.5 andfalse otherwise. This completes the mathematical development.We summarize the resulting algorithm in the subsection below.
Algorithm 1 Expectation Maximization Algorithm1: Initialize θ with random values between 0 and 12: Estimate the dependent ratio (i.e., pig) from source dis-
semination graph SD based on Equation (7)3: while θ(n) does not converge do4: for j = 1 : N do5: compute Z(n, j) based on Equation (11)6: end for7: θ(n+1) = θ(n)
8: for i = 1 :M do9: compute a
(n+1)1 , ..., a
(n+1)m , b
(n+1)1 , ..., b
(n+1)m , d(n+1)
based on Equation (12)10: update a
(n)1 , ..., a
(n)m , b
(n)1 , ..., b
(n)m , d(n) with
a(n+1)1 , ..., a
(n+1)m , b
(n+1)1 , ..., b
(n+1)m , d(n+1) in
θ(n+1)
11: end for12: n = n+ 113: end while14: Let Zcj = converged value of Z(n, j)15: Let aci = converged value of ani ; bci =
converged value of bni ; dc = converged value of d(n)16: for j = 1 : N do17: if Zcj ≥ 0.5 then18: C∗j is true19: else20: C∗j is false21: end if22: end for23: Return the claim classification results.
C. The Final Algorithm
In summary of the EM scheme derived above, the inputis the source claim graph SC from social sensing data andthe source dissemination graph SD estimated from socialnetwork, and the output is the maximum likelihood estimationof source reliability and claim correctness. In particular, giventhe source claim graph SC, our algorithm begins by initializingthe parameter θ with random values between 0 and 13. Wealso estimate the dependent ratio of each non-independentsource (i.e., pig) from the source disseminate graph SD. Thealgorithm then iterates between the E-step and M-step until θconverges. Specifically, we compute the conditional probabilityof a claim to be true (i.e., Z(n, j)) from Equation (11) andthe estimation parameter (i.e., θ(n+1) ) from Equation (12).Finally, we can decide whether each claim Cj is true ornot based on the converged value of Z(n, j) (i.e., Zcj ). Thepseudocode is shown in Algorithm 1.
VI. EVALUATION
In this section, we evaluate Apollo using three real worldcase studies based on Twitter. Evaluation results show theviability of predominantly correct ground truth reconstructionfrom social sensing data. In our evaluation, we comparethe new maximum likelihood estimation algorithm, Apollo-social, to three baselines from current literature. The firstbaseline is voting, where data credibility is estimated by the
3In practice, if the a rough estimate of the average reliability of sources isknown a priori, EM will converge faster
number of times the same tweet is collected from the humannetwork. The larger the repetition, the more credibility isattributed to the content. Considering possible retweets onTwittter, we have two versions of the voting scheme: one thatcounts both retweets and original tweets as full votes (calledregular Voting) and one that only counts the original tweets(called Voting-NoRT). The second baseline is the EM-baseddata cleaning algorithm proposed for participatory sensingapplications in IPSN 2012 [52]. We henceforth call it regularEM. The algorithm differs from ours in that it assumes thatall sources constitute independent observers, and was shownto outperform four current information ranking schemes. Thelast baseline is the social data cleaning scheme suggestedin [45], which extends regular EM with admission control.The admission controller is designed to improve source inde-pendence by simply removing dependent sources using someheuristic approaches from social networks. We use the winningadmission control scheme in [45], called Beta-1.
To compare these algorithms, we implemented them insideApollo. Apollo was used to capture tweets from many eventsof interest such as hurricanes, riots, civil unrest, and othernatural and man-made disasters. In particular, Apollo hasa data collection component that allows users to specify afew key words and a geo-graphic location to collect tweetsthat contain the specified key words and originate from thespecified location. The collected tweets were logged. For thepurposes of evaluation, in this paper, we select three suchtraces of different sizes. The first was collected by Apolloduring and shortly after hurricane Sandy, from around NewYork and New Jersey in October/November 2012. The secondwas collected during hurricane Irene, one of the most expensivehurricanes that hit the Northeastern United States in August2011. The third one was collected from Cairo, Egypt duringthe violent events that led to the resignation of the formerpresident in February 2011. In these traces, many claims weregenerated to describe the events that happened in the physicalworld, which have unique ground truth. For the granularity ofthe events, we first divided the data trace into different timeintervals (e.g., a day) and then applied the tweet clusteringfunction described in Section IV in each interval to clustertweets that describe the same event together. These traces aresummarized in Table II.
Trace Sandy Irene Egypt UnrestStart Date 11/2/2012 8/26/2011 2/2/2011Time duration 14 days 7 days 18 days# of tweets 12,931 269,308 93,208# of users twitted 7,583 207,562 13,836# of follower-followee links
37,597 3,902,713 10,490,098
# of users crawled 704,941 2,510,316 5,285,160TABLE II. STATISTICS OF THREE TRACES
The Apollo tool was fed each data trace above, whileexecuting each one of the compared filtering algorithms. Theoutput of filtering was manually graded in each case to deter-mine match with ground truth. Due to man-power limitations,we manually graded only the 150 top ranked claims by eachalgorithm using the following rubric:
• True claims: Claims that describe a physical or socialevent that is generally observable by multiple indepen-
dent observers and corroborated by sources external tothe experiment (e.g., mainstream news media).
• Unconfirmed claims: Claims that do not meet thedefinition of true claims.
Note that, the unconfirmed claims contain the false claimsand some possibly true claims that cannot be independentlyverified by external sources. Hence, our evaluation presentsa pessimistic performance estimates, taking all unconfirmedclaims as false. We also note that there could be possible cyclicdependency between news media and twitter as many newssites start to use twitter as an important data source. However,we found the claims that were officially reported by severalmainstream media are those events that actually happened inthe real world.
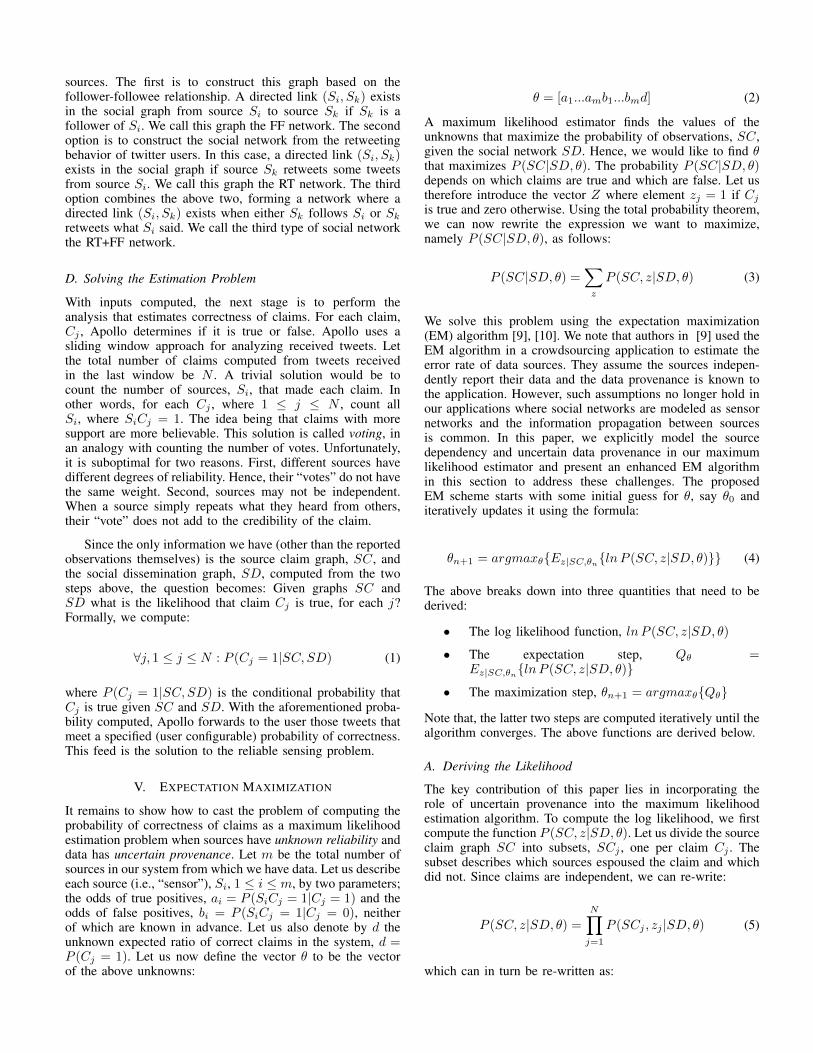
Fig. 2. Evaluation on Hurricane Sandy Trace
Figure 2 shows the result for the hurricane Sandy trace. Weobserve that Apollo-social generally outperformed the regularEM schemes in providing more true claims and suppressingthe unconfirmed claims. This is achieved by incorporating thesource dependency into the analytical framework of expecta-tion maximization to better handle non-independent sourcesand their claims. The performance advantage of Apollo-socialcompared to regular EM is significant (nearly 20%) if we usethe combined social network information (i.e, RT+FF socialnetwork) constructed from follower-followee and retweet rela-tionship between users. We observed that the performance ofthe Apollo-social using Epidemic Cascades (EC) to estimatethe social network is between Apollo-social using RT andFF social network. The reason is the RT social network isgenerated from the retweet relationship from current data in-terval and is very dynamic to reflect current source dependencyand while FF social network is generated from the follower-followee relationship independently from the data traces andis relatively static. The dynamics of source dependency of ECsocial network is between RT and FF social network.
We also observe the regular EM schemes with admissioncontrol perform slightly worse than the one without admissioncontrol. The reason is: since the social network in the Sandytrace is relatively dense, the admission controller droppingsome sources reduces the amount of useful information. Incontrast, the Apollo-social scheme is shown to handle thesocial links in a more approriate way. We also note the votingscheme has a reasonable performance on this trace. The reason
# Media Tweet found by Apollo-social Tweet found by Regular EM1 Rockland County Executive C. Scott
Vanderhoef is announcing a Lo-cal Emergency Order restricting theamount of fuel that an individual canpurchase at a gas station.
Rockland County Orders Restrictionson Gas Sales - Nyack-Piermont, NYPatch http://t.co/cDSrqpa2
MISSING
2 New York City Mayor MichaelBloomberg has announced that thecity will impose an indefinite programof gas rationing after fuel shortagesled to long lines and frustration atthe pump in the wake of superstormSandy.
Gas rationing plan set for New YorkCity: The move follows a similar an-nouncement last week in New Jerseyto eas... http://t.co/nkmF7U9I
RT @nytimes: Breaking News: MayorBloomberg Imposes Odd-Even GasRationing Starting Friday, as DoesLong Island http://t.co/eax7KMVi
3 New Jersey authorities filed civil suitsFriday accusing seven gas stations andone hotel of price gouging in the wakeof Hurricane Sandy.
RT @MarketJane: NJ plans price goug-ing suits against 8 businesses. Theyinclude gas stations and a lodgingprovider.
MISSING
4 The rationing system: restricting gassales to cars with even-numbered li-cense plates on even days, and odd-numbered on odd days will be discon-tinued at 6 a.m. Tuesday, Gov. ChrisChristie announced on Monday.
# masdirin City Room: Gas Rationingin New Jersey to End Tuesday # news
RT @nytimes: City Room: Gas Ra-tioning in New Jersey to End Tuesdayhttp://t.co/pYIVOmPo
5 New Yorkers can expect gas rationingfor at least five more days: Bloomberg.
Mayor Bloomberg: Gas rationing inNYC will continue for at least 5 moredays. @eyewitnessnyc #SandyABC7
Bloomberg: Gas Rationing To Stay InPlace At Least Through The Weekendhttp://t.co/mmqqjYRx
TABLE III. GROUND TRUTH EVENTS AND RELATED CLAIMS FOUND BY APOLLO-SOCIAL VS REGULAR EM IN SANDY
is: we used a set of concrete key words (e.g., gas, station,fuel, etc.) for data collection, which results in a relatively“clean” input with less irrelevant information. As we shall see,the performance of voting drops siginificantly when the inputtweet trace has more noise (e.g., Egypt trace as we will discusslater).
The above results show the precision of the top claims.Another relevant metric is recall. Unfortunately, this metricis hard to define because we have no objective way toexhaustively enumerate all relevant physical events in orderto determine what exact fraction of them was reported.
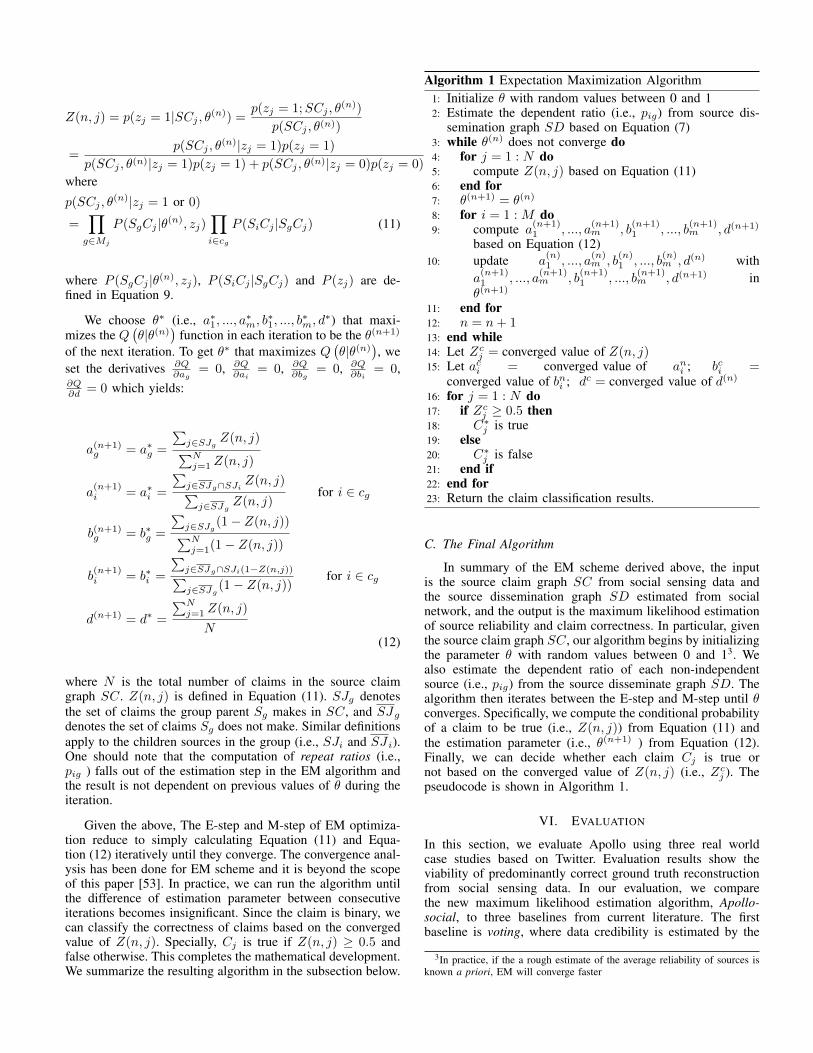
Note that, the exact recall may be of less interest, since weare usually interested in only the milestones and key momentsof an event as opposed to every possible detail. Therefore,we carried out experiments to evaluate an approximate recallmetric. Specifically, we independently collected 5 importantevents reported by media during Sandy to see if they arecaptured in our top claims. We then scanned through the topranked claims for each of the algorithms compared to find theseevents. Results for selected baselines are shown in Table III.We observed that all five events were covered by the topclaims from the Apollo-social scheme, while two of them weremissing from the top claims returned from the regular EMscheme.
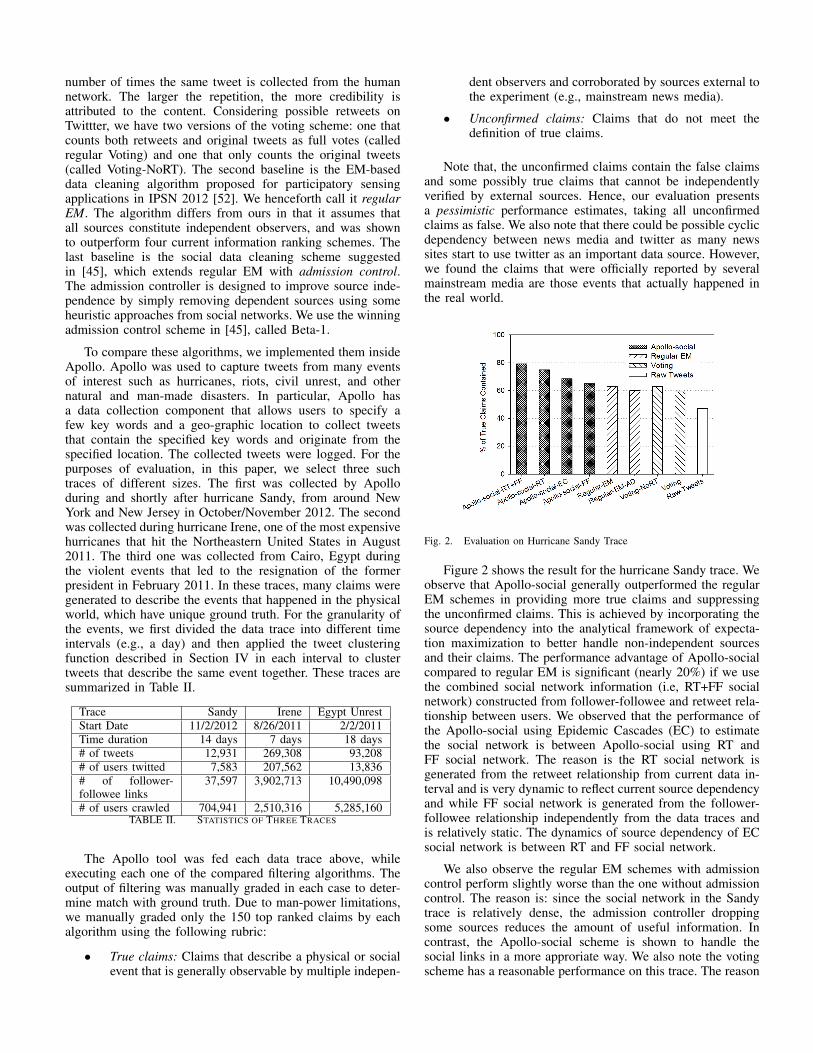
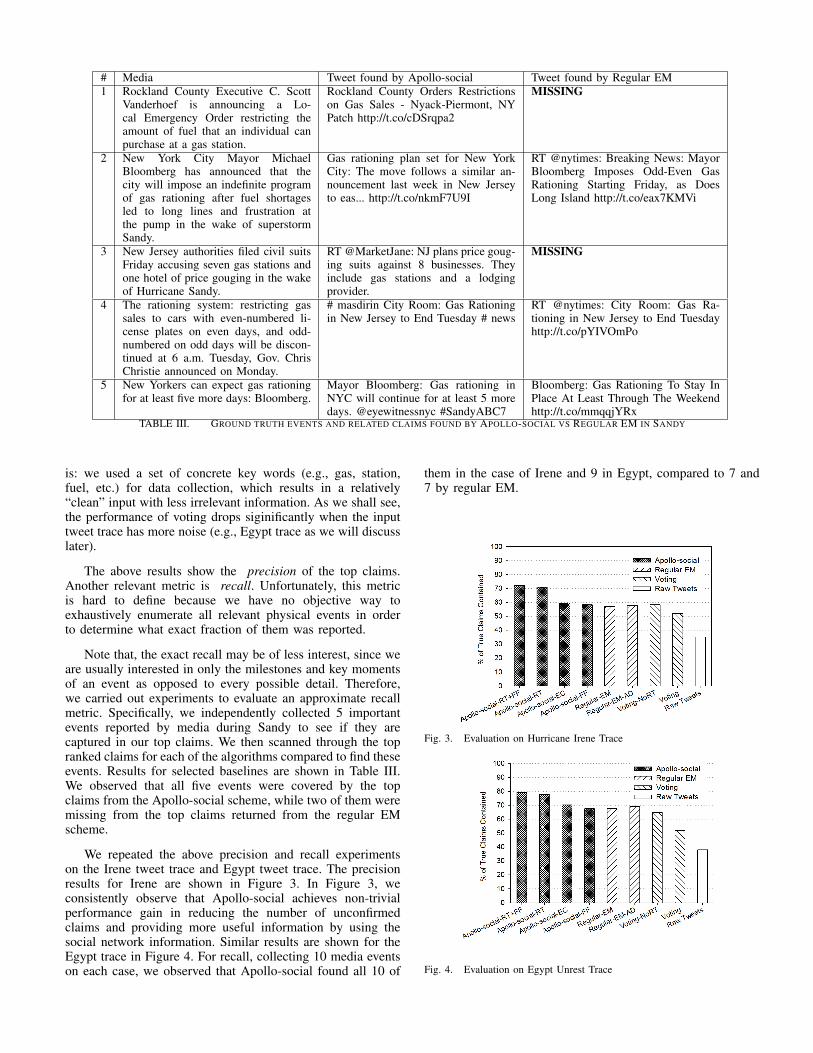
We repeated the above precision and recall experimentson the Irene tweet trace and Egypt tweet trace. The precisionresults for Irene are shown in Figure 3. In Figure 3, weconsistently observe that Apollo-social achieves non-trivialperformance gain in reducing the number of unconfirmedclaims and providing more useful information by using thesocial network information. Similar results are shown for theEgypt trace in Figure 4. For recall, collecting 10 media eventson each case, we observed that Apollo-social found all 10 of
them in the case of Irene and 9 in Egypt, compared to 7 and7 by regular EM.
Fig. 3. Evaluation on Hurricane Irene Trace
Fig. 4. Evaluation on Egypt Unrest Trace
Note that, in the experiments above, we do not report thenumber of claims that were verified to be false (i.e., falsepositives). This is because it is easier to verify that an eventoccurred than it is to verify that it did not. Prominent eventsthat are true would typically be reported in the media. Obscureevents would not be. It is therefore hard to verify if they reallyhappened or not.
There was one exception to the above. Namely, in theSandy example, we were able to collect ground truth on gasavailability at a subset of New York and New Jersey gasstations at different points in time. This data was mainlyobtained from two sources: (i) GasBuddy.com, which recruitedspotters to go out and report the status of gas stations in NewYork and New Jersey during the gas shortage event in theaftermath of hurricane Sandy [16], and (ii) NYC GAS Finder,which generated updates on NYC gas stations serving gasbased on credit card transaction data [31].
In order to match claims with the ground truth, we selectedfrom the top claims those that (i) unambiguously mention fuelstatus, and (ii) explicitly describe a gas station location thatmatches one of the gas stations for which we have groundtruth on the day of the claim. We considered the claim true ifit matched ground truth status. Otherwise it was false. Thirty(30) of the top ranked Apollo claims could be verified thisway. Of these, 29 were true matches, which is 97%. Hence,we have reason to believe that the number of unverified claimsin other data sets actually contains a lot of true claims.
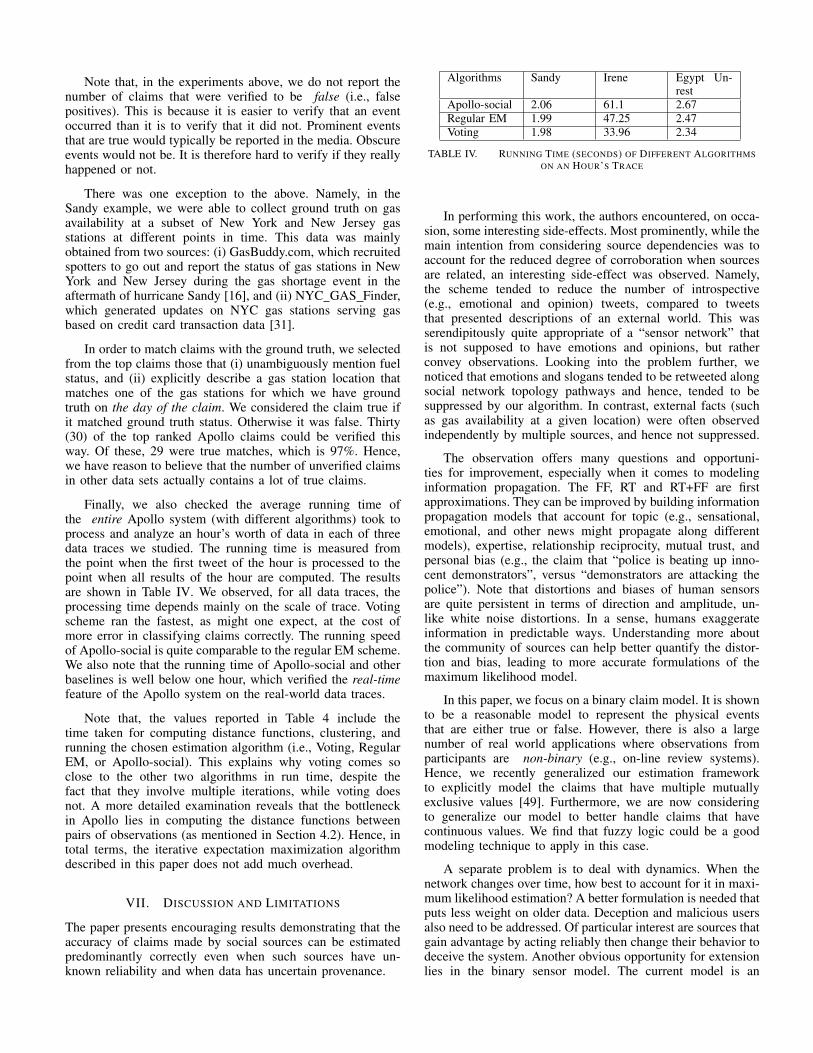
Finally, we also checked the average running time ofthe entire Apollo system (with different algorithms) took toprocess and analyze an hour’s worth of data in each of threedata traces we studied. The running time is measured fromthe point when the first tweet of the hour is processed to thepoint when all results of the hour are computed. The resultsare shown in Table IV. We observed, for all data traces, theprocessing time depends mainly on the scale of trace. Votingscheme ran the fastest, as might one expect, at the cost ofmore error in classifying claims correctly. The running speedof Apollo-social is quite comparable to the regular EM scheme.We also note that the running time of Apollo-social and otherbaselines is well below one hour, which verified the real-timefeature of the Apollo system on the real-world data traces.
Note that, the values reported in Table 4 include thetime taken for computing distance functions, clustering, andrunning the chosen estimation algorithm (i.e., Voting, RegularEM, or Apollo-social). This explains why voting comes soclose to the other two algorithms in run time, despite thefact that they involve multiple iterations, while voting doesnot. A more detailed examination reveals that the bottleneckin Apollo lies in computing the distance functions betweenpairs of observations (as mentioned in Section 4.2). Hence, intotal terms, the iterative expectation maximization algorithmdescribed in this paper does not add much overhead.
VII. DISCUSSION AND LIMITATIONS
The paper presents encouraging results demonstrating that theaccuracy of claims made by social sources can be estimatedpredominantly correctly even when such sources have un-known reliability and when data has uncertain provenance.
Algorithms Sandy Irene Egypt Un-rest
Apollo-social 2.06 61.1 2.67Regular EM 1.99 47.25 2.47Voting 1.98 33.96 2.34
TABLE IV. RUNNING TIME (SECONDS) OF DIFFERENT ALGORITHMSON AN HOUR’S TRACE
In performing this work, the authors encountered, on occa-sion, some interesting side-effects. Most prominently, while themain intention from considering source dependencies was toaccount for the reduced degree of corroboration when sourcesare related, an interesting side-effect was observed. Namely,the scheme tended to reduce the number of introspective(e.g., emotional and opinion) tweets, compared to tweetsthat presented descriptions of an external world. This wasserendipitously quite appropriate of a “sensor network” thatis not supposed to have emotions and opinions, but ratherconvey observations. Looking into the problem further, wenoticed that emotions and slogans tended to be retweeted alongsocial network topology pathways and hence, tended to besuppressed by our algorithm. In contrast, external facts (suchas gas availability at a given location) were often observedindependently by multiple sources, and hence not suppressed.
The observation offers many questions and opportuni-ties for improvement, especially when it comes to modelinginformation propagation. The FF, RT and RT+FF are firstapproximations. They can be improved by building informationpropagation models that account for topic (e.g., sensational,emotional, and other news might propagate along differentmodels), expertise, relationship reciprocity, mutual trust, andpersonal bias (e.g., the claim that “police is beating up inno-cent demonstrators”, versus “demonstrators are attacking thepolice”). Note that distortions and biases of human sensorsare quite persistent in terms of direction and amplitude, un-like white noise distortions. In a sense, humans exaggerateinformation in predictable ways. Understanding more aboutthe community of sources can help better quantify the distor-tion and bias, leading to more accurate formulations of themaximum likelihood model.
In this paper, we focus on a binary claim model. It is shownto be a reasonable model to represent the physical eventsthat are either true or false. However, there is also a largenumber of real world applications where observations fromparticipants are non-binary (e.g., on-line review systems).Hence, we recently generalized our estimation frameworkto explicitly model the claims that have multiple mutuallyexclusive values [49]. Furthermore, we are now consideringto generalize our model to better handle claims that havecontinuous values. We find that fuzzy logic could be a goodmodeling technique to apply in this case.
A separate problem is to deal with dynamics. When thenetwork changes over time, how best to account for it in maxi-mum likelihood estimation? A better formulation is needed thatputs less weight on older data. Deception and malicious usersalso need to be addressed. Of particular interest are sources thatgain advantage by acting reliably then change their behavior todeceive the system. Another obvious opportunity for extensionlies in the binary sensor model. The current model is an
approximation. Having understood the performance of thismodel, is there a better sweet spot in trading accuracy forsimplicity?
It is interesting to understand the impact of distancefunctions inside Apollo on the accuracy of estimation results.Distance function assess how close two tweets are. Currentfunctions are based on syntax only (i.e., they compare wordswithout interpreting them). How much benefit is attained bysemantic analysis of different levels of sophistication? Howdoes that benefit depend on the properties of the trace? Theseissues will be addressed in future work.
Finally, we should note that the human sensor model andthe estimation framework developed in this paper is not limitedto the applications that are based on Twitter. It can be alsoapplied to a much broader set of crowdsourcing and mobilesensing applications, where the data are collected from bothhuman sources and the devices on their behalf. Examplesinclude traffic condition prediction using data from in-vehicleGPS devices and geo-tagging applications using participant’ssmart-phones. In these applications, humans or their devicesrepresent the sources and measurements they report representclaims. The proposed estimation approach can be used toaddress similar data reliability and uncertain data provenancechallenges in these applications.
VIII. CONCLUSION
This paper presented an exercise in modeling social net-works as sensor networks. A minimalist model was presentedand its performance was evaluated. In this model, humansources represent sensors. The observations they make repre-sent (data) claims. The sensing problem is to determine whichclaims are correct; which is to say, separate data from noise.This is similar to fusion problems in sensor networks, exceptfor two challenges stemming from the nature of the humanobserver: first, the reliability of our human sensors is gener-ally unknown a priori. Second, the provenance of reportedobservations is uncertain. The paper presented a maximum-likelihood solution to the sensing problem that is novel inaddressing both of the above two challenges simultaneously.The solution was implemented in the Apollo tool and testedusing data from Twitter. Test results show that the model offerssufficient accuracy in properly ascertaining the correctness ofclaims from human sources.
ACKNOWLEDGEMENTS
Research reported in this paper was sponsored by theArmy Research Laboratory, DTRA grant HDTRA1-10-1-0120, and NSF grants CNS 10-40380 and CNS 13-29886,and was accomplished under Cooperative Agreement NumberW911NF09-2-0053. The views and conclusions contained inthis document are those of the authors and should not be inter-preted as representing the official policies, either expressed orimplied, of the Army Research Laboratory or the U.S. Gov-ernment. The U.S. Government is authorized to reproduce anddistribute reprints for Government purposes notwithstandingany copyright notation here on.
REFERENCES
[1] E. C. Barrett. Introduction to environmental remote sensing. Routledge,2013.
[2] J. Blair, R. F. Czaja, and E. A. Blair. Designing surveys: A guide todecisions and procedures. SAGE Publications, Incorporated, 2013.
[3] I. Boutsis and V. Kalogeraki. Privacy preservation for participatorysensing data. In IEEE International Conference on Pervasive Computingand Communications (PerCom), volume 18, page 22, 2013.
[4] J. Burke et al. Participatory sensing. In Workshop on World-Sensor-Web (WSW): Mobile Device Centric Sensor Networks and Applications,pages 117–134, 2006.
[5] A. T. Campbell, S. B. Eisenman, N. D. Lane, E. Miluzzo, and R. A.Peterson. People-centric urban sensing. In Proceedings of the 2ndannual international workshop on Wireless internet, WICON ’06, NewYork, NY, USA, 2006. ACM.
[6] A. E. Cano, S. Mazumdar, and F. Ciravegna. Social influence analysisin microblogging platforms–a topic-sensitive based approach. SemanticWeb, 2011.
[7] C. Castillo, M. Mendoza, and B. Poblete. Information credibility ontwitter. In Proc. WWW, pages 675–684, NY, USA, 2011.
[8] D. Cuff, M. Hansen, and J. Kang. Urban sensing: out of the woods.Commun. ACM, 51(3):24–33, Mar. 2008.
[9] A. P. Dawid and A. M. Skene. Maximum likelihood estimation ofobserver Error-Rates using the EM algorithm. Journal of the RoyalStatistical Society. Series C (Applied Statistics), 28(1):20–28, 1979.
[10] A. P. Dempster, N. M. Laird, and D. B. Rubin. Maximum likelihoodfrom incomplete data via the em algorithm. JOURNAL OF THE ROYALSTATISTICAL SOCIETY, SERIES B, 39(1):1–38, 1977.
[11] X. Dong, L. Berti-Equille, Y. Hu, and D. Srivastava. Global detectionof complex copying relationships between sources. PVLDB, 3(1):1358–1369, 2010.
[12] S. B. Eisenman et al. The bikenet mobile sensing system for cyclistexperience mapping. In SenSys’07, November 2007.
[13] K.-w. Fu and C.-h. Chan. Analyzing online sentiment to predict tele-phone poll results. Cyberpsychology, Behavior, and Social Networking,2013.
[14] A. Galland, S. Abiteboul, A. Marian, and P. Senellart. Corroboratinginformation from disagreeing views. In WSDM, pages 131–140, 2010.
[15] R. M. Gardner, D. L. Brown, and R. Boice. Using amazon’s mechanicalturk website to measure accuracy of body size estimation and bodydissatisfaction. Body Image, 2012.
[16] GasBuddy. http://gasbuddy.com/.[17] P. Gilbert, J. Jung, K. Lee, H. Qin, D. Sharkey, A. Sheth, and L. P. Cox.
Youprove: authenticity and fidelity in mobile sensing. In Proceedingsof the 9th ACM Conference on Embedded Networked Sensor Systems,SenSys ’11, pages 176–189, New York, NY, USA, 2011. ACM.
[18] M. Gupta, Y. Sun, and J. Han. Trust analysis with clustering (posterpaper). In 20th World Wide Web Conference (WWW’11), 2011.
[19] S. Hammi, V. Simonneaux, J. B. Cordier, D. Genin, M. Alifriqui,N. Montes, and L. Auclair. Can traditional forest management bufferforest depletion? dynamics of moroccan high atlas mountain forestsusing remote sensing and vegetation analysis. Forest Ecology andManagement, 260(10):1861–1872, 2010.
[20] T. Higashino and A. Uchiyama. A study for human centric cyberphysical system based sensing–toward safe and secure urban life–.In Information Search, Integration and Personalization, pages 61–70.Springer, 2013.
[21] B. Hull et al. CarTel: a distributed mobile sensor computing system.In SenSys’06, pages 125–138, 2006.
[22] F. Jin, E. Dougherty, P. Saraf, Y. Cao, and N. Ramakrishnan. Epidemi-ological modeling of news and rumors on twitter. In Proceedings of the7th Workshop on Social Network Mining and Analysis, page 8. ACM,2013.
[23] J. M. Kleinberg. Authoritative sources in a hyperlinked environment.Journal of the ACM, 46(5):604–632, 1999.
[24] N. D. Lane, S. B. Eisenman, M. Musolesi, E. Miluzzo, and A. T.Campbell. Urban sensing systems: opportunistic or participatory? InProceedings of the 9th workshop on Mobile computing systems and
applications, HotMobile ’08, pages 11–16, New York, NY, USA, 2008.ACM.
[25] J. R. Lax and J. H. Phillips. How should we estimate public opinionin the states? American Journal of Political Science, 53(1):107–121,2009.
[26] T. M. Lillesand, R. W. Kiefer, J. W. Chipman, et al. Remote sensingand image interpretation. Number Ed. 5. John Wiley & Sons Ltd, 2004.
[27] A. Mukhamedov, A. D. Gordon, and M. Ryan. Towards a verifiedreference implementation of a trusted platform module. In SecurityProtocols XVII, pages 69–81. Springer, 2013.
[28] S. Nath. Ace: Exploiting correlation for energy-efficient and continuouscontext sensing. In Proceedings of the tenth international conferenceon Mobile systems, applications, and services (MobiSys’12), 2012.
[29] F. Nel, L. M.-J., P. Capet, and T. Dellavallade. Rumor detectionand monitoring in open source intelligence: Understanding publishingbehaviors as a prerequisite. In Proc. Terrorism and New MediaConference, 2010.
[30] P. Netrapalli and S. Sanghavi. Learning the graph of epidemic cascades.In Proceedings of the 12th ACM SIGMETRICS/PERFORMANCE jointinternational conference on Measurement and Modeling of ComputerSystems, SIGMETRICS ’12, pages 211–222, New York, NY, USA,2012. ACM.
[31] NYC Gas Finder. https://github.com/hirefrank/nycgasfinder.[32] J. Pasternack and D. Roth. Knowing what to believe (when you already
know something). In International Conference on ComputationalLinguistics (COLING), 2010.
[33] J. Pasternack and D. Roth. Generalized fact-finding (poster paper). InWorld Wide Web Conference (WWW’11), 2011.
[34] G.-J. Qi, C. C. Aggarwal, J. Han, and T. Huang. Mining collectiveintelligence in diverse groups. In Proceedings of the 22nd internationalconference on World Wide Web, pages 1041–1052. International WorldWide Web Conferences Steering Committee, 2013.
[35] K. K. Rachuri, C. Mascolo, M. Musolesi, and P. J. Rentfrow. Sociable-sense: exploring the trade-offs of adaptive sampling and computationoffloading for social sensing. In Proceedings of the 17th annual inter-national conference on Mobile computing and networking, MobiCom’11, pages 73–84, New York, NY, USA, 2011. ACM.
[36] T. Sakaki, M. Okazaki, and Y. Matsuo. Earthquake shakes twitterusers: real-time event detection by social sensors. In 19th internationalconference on World Wide Web (WWW’10)), pages 851–860, 2010.
[37] Sense Networks. Cab Sense. http://www.cabsense.com.[38] E. Seo, P. Mohapatra, and T. Abdelzaher. Identifying rumors and their
sources in social networks. In SPIE Defense, Security, and Sensing,MD, USA, 2012.
[39] D. Shah and T. Zaman. Rumors in a network: Who’s the culprit? IEEETransactions on Information Theory, 57:5163–5181, 2011.
[40] L. Shi, S. Yu, W. Lou, and Y. T. Hou. Sybilshield: An agent-aidedsocial network-based sybil defense among multiple communities. InINFOCOM, 2013 Proceedings IEEE, pages 1034–1042. IEEE, 2013.
[41] S. Splichal. Public opinion and opinion polling: Contradictions andcontroversies. Opinion Polls and the Media: Reflecting and ShapingPublic Opinion, page 25, 2012.
[42] M. Srivastava, T. Abdelzaher, and B. K. Szymanski. Human-centric sensing. Philosophical Transactions of the Royal Society,370(1958):176–197, January 2012.
[43] P.-N. Tan, M. Steinbach, and V. Kumar. Introduction to Data Mining.2005.
[44] E. Toch, Y. Wang, and L. F. Cranor. Personalization and privacy: asurvey of privacy risks and remedies in personalization-based systems.User Modeling and User-Adapted Interaction, 22(1-2):203–220, 2012.
[45] M. Uddin, M. Amin, H. Le, T. Abdelzaher, B. Szymanski, andT. Nguyen. On diversifying source selection in social sensing. In Net-worked Sensing Systems (INSS), 2012 Ninth International Conferenceon, pages 1 –8, june 2012.
[46] F. Viani, P. Rocca, G. Oliveri, and A. Massa. Pervasive remote sensingthrough wsns. In Antennas and Propagation (EUCAP), 2012 6thEuropean Conference on, pages 49–50. IEEE, 2012.
[47] D. Wang, T. Abdelzaher, L. Kaplan, and C. C. Aggarwal. Recursivefact-finding: A streaming approach to truth estimation in crowdsourcingapplications. In The 33rd International Conference on DistributedComputing Systems (ICDCS’13), July 2013.
[48] D. Wang, T. Abdelzaher, L. Kaplan, R. Ganti, S. Hu, and H. Liu.Exploitation of physical constraints for reliable social sensing. In TheIEEE 34th Real-Time Systems Symposium (RTSS’13), 2013.
[49] D. Wang, L. Kaplan, and T. Abdelzaher. Maximum likelihood analysisof conflicting observations in social sensing. ACM Transactions onSensor Networks (ToSN), Vol. 10, No. 2, Article 30, January, 2014.
[50] D. Wang, L. Kaplan, T. Abdelzaher, and C. C. Aggarwal. Onscalability and robustness limitations of real and asymptotic confidencebounds in social sensing. In The 9th Annual IEEE CommunicationsSociety Conference on Sensor, Mesh and Ad Hoc Communications andNetworks (SECON 12), June 2012.
[51] D. Wang, L. Kaplan, T. Abdelzaher, and C. C. Aggarwal. On credibilitytradeoffs in assured social sensing. IEEE Journal On Selected Areas inCommunication (JSAC), 2013.
[52] D. Wang, L. Kaplan, H. Le, and T. Abdelzaher. On truth discovery insocial sensing: A maximum likelihood estimation approach. In The 11thACM/IEEE Conference on Information Processing in Sensor Networks(IPSN 12), April 2012.
[53] C. F. J. Wu. On the convergence properties of the EM algorithm. TheAnnals of Statistics, 11(1):95–103, 1983.
[54] X. Yin, J. Han, and P. S. Yu. Truth discovery with multiple conflictinginformation providers on the web. IEEE Trans. on Knowl. and DataEng., 20:796–808, June 2008.
[55] H. Yu, M. Kaminsky, P. B. Gibbons, and A. Flaxman. Sybilguard: De-fending against sybil attacks via social networks. In ACM SIGCOMM,pages 267–278, 2006.
[56] S. Zhao, L. Zhong, J. Wickramasuriya, and V. Vasudevan. Human asreal-time sensors of social and physical events: A case study of twitterand sports games. CoRR, abs/1106.4300, 2011.
[57] J. Zhu, H. Wang, M. Zhu, B. K. Tsou, and M. Ma. Aspect-basedopinion polling from customer reviews. IEEE Trans. Affect. Comput.,2(1):37–49, Jan. 2011.