using innovation diffusion theory and the …ponce.inter.edu/cai/tesis/hlfeliciano/index.pdf ·...
TRANSCRIPT
USING INNOVATION DIFFUSION THEORY AND THE TECHNOLOGY
ACCEPTANCE MODEL TO EVALUATE THE SECURITY OF WIRELESS
MOBILE DEVICES AT A POST-SECONDARY INSTITUTION
by
Héctor L. Feliciano-Torres
JOSÉ M. NIEVES, PhD, Faculty Mentor and Chair
JOHN GRILLO, DBA, Committee Member
DIANE STOTTLEMYER, PhD, Committee Member
Rhonda Capron, PhD, Dean
School of Business and Technology
A Dissertation Presented in Partial Fulfillment
Of the Requirements for the Degree
Doctor of Philosophy
Capella University
February 2017

© Héctor L. Feliciano-Torres, 2017

Abstract
The purpose of this quantitative, descriptive non experimental study was to investigate
the use of wireless mobile network devices at a post-secondary institution using the
innovation diffusion theory (IDT) and technology acceptance model (TAM) as
background theories. The researcher intended to explore how students and personnel of
the institution use these devices and the possible risks such use involves. The use of
mobile devices is a disruptive force capable of compromising student and personnel’s
sensitive information in an organization. Target population of this study consisted of
34% of students, 37% of faculty, and 29% of administrative personnel. The study was
conducted using the instrument Adding Innovation Diffusion Theory to the Technology
Acceptance Model: Supporting Employees' Intentions to use E-Learning Systems
created by Lee, Hsieh, and Hsu (2011). The variables used in the study were
compatibility, complexity, relative advantages, observability, trialability, perceived
usefulness, perceived ease-of-use, and behavioral intention. Findings of the study are
intended to provide insight when analyzing users’ acceptance and adoption of mobile
devices in wireless systems in an educational setting. Results showed that students,
faculty, and administrative personnel perceived the use of mobile devices as
appropriate for their learning and working styles, enhancing students’ effectiveness in
learning and personnel’s jobs. Therefore, institutions of higher education should take
measures in securing corporate data, with safety and productivity in mind. With the
incorporation of well-supported mobility and security programs, organizations can
strike the right balance between security and usability, and leverage the next generation
of consumer technology.

iii
Dedication
I dedicate this dissertation, first to God that has always been with me and have
given me the strength to finish this important goal for my live. To my wife Vanessa
whom always supported me and was by my side giving me strength to continue this
battle. That is why I LOVE YOU with all my heart. To the best friend in the world Dr.
Alma Ríos, thanks for all the help you gave me, you never told me NO when I asked for
your help. You always gave me the support I needed. A special thanks to Dr. Vilma E.
Colón, for your support and collaboration during this journey. To Dr. Marcos Torres
Nazario, Dr. Héctor W. Colón Rosa, Dr. Joel Villa, Dr. Ernesto Rosario, and Ginette
Collazo, thanks for all your help. To my mother in law Doña Hilda for your dedication,
and finally, to my father in law Don Manuel, God have him in heaven.

iv
Acknowledgments
My sincere thanks and appreciation go to my mentor Dr. José M. Nieves; for his
exceptional grasp of scholarly and excellence and provided me a constant source of
encouragement and guidance.

v
Table of Contents
Acknowledgments iv
List of Tables viii
List of Figures ix
CHAPTER 1. INTRODUCTION 1
Introduction to the Problem 1
Background of the Study 1
Statement of the Problem 3
Purpose of the Study 3
Rationale 5
Research Questions 6
Significance of the Study 7
Definition of Terms 8
Assumptions and Limitations 9
Nature of the Study 10
Organization of the Remainder of the Study 10
CHAPTER 2. LITERATURE REVIEW 12
Wireless Networks 12
Mobile Devices 25
What is mobile learning? 28
Use of mobile devices in higher education 32
Benefits of the use of mobile devices 34
Security threats from mobile devices 35

vi
Organization of the Remainder of the Study 42
CHAPTER 3. METHODOLOGY 44
Research Design 47
Sample 49
Method 51
Setting 52
Sampling Strategy 52
Instrumentation and Measures 54
Data Collection 55
Data Analysis 56
Validity and Reliability of Questionnaire by Original Authors 56
Validity and Reliability of Questionnaire for this Study 58
Ethical Considerations 59
Organization of the Remainder of the Study 61
CHAPTER 4. RESULTS 62
The Measurement Model 65
The Structural Model 69
Model Hypotheses 70
Organization of the Remainder of the Study 72
CHAPTER 5. DISCUSSION, IMPLICATIONS, RECOMMENDATIONS 73
Statement of the Problem 73
Summary of the Results 74
Discussion of the Results 76
Limitations, Suggestions and Implications 85
Recommendations for Further Study 85
vii
Conclusions 88
REFERENCES 91
STATEMENT OF ORIGINAL WORK 105
APPENDIX A. DEMOGRAPHICS BREAKDOWN 107
APPENDIX B. HYPOTHESES CONCLUSIONS 109

viii
List of Tables
Table 1. 2015 Common IEEE 802.11 Standards 15
Table 2. 2012 Opportunities and Limitations of Mobile Learning (Summary) 31
Table 3. Correlation Matrix Between Latent Constructs, Cronbach’s Alpha, Composite
Reliability (CR) and the Average Variance Extracted (AVE) 66
Table 4. Outer Loadings and Cross-Loadings for the Indicators of Each Measurement 67
Table 5. Heterotrait-Monotrait Ratio (HTMT) 68
Table 6. Hypotheses Testing Results 76

ix
List of Figures
Figure 1. Proposed research model. 4
Figure 2. Sample size calculation. 51
Figure 3. Sample size for a bivariate correlation. Reprinted from G*Power 3.1.9.2 53
Figure 4. One-way ANOVA with correlation. Reprinted from G*Power 3.1.9.2 54
Figure 5. Percent of participants. 62
Figure 6. Faculty and administrative personnel education. 63
Figure 7. Students connecting to wireless networks (minutes). 64
Figure 8. Faculty connecting to wireless networks (minutes). 64
Figure 9. Administrative personnel connecting to wireless networks (minutes). 64
Figure 10. Research’s structural model results. 70
Figure 11. Mobile devices connected to wireless networks enhances effectiveness. 77
Figure 12. Mobile devices connected to wireless networks increase productivity. 78
Figure 13. Mobile devices connected to wireless networks fits participants’ study and
working styles. 79
Figure 14. Mobile devices connected to wireless networks was easy. 79
Figure 15. Mobile devices connected to wireless networks improve study or work. 80
Figure 16. Try out various uses of mobile devices before deciding to use them. 81
Figure 17. Try mobile devices outside the campus. 81
Figure 18. Effectiveness for studying or working. 82

1
CHAPTER 1. INTRODUCTION
Introduction to the Problem
Because of the Internet and the increasing use of mobile devices, wireless
technologies have become more important on our personal and professional lives. As
long as more technological advances exist, a wireless communication infrastructure
becomes more necessary and available for immediate use. Wireless networks give us the
convenience of immediate connectivity. However, this benefit comes with some
concerns. Accessing valuable information transmitted through the air can bring security
issues. Providing security services for wireless networks, in fact, turns out to be quite
challenging. Hackers try, and many times succeed, to hack the systems. As stated by Vu
(2009) no matter how secure the system is, its adversaries are able to take advantage of
security and vulnerabilities matters. The more we do to protect the systems with firewalls
and anti-virus, the more hacking tools, worms, and viruses are developed.
Background of the Study
Cisco (2013) mentioned that the use of mobile technology in higher education
increased because of the fast adoption of cell phones. Students, faculty, and
administration members increasingly use or bring to the universities their mobile devices.
Some advantages of using mobile devices are that they can perform a variety of tasks
such as making calls, viewing or downloading course materials, teaching class material,
checking schedules, finding locations, monitoring machines, updating their social media
status, updating information, view notifications, enhance learning experience, assist with
research, improve campus operations, and enhance productivity (Cisco, 2013).

2
Mobile devices permit users to access corporate data from anywhere. In 2013,
people purchased 1.2 billion mobile devices as the most common method for accessing
Internet, exceeding purchases of personal computers. Many of these devices are used for
personal activities and for work-related activities (Patten & Harris, 2013).
At the institution where the research was performed, faculty, students and
administrators are authorized to take their own mobile devices and to connect through the
wireless network to access the Internet. There are 331 administrative members, 389
faculty members and 9,380 students who have access to the university’s wireless
network. The organization’s wireless Internet access has a range of 500 IP address
available for this purpose. Access can be done in a daily basis, even though the system
will clear users’ access after three days (G. Ocasio, personal communication, May 1,
2016). Each user will be able to access the wireless network from more than one mobile
device simultaneously. Therefore, the users can connect to the Internet through the
wireless network with their mobile devices and keep the assigned IP address for three
consecutive days, even though they do not use it. This creates a constant use of network
traffic because the system does not eliminate automatically the assigned address by the
dynamic host configuration protocol (DHCP). The DHCP assignment has to be
eliminated manually from the device using the IP address and the IP assigned to it. In
fact, hackers often target universities during the academic year, and campuses are not
equipped to handle the cybersecurity threats (Thompson, 2014). According to Cisco
(n.d.a.), a college campus averages from 40 to 50 hacks a day during back-to-school
season.

3
Statement of the Problem
New generations of mobile devices connect daily to the wireless network. This
produces an increase in risks and security challenges resulting in more information
transmitted through the application and consequently an increase of risk in personal
safety. Threats to security information technology are growing, affecting adversely
companies and institutions around the world.
The researcher of this study explored the use of mobile devices such as
smartphones and tablets, at a post-secondary institution. By using the innovation
diffusion theory (IDT) and technology acceptance model (TAM) as a background theory,
the researcher intended to explore what uses participants gave to these devices using the
wireless network of the educational institution, and the risks it involves. This issue is very
relevant for the Information Technology (IT) field because it is necessary to promote and
provide security in wireless networks due to the continuous evolution of mobile devices
and its use in different fields. According to Adams (2007), almost everyone now has a
duty to mitigate risks. We have the duty of protecting our environment, live, family,
work, and property to reduce consistently the potential risk and magnitude of damage
they can cause. It is important to reduce adverse effects that our conduct can cause on
other properties, including were people study and work.
Purpose of the Study
The purpose of the researcher was to investigate the use of mobile devices
connected through a wireless network at a post-secondary institution using IDT and TAM
as a background theory. The proposed research model, as shown in the Figure 1, illustrate
the correlation between IDT and TAM. The researcher aimed to identify how both

4
theories correlate, identify possible treats to a higher education institution’s network
system when using mobiles devices connected to wireless networks, and possibly come
out with strategies to mitigate risks. As stated by the University of Massachusetts (2016),
access to institution’s wireless network presents significant risks to the network, the
integrity, and reliability of institution’s data maintained on or served from university
information systems. Research, financial, instructional, personal, operational, and other
sensitive data are targeted by hackers when trying to enter and access the institutions’
systems.
Figure 1. Proposed research model.
According to Buchanan (2011), information and communication technologies are
increasingly being used in education environments. Many governments are emphasizing
that turning out technologically and digitally literate able graduates, whom are
employable in the global information economy, is of great importance nowadays.
Schmidt (2006) indicated that mobile learning, or m-learning, is one of the fastest
growing areas in the communication and information technologies field in the education
Compatibility
Complexity
Relative
Observability
Trialability
PU
BI
PEU
(TAM) (IDT)

5
environment. Both cover any form of learning that is facilitated through a mobile
handheld device. These devices include digital media players, smartphones, personal
digital assistants, and tablets.
One of the most significant benefits of using these devices is the ability to
communicate (Choi, Robles, Hong & Kim, 2008). According to Schmidt (2006), the use
of these devices also brings new security threats and alters that risk profile of security for
information systems in the organization. Risk assessment of threats associated with
wireless monitoring should be done in order to set and develop a plan to mitigate
identified threats. The implementation of technological solutions is one way to counter
wireless security threats and vulnerabilities; making this an important issue. Another way
to help IT managers to counter threats linked to the use of wireless technology is
evaluating the institution’s framework with the results of the questionnaire given to
students and faculty.
Rationale
According to the National Institute of Standards and Technology (n.d.),
implementation of wireless communication networks and use of wireless devices is
increasing. New developments present new security risks and it is imperative that critical
assets remain protected. Companies should protect the confidentiality, integrity, and
availability of all their systems and information. Data broadcasting using radio
frequencies, immature technology, flawed implementations, limited user awareness,
incomplete security standards and lack administrative and security practices are unique
challenges for companies with a wireless environment. Organizations, institutions, and
individuals benefit when devices and wireless networks are protected. Risks should be

6
reduced by applying countermeasures, such as; management, operational, and technical
controls, to address threats, and vulnerabilities.
Research Questions
The following are the research questions for this proposed study:
RQ1. How does Compatibility (CPA) relate with the Perceived Usefulness (PU),
Perceived Ease-of-Use (PEU) and Behavioral Intention (BI) reported by the
educational community of an Institution of Higher Education (IHE) who uses
mobile devices connected through the IHE wireless network?
RQ2. How does Complexity (CPL) relate with the Perceived Usefulness (PU),
Perceived Ease-of-Use (PEU) and Behavioral Intention (BI) reported by the
educational community of an Institution of Higher Education (IHE) who uses
mobile devices connected through the IHE wireless network?
RQ3. How does Relative Advantages (ADV) relate with the Perceived Usefulness
(PU), Perceived Ease-of-Use (PEU) and Behavioral Intention (BI) reported by the
educational community of an Institution of Higher Education (IHE) who uses
mobile devices connected through the IHE wireless network?
RQ4. How does Observability (OBS) relate with the Perceived Usefulness (PU),
Perceived Ease-of-Use (PEU) and Behavioral Intention (BI) reported by the
educational community of an Institution of Higher Education (IHE) who uses
mobile devices connected through the IHE wireless network?
RQ5. How does Trialability (TRI) relate with the Perceived Usefulness (PU),
Perceived Ease-of-Use (PEU) and Behavioral Intention (BI) reported by the

7
educational community of an Institution of Higher Education (IHE) who uses
mobile devices connected through the IHE wireless network?
Significance of the Study
Choi et al. (2008) indicated that wireless technology also creates threats and alters
the companies’ security in existing information. With all the benefits that wireless
networking provides, it also has its limitations because of new security threats that alter
the organization’s complete information security risk profile. As stated by Ho, Lai,
Chen, Wang, & Tai (2012), detection of malicious traffic has been an active subject for
network security during the last several years. Denial of service, propagation of viruses,
worms, sophisticated attacks, malware Trojan horses, botnets, and spyware are some
examples of malicious traffic that make network performance inefficient and have made
organizations, institutions, and individuals’ efforts unsuccessfully to fully protect
networks and computer systems.
The use of mobile devices connected to the campus wireless networks is a
disruptive force capable of obtaining sensitive information of students and the
organization. Schmidt (2006) indicated that campus administrators are pressured to
implement wireless networks on the campus, responding to student and faculty demands,
but many times important security concerns may be overlooked. Given the significance
of security concerns, it is important to increase knowledge and understanding of security
concerns and threats. In order to provide a secure computing environment for students
and faculty, network administrators and university officials need to be aware of security
threats occurring at their campuses. If the institution and its personnel understand what
8
the risks are involving in the use of mobile devices at the camps, network managers will
be able to address security issues.
Through this study, the researcher investigated the uses of mobile devices
connected to the wireless network of a post-secondary institution of higher education that
can result in new security issues and limitations. The results may be of great importance
to higher education administrators, IT directors, and policy makers of IHE.
Definition of Terms
The following terms are important to this study:
Behavioral intention (BI) - “the degree to which a person believes in using a
particular system to perform a specified conduct” (Davis, 1989, p.323).
Compatibility - “the degree to which innovation is regarded as being consistent
with the actual values, experiences and needs” (Rogers, 1995, p.15).
Complexity - “perceive the level of difficult in understanding innovations and
use” (Rogers, 1995, p.16).
Observability - “the degree to which the results of innovation is visible to others”
(Rogers, 1995, p.16).
Perceived ease-of-use (PEU) - "the degree to which a person believes that using a
particular system would be free from effort" (Davis, 1989, p.320).
Perceived usefulness (PU) - "the degree to which a person believes that using a
particular system would enhance his or her job performance" (Davis, 1989,
p.319).
9
Relative advantage - “the degree to which an innovation is considered as being
better than the idea it replaced” (Rogers, 1995, p.15).
Trialability - “the degree to which an innovation may be conducted on a limited
basis” (Rogers, 1995, p.16).
Assumptions and Limitations
For this research, some assumptions are taken under consideration as well as
some limitations. First, technology access is significant for the population. This is seen in
homes, businesses, and college campuses, because it provides a high level of convenience
to users as they move from location to location (Schmidt, 2006). However, according to
Crowley (2009), the study of information systems security, unlike more mature
disciplines such as computer science, has not yet established a generally accepted body of
knowledge. This is partly due to the ever-changing kind of threats in this emerging field.
Second, it is assumed that the sample selected is representative of the population
under study. Holton and Burnett (1997) stated that "one of the real advantages of
quantitative methods is their ability to use smaller groups of people to make inferences
about larger groups that would be prohibitively expensive to study” (p.72). Some
limitations identified that may affect the research are: (a) the limited number of
participants, as they represent a previously selected group, (b) the availability of
participants to answer the questionnaire, (c) how accurately it is representative the sample
versus the global population; and (d) the few investigations on the subject of possible
threats caused by mobile devices connected to wireless networks.

10
Nature of the Study
The theoretical framework used was composed of the technology acceptance
model (TAM) by Davis (1989) and the innovation diffusion theory (IDT). These are
similar in some constructs and complement each other to examine the adoption of
technology (Rogers, 1995). Similarities between both theories are relative advantages and
complexity, and perceived ease of use and perceived usefulness (USA Information
Resources Management Association, 2012). The (TAM) model was described as an
information system theory where users come to accept and use a technology. The model
suggests that when users are presented with a new technology, a number of factors
influence their decision about adoption and acceptance.
According to Lee et al. (2011), TAM is an excellent model to explain IS/IT
acceptance. These authors also endorse integrating TAM with other theories such as IDT
or DeLone & McLean’s IS success model to deal with rapid changes in information
system and technology, as well as specificity and explanatory power improvement.
Constructs of both models, TAM and IDT, are similar and they complement each other
when used for IS/IT adoption. Investigators such as Sigala, Airey, Jones, and Lockwood
(2000) and Chang, Sung, and Chen (2002) (as cited in Lee et al. (2011) integrated both
theories and concluded that the combination of both provides a stronger model.
Organization of the Remainder of the Study
Organization of the remainder of this study will be: (a) Chapter 2, will include
literature review on security issues regarding the use of mobile devices to wireless
networks at post-secondary institutions; (b) Chapter 3 will discuss the quantitative
methodology, instrumentation used to collect data, sample, validation and reliability of

11
the instrumentation, data analysis and ethical considerations used to determine
hypotheses investigation; (c) Chapter 4 will include results of the study and analysis of
the data collected as described in Chapter 3, and; (d) Chapter 5 will include the summary
of the study, discussion, implications of the research, conclusion, and future
recommendations.

12
CHAPTER 2. LITERATURE REVIEW
This chapter presents the literature review for this study. For this part of the study,
more than 135 articles that address the issue of the vulnerability in the use of mobile
devices in a wireless network were reviewed; included among these were master’s theses,
doctoral dissertations, books, magazines, and websites.
Wireless Networks
According to Cisco (n.d.b.), a wireless network is a local area network (LAN) that
uses radio waves to connect devices such as laptops to the Internet, and your business
network and its applications. Wireless networks are the most popular technology used
today, because it connects devices without affecting their mobility; this is one of the
fundamental factors of wireless networks. A Wireless Local Area Network (WLAN) is a
type of local area network that communicate between network-enabled devices using
high frequency radio waves instead of wires. Cisco Systems Inc. (n.d.b.) pointed out that
since wireless radio signals transmit through air, they are easier to intercept. Kizza (2015)
describes wireless LAN as a local area network where some or all devices interconnect
through microwave radio signals or in-line infrared beams instead of cables or wires.
Vu (2009) stated that wireless networks are used almost everywhere: business
applications, institutions that give each student and employee wireless Internet access,
and military applications. Generally, there are always requirements for protecting the
confidentiality and privacy of data transmission through air. Data transmitted through air
adds more worries to the task due to the possibility of service attacks.

13
Archidona (2010) and Meneses (2014) stated that attacks on wireless networks,
usually come from nodes not authorized, i.e. nodes installed without the knowledge of the
network administrators. Radio signals reach all devices that are within the coverage of a
network. Network security violations usually come from unauthorized devices. Over-the-
air broadcasting has vulnerabilities exploited by intruders, which can achieve associated
to the access point resulting in improper use of the network.
Traffic from wireless networks is more easily spied on compared to a wired
network. A practical example is passive attacks, known as sniffing. It is enough to have a
mobile device with the required characteristics, to analyze the traffic that has not been
encrypted. In the case of traffic analysis, the attacker obtains information by simply
examining this and their patterns, i.e., (at what time certain devices are turned on, how
much traffic is sent, for how much time, transmission of data, among others, to make
statistics with a particular purpose). The interception of transmitted data may result in
the disclosure of confidential data and user credentials without protection, in addition to
the usurpation of the identity. It also allows that hackers with a certain degree of
sophistication collect information about information technology and use it to attack
systems or data that otherwise would not be vulnerable (Archidona, 2010, and Meneses,
2014).
Easy access to internal network allows potential attackers to forge apparently
legitimate data that is not possible to do from outside the network; for example, imitate
company’s e-mail messages. Users, including system administrators, tend to trust items
originating from within the corporate network much more than those coming from the
outside. In addition, it is possible that the goal of the attacker is as simple as using a

14
network as a free Internet access point. While this type of threat is not as worrisome as
the previous ones, free charge will not only reduce the level of service available for
legitimate users, but it could permit the introduction of viruses and other threats
(Archidona, 2010, and Meneses, 2014).
IEEE 802.11 oversees the design of wireless local area networks (WLAN)
protocols providing many of the most successful standards in wireless communication
systems (Kim & Lee, 2015). The IEEE 802.11 protocol is a local area wireless
communication standard working from 2.4 GHz to 5 GHz (Shi, Liu, Liu and Zhang,
2015). Kim and Lee (2015) stated that IEEE created a project (1980) called 802 and
many working groups have been made under this project. In 1997, the first specification
for WLAN was published under the 802.11-working group. The specification defined
only the data rate of 1 or 2 MBS operated at 2.4 GHz band. In 1999, IEEE expanded the
standard under two task groups that became known as 802.11b and 802.11a. In 2003,
with the intention to support the data rate up to 54 Mbps in the 2.4 GHz band, the
802.11g task group decided to take on the same physical layer and specification of media
access control of 802.11a.
Kim and Lee (2015) stated that in 2009, with the usage of Internet browsing,
nevertheless, with multimedia contents, delivery needs kept growing and a demand on
higher data rates in WLAN arose. The IEEE 802.11 committee approved the creation of
another task group, the 802.11n. The goal of 802.11n was to achieve the throughput of
100 Mbps at the media access control layer. They employed multiple input and output
techniques, including spatial-division multiplexing with up to four streams, space-time
block coding, and beam forming transmission.
15
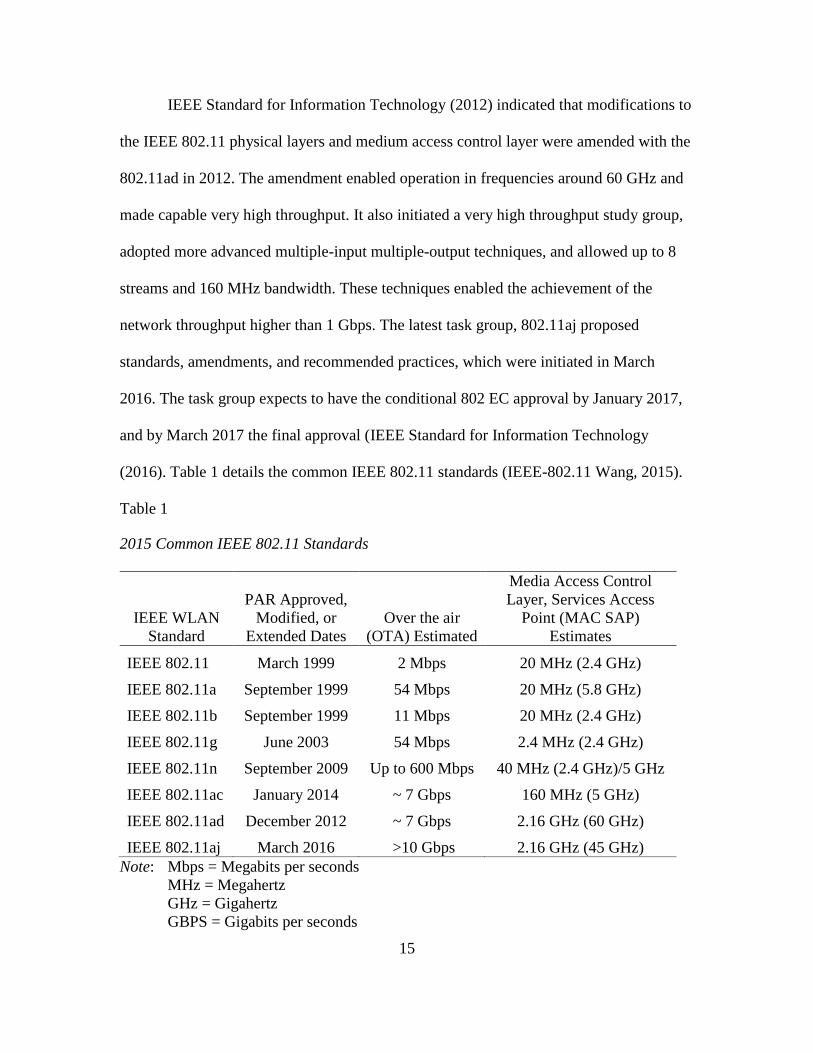
IEEE Standard for Information Technology (2012) indicated that modifications to
the IEEE 802.11 physical layers and medium access control layer were amended with the
802.11ad in 2012. The amendment enabled operation in frequencies around 60 GHz and
made capable very high throughput. It also initiated a very high throughput study group,
adopted more advanced multiple-input multiple-output techniques, and allowed up to 8
streams and 160 MHz bandwidth. These techniques enabled the achievement of the
network throughput higher than 1 Gbps. The latest task group, 802.11aj proposed
standards, amendments, and recommended practices, which were initiated in March
2016. The task group expects to have the conditional 802 EC approval by January 2017,
and by March 2017 the final approval (IEEE Standard for Information Technology
(2016). Table 1 details the common IEEE 802.11 standards (IEEE-802.11 Wang, 2015).
Table 1
2015 Common IEEE 802.11 Standards
IEEE WLAN
Standard
PAR Approved,
Modified, or
Extended Dates
Over the air
(OTA) Estimated
Media Access Control
Layer, Services Access
Point (MAC SAP)
Estimates
IEEE 802.11 March 1999 2 Mbps 20 MHz (2.4 GHz)
IEEE 802.11a September 1999 54 Mbps 20 MHz (5.8 GHz)
IEEE 802.11b September 1999 11 Mbps 20 MHz (2.4 GHz)
IEEE 802.11g June 2003 54 Mbps 2.4 MHz (2.4 GHz)
IEEE 802.11n September 2009 Up to 600 Mbps 40 MHz (2.4 GHz)/5 GHz
IEEE 802.11ac January 2014 ~ 7 Gbps 160 MHz (5 GHz)
IEEE 802.11ad December 2012 ~ 7 Gbps 2.16 GHz (60 GHz)
IEEE 802.11aj March 2016 >10 Gbps 2.16 GHz (45 GHz)
Note: Mbps = Megabits per seconds
MHz = Megahertz
GHz = Gigahertz
GBPS = Gigabits per seconds

16
Kharbash (2013) studied problems of network reliability with the ability of the
underlying network to deliver successful communication between the set of nodes (i.e.,
the sources and destinations), which is a concern, whenever there is a need for security of
data transport within the network. Karbash (2013) stated that the analysis of the reliability
of the network has been an important area of study in cable networks but little research
has been done in academic wireless networks topics. Most of the existing work has
consisted of graphs of networks with nodes and edges of identical reliability, but wireless
networks are very different from wired networks because nodes are likely to fail due to
their unique features, such as fluctuating average characteristics and properties of the
wireless devices. For example, the broadcast nature of wireless communication links
makes wireless communications unique in their vulnerability to loss of connectivity due
to interference, weather conditions, and terrain effects, limited transmission range, and
limited ability to change places. Because of these obstacles, there has been a paradigm
shift between the traditional reliability analyses for wired network and the wireless
networks.
Lu (2013) also pointed out that the explosion of wireless networks, such as WI-FI
and cellular networks, have brought great changes to the daily lives of people. It also has
allowed the creation of new applications and services, including smart grid systems and
mobile services. However, these applications are vulnerable to denial-of-service attacks
because wireless channels are shared provoking system failures with devastating
consequences. A direct consequence of such attacks is system failures, including
performance degradation, denial of service on the network, or problems on successful
message delivery throughout the network.
17
Zaman, Ahmad, Azhar, Nawaz, and Abbas (2014) agreed that wireless networks
are the most popular technology nowadays because of the advantage of connecting two or
more devices wirelessly via radio waves at high frequency. Su (2010) indicated that the
use of a wireless sensor becomes less expensive and more powerful and that there is
potential use, for example, health surveillance for military detection. On the other hand,
similar to other networks, sensor networks are vulnerable to malicious attacks; however,
the hardware simplicity of these devices makes defense mechanisms designed for
traditional networks infeasible. Malicious attacks can have a devastating impact on a
sensor network and can decrease sensor lifetime from years to days.
Zaman et al. (2014) pointed out that wireless networks allow users to move within
the local coverage area. This type of network setup has several advantages, such as
productivity improvement due to increased easier and faster access to information
resources and less expensive network configuration and reconfiguration (Choi et al.,
2008). It also has some additional security challenges, compared to wired networks
(Zaman et al., 2014).
Choi et al. (2008) pointed out that wireless networking provides many advantages
such as productivity improvement, due to increased accessibility to information
resources, and easier, faster and less expensive network configuration and
reconfiguration. Nonetheless, it also brings new security threats and changes the
organization’s general information security risk profile. Risk of interception through
wireless network is greater than with wired networks because communication is made
using radio frequencies through the air. Therefore, confidentiality can be compromised if
a message is not encrypted, or encrypted with a weak algorithm and ready by an attacker.

18
Protecting confidentiality, safeguarding integrity, and preserving availability of the
information and information systems is crucial. The technological solutions are
implemented to respond to wireless security threats and vulnerabilities, it is mainly a
management issue. Threats associated with wireless technology requires a comprehensive
and exhaustive assessment of risk particularly due to the environment and a development
of a plan to mitigate identified threats is necessary. The vulnerability of wireless can be
defined as a weakness on any network that can be attacked by a threat. The weak points
in the network are used by the hackers to attack the systems while at the same time they
seek the vulnerability of these systems. Some threats and vulnerabilities found in wireless
network are: no built-in security in architecture of wireless network protocol, system
network security is a vital configuration element and network management,
implementing effective network security will provide physical security and information
paths, links and databases.
Choi et al. (2008) indicated that in order to ensure transmission, it is important to
implement techniques, and authentication and encryption in 802.11 protocols such as
WEP, WPA, and WPA2. These protocols are known as "wireless equivalent privacy”,
"Wi-Fi Protected Access", and “Wi-Fi Protected Access 2." Encryption and
authentication are important for wireless networks due to easily wireless network
interception and manipulation, which could prevent unauthorized access, threats and
vulnerabilities.
Vu (2009) indicated that wireless networking technology is being deployed
everywhere in our daily lives because of ease of installation, cost efficiency, scalability
and mobility. During the last ten years, there has been a substantial amount of research in

19
the area of wireless networks. Wireless networks offer indubitable convenience in
science, educational, commercial, and military applications. It is expected that in the
future, almost everything will be wireless. Examples of this trend are theater speakers,
wireless home for wireless gadgets used by restaurants to avoid a long line, wireless
gaming consoles, wireless laptops, and controlled wireless spacecraft cars.
Vu (2009) pointed out that wireless networks have become one of the most
popular technologies today. Although they offer many benefits, there are many
challenging concerns about the security of the information transmitted through the air.
Network security has been going through a long and rough development process.
Powerful computers, much higher bandwidth of the network, more users have access to
Internet, and more technology that is sophisticated are some examples of these
developments. There are probabilities that information is stolen while adversaries are
interested in valuable information. Even though the system appears to be safe, there are
possibilities that opponents take advantage of security vulnerabilities. As the
development of more security systems, firewalls, and anti-virus software is increasing,
the invention of more viruses, worms, Trojans, and hacking tools is too. Nonetheless, it is
important to continue working and improving security systems in order to protect
valuable assets from the enemies.
According to Cisco (2010), among the challenges that companies need to face
with the use of wireless networking are the high proliferation of Wi-Fi devices and non-
Wi-Fi devices that occupy the same shared of the Radio Frequencies (RF) spectrum.
Those devices cause interference on the network. Among the devices included are
laptops, smartphones, wireless video, and other wireless devices that interfere with

20
networks. Companies are adopting Wi-Fi for mission-critical data and applications
because of improvements in technology. In addition, many companies lack of tools,
resources, and expertise to handle the challenges brought by those new technological
trends.
Kpaduwa (2010) agreed that the data that passes through a wireless LAN with
disabled Wired Equivalent Privacy (WEP) is vulnerable to attacks by listening and data
modification. Nonetheless, even when WEP is enabled, confidentiality and integrity of
wireless traffic is still at risk because of the many flaws that WEP has shown over the
years. Zaman et al. (2014) listed the following possible attacks on WEP: (a) passive
attacks to decrypt traffic, based on known plaintext, chosen cipher text attacks, and
statistical analysis on cipher texts; and (b) active attacks to inject new traffic from
unauthorized mobile stations, to modify data, and to decrypt traffic, based on tricking the
access point into redirecting wireless traffic to an attacker’s machine.
Zaman et al. (2014) stated that wireless networks are attractive to users due to
ease of installation, inexpensive equipment, and low implementation costs. However,
they also provide opportunities for hackers to learn, practice, and find vulnerabilities, and
to launch attacks on the network. Designed flaws in security mechanisms of 802.11
standard also offers the opportunity of potential attacks, both passive and active, which
can allow intruders on the system and tamper with wireless transmissions.
Zhu (2012) mentioned in his study that today many wireless technologies could
be integrated to build a seamless, wireless data access platform. Even though their goals
and applications are very different, a basic model that consists of an access point and a

21
number of wireless channels can logically represent data access through wireless
technologies.
Sathyavani and Selvi (2014) indicated that wireless networking provides many
advantages such as, convenience, productivity, mobility, and deployment. They also
make configuration and reconfiguration of a network easier, faster, less expensive,
expandable, and cost effective. This type of network brings new security threats and can
alter a company’s overall information security risk profile. Messages encrypted, with
weak algorithms can compromise confidentiality if a hacker reads them. However,
implementation of technological solutions is the typical response to wireless security
threats and vulnerabilities; wireless security is mostly a management issue. It requires a
thorough and exhaustive risk assessment due to the environment and development of a
plan to diminish identified threats. Although wireless networking changes the risks
associated with various threats to security, the general security objectives keep being the
same as with wired networks: preserving confidentiality, ensuring integrity, and
maintaining availability of the information and information systems. If ensuring the
safety of traditional networks is a complex task, in wireless networks it is even more
difficult.
Kharbash (2013) investigated the problem of calculating the reliability of two
terminals in an ad hoc mobile mode for the network wireless network. Since it is
necessary to present how imperfect parameters affect network performance, and to
understand the reliability analysis in the context of the wireless network, he scanned the
statistical characteristics of the wireless medium. He explored how, varying transmission
power nodes impact the reliability of the all-terminal network. Based on this

22
understanding, he proposed an algorithm for power control, which took into account
statistical variation of the interference ratio of signal-to-nodes receiving, and optimally
allocating transmission powers nodes to maximize both reliability links and all-terminal
network reliability. The researcher focused on the deployment of relay nodes hierarchical
hybrid wireless network so that the network reliability is maximized. Finally, he
presented a reliability influence-ranking algorithm in order to identify the most nodes that
should be considered when evaluating reliability. By identifying node reliability
influence ranking on network reliability, we can focus how the reliability significance
measures evaluation on fewer nodes and hereafter, prioritize the reliability improvement
activities efficiently.
Raymond’s (2008) research contributed to state-of-the-art wireless sensor network
research. First, it totally explored the denial-of-sleep attack, to include the
implementation of a subset of these attacks on actual sensor devices, and an analysis of
the efficiency of these attacks. Second, it provided a set of tools by which these attacks
were detected and defeated in a lightweight, platform-independent, and protocol-
independent way. Planning risk is important because it can strengthen security and
improve production by reducing the number of security incidents in an organization. If
there is no clear understanding of acceptable risk level required, the appropriate levels of
security cannot be determined by the management (Hoo, 2000). After the implementation
of a network, it is often difficult to implement new security policies in a production
network. Sometimes, it can cause loss of production due to the security policies that
prevent users require access to data and assets needed (Workman, Bommer, & Straub,
2008).

23
Stallings (2008) stated that institution of higher education faces increasing
challenges on network security. Organizations constantly review and analyze their
information technology structure, to implement new measurements in order to prevent the
attack of viruses, spam, hackers and identity theft, also to improve their security.
Certainly, these institutions faces some challenges considering that they need to maintain
open labs, and unlimited access for their students.
Stallings (2008) study revealed that network security has become a main concern
in institutions of higher education. However, challenges delay adequate security include
lack of staff, lack of funding and lack of support from administrators. With the increase
in security attacks in information technology, institutions are struggling with inadequate
resources such attacks. Daley (2005) indicated, “Hackers can use educational resources to
launch attacks aimed at critical infrastructure beyond a campus. Institutions must take
responsibility for vulnerable systems to ensure cyberspace is being protected. If one
computer is left unprotected, it can cause an epidemic not only on the university campus
but in the cyber community as well; this kind of epidemic can be difficult to eradicate”
(as cited in Stallings, 2008).
Zaman et al. (2014) argued that security for wireless networks does not just
consist of using a password. It is recommended that setting up and using strong
passwords should be required and their periodic change be forced; policies and safety
standards are essential to make wireless transmission a confidential communication
through air. If a user or an organization implements a wireless network, according to
some of these configurations, the organization can avoid different types of threats to
network security and attacks. Mani, Kim-Kwang, and Mubarak (2014) recommend that

24
reassessing risk, as a strategy for security in cyberspace, is necessary to include
acknowledgment of understated vulnerabilities and a better-distributed knowledge about
the nature and character of the overhyped threats of cybercrime, cyberterrorism, and
cyberwar.
West (2008) indicated that action has been taken by the universities’ presidents
whom agree to make IT security a high priority in their institutions and that commitment
includes the adoption of the following policies and measures; review policies of
institutional security, improve the use of existing security tools, improve the safety of
future research and education networks, improve collaboration between higher education,
industry and government, and integrate work in higher education with the national effort
to strengthen critical infrastructure. Oblinger (2003) mention that higher education
institutions have a moral and legal responsibility to protect sensitive data kept on campus
computers. These because computers contain financial data records, personnel and
students’ information, intellectual property and digital communications, both internally
and externally that are used in everyday activities (as cited in West, 2008). A balancing
act between cybersecurity and principles of the academy must be reached for institutional
resources are protected without compromising the mission of the institution. National
Strategy (2003) encouraged colleges and universities to ensure their cybernetic systems
by establishing policies and measures where appropriate. In the case of schools, it is
recommended that IT systems should launch model guidelines, empower CIOs to address
cybersecurity, create one or more sets of best practices for IT security, model programs
and materials user awareness to protect their systems.

25
Mobile Devices
The term “mobile device” is defined as:
A mobile device is a handheld computing device with a display screen that
allows for user input (e.g., touch screen, keyboard). When connected to a
network, it enables the sharing of information in formats specially
designed to maximize the use of information given device limitations (i.e.,
screen size, computing power). Mobile devices provide the conveniences
of conventional desktops or laptop computers in a more portable package.
Examples of popular mobile devices include, smart phones and tablets.
Laptop computers are not included in this definition. (Wedel &
Michalowicz, 2015, p. 9)
Lin and Brown (2007) stated that the smartphone is a mobile phone that offers
more advanced computing ability and connectivity than a contemporary basic feature
phone. Smartphones and feature phones are as handheld computers integrated within a
mobile telephone. However, while most feature phones are able to run applications based
on platforms such as Java ME, a smartphone permits the user to install and run more
advanced applications based on a specific platform. A smartphone runs complete
operating system software providing a platform for application developers. In addition, it
is a device that can take care of one’s communication, handheld computing and
multimedia needs. These devices combine the functionality of mobile phones and
Personal Digital Assistants (PDAs), and the smartphone offers a personal information
manager, functionality, and allows professionals to install and run various computers
applications.

26
Lin and Brown (2007) indicated that since IBM created the first Smartphone in
1993, this equipment has evolved over the years. The first Smartphone offered basic
options, but now offers to users: e-mail, text messaging, GPS, Web browser and PDAs,
generating major changes in the technologies and communication. The year 2006 was a
good year for cell phone manufactures, including almost eighty million Smartphone. This
revolution offered a great opportunity for individuals and for the companies, providing
competitive benefits for businesses and individual users, and it has been rapidly growing
in current years due to wide diffusion of mobile devices.
Zhu (2012) indicated that with the rapid evolution of smart mobile devices, the
emerging mobile wireless networks have become increasingly popular. Data services are
also growing as mobile location technology is available for most mobile devices, but also
there is an increment in risks and threats when these devices connect to a wireless
network.
Su (2010) pointed out that in this era there has been a rapid evolution and
adoption of mobile devices such as smartphones, equipped with sophisticated input and
display systems, and several similar communication technologies. This tendency has
occurred simultaneously with the rapid deployment and implementation of high-speed
Internet services and web-based applications. However, he emphasized that with these
mobile technologies, which provide countless opportunities, also provide challenges that
need to be confronted in comparison to traditional desktop computing.
Eddy (2014) indicated that the use of mobile devices at work or in people’s
private lives is changing the way businesses consider implementing policies, processes,
and infrastructure, regarding personnel using their personal devices at work, known as the

27
bring-your-own-devices (BYOD) initiatives. In a study conducted by the Information
Security Community on LinkedIn of more than 200,000 information security companies,
results showed that of the 66% who responded the questionnaire, 21% indicated that their
organization have fully implemented BYOD procedures, infrastructure, and processes. In
addition, 24% indicated that they do not have mobile devices policies; and 21% said that
even though their companies do not support the BYOD adoption, they still allow
employees to bring their devices to their work areas. According to Peng (2013), during
the last years, there has been a tremendous growth of mobile devices and applications. In
2012, 722 million smartphones and 128 million tablets were shipped around the world.
Peng (2013) also predicted that the use of mobile devices would reach 1.52 billion
devices, and 352 million by 2017. Meanwhile, mobile application downloads at the
Apple Store and Google Play have exceeded 50 billion and 25 billion, correspondingly.
To support mobile data devices and applications, 3G/4G cellular network infrastructures
play a critical role. Mobile data traffic carried by the cellular networks is estimated to
grow seven times within the next four years, from 1.6 Terabyte in 2013 to 11.2 Terabyte
in 2017.
Zahadat (2016) pointed out that with the rapid increase of smartphones and
tablets, companies’ information technology departments have more security concerns
than before. They are monitoring more the used of mobile devices, and applying security
procedures. Employees are using their personal mobile devices at work and using both
their carriers’ services and the organizations’ Wi-Fi system.
Karch (2014) stated that the prevalence of mobile technology is changing the way
in which people communicate, access information, conduct business, teach, and learn.
28
Educators are exploring new ideas for integrating mobile devices into instruction to
enhance academic experiences for students and engage them in the learning process. In
fact, the Educause Center for Applied Research (2012) did a survey on Mobile IT in
higher education. The results showed that students are adopting mobile devices, such as
smartphones, cellphones, and tablets in higher education. Results were that 67% of
surveyed students believed that mobile devices are important for succeeding
academically and they indicated that they use their devices for academic activities. The
increased use of mobile devices on higher education has the potential to create new
options for college students. They provided educational opportunities for students
regarding course content access, and interaction with student colleagues and instructors.
What is mobile learning?
According to Rossing, Miller, Cecil, and Stamper (2012), it is any type of
learning that takes place in learning environments and spaces that account the mobility of
technology, mobility of learners and learning. There is a high potential in mobile
learning; it is no longer a matter of extending devices: iPads, phones, tablets, or any other
type of always-connected wireless device. In fact, formal education has moved out of the
classroom and closer to the student’s physical and virtual environment. This is the
essence of mobile learning –accessing information and knowledge anywhere, anytime
(Traxler, 2007) from devices that learners are used “to carrying everywhere with them”
and that they regard as friendly and personal.” Nowadays, learning has become lifelong,
more situated, personal and useful. Because technology is more affordable and the
improvement of digital networks, people turn to mobile devices as their first choice for
connectivity (Rossing et al., 2012).

29
Furthermore, Colley, Hodkinson, and Malcom (2003); Marsick and Watkins
(1990) identified mobile learning as both formal and informal learning. Formal learning
by design means students engaging with materials developed by a teacher, used during a
program of instruction in a highly structured, sponsored by the institution, and credited
upon completion educational environment (as cited in Gikas & Grant, 2013). Halliday-
Wynes and Beddie (2009) indicated that informal learning is often defined as learning
that results “from daily work-related, family or leisure activities” (as cited in Gikas &
Grant, 2013). According to Marsick and Watkins (2001) it is often intentional but lacks
structure and context, and for Jubas (2010) this type of learning is sometimes
“unanticipated, unorganized, and often unacknowledged, even by the learner” (as cited in
Gikas & Grant, 2013). Gikas and Grant (2013) stated that activities such as reading, using
the Internet, going to libraries, museums, zoos, and on-the-job learning are usually
considered informal learning activities. In any of these activities, learners can use and
access their mobile computing devices to investigate, research, or collect information to
be used in their formal learning environment.
Nevertheless, Gikas, and Grant (2013) argued that learning is ever-present, and
much of our learning takes place in an informal educational setting. In those instances,
informal learning should not be considered as something that occurs after accomplishing
formal learning but in combination. Mobile computing devices can be used as the link
between formal and informal learning opportunities.
According to Rossing et al. (2012), the use of mobile technology on college
campuses, for classroom activities, learning activities, research, and even student faculty
communications, which are expected to rely heavily on mobile technology is growing. In

30
a study conducted by Indiana University and Purdue University Indianapolis (IUPUI) to
interdisciplinary faculty, results showed that faculty have experimented with the use of
iPads in the classroom. This growing use of technology creates new challenges for the
teaching-learning process. For the last two decades, colleges and universities adapted and
responded to new technologies such as the Internet, email, instant messaging, among
others. This trend forced educators to evaluate the pros and cons of technology. Some
researchers sustained that, while the Internet and digital technologies undeniably increase
the potential access to higher education, unprepared students and faculty require intensive
and steady institutional support (Rossing et al., 2012).
Rossing et al. (2012), on the other hand, presented results that indicated that
students reported downsides to easy information access and availability. The biggest
limitation seemed to relate to the students’ ability to access social networking, email, and
games. Many students admitted to check their “email and Facebook rather than
participating in the classroom because it was easier to hide.” Others found themselves
wanting to “play with the apps or search the web rather than focus on course material.”
The iPad limited one student from learning because all of the apps distracted him/her.
Another simply “lost attention after a while.” Students found it “hard to have a discussion
when attention was focused on the iPad”, and students reported difficulty listening to the
professor while exploring iPad apps. Table 2 includes a list of limitations and
opportunities of using mobile learning in classes.

31
Table 2
2012 Opportunities and Limitations of Mobile Learning (Summary)
Theme Opportunities Limitations
Access and
Availability of
Information
Research
Real world problem solving
Distraction
Undeveloped information literacy
Sharing and
Collaboration
Collaborative learning and
group work
No ownership of
technology/shared resource
Novelty New learning tool
Dynamic learning
environment
Lack of training
Rapidly “outdated” technology
Orientation to technology distracts
from traditional learning time
Learning Styles
and Technology
Design
Design elements include
more learning styles (tactile,
kinesthetic, visual, auditory)
Design elements negatively impact
learning (keyboard, size, app
availability)
Convenience and
Usability
Ease of use
Intuitive design
Variety of apps
Connectivity troubles paralyze
learning
Unstable/unreliable applications
impact learning
Note. Retrieved from “iLearning: The future of higher education? Student perceptions on
learning with mobile tablets”, by J.P. Rossing, W.M. Miller, A.K. Cecil, and S.E.
Stamper, 2012, Journal of the Scholarship of Teaching and Learning, 12(2), p 11.
In conclusion, the study stated that new technologies keep developing at a quick
rate. Guri-Rosenblit (2005) indicated that the human capacity to respond and adapt to the
pace of new technologies is considerably slower and more limited. Therefore, educators
using iPads or other mobile devices in the classroom must be committed and trained to
use them effectively in classroom instruction, and working through the learning curve
related with new technology. When introducing the use of mobile tablets (specifically
iPads) in the classroom, as well as student perceptions of the learning environment should
be done effectively. The interdisciplinary nature of the research teamwork and the
multiple uses of mobile tablets across different teaching styles, subject matter, and

32
student profiles strengthens the observations in the study done by Rossing et al. (2012).
They are not isolated case studies applied to one only classroom, but extensive
observations and visions for the implementation of mobile learning (Guri-Rosenblit,
2005).
Use of mobile devices in higher education
Franklin (2011) conducted a study indicating that mobile technologies are
engaged in many aspects of our lives, including tools that allow online environments
representing 24/7 educational opportunities for learning. These devices allow educators
to build new learning centers, so the students today, can stay connected using smart
phones, iPads, tablets and iPod devices.
Gordon (2015) stated that higher education administrators are facing security
issues, because of the massive growth of mobile devices used in the education that can
cause institution’s data loss. Ghattu (2015) indicated that mobile wireless technologies
(MWT) are transforming the higher education system in the United States. The
incorporation of mobile technology in university classrooms change teaching and
learning process. Today's students are using technology and their mobile devices to
understand, learn, and explore. For example, students nowadays, use their mobile devices
for web browsing, to access their online courses, read emails, read the courses’ material,
and interact with the faculty and their peers. Mobile devices with wireless capabilities
make learning possible instantly anywhere and everywhere, with easy access to
information, offering students a faster way to perform academically.
Ghattu (2015) studied the effects of the integration of mobile wireless
technologies attitudes of future teachers, and results in classrooms learning teacher

33
training. A pretest, and posttest exploratory model, was used to examine the effect of
using this technology in the classroom. Results and learning attitudes of participants were
compared between two kinds of teacher training programs to see if there was a significant
effect on the use of Mobile Wireless Technology (MWT). The results of the study
showed no significant change in the results and attitudes towards the use of MWT
students’ learning. Due to a small sample size, the use of a single intervention limited to
the experiment period; yet, as aforementioned, there were some key significant results in
the study.
As stated by Ghattu (2015), to study the effects of using MWT for classroom
activities, he used undergraduate students studying to be future teachers, enrolled in two
sections of a training course. A section was the control group and the other was the
experimental group using iPads for classroom activities. Data was collected using a
pretest before treatment, and post-test after treatment by using a performance test with the
purpose of investigating learning outcomes, and a survey Likert scale for researching
student’s attitudes. The survey of attitudes was classified and analyzed using four factors:
confidence, anxiety, utility, and formation. Results showed no significant change in
students’ learning outcomes and attitudes towards using MWT. Some of the major
factors for insignificant results for the study were small sample size, use of a single
intervention, and limited period for the experiment. The information obtained from this
study can be the foundation for further researches regarding better ways to use MWT in
teacher education classrooms.

34
Benefits of the use of mobile devices
According to Cisco (2013), the options of mobile network access and the
increasing number of applications available to them have increasingly fascinate users and
organizations. Consequently, mobile device use has extended into the workplace
connecting employees in more ways, more often, and from more locations causing a fine
line between use of work devices and personal ones and between businesses and personal
data. Many employees may think that since work time often blends with personal time,
the company devices should be available for personal use. In addition, the use of mobile
devices helps employees to connect to corporate resources and to work productively at
home, at work, or while traveling, increase productivity, and improve job satisfaction.
Shaffer (2014) indicated that mobile devices are becoming more and more a
reliable way for employees to communicate and share data across networks. More
companies rely on the use of mobile devices by their employees and they are allowing
employees the flexibility to use their mobile devices for work related activities. However,
the decision on whether to provide company owned devices to their employees is still an
issue for many businesses. Use of personal mobile devices, provides benefits such as,
increase in productivity and efficiency to companies, and it becomes a desirable approach
for Information Security and Technology departments. It also helps companies to save
money and technology costs by not investing in mobile devices for employees if they, the
employees, purchase their own devices for business purposes.
Mitrovic, Veljkovic, Whyte, and Thompson (2014) indicated that companies’
employees have rapidly adopted technology advances including tablets, computers, and
smartphones. Employees use their own personal devices to perform various tasks in their

35
workplace, despite the pros and cons this brings to the company. It has had positive
effects for the company such as increased job satisfaction, employee morale, better
productivity, and consumer services.
Phifer (2013) indicated that mobile devices come in different shapes and sizes,
including notebooks, tablets, smartphones, new-breed hybrid convertibles, and detachable
electronics. Advantages of using mobile devices at work include a boost on employees’
efficiency by offering anywhere access to company’s data and systems; it permits rapid
communication, creation and revision of documents; and it allows employees to work
with agility and remotely from their physical assigned area (Phifer, 2013; Kearns, 2016).
Security threats from mobile devices
Cisco (2013) indicated that the use of mobile devices at work raises important
issues in privacy and security of sensitive information. Employees download sensitive
corporate data onto their personal computer or mobile devices, risking that corporate
information to become lost or stolen. An increased number of companies are acquiring
many products and creating policies to protect sensitive data and the network
infrastructure.
Distefano, Grillo, Lentini, and Italiano (2010) indicated “the storage capability of
mobile devices spans between internal memories, removable memories and SIM cards,
the overall amount of sensitive personal and corporate information that can be stored in
those devices can be relevant” (p.1). Furthermore, some storage volumes (e.g., removable
memory cards) are fundamentally less secure than others (e.g., SIM cards). When
compared to wired devices, mobile devices are lacking a number of security features such
as effective anti-malware solutions, and intrusion detection systems. These can be
36
essential when protecting personal and corporate data. Furthermore, the reduced
capabilities of these devices enforce several limitations that needs to be fulfilled in order
to provide effective and appropriate security solutions. For example, the reduced
computing capabilities of mobile devices limit the adoption of proactive anti-malware
solutions such as those based on dynamic analysis (Distefano, Grillo, Lentini & Italiano,
2010).
Cumpston (2014) agreed that for a business, conducting a risk analysis to
determine the appropriate software and hardware could be as important as the products
they produce or services they offer. Safety could have long-term effects on the trust that
customers or users have to the enterprise; this requires procedures to maintain its assets
including data safe and secure from intruders and potential loss. To provide information
on risk assessment, acceptable risk level determined during network design, by
conducting a better assessment of risks, facilitates the ability of a company to determine
how much money is needed to invest in security applications for the networks. This is
beneficial for companies, because instead of spending large amounts of money, they will
be able to balance the need for cybersecurity and funding to provide users a better
service.
Mani et al. (2014) indicated that with the globalization and advancements in
information and communication technology, there are more opportunities for malicious
cyber activities. These activities, affect the security of businesses that are connected to
the Internet throughout cyber-crime, terrorism, and war exploit pre-existing weaknesses,
in their technology. Because the vulnerabilities that exist in the network are legal, they
tend to be disregarded in the debate of cyber security. Guinchard (2011) indicated that
37
when an organization has not conducted a comprehensive analysis of IT risks, there is a
substantial difference in the safety obtained compared with the improvement in safety
when a risk analysis is developed and implemented.
According to Cisco Systems, Inc. (n.d.b.), employees’ behavior is a major
concern, and the high risk factor with regard to corporate security and data protection.
Risk behaviors of employees can, for example, expose confidential data of the company
and contribute to leakage of data across networks. While businesses are becoming more
dependent on mobile devices, employees contribute to the risk in the use of these devices
in terms of their security practices.
Shaffer (2014) indicated that as more companies trust on smartphones and tablets
for use by its employees, the risk of company data being exposed increases, and becomes
a security issue that must be addressed recurrently. Companies are increasingly bringing
to employees the flexibility to use mobile devices for work-related activities; however,
the decision on whether to provide devices owned by the company remains a problem
that many companies face. By allowing employees to use their own personal mobile
devices, companies take the risk that employees’ behavior may contribute to the
possibility of security breaches and data leaks. In addition, applications for mobile
devices are increasingly vulnerable as the attacks continue finding ways to use malware
in mobile applications, frequently downloaded by individuals. By examining security
risks in mobile devices and vulnerabilities through telecommunications, organizations
could provide better training and education for companies and their employees, including
best practices on mobile devices and prototypes security companies use and follow. In
addition, organizations need to create complex security policies that incorporate

38
employee behavior with mobile devices, and monitor and review behaviors to identify
violations of policy and any involvement with loss of data.
Chang, Ho, and Chang (2014) indicated that IT departments are concerned with
personnel bringing their mobile devices to work. Security issues such as mixing personal
data with companies’ data presents security threats to organizations. Since personnel
indicate that they perform better with mobile devices and are not willing to eliminate this
practice, IT departments should enforce the use of two different mobile devices—one that
is for personal use and one that is for professional use. Therefore, it is necessary to
develop company security policies that controls employee’s access to sensitive resources
when using personal devices.
Chang et al. (2014) mentioned that in a study conducted by Webroot to 2,100
people, results showed that 41 percent of the respondents said that they used personal
devices such as smartphones, notebooks, and tablets for work purposes. Furthermore, 70
percent of those smartphones and tablets used for work had only factory security features,
not bothering to add extra security features. In another survey, 98% of the respondents,
that were employers, claimed that they have mobile security policies in the company for
accessing corporate data. Still, employees tend to choose mobile devices because of their
usage instead of security. Malware and device security enforcement, are major security
concerns when using personal mobile devices at work. If these devices are stolen,
company data on the device, presents a great threat for the company. Likewise, if users
mix personal and enterprise data, this could lead to data leakage, especially if company
information is accidentally sent to personal contacts on the device. Known Android
malware samples increased more than 10 times between July 2012 and January 2014.

39
Malware steals personal information, creating a backdoor data leakage for mobile devices
scenarios, even though it might not specifically target companies’ data.
Mitrovic et al. (2014) indicated that allowing employees to utilize their own
device of preference in the workplace brings some risks often associated with the loss of
control over company’s data. There is still a lack of understanding of a number of risks
related to the use of personal mobile devices at work including how to mitigate or
eliminate those risks. Organizations must modify their policies, educate employees, and
tighten information and communication technologies security, to avoid risks such as data
leakage and mobile malware, and other malware attacks that may compromise data
consistency, and potentially cause complete data loss.
Phifer (2013) stated that the use of android devices, iPhones, and iPads during
2013 duplicated nearly twice as many than 2012. This fact actually poses many business
risks for companies, because it could cause the company to lose control over its data
access. It also makes it more difficult to the company determine which devices should be
permitted to access company’s information, data, and systems (internet, e-mails, opens
sources, programs, learning management systems). Kearns (2016) indicated that the use
of mobile devices in business is increasing. Employees are using them for
communications, creating and editing documents, storage and retrieval of data files, and
browsing the Internet. Murtagh (2014) indicated that in 2013, purchases of mobile
devices exceeded personal computers purchases (as cited in Kearens, 2016). While
mobile increases employees’ agility, and allows them to work remotely, the prevalence
and development of these devices creates special threats to the company, because policies
and controls for computers are not sufficiently broad to cover the new threats these

40
devices pose (Kearens, 2016). It is necessary to formulate policies and controls to
address these threats, because mobile devices present new vulnerabilities, and wireless is
covering the traditional wired environment. Hackers have exploited systems and there has
been an increase in the possibility of compromising company’s sensitive files. Most
organizations, have failed to address these security concerns through formal policies, or
create specific controls to reduce threats. Failure to protect personally identifiable
information, may cause the organization great loss and be exposed to fines and other
penalties (Kearens, 2016).
According to Miller, Voas, and Hurlburt (2012), when an employee connects to a
company’s network or machine (wired or wireless) using a personal smartphone or tablet,
it creates a sense of concern regarding security threats. As soon as a personal device
connects to the company’s system, malware could get access to the company’s computer
and its networks. In addition, sensitive data can make its way onto the personal devices,
especially privilege data with customer information that should be kept private, and
company information that should be kept copyrighted. If the device is lost or stolen, the
risk is greater because the information that can be accessed by anyone outside the
company is exposed.
Miller et al. (2012) indicated that less than a physical characteristic makes
personal device normally less secure than laptops, particularly, when the company owns
the devices. Usually they applied its security policies on those machines, requiring
passwords and encrypting sensitive data, on devices owned by the company, not on
personal devices. In 2011, 57% of North American, Asian, and European workers
reported that they selected, and paid for their own smartphones, 51% with their own

41
laptop, 48% with a tablet, and only 16% procured their own desktop computer, but
enforcing security policies are far less likely on machines the company does not own
Miller et al. (2012). The reason these percentages do not add up to 100% is probably
attributable to some subjects owning and buying multiple devices.” Put this after the
words “company does not own. This is a key factor to understanding, why BYOD opens
up a multiplicity of potential security holes. The information migrates to a device that the
company does not control; the data is likewise no longer under control. Not all
organizations let their employees use personal devices for company data, precisely
because of these security and control issues.
Miller et al. (2012) stated that security concerns for mobile devices are a replay of
security issues that arose when laptops were used as a daily device in the work areas. The
difference between laptops and tablets is that the first one are larger than tablets.
Regarding smartphones, these are more prone to be misplaced and less probable to be
noticed when they disappear. In addition, personal devices have grown in number
compared to laptops and netbooks. Another aspect that makes personal devices less
secure than company-owned laptops is that the companies do not have control over them;
therefore, security policies are less likely to be enforced on these devices.
The Association of Records Managers & Administrators (2014) stated that nearly
half of companies that allow employees to connect their devices to a company’s network
have experienced a data breach. Therefore, IT decision makers from the United States,
United Kingdom, and Germany reported that smartphone data security is their number
one concern when employers’ devices are connected to company’s networks. Moreover,
42
people in charge of securing company networks say that the use of personal devices in
the workplace has become their biggest headache.
The Association of Records Managers & Administrators (2014) indicated that
some companies mandate that employees must use company’s approved BlackBerry
smartphones, which come with a securely controlled network. With BlackBerry’s future
undefined and an increasing number of employees requesting to use their iPhones, iPads,
and Android powered devices at work, IT managers have been forced to contemplate
alternatives and to deal with those alternatives’ security threats. Data security
administrators are struggling to monitor delicate information, as employees import data to
their own devices and download mobile apps that have access to corporate assets. Threat
experts warn that these applications have minimum or no safeguards. In addition,
businesses and government agencies are concerned with the use of mobile devices
because many applications fail basic security tests and mobile devices become a crucial
way for attackers to reach the agencies’ network system.
In conclusion, mobile devices are being used worldwide in many scenarios,
especially in educational institutions. More students are bringing their personal mobile
devices to their classrooms. It not only impacts students learning and faculty teaching,
but it also presents challenges to the institutions’ network infrastructure, network
security, technical support, equity issues and classroom disruptions (Santos, 2013).
Organization of the Remainder of the Study
Organization of the remainder of this study will be as follows: (a) Chapter 3 will
discuss the quantitative methodology, instrumentation used to collect data, sample,
validation and reliability of the instrumentation, data analysis and ethical considerations
43
used to determine hypotheses investigation; (b) Chapter 4 will include results of the study
and analysis of the data collected as described in Chapter 3, and; (d) Chapter 5 will
include the summary of the study, discussion, implications of the research, conclusion,
and future recommendations.
44
CHAPTER 3. METHODOLOGY
The researcher collected quantitative data on the use of mobile devices connected
through a wireless network at a post-secondary institution, on the wireless system in a
higher education environment, using IDT and TAM theories. The researcher used three
questionnaires to collect quantitative data. The data collected focused on the use of
mobile devices by students, faculty. and administrative personnel in a higher education
institution’s wireless network. Questions were about the use of mobile devices as a
working or study tool; how they applied to the participants’ working or study style, and
its easiness, compatibleness, effectivity and connectivity. The researcher aimed to
identify how both theories correlate, identify possible treats to a higher education
institution’s network system when using mobiles devices connected to wireless networks,
and possibly come out with strategies to mitigate risks.
According to Buchanan (2011), information and communication technologies are
being increasingly used in education environments. An example of these technologies are
the use of mobile devices. Because of its convenience, flexibility, engagement, and
interactivity, mobile technology is increasing dramatically among college students (Chen
& Denoyelles, 2013). Chen, Seilhamer, Bennett, and Bauer (2015) stated that mobile
technology is ever-present college students’ lives. The ever-growing mobile landscape
enables new learning and teaching opportunities. Chen et al. (2015) indicated that up
until 2015, at least 86% of undergraduate students owned a smartphone, and nearly 47%
owned a tablet. Mobile technology has transformed how students communicate, gather
information, distribute their time and attention, and how they learn. Wainwright (2016)

45
argues that many institutions are allowing students and faculty the use mobile devices
like iPads, Kindle, laptops, etc. in the classroom for a more interactive curriculum. These
devices offer multiple benefits for students’ learning, but it also conveys new pressures
on the institutions’ wireless networks.
Rasmus (2013) stated that there has been intense scientific activity focusing on
what impact information and communications technology (ICT) has on education, and
the factors that facilitate or impede this impact. According to Sevillano-García and
Vázquez-Cano (2015) all these studies agree on that ICT tools and resources may
influence significantly on the teaching-learning processes. Mercier and Higgins (2013)
indicated that ICT suggests that knowledge should stop to be associated to specific
physical spaces and persons, and it should go through concepts of “mobility” and
“ubiquity”. Thorpe and Gordon (2012) argue that these spaces permit the student to
become a digital content-creator, to develop his/her conception of knowledge within an
area of personal learning, and extend it. This trend is reflected in international researches,
for example the study performed in 2012 by the ARD/ZDF (Germany). Eimeren and
Frees (2012) study concluded that mobile devices, specifically tablets and smartphones,
have undergone an important development in Germany; increasing and making access
easier to numerous contents on networks (as cited in Sevillano-García et al., 2015).
Sevillano-Garcia et al. (2015) recommended that risk assessment of threats
associated with wireless monitoring should be done in order to set and develop a plan to
mitigate identified threats. The implementation of technological solutions is one way to
counter wireless security threats and vulnerabilities, making this an important issue.

46
Another way to help IT managers to counter threats associated with the use of wireless
technology is evaluating the institution’s framework with the results of the questionnaire
Use of mobile devices: Safeguarding wireless network in a post-secondary institution
given to students, faculty member and administrative personnel. Another way to help IT
managers to counter threats associated with the use of wireless technology is evaluating
the institution’s framework with the results of the questionnaire created by Lee et al.
(2011), Adding Innovation Diffusion Theory to the Technology Acceptance Model:
Supporting Employees' Intentions to use E-Learning Systems. The following research
questions were examined in this study:
RQ1. How does Compatibility (CPA) relate with the Perceived Usefulness (PU),
Perceived Ease-of-Use (PEU) and Behavioral Intention (BI) reported by the
educational community of an Institution of Higher Education (IHE) who uses
mobile devices connected through the IHE wireless network?
H1a: Effective policies of Compatibility (CPA) have a positive relationship on
Perceived Usefulness (PU) to use wireless services.
RQ2. How does Complexity (CPL) relate with the Perceived Usefulness (PU),
Perceived Ease-of-Use (PEU) and Behavioral Intention (BI) reported by the
educational community of an Institution of Higher Education (IHE) who uses
mobile devices connected through the IHE wireless network?
H2a: Effective policies of Complexity (CPL) have a negative relationship on
Perceived Usefulness (PU) to use wireless services.
RQ3. How does Relative Advantages (ADV) relate with the Perceived Usefulness
(PU), Perceived Ease-of-Use (PEU) and Behavioral Intention (BI) reported by the
47
educational community of an Institution of Higher Education (IHE) who uses
mobile devices connected through the IHE wireless network?
H3a: Effective policies of Relative Advantages (ADV) have a positive
relationship on Perceived Usefulness (PU) to use wireless services.
RQ4. How does Observability (OBS) relate with the Perceived Usefulness (PU),
Perceived Ease-of-Use (PEU) and Behavioral Intention (BI) reported by the
educational community of an Institution of Higher Education (IHE) who uses
mobile devices connected through the IHE wireless network?
H4a: Effective policies of Observability (OBS) have a positive relationship on
Perceived Usefulness (PU) to use wireless services.
RQ5. How does Trialability (TRI) relate with the Perceived Usefulness (PU),
Perceived Ease-of-Use (PEU) and Behavioral Intention (BI) reported by the
educational community of an Institution of Higher Education (IHE) who uses
mobile devices connected through the IHE wireless network?
H5a: Effective policies of Trialability (TRI) have a positive relationship on
Perceived Usefulness (PU) to use wireless services.
Research Design
In this quantitative research, information on the rate of technology adoption by
students, faculty and administrators of a private university in a territory of the United
States was collected. The independent variable and its relation to factors innovation
diffusion theory (IDT) of Davis, (1989) was explored. Perceived usefulness (PU),
Perceived ease-of-use (PEU) and Behavioral intention to use (BI) are constructs of the
IDT model, while relative advantage, compatibility, complexity, trialability, and

48
observability are constructs associated with the technology acceptance model (Davis,
1989). The main effort was to target an audience to interact with the devices. The more
potential users or patrons that test the products with frequent use, the most likely they
will adopt it, and demonstrate their support afterwards. Information about these
constructs was collected through a questionnaire administered by a system of online
surveys. According to Creswell (2009), a quantitative methodology is a research where
the researcher decides what to study, asks specific constricted questions, collects many
data from participants, analyzes these numbers using statistics, and conducts the
investigation in an impartial objective manner. “A quantitative approach may be able to
examine the significance, and to what degree, a relationship may exist between the
dependent and independent variables. This approach is the most appropriate for realizing
the results of this study, through the examination of the associations between variables in
the research question” (Cumpston, 2014, p.33).
Data was collected through a questionnaire approved by the IRB and managed
using EvaluationKit, an online tool used by the post-secondary institution to administrate
electronic questionnaires, such as faculty evaluation and students’ satisfaction surveys.
This tool has a module installed in the distance-learning platform of Blackboard 9.1 used
by the institution. Participants can also answer the questionnaire through a link provided
via e-mail. Among the instructions given to participants, once they accessed the
questionnaire, they would be able to answer the questions, with the option of stop
answering and close the questionnaire when desired.
The EvaluationKit administrator downloaded the anonymous data in CSV file,
and then send it to the researcher. The data collected was analyzed using the SPSS

49
Statistics software, version 23, which was provide hypothesis testing of data obtained
from the single web-based questionnaire with a five point Likert-type scale. For this
study, the significance level was set on α = .05, considering the sample size.
To examine the sociodemographic characteristics of the participants such as age,
gender, and highest education obtained, among others, the researcher calculated the
mean, standard deviation, frequencies and percentage, using SPSS, version 23. To test the
hypothesis of the study, partial least squares structural equation modeling (PLS-SEM)
was used, which examined the measurement model, and to estimate the parameters of the
structural model.
The rationale supporting the selected design was a quantitative research method.
According to Lee et al. (2011), the technology acceptance model (TAM) and innovation
diffusion theory (IDT) are similar in some constructs and complement each other to
examine the adoption of Information System and Information Technology (IS/IT). Rogers
(1995) recommended five core characteristics, arguing that they are conceptually distinct,
supported, and allowed for maximum generality across the perceived attributes. Davis,
Bagozzi, and Warshaw (1989) explained that TAM provides a description of determinants
of technology acceptance that enable explanations of user behavior across an extensive
range of information, technology, and population.
Sample
The target population of this study consisted of students, faculty, and
administrative employees of a higher education institution (HEI). Students connect their
tablets, smartphones, laptops, etc., to the wireless infrastructure at the HEI to access their
e-mail, connect to class, search information on the library database, etc. The faculty uses
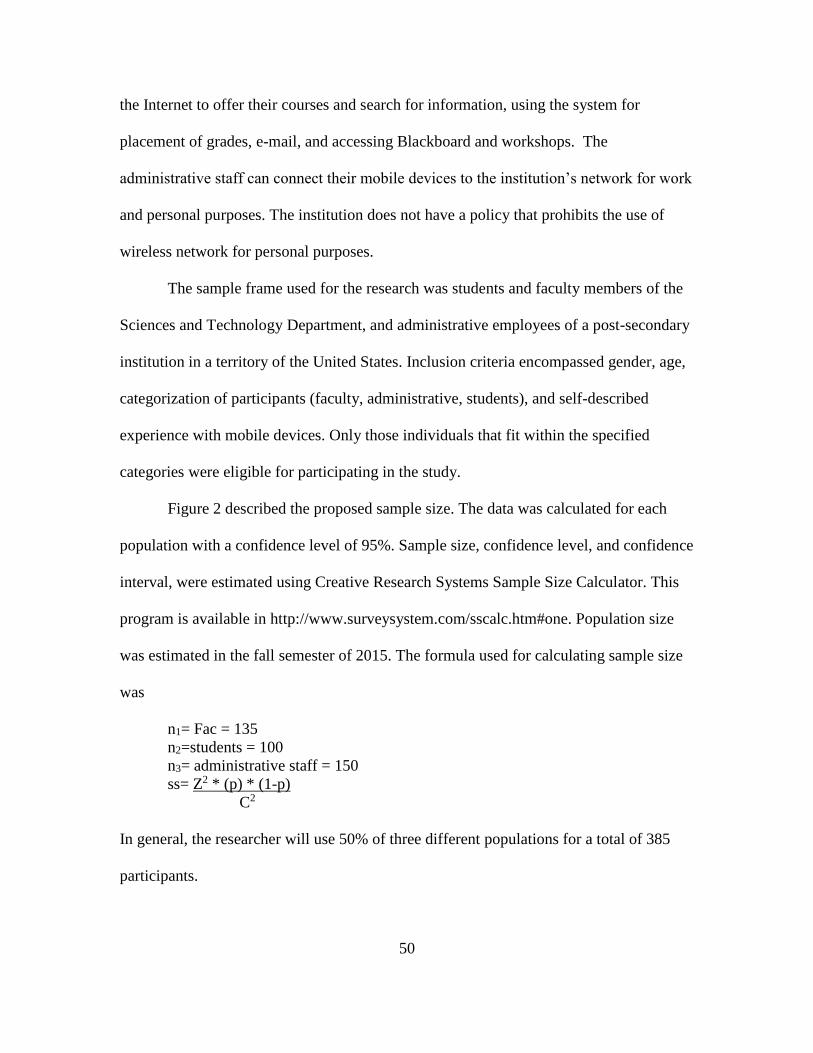
50
the Internet to offer their courses and search for information, using the system for
placement of grades, e-mail, and accessing Blackboard and workshops. The
administrative staff can connect their mobile devices to the institution’s network for work
and personal purposes. The institution does not have a policy that prohibits the use of
wireless network for personal purposes.
The sample frame used for the research was students and faculty members of the
Sciences and Technology Department, and administrative employees of a post-secondary
institution in a territory of the United States. Inclusion criteria encompassed gender, age,
categorization of participants (faculty, administrative, students), and self-described
experience with mobile devices. Only those individuals that fit within the specified
categories were eligible for participating in the study.
Figure 2 described the proposed sample size. The data was calculated for each
population with a confidence level of 95%. Sample size, confidence level, and confidence
interval, were estimated using Creative Research Systems Sample Size Calculator. This
program is available in http://www.surveysystem.com/sscalc.htm#one. Population size
was estimated in the fall semester of 2015. The formula used for calculating sample size
was
n1= Fac = 135
n2=students = 100
n3= administrative staff = 150
ss= Z2 * (p) * (1-p)
C2
In general, the researcher will use 50% of three different populations for a total of 385
participants.

51
Figure 2. Sample size calculation.
Since the researchers’ only have a professional relationship with participants, this
will not impose any type of influence on the volunteers’ participation. The Informed
Consent Form was provided online at the beginning of the survey. All participants needed
to agree before advancing into the survey.
Method
The simple analysis of variance design consisted of random and independent
samples of the dependent variables associated with each of the different levels of
independent variables. With this analysis, the researcher determined if the different levels
of the factor (independent variables) have a significant effect and determine the value of
the dependent variable. That is, the independent variables (relative advantage,
compatibility, complexity, trialability and observability) have, or do not have, a
significant effect on perceived usefulness, perceived ease-of-use, and behavioral
intention.

52
Setting
The setting for this research was a university campus of a nonprofit institution
located in the southern area in a territory of the United States. The campus offers non-
degree certificates, and degrees of associates, bachelors, masters, and a doctorate. At the
time of the study, the population consisted of 300 faculty members, 300 administrative
employees, and an enrollment of 6,098 students.
Sampling Strategy
First, the researcher requested IRB approval from both institutions. After
obtaining authorization by the target institution, the online survey was administered to
students, faculty, and administrative (Staff) using EvaluationKit platform. The
participants were notified via an email programmed in the online survey platform.
EvaluationKit provides secure transmission with at least 128-bit SSL encryption, with all
data transfers executed using the highest security protocol possible, software, and
hardware to protect all data involved in any transaction (EvaluationKit, 2016).
When the collection period finished, the EvaluationKit administrator downloaded
the data in a comma separate value (CSV) file. Then, the researcher exported the data to
the SPSS statistical package to perform the corresponding analysis. For a population of
770 cases, with an alpha=.05 and a power sample = 95%, G*Power calculations required
a minimum of 115 sample size for a bivariate correlation, as showed in Figure 3.

53
Figure 3. Sample size for a bivariate correlation. Reprinted from G*Power 3.1.9.2
For a three group a one-way ANOVA with an alpha = .05 and power of 95%, the
required sample size is 249 cases. The expected sample size is 385 cases. In both cases,
the sampling process surpassed the minimum requirements of 115 for a one-tail bivariate
correlation, and 249 cases for a three group one-way ANOVA.

54
Therefore, the 115 data points shape an appropriate sample for this study, as
demonstrated in Figure 4.
Figure 4. One-way ANOVA with correlation. Reprinted from G*Power 3.1.9.2
Instrumentation and Measures
This quantitative study collected its data using a questionnaire to obtain
information about the use of mobile devices connected to wireless systems. According to
Creswell (2009), when one instrument is modified or combined, an existing one is
necessary to re-establish the validity and reliability during the data analysis. On the other
hand, Rogers (1995) innovation diffusion theory (IDT) has several constructs including
relative advantage, compatibility, complexity, observability, and trialability. Participants
55
were the educational community of a higher education institution comprised of faculty,
non-faculty personnel, and students.
This research used a survey approach to investigate various aspects regarding
mobile devices connected through wireless networks. The survey questionnaire
consisted of two parts. The first section collected data related to the participants’ profile.
The second section contained 28 items to evaluate participants’ attitude towards the use
of mobile devices connected through wireless networks. The 5-points agreement Likert
type scale used was the following: 5 (strongly agree); 4 (agree); 3 (undecided); 2
(disagree); and 1 (strongly disagree).
Data Collection
Data was collected through a questionnaire approved by the IRB and was
managed using EvaluationKit platform. This platform consists of a Blackboard 9.1
module administered in the target post-secondary institution. It is used to create and
administrate electronic questionnaires, such as the evaluation of faculty. The identified
group sample received, by e-mail, an invitation of their selection to participate in this
research, the purpose of the study, the informed consent to participate in the study, and
the instructions for completing the questionnaire. The data collected was sent only to the
investigator, who transferred the data to the application of statistics SPSS. At the end of
the statistical analysis, the data was stored for a period of seven years, encrypted at 128
bit, with a password, in the institutions storage server where the investigation took place.
56
Data Analysis
The data collected was analyzed using the SPSS Statistics software version 23.
For this study, the significance level was set on .05, considering the sample size. The
researcher performed an analysis of the data distributions, and chose the appropriate
statistical analysis according to those distributions. For example, would the data had
complied with normality assumptions (i.e. Kolmogorff test), the researcher would choose
among parametric statistics. If normality test was to fail, the researcher could choose
among non-parametric tests such as Wilcoxon t-test, Mann-Whitney U test or Krustal-
Wallis non-parametric ANOVA. The methodology used to load the data into SPSS was
from an Excel file. Path Analysis was used if the data met the criteria of normality. In
addition, a Cronbach’s alpha analysis was performed to validate the questionnaire’s
reliability.
Validity and Reliability of Questionnaire by Original Authors
The original instrument was used by Lee et al. (2011) to investigate factors
affecting an individual’s behavioral intentions to use the e-learning system by combining
the innovation diffusion theory (IDT) with the technology acceptance model (TAM), by
integrating a theoretical framework by blending TAM and IDT theories. Researchers
combined innovation diffusion theory with the technology acceptance model, to propose
an extended technology acceptance model. The research model included five innovative
characteristics (compatibility, complexity, relative advantage, ability to try, and observe)
to exert an important effect on the individuals’ and their intention to use e-learning
systems (Lee et al., 2011).

57
Two confirmatory factor analyses (CFA) were computed using AMOS 6.0 to test
the measurement models. The model-fit measures used to evaluate the model’s overall
goodness of fit (χ2 /df, GFI, NFI, CFI, RMSEA) and values, as they all exceeded their
respective common acceptance levels (Lee et al., 2011). This showed that the
measurement model displayed a fairly good fit with the collected data.
Lee et al. (2011) indicated that a web-based and mailed survey to collect data for
quantitative testing was used. A non-random sampling technique was used to collect data
from five largest e-learning systems in Taiwan: fifteen firms that provide an e-learning
training system for employees, including finance, manufacturing, information
technology, government agencies, marketing and service businesses, were randomly
selected. From 736 questionnaires were mailed but only 566 were completed and
returned.
Lee et al. (2011) questionnaire consisted of three parts. Part one included 18
items, which were adapted from previous studies based on the IDT model including
compatibility, complexity, relative advantages, observability and trialability to ensure
content validity. Part two of the questionnaire was based on the TAM model, including
PU, PEU, and BI. It contained 12 items. Part three of the questionnaire consisted of
participants’ demographic data.
Lee et al. (2011) tested the endogenous and exogenous measurement models
through a two confirmatory factor analysis. A model-fit measure was used to evaluate the
model’s overall goodness of fit (χ2 /df, GFI, NFI, CFI, RMSEA). Results showed that the
measurement model exhibited a fairly good fit with the collected data (Lee et al., 2011).
For each item, means and standard deviations were determined on a scale of 1 to five, the

58
highest mean was 3.56 for trialability, and the lowest mean was 2.30 for complexity. The
means for PU was 3.79, PEU was 3.73, and 3.62 for behavioral intention 3.62 (Lee, et al.,
2011).
According to Lee et al. (2011), a structural equation modeling technique was used
to test the fit of the research model because of its ability to examine simultaneously a
series of dependence relationships. Fit indices were reviewed with the purpose of
providing evidence on how well there is a fit between the data and the proposed structural
model. A review of feasibility on each path in the model was conducted. Practical
significance was evaluated based on the effect size estimation. In addition, a convergent
validity of scale items was estimated by reliability, composite reliability, and average
variance extracted. Confirmatory factor analyses for all scale items and composite
reliabilities of all the factors surpassed the minimum loading criterion of .70. Average
variance-extracted values were above 0.50. Results indicated that all three conditions for
convergent validity for the four measurement models were met, making this
questionnaire a solid instrument for further studies. (Lee et al., 2011).
Validity and Reliability of Questionnaire for this Study
For this study, the researcher used the Adding Innovation Diffusion Theory to the
Technology Acceptance Model questionnaire created and authorized by Lee et al. (2011).
With the authorization of the original authors, the questionnaire was adapted to
participants’ characteristics. To examine the reliability of the questionnaire, Cronbach’s
alpha and composite reliability analyses were performed. On the other hand, to examine
the validity of the questionnaire, a correlation analysis between latent constructs and the
average variance extracted was performed. To evaluate discriminant validity, outer
59
loading and cross loading of indicators of each construct of the questionnaire (ADV, VI,
CPA, CPL, OBS, PEU, PU, TRI) were evaluated.
Ethical Considerations
According to Cooper and Schindler (2008), ethics considerations are norms or
standards of behavior that guide moral choices about peoples’ conduct and their
relationships with others. The researcher is responsible to design a project that protects all
interviewers, surveyors, experimenters or observers. Ethics covered everything from the
legal and regulatory aspects of our actions, utterances, and behavior to informal
expectations about etiquette, expectations, protocols and norms (Traxler, 2010).
The U.S. Department of Health & Human Services (1979) indicated that no
person involved in a research should influence the decisions of others regarding their
participation in the research. Their consent must be granted freely or entirely voluntary.
Belmont (1979) mentions that the respect for people is divided into two separate moral
requirements: the requirement to acknowledge autonomy and the requirement to protect
those with diminished autonomy. People must have mental or decisive capacity to
understand the information presented to them in order to make an informed decision
regarding them in the study. Nonetheless, not every human being is capable of self-
determination due to illness, mental disability, or circumstances that severely restrict
liberty. It is important that the researcher respects the immature and take into account that
the disabled may require protection as they mature or while they are incapacitated.
Treating people in an ethical manner is done by respecting their decisions, protecting
them from harm, and making efforts to secure their well-being.
60
The U.S. Department of Health & Human Services (1979) stated that “respect for
persons requires that subjects, to the degree that they are capable, be given the
opportunity to choose what shall or shall not happen to them. This opportunity is
provided when adequate standards for informed consent are satisfied” (Informed consent
section, para. 1). Informed consent must include the following: research procedures and
purposes, risks and anticipated benefits, alternative procedures, and a statement offering
the subject the opportunity to ask questions and to withdraw at any time from the
research including how to contact the researcher if any participant has any questions or
doubts about the study. The disclosure must provide the information the person will need
to make a documented decision.
In compliance with the norms and standards, the proposed research was submitted
to the Institutional Review Board (IRB). It considered that the risks associated with this
research were minimal and participants of the investigation would be fully aware of the
subject, purpose, and procedures. Before starting the process of data collection for this
research, the researcher ensured compliance with the protection of human rights, data
confidentiality, informed consent, and disclosure forms.
The data obtained from participants through the questionnaire did not require
personal information that could identify them nor the institution. The researcher did not
have direct access to the database in which data was obtained. The administrator of the
database submitted the information obtained from the questionnaire. Data was
anonymous and aggregated to ensure confidentiality and protect individual’s privacy; the
names of the participants were not accessible to the researcher. Once the answers were
aggregated and reviewed by the researcher, they were stored in an encrypted 128-bit file

61
on a personal computer. The data will be conserved for seven years and then will be
destroyed using the appropriate secure technology.
Organization of the Remainder of the Study
Organization of the remainder of this study will be: Chapter 4 will include results
of the study and analysis of the data collected as described in Chapter 3, and Chapter 5
will include the summary of the study, discussion, implications of the research,
conclusions, and future recommendations.

62
CHAPTER 4. RESULTS
The nature of this research was a non-randomized, non-experimental descriptive
study. The statistical model proposed for the research was descriptive-correlation. The
correlation between the constructs of both theoretical models (TAM vs IDT) was
measured. This analysis is used when the study is exploratory. To analyze the research
model proposed in Chapter 1 (see figure 1), SMART-PLS (Ringle, Wende, & Becker,
2015) a partial least squares based structural equation modeling (PLS-SEM) was used.
PLS-SEM was used since the Shapiro –Wilk and Kolmogorov-Smirnov tests indicated
that scores were not normally distributed. PLS-SEM evaluates the psychometric
properties of the measurement model and estimates the parameters of the structural
model. This tool enables the simultaneous analysis of up to 200 indicator variables,
permitting the examination of multiple latent predictor and criterion variable indicators
simultaneously.
The first part of the questionnaire asked about the participants’ profile. Results
showed that the respondents’ classification was similar: 29% administrative personnel,
37% faculty, and 34% students see figure 5.
Figure 5. Percent of participants.
Administra…
Faculty37%
Students34%

63
More than 50% of the participants were male and 74% of the students were in the
average age of 21-24 years old. The majority of the faculty and administrative personnel
had a master’s degree (Figure 6), 62% percent of the overall respondents had more than
15 years of experience with computers, and 73% had more than five years of experience
using a wireless data network.
Figure 6. Faculty and administrative personnel education.
Results showed that more than 70% of the participants owned a desktop
computer, 87% owned a personal laptop, and 92% of the laptops had wireless
capabilities. From the total of respondents, 92% owned other form of devices with
wireless data capabilities. Table A1 (Appendix A) summarizes the demographic
breakdown of the participants of the study (faculty, administrative, and students).
Bachelor19%
Masters52%
PhD/Ed27%
Post Graduate2%

64
Regarding connection to wireless networks, the study revealed that students
connected more minutes to the wireless network during the week than faculty and
administrative personnel (Figures 7, 8, and 9).
Figure 7. Students connecting to wireless networks (minutes).
Figure 8. Faculty connecting to wireless networks (minutes).
Figure 9. Administrative personnel connecting to wireless networks (minutes).
Less than 0-60 minutes
61-100 minutes
More than 100 minutes
0% 10% 20% 30% 40% 50% 60% 70%
0-60 minutes 61-100 minutes More than 100 minutes
0%
10%
20%
30%
40%
50%
60%
0%
10%
20%
30%
40%
50%
60%
70%
0-60 minutes 61-100 minutes More than 100 minutes
65
The Measurement Model
Table 3 showed reliability results for the instrument used in this study. Data
indicates that measures are robust in terms of their internal consistency reliability as
indexed by the Cronbach’s alpha and the composite reliability. Except for the
observability scale, the other scales registered a Cronbach’s alpha number higher than the
threshold of .70 recommended (DeVellis, 2017; Spector, 1992). Conversely, other
authors indicate that if Cronbach’s alpha is at least .60 (Henerson, Morris, & Fitz-
Gibbon, 1987), it is acceptable in exploratory research like this one. On the other hand,
the composite reliability of the different measures, ranged from .81 to .96, which exceed
the recommended threshold of .70 (Nunnally, 1978). Hair, Hult, Ringle, and Sarstedt
(2017) recommended reporting both criteria when analyzing and assessing the measures’
internal consistency reliability, since true reliability usually lies between Cronbach’s
alpha (representing the lower bound) and the composite reliability (representing the upper
bound). In addition, consistent with the guidelines of Fornell and Larcker (1981), the
average variance extracted (AVE) for each measure exceeded .50, classifying a model as
robust if the value of each construct is over the level of 0.5. Results of testing the
discriminant validity of the measure scales is reported in Table 3. The elements in the
matrix diagonals representing the square roots of the (AVE) in all cases are greater than
the off-diagonal elements in their corresponding row and column, supporting the
discriminant validity of all measure scales.

66
Table 3
Correlation Matrix Between Latent Constructs, Cronbach’s Alpha, Composite Reliability
(CR) and the Average Variance Extracted (AVE)
Construct
α
Chronbac
h
CR AVE CPA CPL ADV OBS TRI PU PEU BI
Compatibility
(CPA) .93 .95 .83 (.91)
Complexity
(CPL) .79 .88 .71
-
.59** (.84)
Relative
Advantages
(ADV) .92 .94 .77 .74**
-
.58** (.88)
Observability
(OBS) .63 .81 .59 .30**
-
.34** .44** (.77)
Trialability
(TRI) .83 .90 .75 .39**
-
.43** .51** .50** (.87)
Perceived
Usefulness
(PU) .94 .96 .89 .66**
-
.50** .87** .42** .48** (.94)
Perceived
Ease-of-Use
(PEU) .82 .89 .73 .56**
-
.66** .70** .36** .50** .66** (.86)
Behavioral
Intention (BI) .95 .96 .87 .68**
-
.56** .74** .37** .50** .71** .66** (.93)
Note: n=313; *p<.05, **p<.01; the elements in the matrix diagonals within parenthesis
represent the square roots of the AVE.
Convergent validity was tested by extracting the factor and cross-loadings of all
indicator items to their representative latent construct. These results, presented in Table 4,
indicated that all items corresponded to their respective construct from a lower bound -
.61 to an upper bound of .96, and higher on their respective construct than any other. The
constructs’ items’ loading and cross-loadings presented in Table 4 confirmed the
convergent validity of these indicators as representing distinct constructs.

67
Table 4
Outer Loadings and Cross-Loadings for the Indicators of Each
Measurement
Indicators ADV BI CPA CPL OBS PEU PU TRI
ADV1 .81 .60 .63 -.59 .36 .61 .68 .35
ADV2 .90 .69 .66 -.54 .43 .62 .75 .47
ADV3 .88 .63 .67 -.46 .34 .60 .76 .43
ADV4 .90 .65 .66 -.46 .40 .60 .83 .48
ADV5 .88 .65 .62 -.49 .38 .62 .80 .48
BI1 .64 .88 .60 -.53 .30 .64 .62 .49
BI2 .69 .94 .68 -.54 .36 .60 .67 .46
BI3 .71 .95 .62 -.50 .37 .60 .70 .46
BI4 .71 .94 .64 -.51 .34 .61 .68 .43
CPA1 .68 .64 .92 -.54 .28 .52 .61 .37
CPA2 .66 .61 .94 -.49 .25 .49 .59 .31
CPA3 .68 .64 .92 -.53 .25 .52 .60 .33
CPA4 .67 .59 .87 -.58 .29 .53 .61 .40
CPL1 -.54 -.53 -.59 .83 -.25 -.54 -.47 -.34
CPL2 -.46 -.39 -.46 .83 -.27 -.49 -.39 -.30
CPL3 -.46 -.48 -.42 .87 -.34 -.61 -.39 -.43
OBS1 .39 .37 .25 -.29 .88 .34 .37 .43
OBS2 .30 .26 .19 -.25 .78 .23 .29 .32
OBS3 .31 .18 .24 -.24 .60 .25 .29 .40
PEU1 .61 .56 .47 -.62 .32 .91 .57 .43
PEU2 .69 .61 .54 -.51 .36 .85 .68 .42
PEU3 .45 .51 .43 -.57 .25 .81 .41 .45
PU1 .82 .66 .62 -.46 .39 .60 .94 .47
PU2 .83 .67 .60 -.46 .40 .61 .96 .46
PU3 .82 .69 .64 -.49 .39 .64 .93 .44
TRI1 .45 .41 .33 -.34 .48 .41 .43 .85
TRI2 .45 .45 .34 -.38 .44 .43 .42 .89
TRI3 .42 .42 .33 -.39 .39 .46 .40 .86
Note: ADV=Relative Advantage, BI=Behavioral Intention,
CPA=Compatibility, CPL= Complexity, OBS= Observability, PEU=
Perceived Ease-of-Use, PU= Perceived Usefulness, TRI= Trialability.

68
Despite the fact that the Fornell-Larcker’s criterion and the examination of cross-
loadings are the dominant approaches for evaluating discriminant validity, Henseler,
Ringle, and Sarstedt (2015) proposed an alternative approach, based on the multitrait-
multimethod matrix to assess discriminant validity. In this approach, the heterotrait-
monotrait ratio (HTMT) of correlations is calculated. The HTMT approach is an estimate
of what the true correlation between two constructs would be if they were perfectly
measured (i.e., if they were perfectly reliable). This true correlation is also referred to as
disattenuated correlation. A disattenuated correlation between two constructs close to 1
indicates a lack of discriminant validity.
Results presented in Table 5 show that none of the correlations reach the
threshold value of .90, suggesting the discriminant validity of the all measures.
Table 5
Heterotrait-Monotrait Ratio (HTMT)
Construct CPA CPL ADV OBS TRI PU PEU BI
Compatibility (CPA)
Complexity (CPL) .68
Relative Advantages (ADV) .80 .68
Observability (OBS) .39 .48 .57
Trialability (TRI) .44 .52 .58 .70
Perceived Usefulness (PU) .71 .57 .89 .54 .55
Perceived Ease-of-Use (PEU) .64 .81 .79 .49 .61 .73
Behavioral Intention (BI) .72 .64 .79 .46 .56 .76 .75
Based on prior researches and their results, Henseler et al. (2015) suggested a
threshold value of .90 if the path model includes constructs that are conceptually very
similar. Therefore, an HTMT value above .90 suggests a lack of discriminant validity.

69
PLS-SEM, however, does not rely on any distributional assumptions and standard
parametric significance tests cannot be applied to test whether HTMT statistic is
significantly different from 1. Instead, researchers have to rely on a procedure called
bootstrapping to derive a distribution of the HTMT statistic. The bootstrapping
procedure derives a confidence interval; a confidence interval containing the value of 1
indicates a lack of discriminant validity. Conversely, if the value of 1 falls outside the
interval’s range, this suggest that the two constructs are empirically distinct. None of the
path models included in their confidence intervals the value of 1, which suggest the
discriminant validity of the measures. Boostrapping was used in this research for
calculating the intervals of confidence and examine if those intervals of confidence
included or not the value 1. None of them intervals included it, thus, the discriminant
validity of the measurement model was established.
The Structural Model
Figure 10 shows the structural model results. In the analysis of the structural
model, the value in each circle represent the R2 of the dependent variables. The values
through the line between each construct show the significant of the path coefficients
among variables. The indicators pointing away from the construct, with their respective
results are illustrated by rectangular boxes (see figure 10). The perceived usefulness
variable obtained the larger R square (R2 = .771), followed by behavioral intention (R2 =
.640), and perceived ease-of-use (R2 = .592). Eight of the 18 hypotheses were significant
and seven of the eight were in a positive direction.

70
Figure 10. Research’s structural model results.
Model Hypotheses
In the structural model, seven different set of hypotheses were analyzed. Table
B1 (see Appendix B) shows the hypotheses relationship of Compatibility (CPA) on
Perceived Usefulness (PU), Perceived ease of use (PEU) and Behavioral Intension (BI).
The relationship of CPA on PU was non-significant, βCPA-PU = .045, p = 490, but was
significant on BI, βCPA-BI = .246, p = .001; on (PEU) was non-significance, βCPA-PEU = -
.016, p = .837. However, the relationship of (CPA) on (BI) was the only statistically
significant.
The hypotheses relationships of Complexity (CPL) on Perceived Usefulness (PU),
Perceived ease of use (PEU) and Behavioral Intension (BI) was non-significant, βCPL-PU =

71
.078, p = .080, βCPL-BI = .052, p = .358; but CPL was significant on PEU, βCPL-PEU = .357,
p = .001.
The Relative Advantage (ADV) on Perceived Usefulness (PU), Perceived ease of
use (PEU) and Behavioral Intension (BI) were positive, βADV-PU = .775, p = .001, βADV-BI
= .157, p = .138; on PEU was positive and significant, βADV-PEU = .434, p = .001. The
relationship between the ADV on PU and PEU was the only statistically significant, p =
.001.
In the case of Observability (OBS) on Perceived Usefulness (PU), Perceived ease
of use (PEU), and Behavioral Intension (BI) were positives, but all non-significant on
βOBS-PU = .031, p = .375, βOBS-BI = .003, p = .941; βOBS-PEU = -.013, p = .782.
However, in the Trialability (TRI) on Perceived Usefulness (PU), Perceived ease
of use (PEU), and Behavioral Intension (BI) were positive, βTRI-PU = .033, p = .434, βTRI-
BI = .102, p = .028; βTRI-PEU = -.142, p = .024.
The Perceived ease of use (PEU) was regress on Perceived Usefulness (PU), and
Behavioral Intension (BI). PEU was positive and non-significant on βPEU-PU = .114, p =
.070, but positive and significant on βPEU-BI = .182, p = .030.
The relationship between Perceived Usefulness (PU), and Behavioral Intension
(BI) was positive and significant, βPU-BI = .222, p =. 043. The conclusion indicates that
hypothesis was: (1) supported, or (2) not supported.

72
Organization of the Remainder of the Study
Organization of the remainder of this study, Chapter 5, will include the summary
of the study, discussion, implications of the research, and conclusions. Future
recommendations are also included in Chapter 5.

73
CHAPTER 5. DISCUSSION, IMPLICATIONS, RECOMMENDATIONS
The researcher investigated the use of mobile devices by students, faculty and
administrative personnel, connected through a wireless network at a post-secondary
institution. This was accomplished at a university site using the innovation diffusion
theory (IDT) and technology acceptance model (TAM) as a background theory. The
researcher aimed to identify the use of mobile devices connected to a wireless network of
a higher education institution, and possibly come out with strategies to mitigate risks.
Statement of the Problem
Every day, new generations of mobile devices are connected to the wireless
network. This produces an increase in risks and security challenges, resulting in more
information transmitted through the application, and consequently an increase of risk in
personal safety. Recent threats, such as malware and viruses, to the security of
information technology have expanded bringing high imminent risk (Zaman et al., 2014).
The researcher, through the investigation, explored protective strategies and
procedures to be implemented in a post-secondary institution because of the risk involved
in transmitting information through mobile devices, like smartphones or tablets. This
issue is relevant for the Information Technology (IT) field, because it is necessary to
promote and provide security in all communication devices like smartphones, due to the
continuous evolution of this equipment, and its use in new developments.
The study was conducted using the instrument: adding innovation diffusion theory
to the technology acceptance model: Supporting Employees' Intentions to use E-Learning

74
Systems. Educational Technology & Society created by Lee et al. (2011). The instrument
included 27 items and 15 demographic questions. The instrument was uploaded online
using Evaluation KIT system. The survey was sent to 320 individuals who were students
of the Department of Computer Sciences, faculty members, and administrative personnel.
Data collected from the survey were (a) the sociodemographic characteristics of the
participants such as: age, gender, highest education obtained, among others; (b) the mean,
(c) standard deviation, (e) frequencies, and (f) percentage which were estimated using the
Statistical Package for the Social Sciences (SPSS) version 23. To test the hypothesis of
the study, partial least squares structural equation modeling (PLS-SEM) was used, which
examined the measurement model and estimated the parameters of the structural model of
Ringle, Wende, and Becker (2015).
Summary of the Results
Using the research survey and the corresponding results, the data provided the
foundation for answering the research questions in Chapter 1. The perceived usefulness
variable obtained the larger R2 square (R2 = .771), followed by behavioral intention (R2 =
.640), and perceived ease-of-use (R2 = .592).
The following research questions were answered on Table 6:
RQ1. How does Compatibility (CPA) relate with the Perceived Usefulness (PU),
Perceived Ease-of-Use (PEU) and Behavioral Intention (BI) reported by the
educational community of an Institution of Higher Education (IHE) who uses
mobile devices connected through the IHE wireless network?
RQ2. How does Complexity (CPL) relate with the Perceived Usefulness (PU),
Perceived Ease-of-Use (PEU) and Behavioral Intention (BI) reported by the

75
educational community of an Institution of Higher Education (IHE) who uses
mobile devices connected through the IHE wireless network?
RQ3. How does Relative Advantages (ADV) relate with the Perceived Usefulness
(PU), Perceived Ease-of-Use (PEU) and Behavioral Intention (BI) reported by the
educational community of an Institution of Higher Education (IHE) who uses
mobile devices connected through the IHE wireless network?
RQ4. How does Observability (OBS) relate with the Perceived Usefulness (PU),
Perceived Ease-of-Use (PEU) and Behavioral Intention (BI) reported by the
educational community of an Institution of Higher Education (IHE) who uses
mobile devices connected through the IHE wireless network?
RQ5. How does Trialability (TRI) relate with the Perceived Usefulness (PU),
Perceived Ease-of-Use (PEU) and Behavioral Intention (BI) reported by the
educational community of an Institution of Higher Education (IHE) who uses
mobile devices connected through the IHE wireless network?
The results of the analyses performed by the researcher revealed that the
variables’ results obtained of eight of the 18 hypotheses were significant, and seven of
the eight were in a positive direction shown in table 6.

76
Table 6
Hypotheses Testing Results
Hypotheses Path Direction Results
H1a CPA-PU Positive Not supported
H1b CPA-PEU Negative Not supported
H1c CPA-BI Positive Supported
H2a CPL-PU Positive Not supported
H2b CPL- PEU Negative Supported
H2c CPL-BI Negative Not supported
H3a ADV-PU Positive Supported
H3b ADV- PEU Positive Supported
H3c ADV-BI Positive Not supported
H4a OB-PU Positive Not supported
H4b OB-PEU Negative Not supported
H4c OB-BI Negative Not supported
H5a TRI-PU Positive Not supported
H5b TRI-PEU Positive Supported
H5c TRI-BI Positive Supported
H6a PEU-PU Positive Not supported
H6b PU-BI Positive Supported
H7a PU-BI Positive Supported
Discussion of the Results
Contrary to Lee et al. (2011) study, compatibility, complexity, trialability and
perceived ease of use had no significant effect on PU. When mobile devices connected
through wireless networks were perceived to be of higher complexity, trialability,
compatibility, and perceived ease of use, employees and students tended to perceived less
usefulness of the mobile devices.
The relative advantages result was consistent with Lee et al. (2011) showing a
significant positive effects on PU. It could be implied that prior to the employees’,
students’ and administrative personnel’s decision to use mobile devices connected

77
through wireless networks, they tended to evaluate whether mobile devices connected
through wireless networks could meet their needs or be relevant to their job. If they
perceived that using mobile devices connected through wireless networks are better than
the devices connected through the LAN, they may perceive connection through wireless
as more useful. Figure 11 demonstrated that 77% of the students thought that using
mobile devices connected through wireless networks enhanced the effectiveness in their
studies. Sixty-seven percent of the faculty and 72% of the administrative personnel
thought that mobile devices enhanced their job effectiveness.
Figure 11. Mobile devices connected to wireless networks enhances effectiveness.
The results of the study demonstrated that observability had significant positive
effects on PU, which were consistent with Lee et al. (2011). The possible reason was that
although the students and personnel could observe other individual’s using mobile
devices connected through wireless networks and had an impression of how to use them,
they did not perceive if mobile devices were less useful in facilitating their job
performance. The results obtained in the study and presented on Figure 12 showed that
84% of the students, 76% of the administrative personnel, and 74% of the faculty
0
10
20
30
40
50
60
70
80
Administrative Faculty Students
Per
cen
t

78
members thought that mobile devices connected to wireless networks increased their
productivity.
Figure 12. Mobile devices connected to wireless networks increase productivity.
Compatibility and observability were consistent with Lee et al. (2011) showing
that they had no significant positive effects on PEU. The less the perceived compatibility
of using mobile devices connected through wireless networks for study and working style
indicated that it is less likely that the future intention of students, faculty and
administrative personnel would adopt it. Furthermore, the less the perceived observability
of using mobile devices connected through wireless networks indicated that it was more
unlikely the present intention of students, faculty and administrative personnel will adopt
it. Figure 13 represented students’ (87%), faculty’s (85%), and administrative personnel
(80%) opinion if mobile devices connected to wireless networks fitted the way they liked
to study or to work. The three groups opinions were similar. The percent of difference
between their perceptions was not significant.
0
10
20
30
40
50
60
70
80
90
Administrative Faculty Students
Per
cen
t

79
Figure 13. Mobile devices connected to wireless networks fits participants’ study and
working styles.
The Complexity (CPL) variable results were consistent with the result of Lee et
al. (2011) showing that the variable had no significant positive effects on PEU. The
greater the perceived complexity of using mobile devices indicated that it was less likely
intended to use them. The results displayed in Figure 14 showed that 86% of the students,
83% of the faculty, and 79% of the administrative personnel understood that mobile
devices connected to wireless networks were easy to use.
Figure 14. Mobile devices connected to wireless networks was easy.
0
10
20
30
40
50
60
70
80
90
Administrative Faculty Students
Per
cen
t
0
10
20
30
40
50
60
70
80
90
Administrative Faculty Students
Per
cen
t
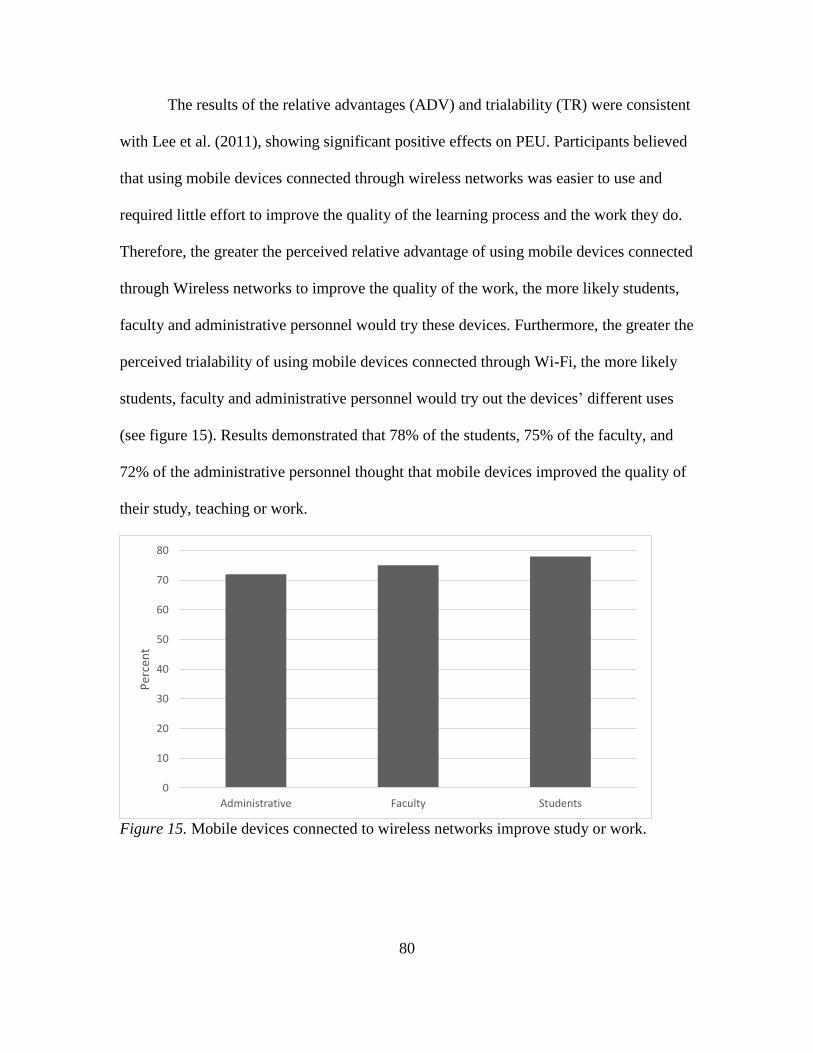
80
The results of the relative advantages (ADV) and trialability (TR) were consistent
with Lee et al. (2011), showing significant positive effects on PEU. Participants believed
that using mobile devices connected through wireless networks was easier to use and
required little effort to improve the quality of the learning process and the work they do.
Therefore, the greater the perceived relative advantage of using mobile devices connected
through Wireless networks to improve the quality of the work, the more likely students,
faculty and administrative personnel would try these devices. Furthermore, the greater the
perceived trialability of using mobile devices connected through Wi-Fi, the more likely
students, faculty and administrative personnel would try out the devices’ different uses
(see figure 15). Results demonstrated that 78% of the students, 75% of the faculty, and
72% of the administrative personnel thought that mobile devices improved the quality of
their study, teaching or work.
Figure 15. Mobile devices connected to wireless networks improve study or work.
0
10
20
30
40
50
60
70
80
Administrative Faculty Students
Per
cen
t
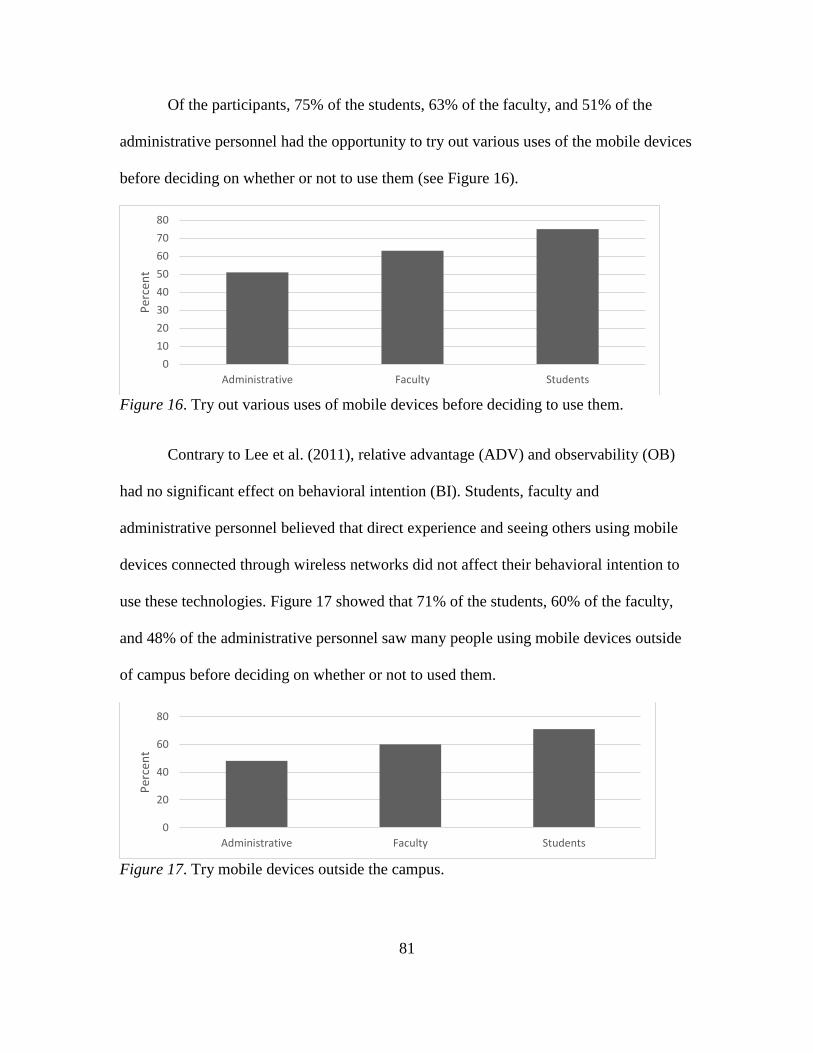
81
Of the participants, 75% of the students, 63% of the faculty, and 51% of the
administrative personnel had the opportunity to try out various uses of the mobile devices
before deciding on whether or not to use them (see Figure 16).
Figure 16. Try out various uses of mobile devices before deciding to use them.
Contrary to Lee et al. (2011), relative advantage (ADV) and observability (OB)
had no significant effect on behavioral intention (BI). Students, faculty and
administrative personnel believed that direct experience and seeing others using mobile
devices connected through wireless networks did not affect their behavioral intention to
use these technologies. Figure 17 showed that 71% of the students, 60% of the faculty,
and 48% of the administrative personnel saw many people using mobile devices outside
of campus before deciding on whether or not to used them.
Figure 17. Try mobile devices outside the campus.
0
10
20
30
40
50
60
70
80
Administrative Faculty Students
Per
cen
t
0
20
40
60
80
Administrative Faculty Students
Per
cen
t
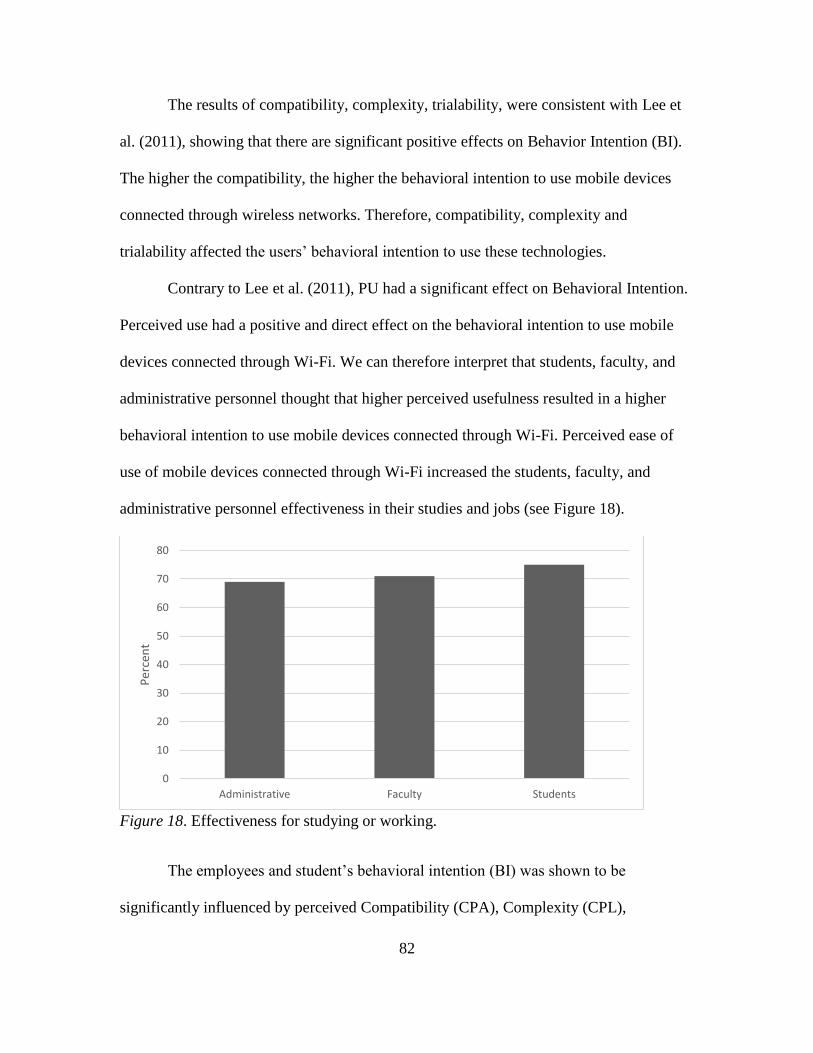
82
The results of compatibility, complexity, trialability, were consistent with Lee et
al. (2011), showing that there are significant positive effects on Behavior Intention (BI).
The higher the compatibility, the higher the behavioral intention to use mobile devices
connected through wireless networks. Therefore, compatibility, complexity and
trialability affected the users’ behavioral intention to use these technologies.
Contrary to Lee et al. (2011), PU had a significant effect on Behavioral Intention.
Perceived use had a positive and direct effect on the behavioral intention to use mobile
devices connected through Wi-Fi. We can therefore interpret that students, faculty, and
administrative personnel thought that higher perceived usefulness resulted in a higher
behavioral intention to use mobile devices connected through Wi-Fi. Perceived ease of
use of mobile devices connected through Wi-Fi increased the students, faculty, and
administrative personnel effectiveness in their studies and jobs (see Figure 18).
Figure 18. Effectiveness for studying or working.
The employees and student’s behavioral intention (BI) was shown to be
significantly influenced by perceived Compatibility (CPA), Complexity (CPL),
0
10
20
30
40
50
60
70
80
Administrative Faculty Students
Per
cen
t

83
Trialability (TRI), and Perceived Usefulness (PU) and towards the use of mobile devices
connected through wireless networks. Meanwhile, Behavioral Intention (BI) had no
significant effect on students, faculty, and administrative personnel’s relative advantage
to use mobile devices connected through wireless networks. As perceived by 55% of the
students, acceptance of innovation did not make learning processes easier throughout the
use of mobile devices. On the contrary, the faculty and the administrative staff considered
that the acceptance of innovation makes their job easier. Meanwhile, students and
employees Perceived Ease-of-Use (PEU) showed not be significantly influenced by the
Complexity (CPL) of mobile devices connected through wireless networks. Students and
employees Perceived Ease-of-Use (PEU) showed to be significant influenced by Relative
Advantage (ADV), and Trialability (TRI). Perceived Usefulness (PU) results showed no
significant effect in the Compatibility (CPA), Complexity (CLP), and Trialability (TRI)
in the use of mobile devices connected to wireless network. Students and employees
perceived usefulness exhibited not to be significantly influenced by perceived ease of use
on mobile devices connected to wireless network. Meanwhile, students and employees’
Perceived Usefulness (PU) was shown to not be significantly influenced by Observing
(OB) the use of mobile devices connected to wireless networks before deciding to use
them. Students and employees Perceived Ease-of-Use (PEU) showed to be not
significantly influenced by Comparability (CPA) and Observability (OB) of mobile
devices connected through wireless networks.
Meneses (2014) stated that some features of WLAN facilitates the incidence of
unintentional threats. For example, an authorized visitor could start a mobile device
without the intention of connecting to the network, but the connection to the WLAN of
84
the company occurs automatically. Thus, the mobile device of the visitor becomes a point
of virus entry into the network. This type of threat only occurs on unprotected WLAN.
Even if the organization does not officially have a WLAN, there is the risk of threats
from non-managed WLAN that can make your appearance in the network. It is now
possible to buy very cheap WLAN hardware, which can introduce unintended
vulnerabilities in the network. There are a number of known strategies that significantly
improve the WLAN security, which consist of very basic configuration tasks, in order to
reinforce the more robust security mechanisms.
Meneses (2014) recommended the following strategies to improve WLAN
security: (a) to consider the use of mechanisms that provide a level of security
appropriate to the user, as well as making use of exploration systems and monitoring
wireless network packets to detect unauthorized use of wireless components; (b) change
the extended service set identification name of the WLAN which is assigned by
manufacturers; (c) change the password assigned by manufacturers; (d) disconnect the
power supply of the authentication protocol when is not in use; (e) deactivate the
broadcasting of the extended service set identification; (f) set a maximum number of
devices that can be connected to the wireless network; (g) deactivate the dynamic host
configuration protocol; (h) enable filtering of the median access control address; (i) use
data encryption protocols; (j) use IEEE 802.1 x-EAP authentication and data encryption;
(k) use a virtual private network and internet protocol security; and (l) use internet
protocol security to protected WLAN traffic. Apart from the level of security provided by
each of these solutions, the basic determining factor depends on the resources needed and
compatibility to implement solutions.

85
Limitations, Suggestions and Implications
The study results and discussion should be viewed as an overview of the security
concerns that need to be addressed related to the use of mobile devices in a postsecondary
institution. The limitations of this research provide the foundation for future research.
This research was conducted under certain assumptions and consequently is subjected to
the following limitations:
1. The limited number of participants; that only included students of the computer
major in one of the nine campuses of the university. As a result, the outcomes of this
study may not be generalizable to other institutions.
2. This study relied on a convenience sample and the availability of participants to
answer the questionnaire that may possibly introduce bias.
3. Participant responses were limited by their perceptions of the use of mobile
devices connected to wireless networks. Preceding studies have shown that user
perceptions change over time as they become more expert (Lee & Song, 2013).
In consequence, this study may not be sufficient, for that reason, the inclusion of
other factors such as the type of data accessed and downloaded on the devices
considering the purposes of doing so, may benefit future research.
Recommendations for Further Study
The research process should be a continuous one. Some recommendations for
further study are suggested:
1. A future study could invite all students, faculty, and administrative personnel
in the campus to participate in this research regarding the use of mobiles

86
devices connected to a wireless network. This study took into account only the
opinion of the students enrolled in the computers major. Other students of
other majors also could be using mobile devices connected to the institution’s
wireless network, and their opinion should be considered.
2. A future research could be conducted in similar institutions in a territory of
the United States or abroad to find out the degree to which the study findings
can be replicated. According to Gordon (2015), the phenomena of mobile
devices is growing in popularity among higher education institutions. A future
research could be conducted to investigate what institutions are doing to
protect their data from hackers, intrusions and unauthorized users from
accessing confidential information, and whether this varies by geographical
and social situations (e.g., public versus private, rural versus urban, etc.).
3. Due to the proliferation of mobile devices on campus, institutions of higher
education are providing ubiquitous and fast Internet access for the multitude
of devices (Campus Technology, 2011). Therefore, securing the institution’s
wireless network properly is important. A future study could be conducted to
investigate what products and techniques are available to secure the wireless
networks based on the type of analysis performed here, but customized for the
specific institution.
4. Another recommendation for future study could be the adoption of biometric
technologies to improve data security on wireless networks.
5. Further studies on continuing changing dynamics of mobile devices by
narrowing down how they are used in the education field could be

87
investigated. This could help higher education institutions’ focus on actual
security breaches.
6. The researcher investigated the use of mobile devices for study, teaching and
working purposes. Future research could consider doing a study regarding
using mobile devices for personal purposes, connected to an institution’s
wireless network, and what are the effects of accessing web pages outside of
the institution.
7. Another area of possible study is researching to explore how the use of mobile
devices affects the educational innovation.
8. A qualitative study (e.g., case study) could be conducted to investigate the
effects of using mobile devices as a learning tool in classroom activities.
9. A study that would be interesting could investigate what challenges higher
education faces with the use of mobile devices (infrastructure, professional
development, courses’ content, strategies, productivity and, instructional
design, guidelines) as working, teaching, and learning tools.
10. Finally, studying the creation of policies for mobile devices that include
access to corporate’s network, how, when, and whom can connect,
authentication, what data can and cannot be accessed, what applications are
allowed and what types of data can be generated on mobile devices would be
appropriate for this field of study.

88
Conclusions
This study was conducted to explore information of vulnerabilities in the use of
mobile devices connected through a wireless network at a post-secondary institution. The
target population of this study was the students, faculty, and administrative employees of
a higher education institution (HEI). The innovation diffusion theory (IDT) and
technology acceptance model (TAM) was used as a background theory. While the merits
of the TAM were demonstrated, the findings of this study provided greater insights when
analyzing users’ acceptance and adoption of the use of mobile devices in wireless
systems in a (IHE). Founded on the supported hypothesis H1c and its positive
significance, this study revealed that students perceive the use of mobile devices as
appropriate for their learning styles, enhances their effectiveness in learning, and enables
them to accomplish their work faster. Faculty and administrative personnel think that
mobile devices connected through wireless networks enable them to accomplish their
work faster, thus improving the quality of their work as shown in the supported and
positive significance of the hypotheses H3a and H3b. For that reason, system developers,
designers, and institutional purchasers should monitor and update the current system in
the use of the wireless systems in a higher education environment whenever the needs of
students, faculty, and employees demand it. This will ensure that the selected systems
effectively meet these demands.
Mobile technology is booming in higher education. Every year, more students and
personnel use their own devices for personal and professional purposes (Stansbury,
2014). Stansbury (2016) indicated that the following issues and challenges that IT
department will face in 2017 are: (a) reduce institutional exposure to information security

89
threats; (b) effectiveness of application of data and predictive analytics to improve
student success and completion; (c) data-informed decision-making; (d) reinforcing the
role of IT leadership as a strategic partner with institutional leadership; (e) improvement
of institutional data management through data standards, integration, protection, and
governance, and (f) collaborating with academic personnel to apply technology to
teaching and learning processes to innovate pedagogy and meet institution’s mission.
Findings of this study suggest that IT (information technology) managers of the
university should consider factors affecting students and employees’ intention towards
the use of mobile devices connected to wireless networks. The results observed on the
effect that relative advantage (ADV) and trialability (TR) have on perceived ease of use
(PEU), were the participants are willing to use mobile devices if they perceived that the
devices are easy to use and they serve their purposes. Wireless networking offers various
opportunities to expand profitability and cut expenses. It additionally changes an
organization’s computer security risk profile. Despite the fact that it is difficult to
thoroughly dispense with all dangers associated with remote wireless networking, it is
possible to accomplish a sensible level of general security by adopting an efficient way to
deal with assessing and overseeing hazards (Sathyavani & Selvi, 2014).
Kearns (2016) stated:
While mobile devices have made it easier for hackers to exploit systems
and increased the possibility of compromising sensitive files, most
organizations have failed to address these security issues through formal
policies or create specific controls to reduce their likelihood. As hackers
engineer increasingly sophisticated attacks organizations must increase

90
their vigilance. Because mobile devices present new vulnerabilities and
wireless is eclipsing the traditional wired environment, it is necessary to
formulate policies and controls to address these threats. (p.36)
The time has shown that wireless networks rely on lines of defense that can
compromise information systems due to the increasing use of mobile devices. This
significant increase brings with it concerns and challenges in the proper management of
controls such as firewalls, intrusion detection systems, and proxy servers. Existing
controls are effective for mobile security but are not enough to handle inappropriate use,
theft and lack of adequate commitment (Kearns, 2016).
According to Poarch, Zimmermann, Grahn, and Cook (2016), the use of mobile
devices in the workplace is increasing and it could result in company’s data loss, security
breaches and regulatory compliance violations. Companies can reduce these risks by
implementing a well-supported mobility and security awareness program. Policies
creation, communication, performing risks assessments, continuous monitoring and
evaluation should be performed by companies, IT department.
Poarch, Zimmermann, Cook, Burback and Wiatrak (2013), recommend that
companies should set the base for securing corporate data, providing safe and productive
access. With the incorporation of well-supported mobility and security programs,
companies can obtain the right balance between security and usability, and leverage the
next generation of consumer technology.

91
REFERENCES
Adams, J. (2007). Risk management: It’s not rocket science... It’s much more
complicated. Risk Management, 54(5), 36-40.
Archidona, M. (2010). Seguridad WIFI: Agresiones posibles (Doctoral dissertation,
Universidad Politécnica de Valencia, España). Retrieved from
https://riunet.upv.es/bitstream/handle/10251/8596/PFC%20-
%20Miguel%20Iniesta%20Archidona.pdf?sequence=1&isAllowed=y
Association of Record Management & Administrator. (2014). BYOD Brings Security
Challenges. Information Management Journal, 48(1), 18.
Buchanan, R. (2011). Paradox, promise and public pedagogy: Implications of the
federal government's digital education revolution. Australian Journal of
Teacher Education, 36(2), 67–78. Retrieved from
http://ro.ecu.edu.au/cgi/viewcontent.cgi?article=1524&context=ajte
Campus Technology. (2011). Building open and secure wireless networks on campus:
4 best practices for wireless lans. Retrieved from
https://webcache.googleusercontent.com/search?q=cache:bxIShJbQtusJ:https://
campustechnology.com/~/media/518FFBF2F26C4A3F9A240ACAE8012581.p
df+&cd=1&hl=en&ct=clnk&gl=us
Chang, J. M., Ho, P., & Chang, T. (2014). Securing BYOD. IT Professional, 16(5), 9-
11. doi:10.1109/MITP.2014.76
Chen, B., & Denoyelles, A. (2013). Exploring students' mobile learning practices in
higher education. Retrieved from

92
http://er.educause.edu/articles/2013/10/exploring-students-mobile-learning-
practices-in-higher-education
Chen, B., Seilhamer, R., Bennett, L., & Bauer, S. (2015). Students' mobile learning
practices in higher education: A multi-year study. Retrieved from
http://er.educause.edu/articles/2015/6/students-mobile-learning-practices-in-
higher-education-a-multiyear-study
Choi, M., Robles, R., Hong, C., & Kim, T. (2008). Wireless network security:
Vulnerabilities, threats and countermeasures. International Journal of
Multimedia and Ubiquitous Engineering, 3(3), 77-86.
Cisco. (2010). The top 3 challenges for wireless networks in 2010. Retrieved from
http://blogs.cisco.com/enterprise/the_top_3_challenges_for_wireless_networks
_in_2010
Cisco. (2013). Cisco mobility solutions for the 21st century university: Higher
education in motion. Retrieved from http://www.cisco.com/c/en/us/
products/collateral/wireless/aironet-1130-ag-series/brochure_c45-
480720.html?mdfid=281235915
Cisco. (2013). Secure network access for personal mobile devices. Retrieved from
http://www.cisco.com/c/dam/en/us/solutions/collateral/enterprise-
networks/secure-access/personal_devices_paper.pdf
Cisco. (n.d.a.). Higher education trends & statistics. Retrieved from
http://www.cisco.com/web/about/ac79/edu/trends/issue01.html
93
Cisco. (n.d.b.). What is a wireless network? Retrieved from
http://www.cisco.com/cisco/web/solutions/small_business/resource_center/artic
les/work_from_anywhere/what_is_a_wireless_network/index.html
Creative Research Systems. (2012). Sample size formulas for our sample size
calculator. Retrieved from http://www.surveysystem.com/sample-size-
formula.htm
Creswell, John W. "Qualitative procedures." Research design: Qualitative,
quantitative, and mixed methods approaches (2009): 173-202.
Cumpston, N. L. (2014). Network risk assessment and the assigned level of accepted
risk (Order No. 3634679). Retrieved from ProQuest Dissertations & Theses
Global. (UMI No. 1614191232).
Davis, F. D. (1989). Perceived usefulness, perceived ease of use, and user acceptance
of information technology. MIS Quarterly, 13(3), 319–340.
Davis, F. D., Bagozzi, R. P., & Warshaw, P. R. (1989). User acceptance of computer
technology: A comparison of two. Management Science, 35(8), 982.
DeVellis, R. F. (2017). Scale development: Theory and applications. Los Angeles, CA:
SAGE Publications, Inc.
Distefano, A., Grillo, A., Lentini, A., & Italiano, G. F. (2010). SecureMyDroid:
Enforcing security in the mobile devices lifecycle. In Proceedings of the Sixth
Annual Workshop on Cyber Security and Information Intelligence Research,
CSIIRW '10, New York, NY, USA. ACM.
Eddy, N. (2014). 10 things to consider before adopting a BYOD program. Eweek, 1.

94
Educause Center for Applied Research (ECAR). (2012). ECAR study of undergraduate
students and information technology. Louisville: CO: Educause Center for
Applied Research. Retrieved from http://net.educause.edu/ir/library/pdf/
ERS1208/ERS1208.pdf
Ellucian. (n.d.). Higher education software. Retrieved from http://www.ellucian.com/
student-information-system
EvaluationKIT. (2016). Online course evaluation and survey software. Retrieved from
http://www.evaluationkit.com/
Fornell, C., & Larcker, D. F. (1981). Evaluating structural equation models with
unobservable variables and measurement error. Journal of Marketing Research
18(1), 39-50.
Franklin, T. (2011). Mobile learning: At the tipping point. Turkish Online Journal of
Educational Technology-TOJET, 10(4), 261-275.
Ghattu, A. (2015). An exploratory study on the impact of mobile wireless technologies
in a teacher education classroom (Order No. 3700616). Retrieved from
ProQuest Dissertations & Theses Global. (UMI No. 1678897523).
Gikas, J., & Grant, M. M. (2013). Mobile computing devices in higher education:
Student perspectives on learning with cellphones, smartphones & social media.
The Internet and Higher Education, 19, 18-26.
Gordon, C. J. (2015). Addressing security risks for mobile devices: What higher
education leaders should know (Order No. 3734181). Retrieved from ProQuest
Dissertations & Theses Global. (UMI No. 1746693303).
95
Guinchard, A. (2011). Between hype and understatement: Reassessing cyber risks as a
security strategy. Journal of Strategic Security, 4(2), 75-96.
doi:http://dx.doi.org/10.5038/1944-0472.4.2.5
Guri-Rosenblit, S. (2005). ‘Distance education’and ‘e-learning’: Not the same
thing. Higher education, 49(4), 467-493.
Hair, J. F., Hult, G. T. M., Ringle, C. M., & Sarstedt, M. (2017). A primer on partial
least squares structural equation modeling (PLS-SEM). Los Angeles, CA:
SAGE Publications, Inc.
Henerson, M. E., Morris, L. L., & Fitz-Gibbon, C. T. (1987). How to measure
attitudes. California: SAGE Publications, Inc.
Henseler, J., Ringle, C. M., & Sarstedt, M. (2015). A new criterion for assessing
discriminant validity in variance-based structural equation modeling. Journal of
the Academy of Marketing Science, 43(1), 115-135.
Ho, C.-Y., Lai, Y.-C., Chen, I.-W., Wang, F.-Y., & Tai, W.-H. (2012). Statistical
analysis of false positives and false negatives from real traffic with intrusion
detection/preventions systems. IEEE Communications Magazine, 50(3), 146-
154.
Holton, E. F. III, & Burnett, M. F. (1997). Quantitative research methods. In R. A.
Swanson & E. F. Holton III (Eds.), Human resource development research
handbook: Linking research and practice, (pp. 65-87). San Francisco: Berrett-
Koehler.

96
Hoo, K. J. S. (2000). How much is enough? A risk management approach to computer
security. Stanford, California: Stanford University.
IEEE Standard for Information Technology. (2012). Telecommunications and
information exchange between systems - local and metropolitan area networks -
specific requirements - part 11: Wireless LAN Medium Access Control (MAC)
and Physical Layer (PHY) Specifications, in IEEE Std 802.11-2007 (Revision
of IEEE Std 802.11-1999), pp.1-1076. doi: 10.1109/IEEESTD.2007.373646
IEEE Standard for Information Technology. (2016). In process: Standards,
amendments, and recommended practices. Retrieved from
http://www.ieee802.org/11/Reports/802.11_Timelines.htm
Karch, K. (2014). An investigation of perceptions about smart mobile phone usage as
an instructional tool in a high school classroom (Order No. 3620696).
Retrieved from Dissertations & Theses @ Capella University. (UMI No.
1540789099).
Kearns, G. S. (2016). Countering mobile device threats: A mobile device security
model. Journal of Forensic & Investigative Accounting, 8(1).
Kharbash, S. Q. (2013). Modeling and analysis of wireless network reliability (Order
No. 3586140). Retrieved from ProQuest Dissertations & Theses Global. (UMI
No. 1513579636).
Kim, J., & Lee, I. (2015). 802.11 WLAN: History and new enabling MIMO techniques
for next generation standards. Communications Magazine, IEEE, 53(3), 134-
140.

97
Kizza, J. M. (2015). Security in Wireless Networks and Devices. In Guide to Computer
Network Security (pp. 391-419). Springer, London.
Kpaduwa, F. I. (2010). Evaluation of residential consumer’s knowledge of wireless
network security and its correlation with identity theft (Order No. 3414560).
Retrieved from ProQuest Dissertations & Theses Global. (UMI No.
733820291).
Lee, J. H., & Song, C. H. (2013). Effects of trust and perceived risk on user acceptance
of a new technology service. Social Behavior and Personality: an international
journal, 41(4), 587-597.
Lee, Y. H., Hsieh, Y. C., & Hsu, C. N. (2011). Adding innovation diffusion theory to
the technology acceptance model: Supporting employees' intentions to use e-
learning systems. Educational Technology & Society, 14(4), 124-137.
Lin, P. P., & Brown, K. F. (2007). Smartphones provide new capabilities for mobile
professionals. The CPA Journal, 77(5), 66.
Liu, A. (2010). Security mechanisms for protecting foundational services in wireless
sensor networks (Order No. 3442667). Retrieved from ProQuest Dissertations
& Theses Global. (UMI No. 853115611).
Lu, Z. (2013). Modeling and evaluating the impact of denial-of-service attacks in
emerging wireless and mobile applications (Order No. 3575788). Retrieved
from ProQuest Dissertations & Theses Global. (UMI No. 1462053549).

98
Mani, D., Kim-Kwang, R., & Mubarak, S. (2014). Information security in the south
Australian real estate industry. Information Management & Computer Security,
22(1), 24-41. doi:http://dx.doi.org/10.1108/IMCS-10-2012-0060
Meneses Angón, E. (2014). Mecanismos y estrategias de seguridad en redes Wi-Fi
(Master’s thesis, Universidad Autónoma del Estado de México, Zumpango,
Estado de México). Retrieved from
http://ri.uaemex.mx/handle/20.500.11799/40492
Mercier, E. M., & Higgins, S. E. (2013). Collaborative learning with multi-touch
technology: Developing adaptive expertise. Learning and Instruction, 25, 13-
23.
Miller, K. W., Voas, J., & Hurlburt, G. F. (2012). BYOD: Security and privacy
considerations. IT Professional, 14(5), 53-55. doi:10.1109/MITP.2012.93
Mitrovic, Z., Veljkovic, I., Whyte, G., & Thompson, K. (2014). Introducing BYOD in
an organization: The risk and customer services viewpoints. Paper presented at
the 1st Namibia Customer Service Awards & Conference.
Motte, J. (2009). Why now is best time for smartphone security work? Retrieved from
http://www.ciozone.com/index.php/Security/Why-Now-Is-Best-Time-For-
Smartphone-Security-Work.html
National Institute of Standards and Technology. (n.d.). Security for wireless networks
and devices. Retrieved from http://itl.nist.gov/lab/bulletns/bltnmar03.htm
Nunnally, J. (1978). Psychometric theory. New York: McGraw-Hill.
99
The Office of Human Research Protections. (n.d.). Defines a descriptive study as “Any
study that is not truly experimental.” Retrieved from http://ori.hhs.gov/
education/products/sdsu/res_des1.htm
Patten, K. P., & Harris, M. A. (2013). The need to address mobile device security in
the higher education IT curriculum. Journal of Information Systems Education,
24(1), 41.
Peng, C. (2013). Cellular network for mobile devices and applications: Infrastructure
limitations and solutions (Order No. 3564305). Available from ProQuest
Dissertations & Theses Global. (UMI No. 1412661448).
Phifer, L. (2013). Bring your own danger. Information Security, 15(1), 29-35.
Poarch, D., Zimmermann, R., Cook, M., Burback, J., & Wiatrak, B. (2013, January).
10 steps to a successful BYOD strategy. Forsythe Focus. Retrieved from
http://focus.forsythe.com/articles/262/10-Steps-to-a-Successful-BYOD-
Strategy
Poarch, D., Zimmermann, R., Grahn, A., & Cook, M. (2016, June). Mobile device
security in the workplace: 5 key risks and a surprising challenge. Forsythe
Focus. Retrieved from http://focus.forsythe.com/articles/55/Mobile-Device-
Security-in-the-Workplace-5-Key-Risks-and-a-Surprising-Challenge
Rasmus, H. (2013). Mobile communication and intermediality. Mobile Media &
Communication, 1, 14-19.
100
Raymond, D. R. (2008). Denial-of-sleep vulnerabilities and defenses in wireless sensor
network MAC protocols (Order No. DP19164). Retrieved from ProQuest
Dissertations & Theses Global. (UMI No. 1020908089).
Ringle, C. M., Wende, S., & Becker, J.-M. (2015). SmartPLS 3 [Computer software].
Retrieved from http://www.smartpls.com
Rogers, E. M. (1995). Diffusion of Innovations (4th ed). New York: Free Press, 15-23.
Rossing, J. P., Miller, W. M., Cecil, A. K., & Stamper, S. E. (2012). iLearning: The
future of higher education? Student perceptions on learning with mobile tablets.
Journal of the Scholarship of Teaching and Learning, 12(2), 1-26.
Santasbury, M. (2014, March 11). INFOGRAPHIC: The rise of mobile technology in
higher education. eCampus News. Retrieved from
http://www.ecampusnews.com/top-news/infographic-mobile-technology-623/
Santasbury, M. (2016, October 27). EDUCAUSE: The top 10 IT issues in 2017.
eCampus News. Retrieved from
http://www.ecampusnews.com/featured/featured-on-ecampus-news/educause-
it-issues/
Santos, I. M. (2013, October). Use of students’ personal mobile devices in the
classroom: Overview of key challenges. Paper presented at the E-Learn: World
conference on e-learning in corporate, government, healthcare, and higher
education, Las Vegas, NV, USA.
Sathyavani, K. S., & Selvi, P. (2014). Wireless network security vulnerabilities, threats
and countermeasures. Paper presented at the International Conference on

101
Information and Image Processing. Retrieved from
http://www.conference.bonfring.org/papers/sankara_iciip2014/iciip89.pdf
Schmidt, M. B. (2006). Development and analysis of a model for assessing perceived
security threats and characteristics of innovating for wireless networks (Order
No. 3238942). Retrieved from ABI/INFORM Global. (UMI No. 305311557).
Sevillano-Garcia, M. L., & Vazquez-Cano, E. (2015). The impact of digital mobile
devices in higher education. Educational Technology & Society, 18(1), 106-
119.
Shaffer, J. (2014). Protecting proprietary data on mobile devices (Order No. 1555805).
Retrieved from ProQuest Dissertations & Theses Global. (UMI No.
1535293525).
Spector, P. E. (1992). Summated rating scale construction: An introduction. Newbury
Park, CA: Sage Publication, Inc.
Stallings, T. J. (2008). Network security in two-year colleges (Order No. 1453497).
Retrieved from ProQuest Dissertations & Theses Global. (UMI No. 89210241).
Su, J. (2010). Considering mobile devices, context awareness, and mobile users (Order
No. NR72304). Retrieved from ProQuest Dissertations & Theses Global. (UMI
No. 869990270).
Sullivan, L. (n.d.). Hypothesis testing - analysis of variance (ANOVA). Retrieved from
http://sphweb.bumc.bu.edu/otlt/MPH-Modules/BS/BS704_HypothesisTesting-
ANOVA/BS704_HypothesisTesting-Anova_print.html

102
Thompson, C. (2014). Hackers target colleges to steal personal data, university
research. Retrieved from http://www.nbcnews.com/tech/security/hackers-
target-colleges-steal-personal-data-university-research-n185866
Thorpe, M., & Gordon, J. (2012). Online learning in the workplace: A hybrid model of
participation in networked, professional learning. Australasian Journal of
Educational Technology, 28(8), 1267-1282.
Traxler, J. (2007). Defining, Discussing and Evaluating Mobile Learning: The moving
finger writes and having writ.... The International Review of Research in Open
and Distributed Learning, 8(2).
U.S. Department of Health & Human Services. (1979). The Belmont report. Retrieved
from http://www.hhs.gov/ohrp/humansubjects/guidance/belmont.html
University of Massachusetts. (2016). Wireless requirements and procedures. Retrieved
from https://www.umb.edu/it/policies/wireless
USA Information Resources Management Association. (2012). E-marketing: Concepts,
methodologies, tools and applications. Hershey, Pennsylvania: IGI Publishing.
Vu, H. T. (2009). Improving security services for wireless networks (Order No.
3375968). Retrieved from ProQuest Dissertations & Theses Global. (UMI No.
305066102).
Wainwright, A. (2016). 7 Tips for School Wireless Networks Implementing BYOD.
Retrieved from http://www.securedgenetworks.com/blog/7-Tips-for-school-
Wireless-Networks-Implementing-BYOD
103
Wedel, C. R., & Michalowicz, A. T. (2015). Recommendations and privacy
requirements for a bring-your-own-device user policy and agreement.
(Master’s thesis, NAVAL Postgraduate School). Retrieved from
http://calhoun.nps.edu/bitstream/handle/10945/45270/15Mar_Wedel_Michalow
icz.pdf?sequence=1&isAllowed=y
West, R. R. (2008). An analysis of faculty perspectives on the theory and practice of
academic freedom (Order No. 3318966). Retrieved from ProQuest
Dissertations & Theses Global. (UMI No. 304608521).
Wong, K., Osman, R. B., Goh, P. C., & Rahmat, M. K. (2013). Understanding student
teachers' behavioral intention to use technology: Technology acceptance Model
(TAM) validation and testing. Online Submission.
Workman, M., Bommer, W. H., & Straub, D. (2008). Security lapses and the omission
of information security measures: A threat control model and empirical test.
Computers in human behavior, 24(6), 2799-2816.
Zahadat, N. (2016). Mobile security: A systems engineering framework for
implementing bring your own device (BYOD) security through the combination
of policy management and technology (Order No. 10024089). Retrieved from
ProQuest Dissertations & Theses Global. (UMI No. 1769079590).
Zaman, M., Ahmad, J., Azhar, M., Nawaz, A., & Abbas, S. (2014). Implementation of
some enhancements in wireless network security by finding vulnerabilities,
threats and attacks. J. Glob. Innov. Agric. Soc. Sci, 2(3), 143-151.

104
Zhu, Z. (2012). Data service analysis, threats and countermeasures in wireless mobile
environments (Order No. 3521279). Retrieved from ProQuest Dissertations &
Theses Global. (UMI No. 1033787525).

105
STATEMENT OF ORIGINAL WORK
Academic Honesty Policy
Capella University’s Academic Honesty Policy (3.01.01) holds learners accountable for
the integrity of work they submit, which includes but is not limited to discussion
postings, assignments, comprehensive exams, and the dissertation or capstone project.
Established in the Policy are the expectations for original work, rationale for the policy,
definition of terms that pertain to academic honesty and original work, and disciplinary
consequences of academic dishonesty. Also stated in the Policy is the expectation that
learners will follow APA rules for citing another person’s ideas or works.
The following standards for original work and definition of plagiarism are discussed in
the Policy:
Learners are expected to be the sole authors of their work and to acknowledge the
authorship of others’ work through proper citation and reference. Use of another
person’s ideas, including another learner’s, without proper reference or citation
constitutes plagiarism and academic dishonesty and is prohibited conduct. (p. 1)
Plagiarism is one example of academic dishonesty. Plagiarism is presenting
someone else’s ideas or work as your own. Plagiarism also includes copying
verbatim or rephrasing ideas without properly acknowledging the source by author,
date, and publication medium. (p. 2)
Capella University’s Research Misconduct Policy (3.03.06) holds learners accountable for
research integrity. What constitutes research misconduct is discussed in the Policy:
Research misconduct includes but is not limited to falsification, fabrication,
plagiarism, misappropriation, or other practices that seriously deviate from those
that are commonly accepted within the academic community for proposing,
conducting, or reviewing research, or in reporting research results. (p. 1)
Learners failing to abide by these policies are subject to consequences, including but not
limited to dismissal or revocation of the degree.

106
Statement of Original Work and Signature
I have read, understood, and abided by Capella University’s Academic Honesty Policy
(3.01.01) and Research Misconduct Policy (3.03.06), including the Policy Statements,
Rationale, and Definitions.
I attest that this dissertation or capstone project is my own work. Where I have used the
ideas or words of others, I have paraphrased, summarized, or used direct quotes following
the guidelines set forth in the APA Publication Manual.
Learner name
and date Héctor L. Feliciano-Torres – February, 2017
Mentor name
and school Dr. José M. Nieves - SOBT

107
APPENDIX A. DEMOGRAPHICS BREAKDOWN
Table A1. Demographics Breakdown
Demographics %
Participants
Administrative 29%
Faculty 37%
Students 34%
Gender: Administrative, Faculty, and Students
Female 48%
Male 52%
No data available 2%
Age: Students
21-24 74%
25-29 14%
30-34 4%
35-39 3%
40-44 1%
45-49 2%
50 + 2%
No data available 1%
Education: Administrative and Faculty
Bachelor 19%
Master 52%
PhD/Ed 27%
Post Graduate 2%
Experience with Computers: Administrative, Faculty, and Students
0-5 years 5%
6-10 years 13%
11-15 years 20%
Greater than 15 years 62%
No data available 2%
Years Using Wireless Data Network: Administrative, Faculty, and Students
Never 5%
1-5 22%
Greater than 5 73%
No data available 1%
Owner of Desktop Computers: Administrative, Faculty, and Students
Yes 71%
No 29%
No data available 1%
Owner of Personal Laptop: Administrative, Faculty, and Students
Yes 87%
No 11%
No data available 2%
Personal Laptops with Wireless Capabilities: Administrative, Faculty, and Students
Yes 92%
No 6%
No data available 2%
continued

108
Table A1 (continued)
Demographics %
Owner of Other Form of Devices with Wireless Data Capabilities: Administrative, Faculty, and
Students
Yes 92%
No 5%
No data available 3%
How Many Times do you Connect to the Wireless Network during the Working Week:
Administrative
Less than 0-30 times 77%
More than 31 times 23%
How Many Times do you Connect to the Wireless Network during the College Week: Faculty
Less than 0-30 times 74%
More than 31 times 26%
How Many Times do you Connect to the Wireless Network during the College Week: Students
Less than 0-30 times 84%
More than 31 times 16%
How Many Minutes Long do you Connect to the Wireless Network during the Working Week:
Administrative
Less than 0-60 minutes 58%
61-100 minutes 9%
More than 100 minutes 33%
How Many Minutes Long do you Connect to the Wireless Network during the College Week:
Faculty
Less than 0-60 minutes 51%
61-100 minutes 21%
More than 100 minutes 28%
How Many Minutes Long do you Connect to the Wireless Network during the College Week:
Students
Less than 0-60 minutes 62%
61-100 minutes 19%
More than 100 minutes 19%

109
APPENDIX B. HYPOTHESES CONCLUSIONS
Table B1 Hypotheses Conclusions
Hypotheses Outcomes Conclusion
Hypothesis 1
H1a: Effective policies of
Compatibility (CPA) has a positive
relationship on Perceived
Usefulness (PU) to use wireless
services.
Beta=.045, p=.490,
Non Significance
Not Supported
H1b: Effective policies of
Compatibility (CPA) has a positive
relationship on Perceived ease-of-
use (PEU) to use wireless services.
Beta=-.016, p=.837,
Non Significance
Not Supported
H1c: Effective policies of
Compatibility (CPA) has a positive
relationship on Behavioral Intention
(BI) to use using wireless services.
Beta=.246, p=.001, Significance Supported
Hypothesis 2
H2a: Effective policies of
Complexity (CPL) has a negative
relationship on Perceived
Usefulness (PU) to use wireless
services.
Beta=.078, p=.080,
Non Significance
Not Supported
H2b: Effective policies of
Complexity (CPL) has a negative
relationship on Perceived ease-of-
use (PEU) to use wireless services.
Beta=-.357, p=.001
Significance
Supported
H2c: Effective policies of
Complexity (CPL) has a negative
relationship on Behavioral Intention
(BI) to use wireless services.
Beta=-.052, p=.385,
Non Significance
Not Supported
Hypothesis 3
H3a: Effective policies of Relative
Advantages (ADV) has a positive
relationship on Perceived
Usefulness (PU) to use wireless
services.
Beta=.775, p=.001
Significance
Supported
H3b: Effective policies of Relative
Advantages (ADV) has a positive
relationship on Perceived ease-of-
use (PEU) to use wireless services.
Beta=.434, p=.001
Significance
Supported
H3c: Effective policies of Relative
Advantages (ADV) has a positive
relationship on Behavioral Intention
(BI) to use wireless services.
Beta=.157, p=.138,
Non Significance
Not Supported
continued
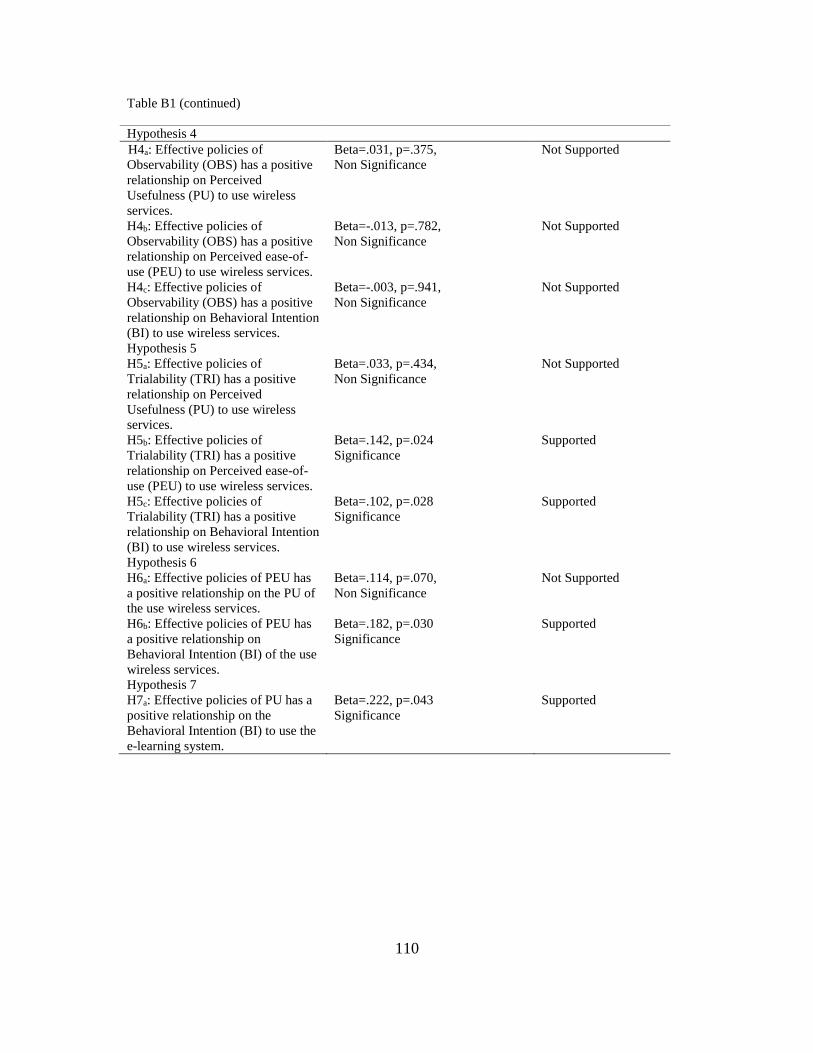
110
Table B1 (continued)
Hypothesis 4
H4a: Effective policies of
Observability (OBS) has a positive
relationship on Perceived
Usefulness (PU) to use wireless
services.
Beta=.031, p=.375,
Non Significance
Not Supported
H4b: Effective policies of
Observability (OBS) has a positive
relationship on Perceived ease-of-
use (PEU) to use wireless services.
Beta=-.013, p=.782,
Non Significance
Not Supported
H4c: Effective policies of
Observability (OBS) has a positive
relationship on Behavioral Intention
(BI) to use wireless services.
Beta=-.003, p=.941,
Non Significance
Not Supported
Hypothesis 5
H5a: Effective policies of
Trialability (TRI) has a positive
relationship on Perceived
Usefulness (PU) to use wireless
services.
Beta=.033, p=.434,
Non Significance
Not Supported
H5b: Effective policies of
Trialability (TRI) has a positive
relationship on Perceived ease-of-
use (PEU) to use wireless services.
Beta=.142, p=.024
Significance
Supported
H5c: Effective policies of
Trialability (TRI) has a positive
relationship on Behavioral Intention
(BI) to use wireless services.
Beta=.102, p=.028
Significance
Supported
Hypothesis 6
H6a: Effective policies of PEU has
a positive relationship on the PU of
the use wireless services.
Beta=.114, p=.070,
Non Significance
Not Supported
H6b: Effective policies of PEU has
a positive relationship on
Behavioral Intention (BI) of the use
wireless services.
Beta=.182, p=.030
Significance
Supported
Hypothesis 7
H7a: Effective policies of PU has a
positive relationship on the
Behavioral Intention (BI) to use the
e-learning system.
Beta=.222, p=.043
Significance
Supported