using meis to probe segregation effects in bimetallic nanoparticles chris baddeley eastchem school...
TRANSCRIPT

Using MEIS to probe segregation effects in bimetallic nanoparticles
Chris BaddeleyEaStCHEM School of Chemistry
University of St Andrews
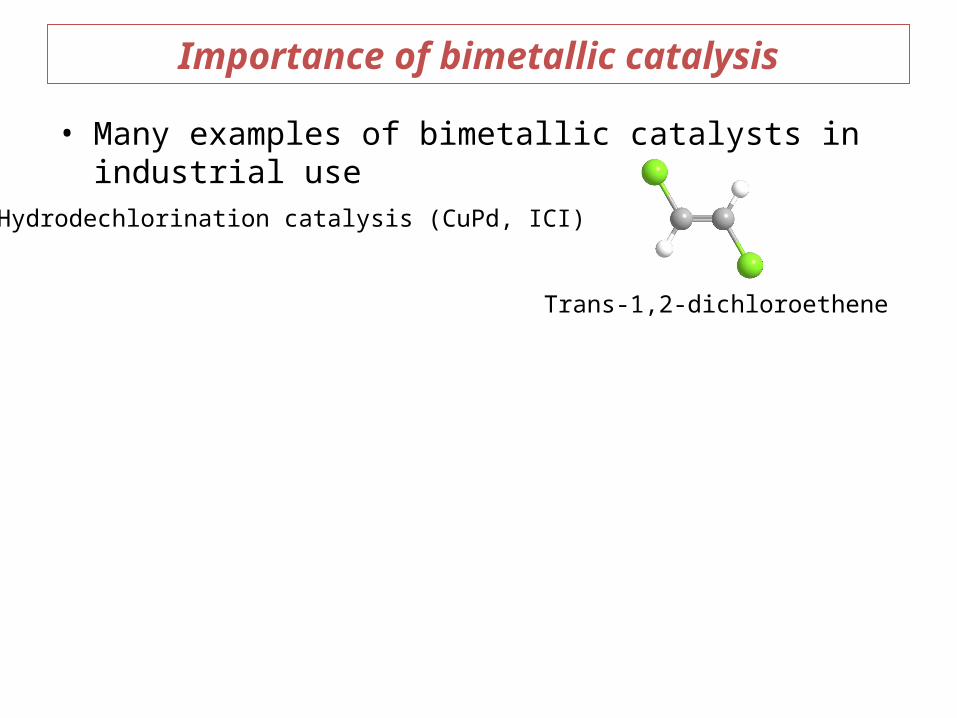
• Many examples of bimetallic catalysts in industrial use
Importance of bimetallic catalysis
Hydrodechlorination catalysis (CuPd, ICI)
Trans-1,2-dichloroethene
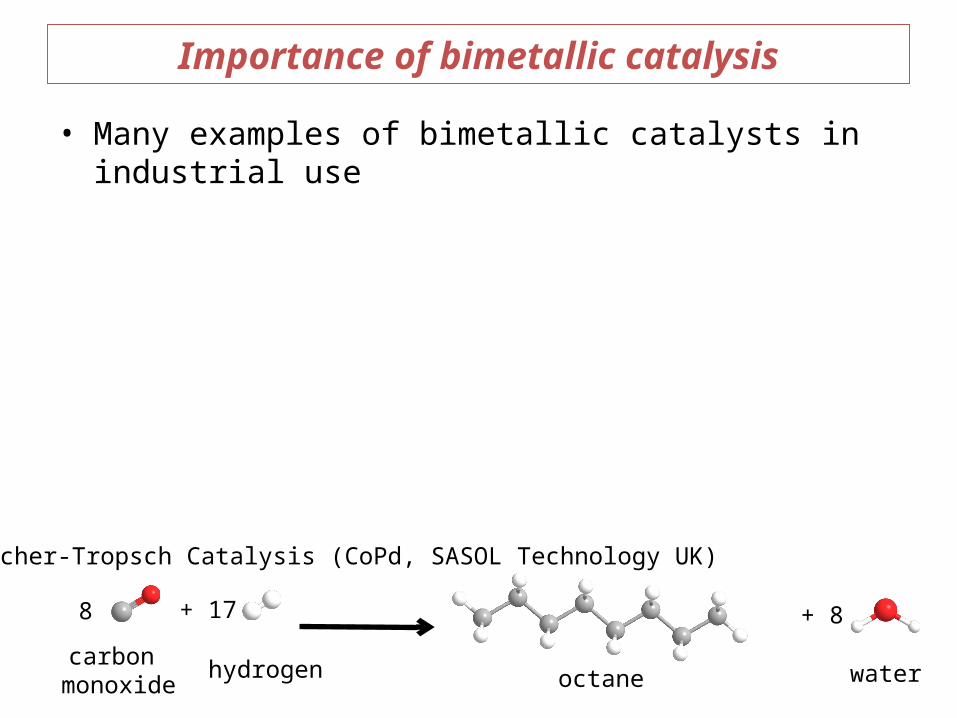
• Many examples of bimetallic catalysts in industrial use
Importance of bimetallic catalysis
carbon monoxide
hydrogen octane water
8 + 17 + 8
Fischer-Tropsch Catalysis (CoPd, SASOL Technology UK)
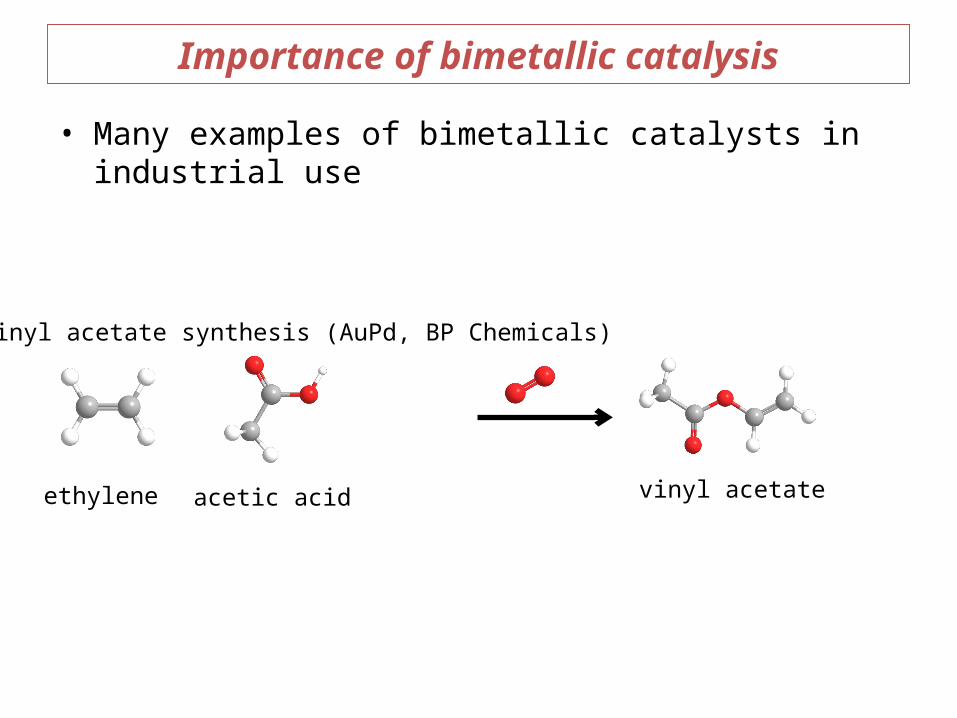
• Many examples of bimetallic catalysts in industrial use
Importance of bimetallic catalysis
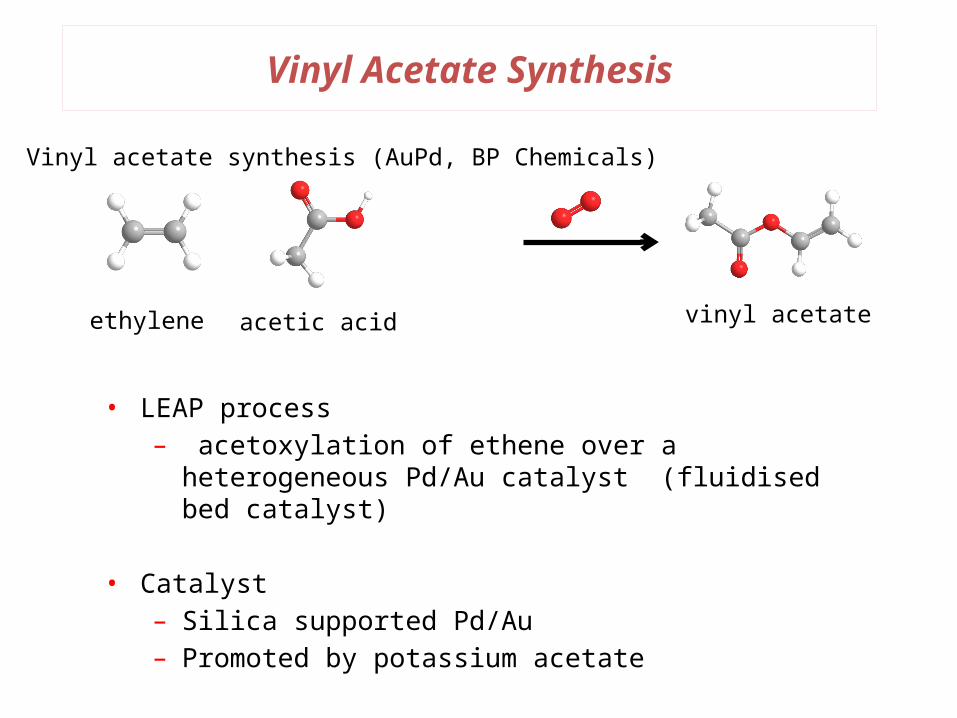
Vinyl acetate synthesis (AuPd, BP Chemicals)
ethylene acetic acid vinyl acetate
Vinyl acetate synthesis (AuPd, BP Chemicals)
ethylene acetic acid vinyl acetate
Vinyl Acetate Synthesis
• LEAP process– acetoxylation of ethene over a heterogeneous Pd/Au
catalyst (fluidised bed catalyst)
• Catalyst– Silica supported Pd/Au– Promoted by potassium acetate
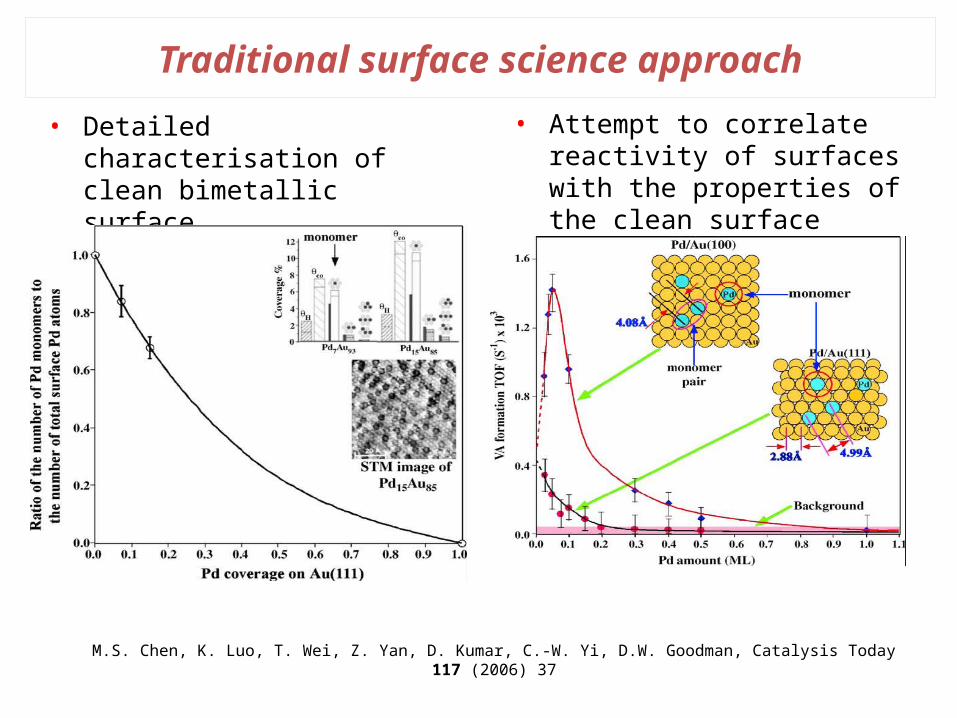
Traditional surface science approach
• Detailed characterisation of clean bimetallic surface
• Attempt to correlate reactivity of surfaces with the properties of the clean surface
M.S. Chen, K. Luo, T. Wei, Z. Yan, D. Kumar, C.-W. Yi, D.W. Goodman, Catalysis Today 117 (2006) 37
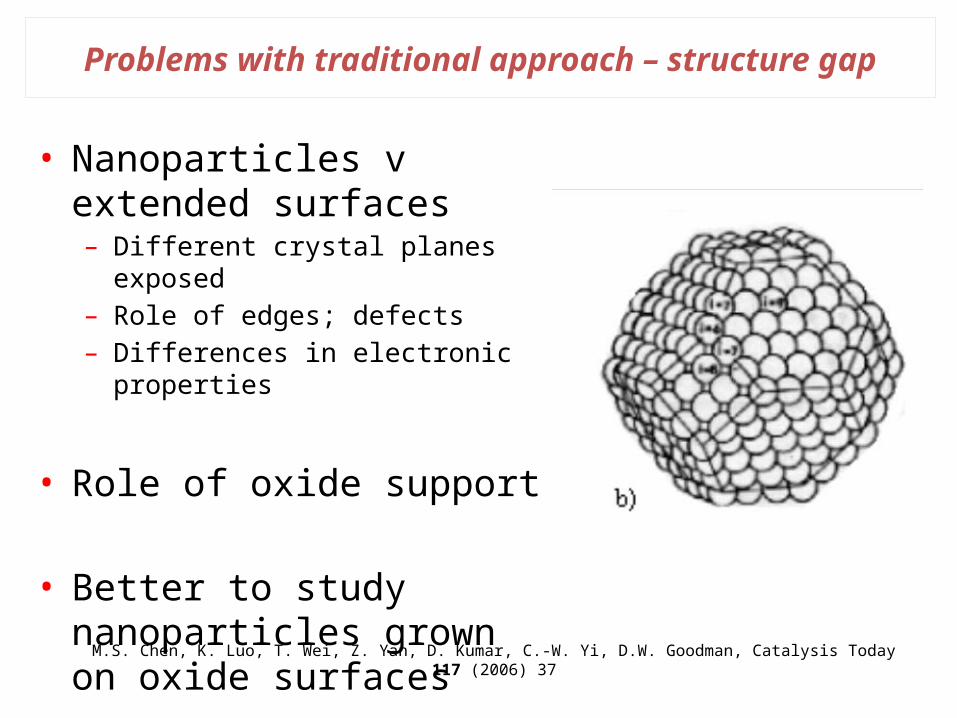
Problems with traditional approach – structure gap
• Nanoparticles v extended surfaces– Different crystal planes exposed– Role of edges; defects– Differences in electronic properties
• Role of oxide support
• Better to study nanoparticles grown on oxide surfaces
M.S. Chen, K. Luo, T. Wei, Z. Yan, D. Kumar, C.-W. Yi, D.W. Goodman, Catalysis Today 117 (2006) 37
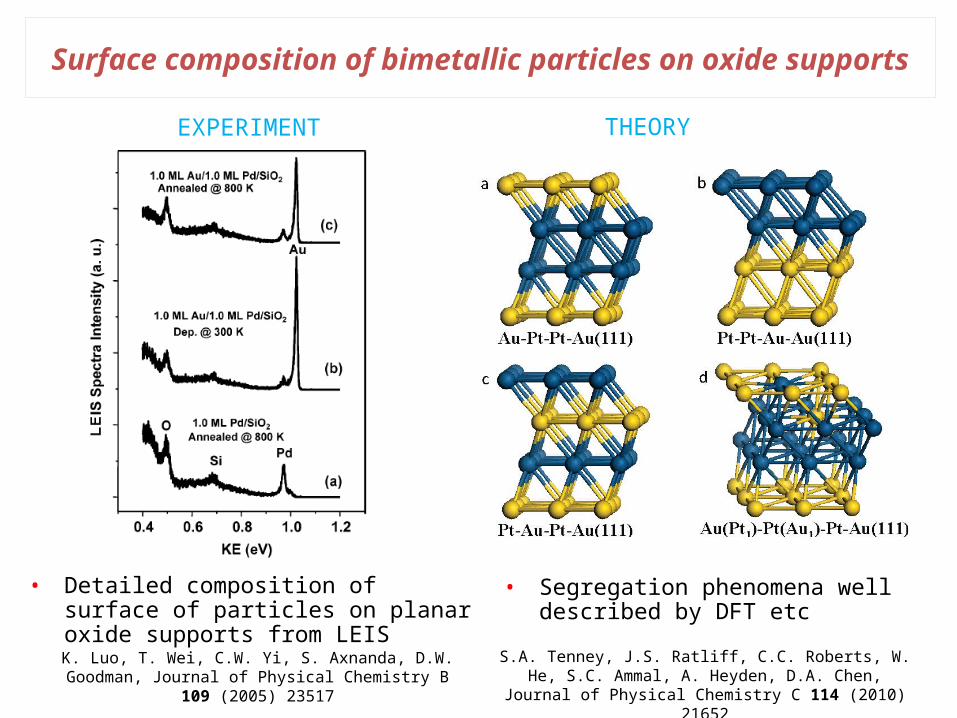
Surface composition of bimetallic particles on oxide supports
• Detailed composition of surface of particles on planar oxide supports from LEIS
K. Luo, T. Wei, C.W. Yi, S. Axnanda, D.W. Goodman, Journal of Physical Chemistry B 109 (2005) 23517
EXPERIMENT THEORY
S.A. Tenney, J.S. Ratliff, C.C. Roberts, W. He, S.C. Ammal, A. Heyden, D.A. Chen, Journal of Physical Chemistry C 114 (2010)
21652
• Segregation phenomena well described by DFT etc
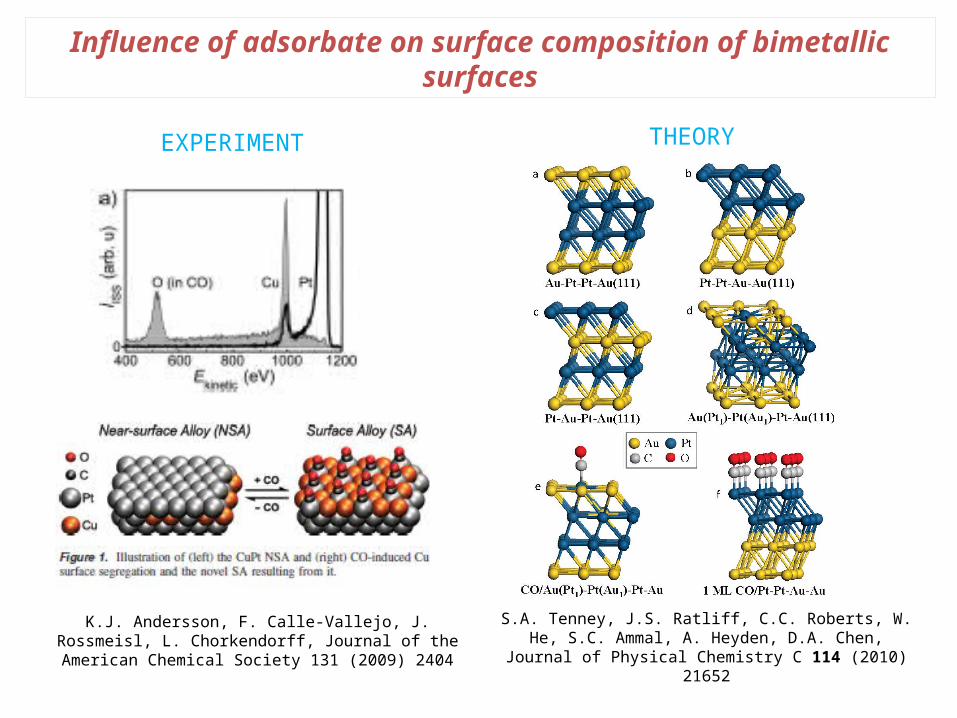
Influence of adsorbate on surface composition of bimetallic surfaces
THEORY
S.A. Tenney, J.S. Ratliff, C.C. Roberts, W. He, S.C. Ammal, A. Heyden, D.A. Chen, Journal of Physical Chemistry C 114 (2010)
21652
K.J. Andersson, F. Calle-Vallejo, J. Rossmeisl, L. Chorkendorff, Journal of the American Chemical Society 131 (2009) 2404
EXPERIMENT
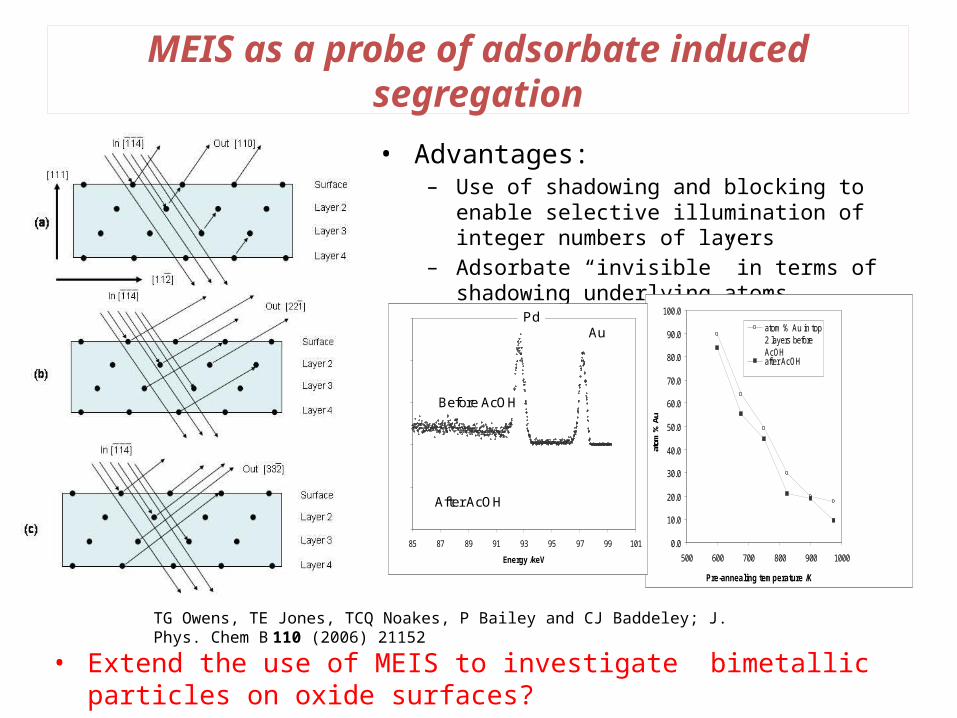
MEIS as a probe of adsorbate induced segregation
• Advantages
• Advantages:– Use of shadowing and blocking to enable selective
illumination of integer numbers of layers– Adsorbate “invisible” in terms of shadowing
underlying atoms
• Extend the use of MEIS to investigate bimetallic particles on oxide surfaces?
0.0
10.0
20.0
30.0
40.0
50.0
60.0
70.0
80.0
90.0
100.0
500 600 700 800 900 1000
Pre-annealing temperature /K
atom
% A
u
atom % Au in top2 layers beforeAcOHafter AcOH
0
50
100
150
200
250
85 87 89 91 93 95 97 99 101
Energy /keV
Before AcOH
After AcOH
AuPd
TG Owens, TE Jones, TCQ Noakes, P Bailey and CJ Baddeley; J. Phys. Chem B 110 (2006) 21152
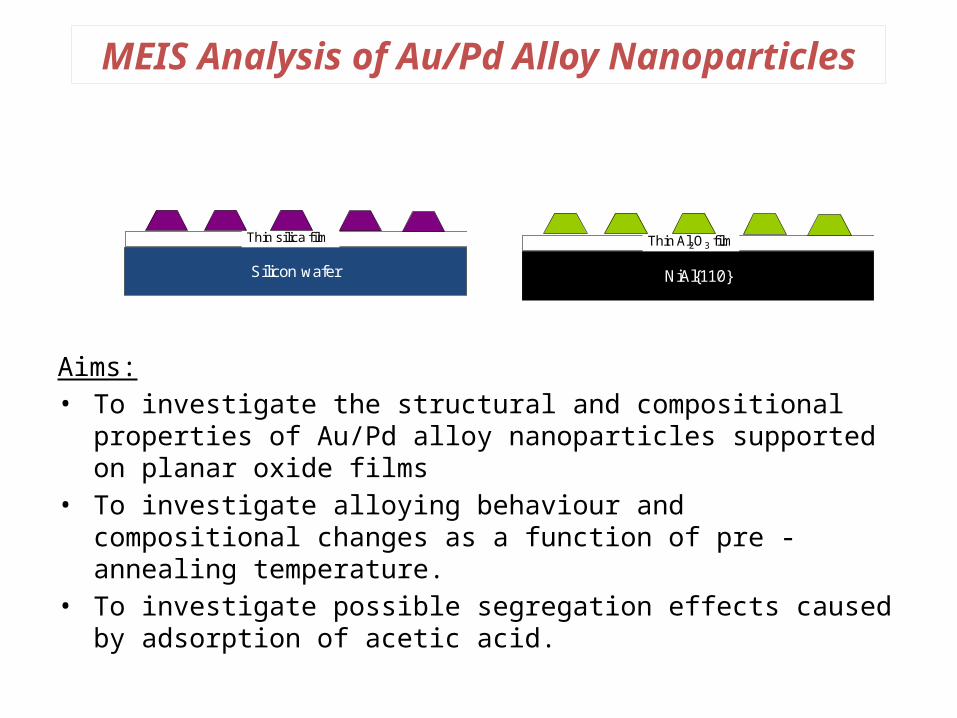
MEIS Analysis of Au/Pd Alloy Nanoparticles
Aims:• To investigate the structural and compositional properties of Au/Pd alloy
nanoparticles supported on planar oxide films• To investigate alloying behaviour and compositional changes as a function
of pre - annealing temperature.• To investigate possible segregation effects caused by adsorption of acetic
acid.
Silicon wafer
Thin silica film
NiAl{110}
Thin Al2O3 film
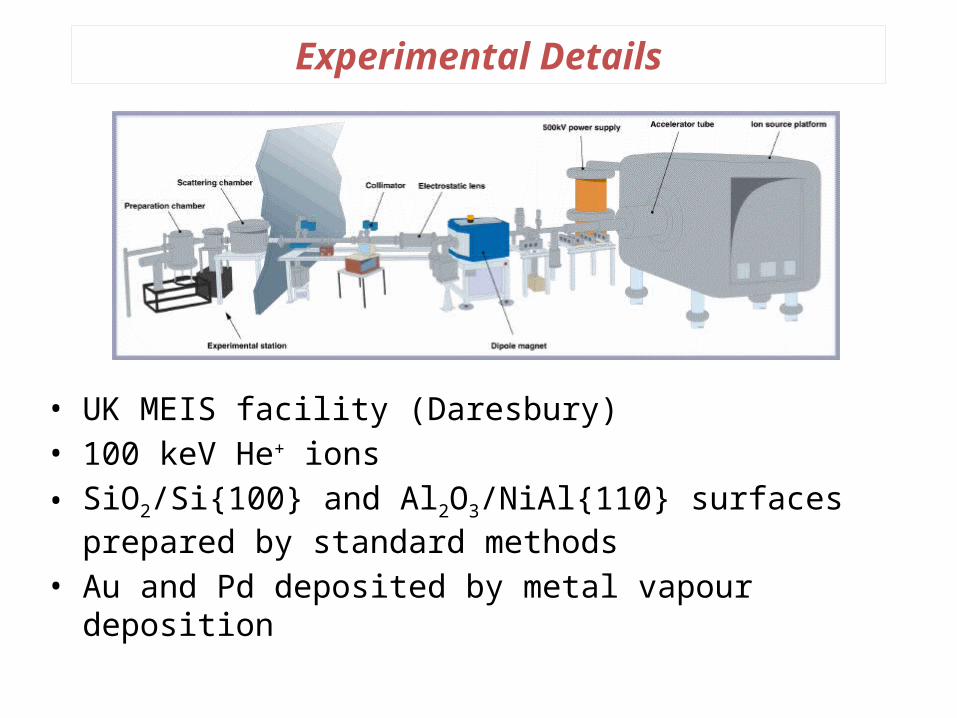
Experimental Details
• UK MEIS facility (Daresbury)• 100 keV He+ ions• SiO2/Si{100} and Al2O3/NiAl{110} surfaces prepared by
standard methods• Au and Pd deposited by metal vapour deposition
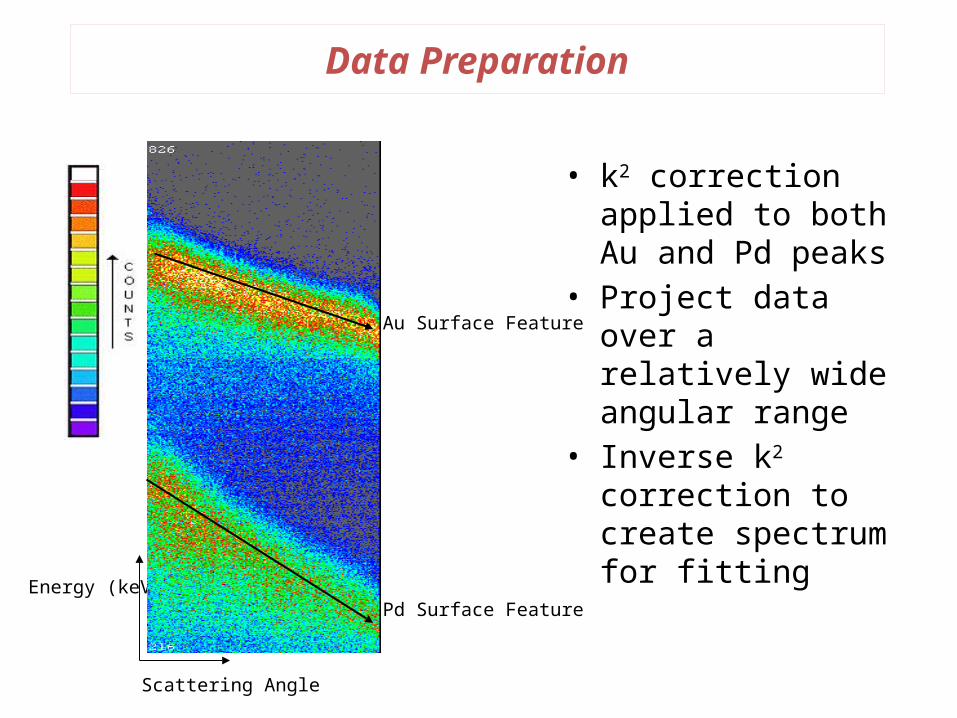
Data Preparation
Scattering Angle
Energy (keV)
Au Surface Feature
Pd Surface Feature
• k2 correction applied to both Au and Pd peaks
• Project data over a relatively wide angular range
• Inverse k2 correction to create spectrum for fitting
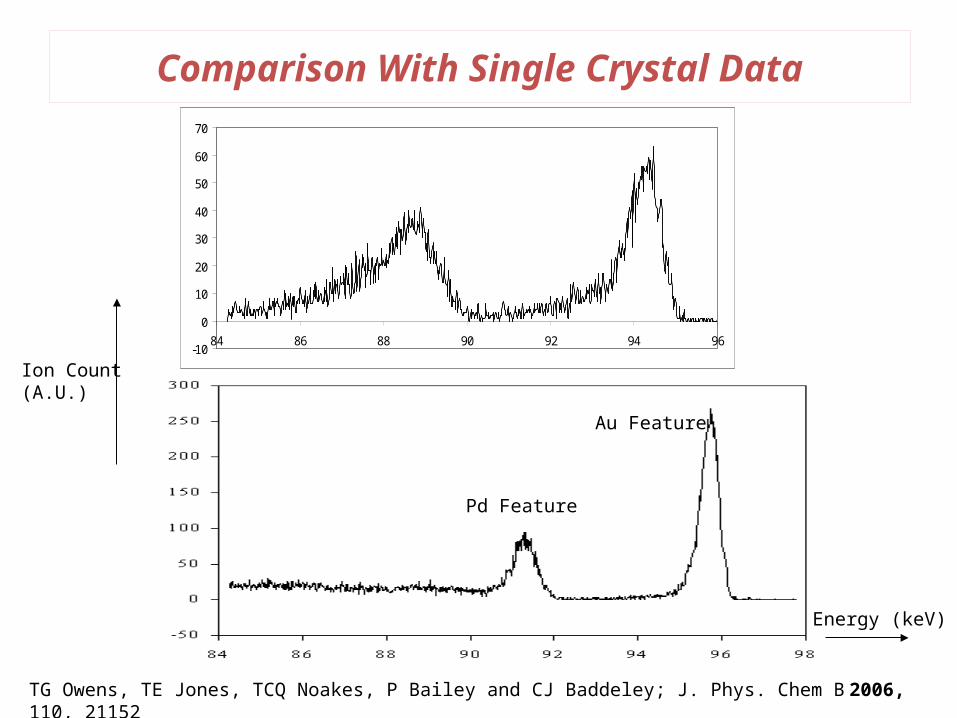
Comparison With Single Crystal Data
-10
0
10
20
30
40
50
60
70
84 86 88 90 92 94 96
Ion Count(A.U.)
Energy (keV)
Pd Feature
Au Feature
Pd Feature
Au Feature
TG Owens, TE Jones, TCQ Noakes, P Bailey and CJ Baddeley; J. Phys. Chem B 2006, 110, 21152
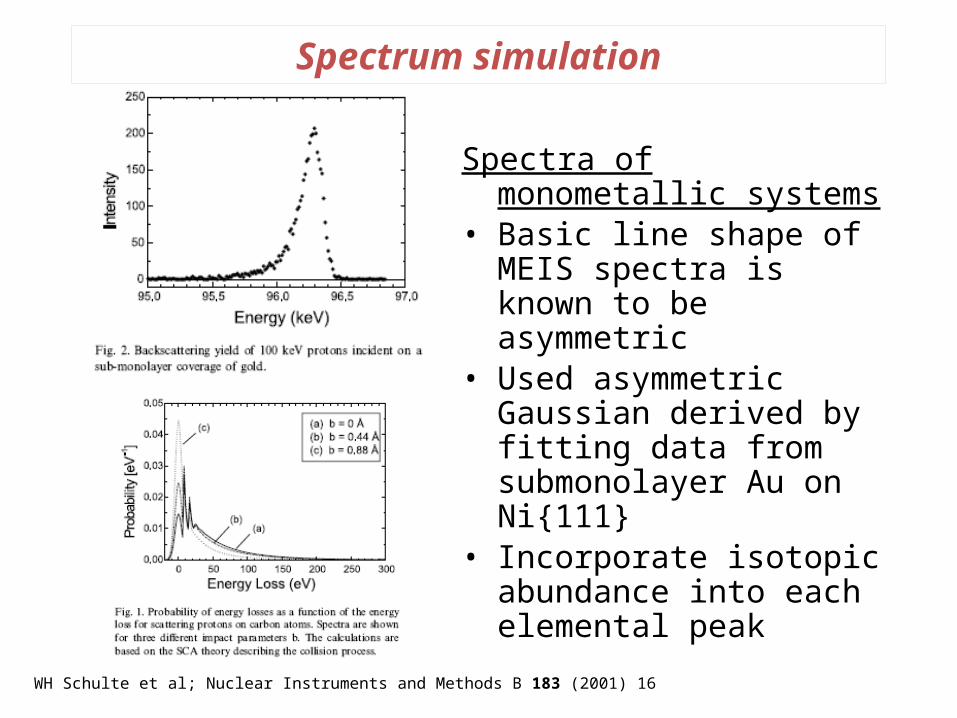
Spectrum simulation
Spectra of monometallic systems• Basic line shape of MEIS
spectra is known to be asymmetric
• Used asymmetric Gaussian derived by fitting data from submonolayer Au on Ni{111}
• Incorporate isotopic abundance into each elemental peak
WH Schulte et al; Nuclear Instruments and Methods B 183 (2001) 16
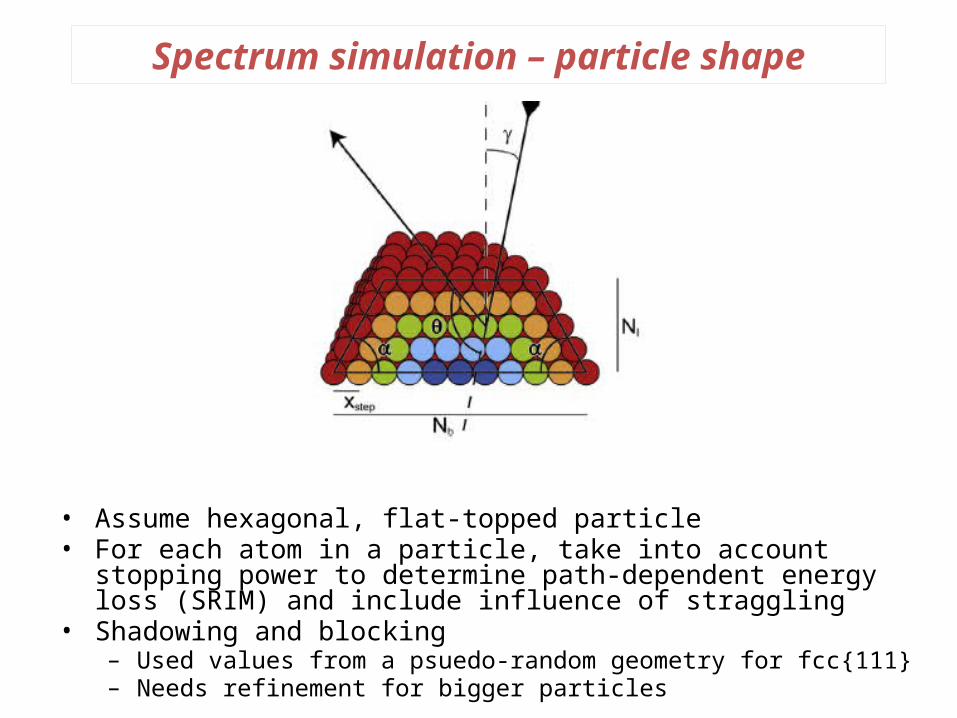
Spectrum simulation – particle shape
• Assume hexagonal, flat-topped particle• For each atom in a particle, take into account stopping power to determine
path-dependent energy loss (SRIM) and include influence of straggling• Shadowing and blocking
– Used values from a psuedo-random geometry for fcc{111}– Needs refinement for bigger particles
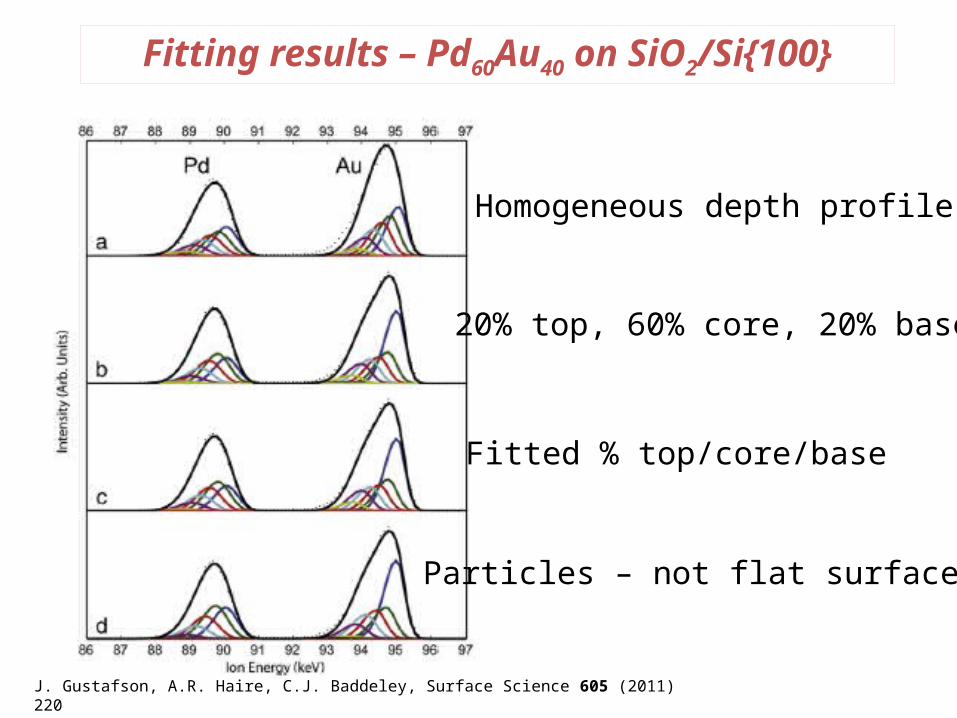
Fitting results – Pd60Au40 on SiO2/Si{100}
Homogeneous depth profile
20% top, 60% core, 20% base
Fitted % top/core/base
Particles – not flat surface
J. Gustafson, A.R. Haire, C.J. Baddeley, Surface Science 605 (2011) 220
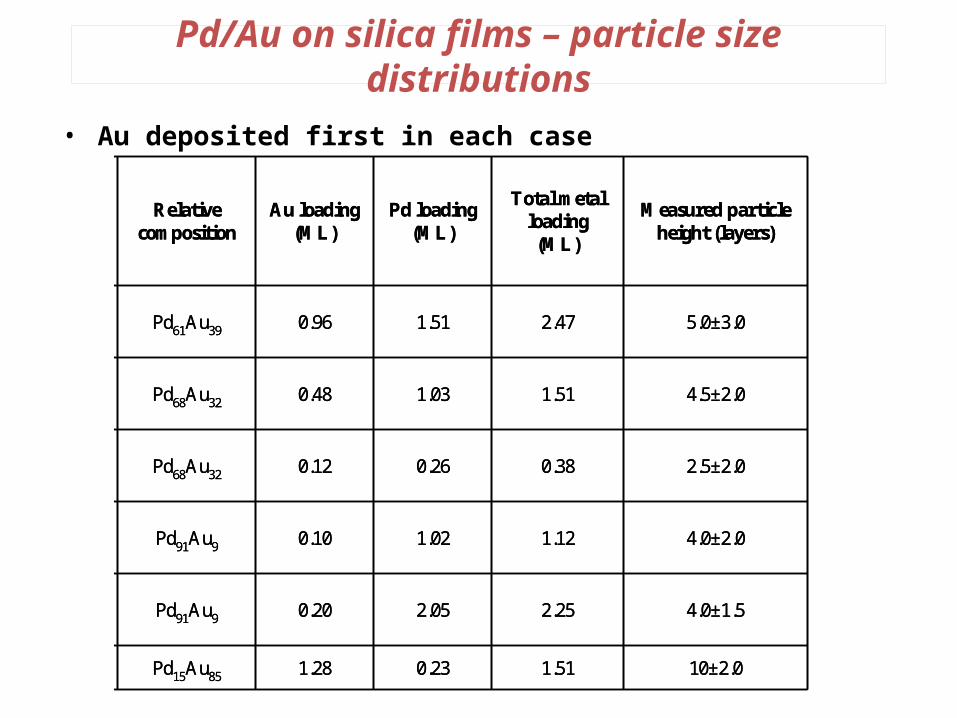
Pd/Au on silica films – particle size distributions
• Au deposited first in each case
SampleRelative
composition Au loading
(ML)Pd loading
(ML)
Total metal loading (ML)
Measured particle height (layers)
1a (fig. 1a) Pd61Au39 0.96 1.51 2.47 5.0±3.0
1b (fig. 1b) Pd68Au32 0.48 1.03 1.51 4.5±2.0
1c (fig. 1c) Pd68Au32 0.12 0.26 0.38 2.5±2.0
2a (fig. 2a) Pd91Au9 0.10 1.02 1.12 4.0±2.0
2b (fig. 2b) Pd91Au9 0.20 2.05 2.25 4.0±1.5
3 Pd15Au85 1.28 0.23 1.51 10±2.0

Results – AuPd composition as a function of annealing temperature
Assume Overbury relationship between surface and bulk comp:xB
s/xAs = xB
b/xAb exp [0.16 (DHsub A – DHsub B)/RT]
DHsub Pd 377 kJmol-1 DHsub Au 368 kJmol-1
S.H. Overbury, P.A. Bertrand, G.A. Somorjai, Chemical Reviews 75 (1975) 547
10
20
30
40
50
60
70
300 400 500 600 700 800 900
Annealing Temperature /K
% A
u co
mpo
sitio
n
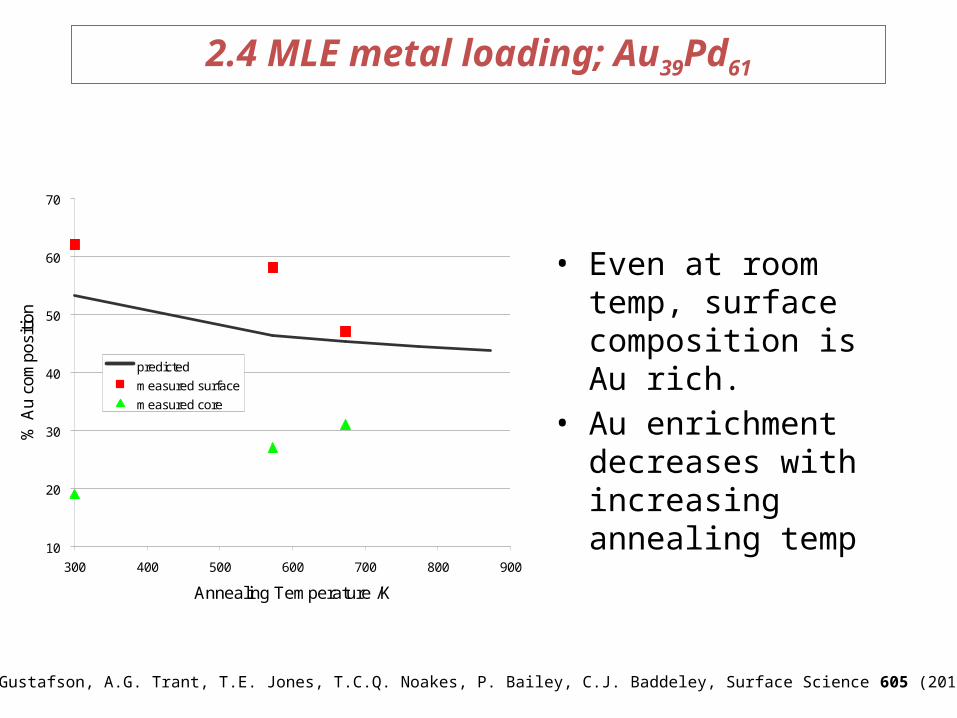
• Even at room temp, surface composition is Au rich.
• Au enrichment decreases with increasing annealing temp
10
20
30
40
50
60
70
300 400 500 600 700 800 900
predicted
measured surface
measured core
2.4 MLE metal loading; Au39Pd61
A.R. Haire, J. Gustafson, A.G. Trant, T.E. Jones, T.C.Q. Noakes, P. Bailey, C.J. Baddeley, Surface Science 605 (2011) 214
-
10
20
30
40
50
60
70
80
90
100
300 400 500 600 700 800 900
Annealing Temperature /K
% A
u co
mpo
sitio
n
predicted
measured surface
measured core
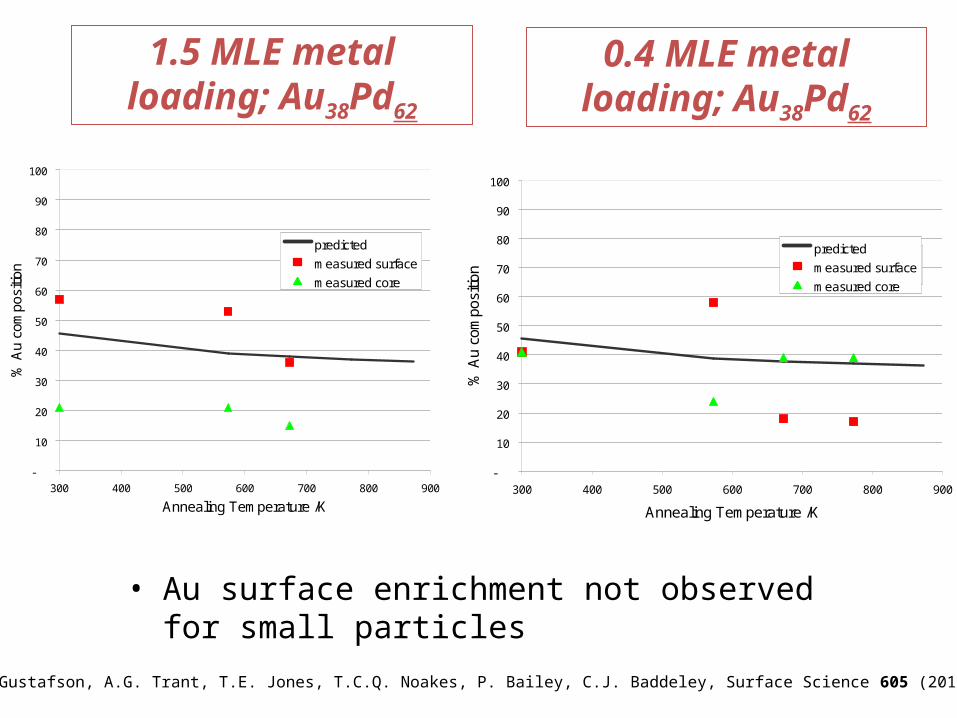
1.5 MLE metal loading; Au38Pd62
-
10
20
30
40
50
60
70
80
90
100
300 400 500 600 700 800 900
Annealing Temperature /K
% A
u co
mpo
sitio
n
predicted
measured surface
measured core
0.4 MLE metal loading; Au38Pd62
• Au surface enrichment not observed for small particles
10
20
30
40
50
60
70
300 400 500 600 700 800 900
predicted
measured surface
measured core
10
20
30
40
50
60
70
300 400 500 600 700 800 900
predicted
measured surface
measured core
A.R. Haire, J. Gustafson, A.G. Trant, T.E. Jones, T.C.Q. Noakes, P. Bailey, C.J. Baddeley, Surface Science 605 (2011) 214
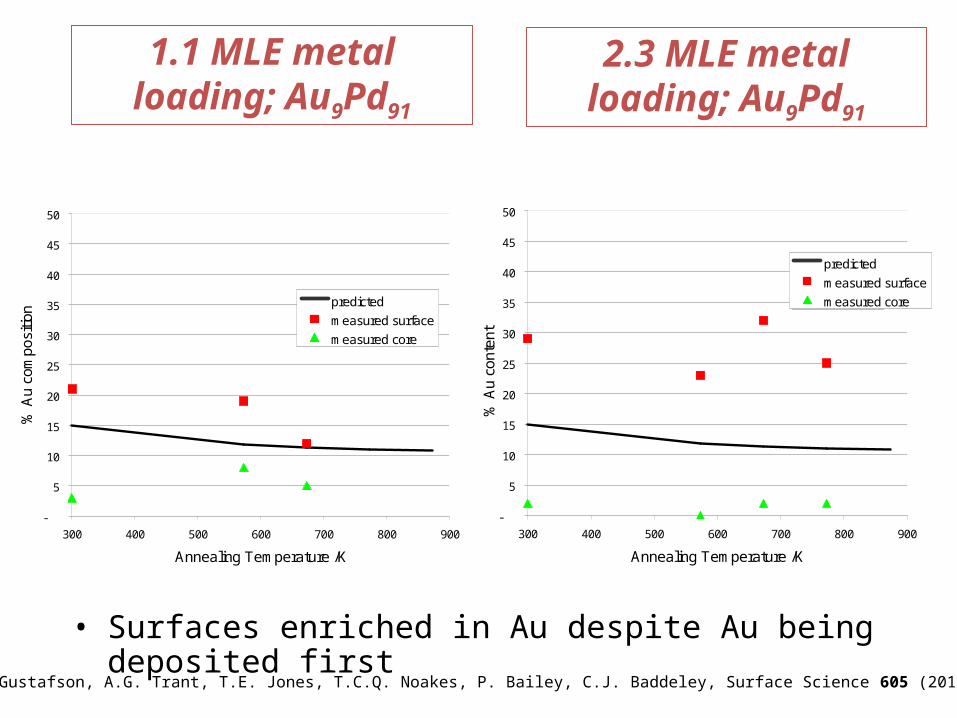
• Surfaces enriched in Au despite Au being deposited first
-
5
10
15
20
25
30
35
40
45
50
300 400 500 600 700 800 900
Annealing Temperature /K
% A
u co
mpo
sitio
n predicted
measured surface
measured core
1.1 MLE metal loading; Au9Pd91
2.3 MLE metal loading; Au9Pd91
-
5
10
15
20
25
30
35
40
45
50
300 400 500 600 700 800 900
Annealing Temperature /K
% A
u co
nten
t
predicted
measured surface
measured core
10
20
30
40
50
60
70
300 400 500 600 700 800 900
predicted
measured surface
measured core
10
20
30
40
50
60
70
300 400 500 600 700 800 900
predicted
measured surface
measured core
A.R. Haire, J. Gustafson, A.G. Trant, T.E. Jones, T.C.Q. Noakes, P. Bailey, C.J. Baddeley, Surface Science 605 (2011) 214
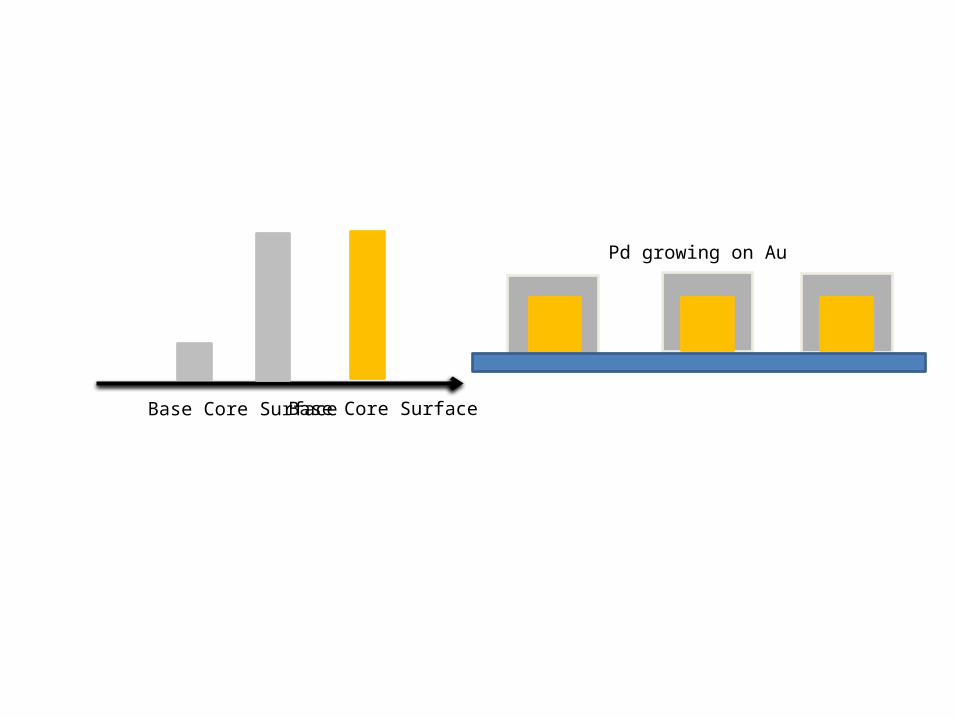
Base Core Surface Base Core Surface
Pd growing on Au
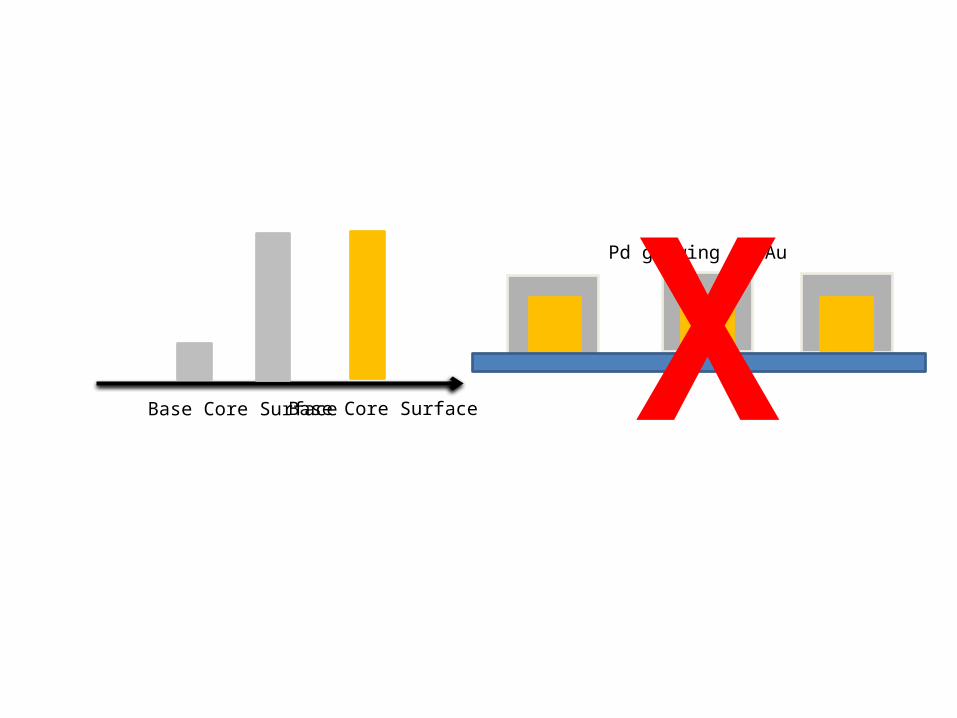
Base Core Surface Base Core Surface
Pd growing on Au
X
Base Core Surface Base Core Surface
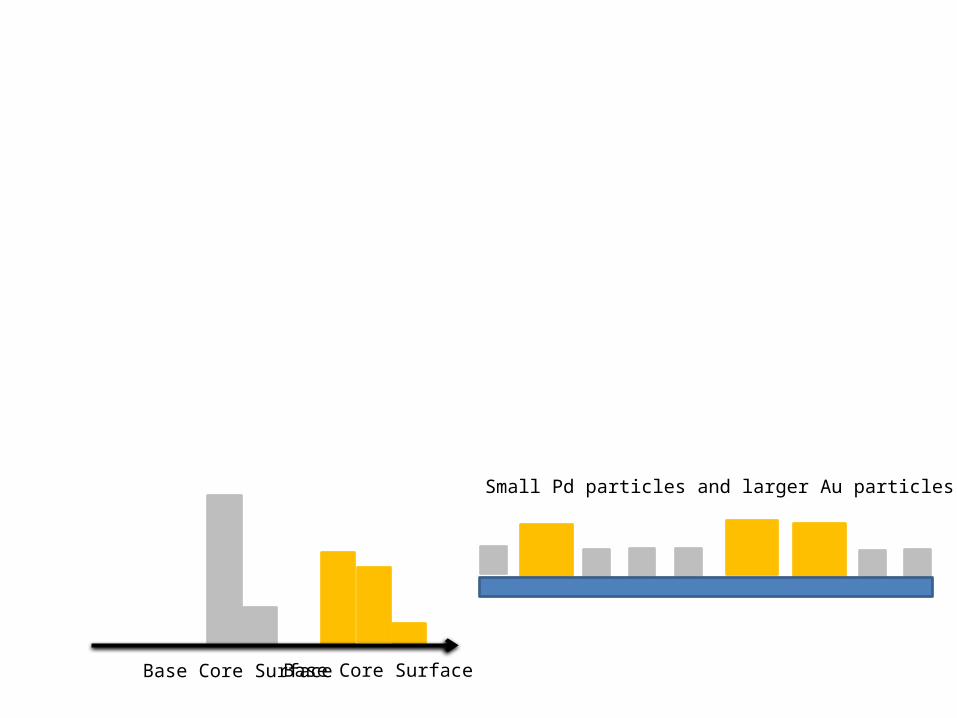
Small Pd particles and larger Au particles
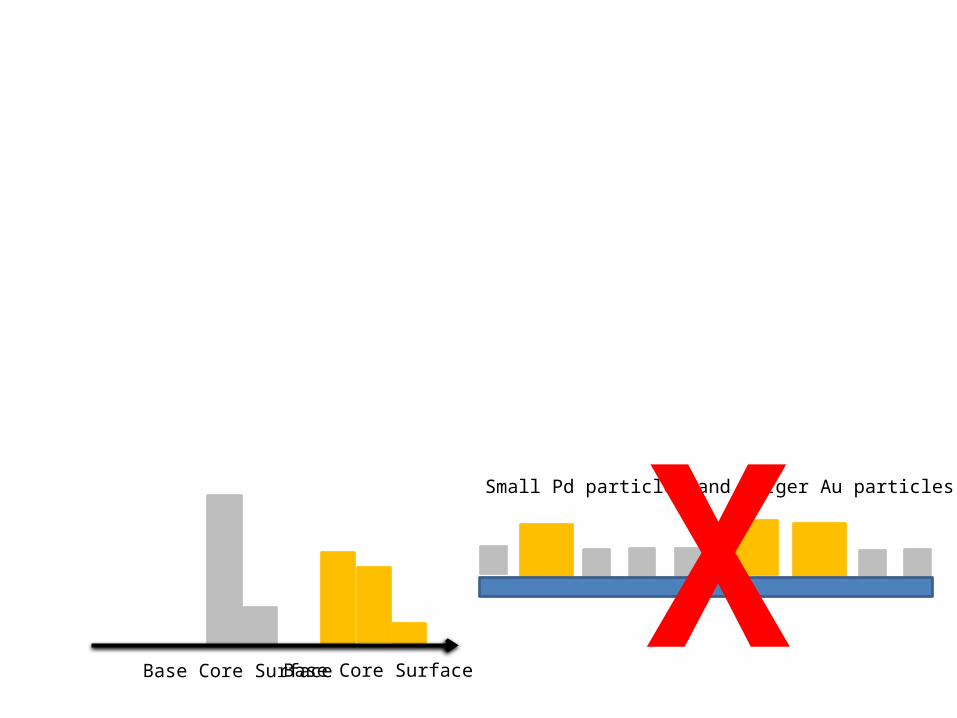
Base Core Surface Base Core Surface
Small Pd particles and larger Au particlesX
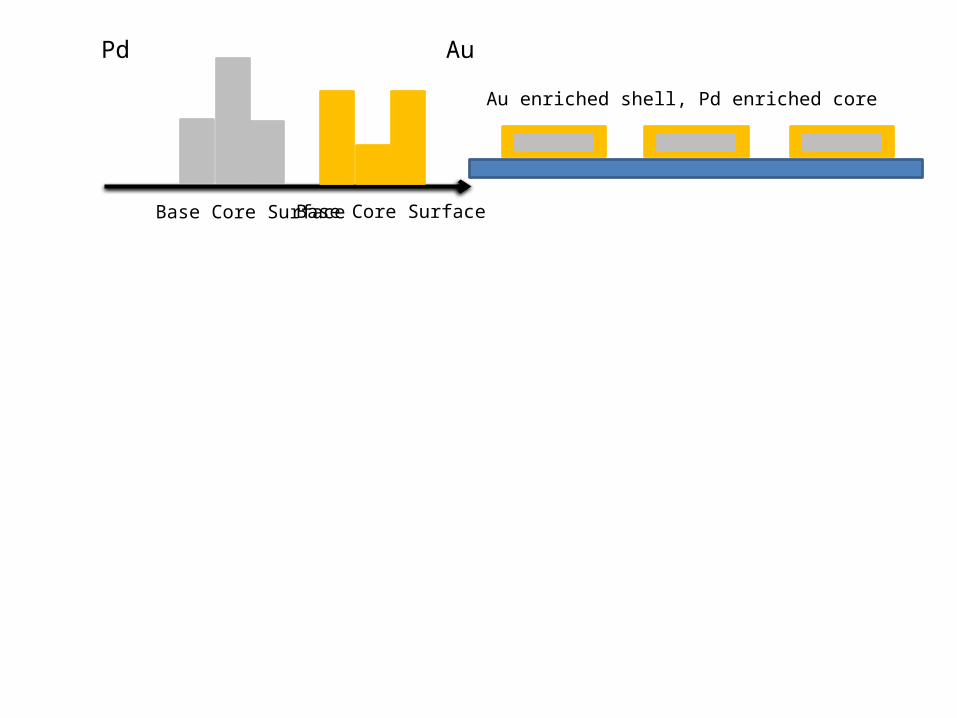
Pd Au
Base Core Surface Base Core Surface
Au enriched shell, Pd enriched core
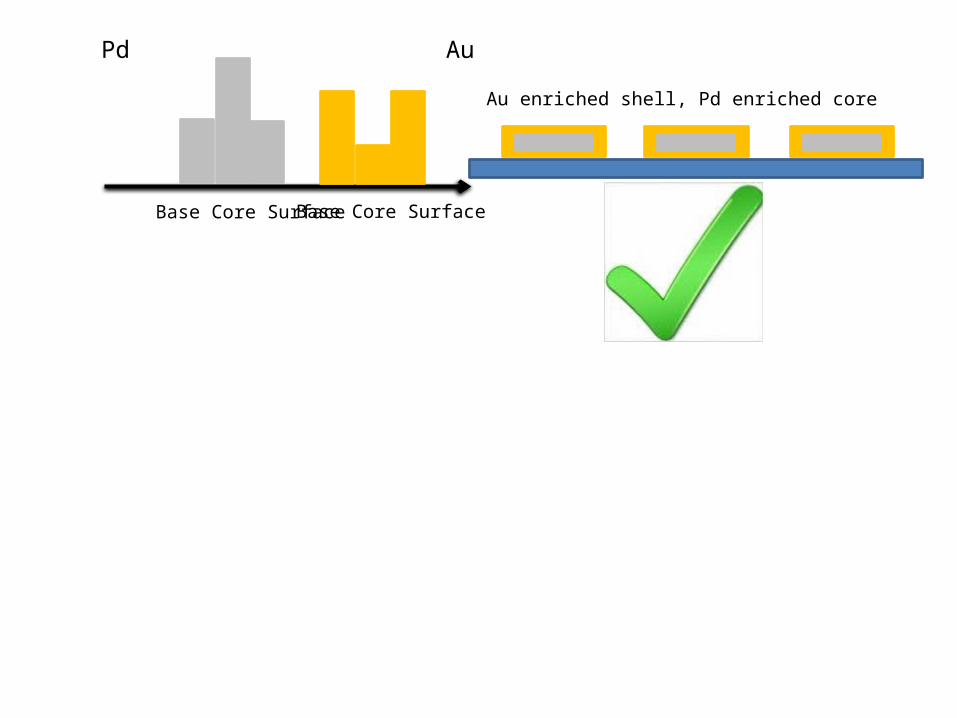
Pd Au
Base Core Surface Base Core Surface
Au enriched shell, Pd enriched core
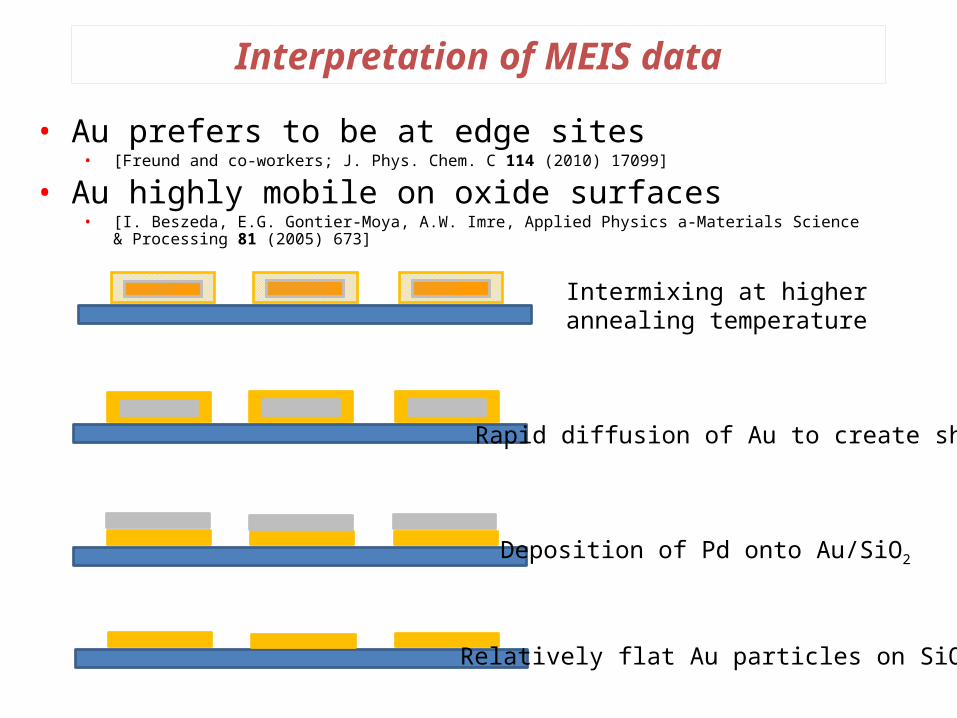
Interpretation of MEIS data
• Au prefers to be at edge sites • [Freund and co-workers; J. Phys. Chem. C 114 (2010) 17099]
• Au highly mobile on oxide surfaces• [I. Beszeda, E.G. Gontier-Moya, A.W. Imre, Applied Physics a-Materials Science & Processing 81 (2005) 673]
Relatively flat Au particles on SiO2
Deposition of Pd onto Au/SiO2
Rapid diffusion of Au to create shell
Intermixing at higher annealing temperature
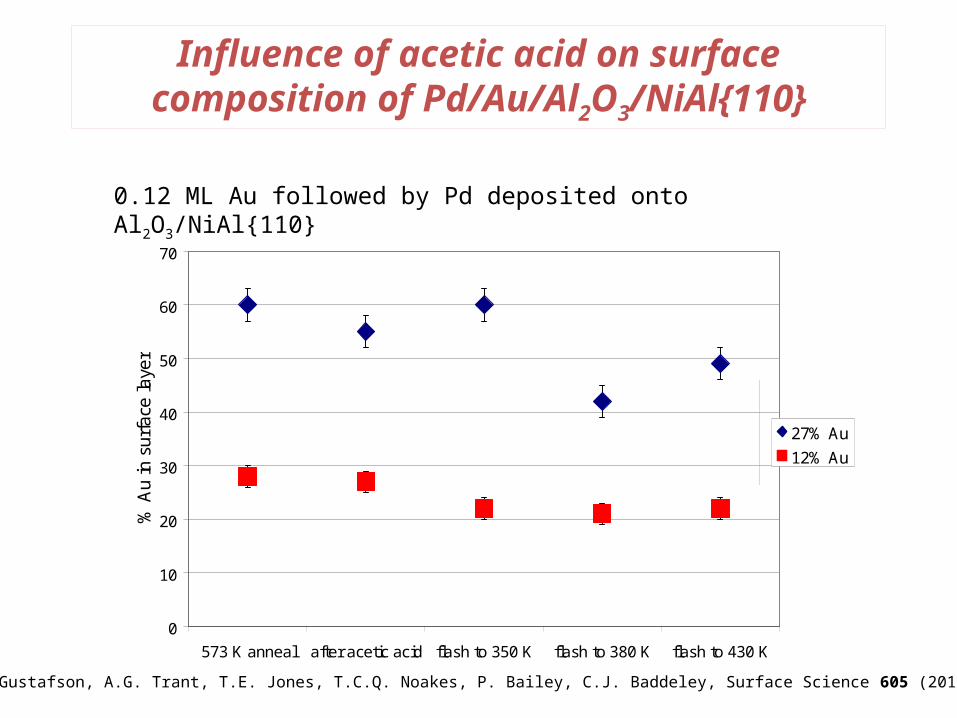
Influence of acetic acid on surface composition of Pd/Au/Al2O3/NiAl{110}
0
10
20
30
40
50
60
70
573 K anneal after acetic acid flash to 350 K flash to 380 K flash to 430 K
% A
u in
sur
face
laye
r
27% Au
12% Au
0
10
20
30
40
50
60
70
573 K anneal after acetic acid flash to 350 K flash to 380 K flash to 430 K
27% Au
12% Au
0.12 ML Au followed by Pd deposited onto Al2O3/NiAl{110}
A.R. Haire, J. Gustafson, A.G. Trant, T.E. Jones, T.C.Q. Noakes, P. Bailey, C.J. Baddeley, Surface Science 605 (2011) 214
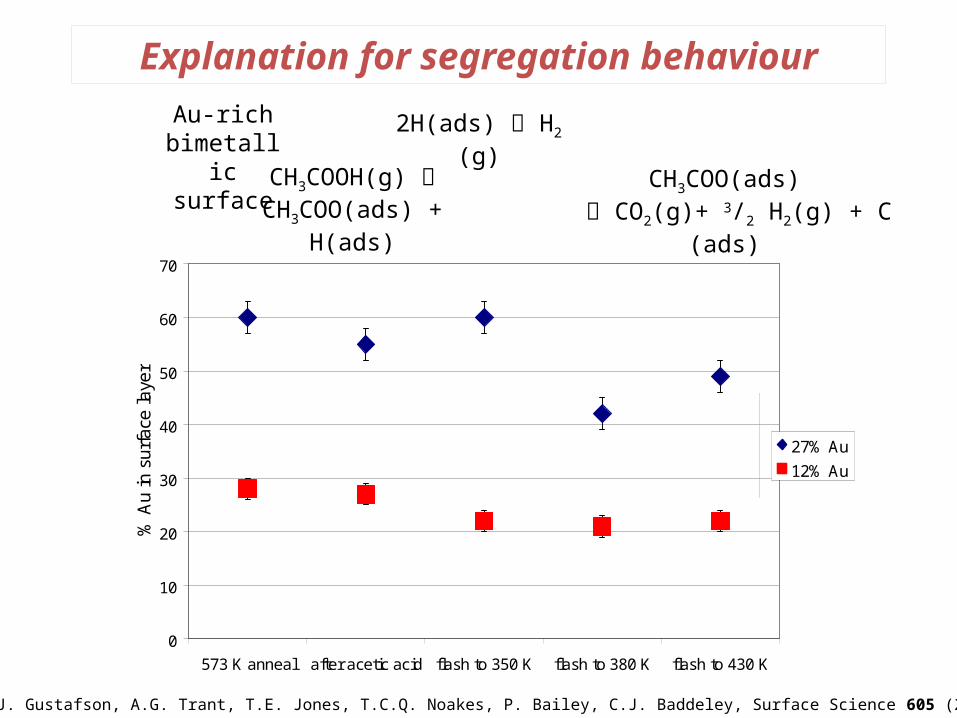
Explanation for segregation behaviourAu-rich
bimetallic surface CH3COOH(g)
CH3COO(ads) + H(ads)
2H(ads) H2 (g)
CH3COO(ads) CO2(g)+ 3/2 H2(g) + C (ads)
0
10
20
30
40
50
60
70
573 K anneal after acetic acid flash to 350 K flash to 380 K flash to 430 K
% A
u in
sur
face
laye
r
27% Au
12% Au
0
10
20
30
40
50
60
70
573 K anneal after acetic acid flash to 350 K flash to 380 K flash to 430 K
27% Au
12% Au
A.R. Haire, J. Gustafson, A.G. Trant, T.E. Jones, T.C.Q. Noakes, P. Bailey, C.J. Baddeley, Surface Science 605 (2011) 214
Conclusions / Future Work
• Possible to use MEIS to depth profile Au/Pd alloy nanoparticles supported on planar oxide films– Need user friendly data analysis tool
• Now available from Sortica’s group in Brazil
• Can ‘see through’ the adsorbate layer– MEIS ideal for looking at adsorbate covered catalyst particles
• Better to work with samples enriched in lower Z element.– Many examples (e.g. CoPt) where exactly this type of catalyst is
employed at very low doping levels of heavy element
• Need temperature and pressure dependence of adsorbate induced segregation
Acknowledgements
EaStCHEM School of Chemistry, St AndrewsDr Johan GustafsonDr Andrew Haire
Dr Aoife TrantDr Tim Jones
Dr Tom Owens
MEIS facility, STFC Daresbury LaboratoryDr Tim NoakesDr Paul Bailey
The Knut and Alice Wallenberg Foundation
Spectrum simulation – spectra of bimetallic systems
Spectra of bimetallic systems• Peak intensities normalised to take into account
scattering cross section• Peaks associated with each element are fitted according
to the known overall composition• Assume Gaussian distribution of particle heights• Particles separated into surface/core/base shells• ptop% has composition ctop; pbottom% has composition
cbottom; remainder has composition ccore
• Use an intermediate stopping power between that of pure Au and pure Pd weighted by the total composition