using mobile phones to determine transportation...
TRANSCRIPT
13
Using Mobile Phones to DetermineTransportation Modes
SASANK REDDY, MIN MUN, JEFF BURKE, DEBORAH ESTRIN,MARK HANSEN, and MANI SRIVASTAVA
University of California, Los Angeles
As mobile phones advance in functionality and capability, they are being used for more than just
communication. Increasingly, these devices are being employed as instruments for introspection
into habits and situations of individuals and communities. Many of the applications enabled by
this new use of mobile phones rely on contextual information. The focus of this work is on one di-
mension of context, the transportation mode of an individual when outside. We create a convenient
(no specific position and orientation setting) classification system that uses a mobile phone with a
built-in GPS receiver and an accelerometer. The transportation modes identified include whether
an individual is stationary, walking, running, biking, or in motorized transport. The overall classi-
fication system consists of a decision tree followed by a first-order discrete Hidden Markov Model
and achieves an accuracy level of 93.6% when tested on a dataset obtained from sixteen individuals.
Categories and Subject Descriptors: I.5.2 [Pattern Recognition]: Design Methodology—classifierdesign and evaluation
General Terms: Algorithm, Design, Experimentation
Additional Key Words and Phrases: Activity classification, mobile phones, transportation mode
inference
ACM Reference Format:Reddy, S., Mun, M., Burke, J., Estrin, D., Hansen, M., Srivastava, M. 2010. Using mobile phones
to determine transportation modes. ACM Trans. Sensor Netw. 6, 2, Article 13 (February 2010),
27 pages. DOI = 10.1145/1689239.1689243 http://doi.acm.org/10.1145/1689239.1689243
1. INTRODUCTION
Mobile phones are truly ubiquitous. They have computation, sensing, and com-munication capabilities and are carried by people throughout the day. Many
This work was supported (in part) by National Science Foundation (NSF) grant number CNS-
0627084 and Nokia Research.
This is an enhanced version of preliminary work that was presented at the International Sympo-
sium on Wearable Computers (ISWC 2008).
Authors’ address: Center for Embedded Networked Sensing, UCLA, 3563 Boelter Hall, Los Angeles,
CA 90095; email: {sasank, bobbymun, jburke, destrin, cocteau, mbs}@ucla.edu.
Permission to make digital or hard copies of part or all of this work for personal or classroom use
is granted without fee provided that copies are not made or distributed for profit or commercial
advantage and that copies show this notice on the first page or initial screen of a display along
with the full citation. Copyrights for components of this work owned by others than ACM must be
honored. Abstracting with credit is permitted. To copy otherwise, to republish, to post on servers,
to redistribute to lists, or to use any component of this work in other works requires prior specific
permission and/or a fee. Permissions may be requested from Publications Dept., ACM, Inc., 2 Penn
Plaza, Suite 701, New York, NY 10121-0701 USA, fax +1 (212) 869-0481, or [email protected]© 2010 ACM 1550-4859/2010/02-ART13 $10.00
DOI 10.1145/1689239.1689243 http://doi.acm.org/10.1145/1689239.1689243
ACM Transactions on Sensor Networks, Vol. 6, No. 2, Article 13, Publication date: February 2010.

13:2 • S. Reddy et al.
of these devices can already record audio, take photos, and communicate overdifferent radio channels, and more recently these phones are being equippedwith sensors that are able to capture location and measure acceleration. Takingadvantage of these features on mobile phones, several practical systems havebeen implemented that have enabled applications in regards to sharing sensorderived status information in online social networks, capturing the character-istics and dynamics of everyday activities such as the commute, and enablingqueries associated with physical space [Miluzzo et al. 2007; Gaonkar et al. 2008;Li et al. 2008; Mohan et al. 2008].
This work focuses on using mobile phones to determine the transportationmode of an individual when outside, whether the user is stationary, walking,running, biking or in motorized transport. Target applications for this fine-grained transportation mode inference and location information include thefollowing.
—Physical Activity Monitoring. The transportation modes of individuals arelogged and mapped to locations to enable individuals to plan modes of trans-portation based on goals of physical activity and for the purpose of healthmonitoring [Consolvo et al. 2008a; Peterson et al. 2009].
—Personal Impact and/or Exposure Monitoring. Inferences of the transporta-tion mode and location of an individual are used to provide a personalizedenvironmental scorecard for tracking the hazard exposure and environmen-tal impact of one’s activities. Examples include our Personal EnvironmentImpact Report (PEIR) and UbiGreen [Mun et al. 2009b; Agapie et al. 2008;Froehlich et al. 2009] along with commercial offerings such as Ecorio andCarbon Diem [CarbonHero 2008; Kao et al. 2008].
—Transportation and Mobility-Based Recruitment. Transportation annotatedmobility profiles (time, location, transportation mode traces) are created forprofile based recruitment for distributed data gathering [Reddy et al. 2009b;Burke et al. 2006].
The accuracy requirements for these applications are high. In PEIR the al-lowable noise from the transportation mode classification cannot exceed 10%(accuracy of the classifier has to be greater than 90%). Analyzing several weeksof transportation mode activity of members in PEIR indicates that higher er-ror rates compromise an individual’s ability to make choices about their dailytransportation habits; in effect adding noise to the impact and exposure esti-mates that is on par with “natural” variations that they may want to study(changes in speed or the selection of alternative routes). Similar high accuracyrequirements are needed for the other two applications to avoid undermininguser confidence in the system (in the case of the physical activity monitoring)and utility of data collection (in the case of transportation and mobility basedrecruitment). For instance, when monitoring physically activity for fitness, re-porting instances of biking as motorized transport or walking significantly af-fects energy expenditure estimates for an individual and can cause feedback forgoal setting to be incorrect. In the case of the recruitment problem, many of thedata collections are related to certain types of transportation modes, such as
ACM Transactions on Sensor Networks, Vol. 6, No. 2, Article 13, Publication date: February 2010.
Using Mobile Phones to Determine Transportation Modes • 13:3
monitoring the quality of cycling routes or documenting walking hazards [Munet al. 2009a; Reddy et al. 2009a], so it is imperative that the mode classifica-tion is accurate otherwise the wrong set of individuals could be recruited forparticipation - thus reducing the utility of the data collection as a whole.
This article details the design, implementation, and evaluation of the trans-portation mode classification system that runs on a mobile phone equipped witha GPS receiver and a 3-axis accelerometer. The classification system is conve-nient for an individual yet reliable in accurately distinguishing between thefive transportation modes. The fact that the classifier runs on a single sens-ing unit without strict orientation or position requirements makes the systemconvenient to use. Also, the unit does not rely on external indexes such as GISinformation or historical user pattern data. The overall system achieves an ac-curacy of greater than 93% and works reliably even if user-specific training datais not present. The classifier is composed of a decision tree followed by a first-order discrete Hidden Markov Model and works by analyzing a second of GPSspeed data along with variance and frequency components of the accelerome-ter signal. Since the transportation mode classification has an energy footprintassociated with it, an algorithm was also created to turn on the classifier whenan individual goes outdoors. This procedure relies on using changes in the con-nected cell tower as a trigger to check the outdoor status of an individual asopposed to uniformly sampling the GPS.
The remainder of the article is organized as follows. Related work is discussedin Section 2. Section 3 details the system design goals and contributions alongwith the sensor, feature, and classifier selection approach. The experimentalsetup is described in Section 4. Section 5 contains the classifier evaluation andperformance results. Section 6 and 7 contain discussion of future work alongwith the conclusion.
2. RELATED WORK
Many systems exist to classify human motion activities and transportationmodes. Related work in this space can be grouped based on the types of systemsused to implement the algorithms: commercial devices, custom hardware, andmobile phones [Consolvo et al. 2008b]. Each category is detailed below withinformation on how our system builds on or differs from the ones described.
2.1 Commercial Devices
Devices from the commercial realm for activity monitoring vary in terms of thesensors used and inferences determined [Chen et al. 2008]. One of the mostubiquitous devices for physical activity monitoring is the pedometer [Consolvoet al. 2008b]. It consists of a sensor, such as a mechanical arm, magnetic switch,or an accelerometer, and software that counts steps based on monitoring up-ward and downward motions [Crouter et al. 2003; Schneider et al. 2004]. Pe-dometers are typically designed to be worn in a specific orientation (vertically)on the hip [Omron 2008a] or the ankle [Karabulut et al. 2005], but recent ad-vances have made them more applicable to other positions and orientations onthe body [Nike 2008; Omron 2008b]. Furthermore, mobile phones that have
ACM Transactions on Sensor Networks, Vol. 6, No. 2, Article 13, Publication date: February 2010.
13:4 • S. Reddy et al.
accelerometers have been used to keep track of step counts as well [Chen et al.2008].
More sophisticated devices exist commercially for activity monitoring. Forinstance, both FitBit and Phillips Tracmor devices incorporate multi-axis ac-celerometers to provide a convenient (orientation agnostic) method to infer calo-ries burned. Impact Sports’ ePulse monitor uses a heart rate and BodyMedia’sGoWear unit combines four sensors (accelerometer, heat flux, galvanic skinresponse, and skin temperature) for this same purpose [ImpactSports 2008;BodyMedia 2008]. Although these commercial offerings are widely availableand fairly convenient, they only provide coarse activity information (step count,calories burned, distance traveled). Our applications require finer grained ac-tivity labels, such as which of the five transportation modes were taken, to beeffective.
2.2 Custom Hardware
Research groups have investigated different methods to infer motion activities(climbing stairs, elevator rides) along with transportation modes using customhardware Consolvo et al. [2008b]. For instance, Farringdon et al. [1999] andRandell and Muller [2000] have created systems that use a single accelerom-eter to infer stationary, walking, and running activities. The work from Kernet al. [2003], Bao and Intille [2004], Ganti et al. [2006], Fabian et al. [2008], andSaponas et al. [2008] has concentrated on using multiple accelerometers placedon different positions on the body to infer activities, and Pham and Abdelza-her [2008] have shown that orientation independence can be achieved in thismultiple device setting. Unfortunately, the single accelerometer solutions can-not differentiate between being stationary and in motorized travel with highaccuracy, and although multiple worn accelerometer solutions provide highlydetailed information, they are only practical for specialized applications anduse cases.
Similar to SenseWear, Lester et al. [2006] use a single sensing unit (MobileSensing Unit - MSP) with multiple modalities (accelerometer, audio, barometricpressure) for activity inference. They focus on user convenience and show thattheir system works across several users and at multiple positions. In morerecent implementations, audio is eliminated as a sensor modality, and insteadeither identifier/signal strength information from multiple cell towers (up toseven) [Froehlich et al. 2009; Sohn et al. 2006] or coarse speed measures fromnetwork endpoint localization [Welbourne et al. 2005] is used for transportationmode inference. But unfortunately, obtaining multiple cell tower informationfor Windows Mobile 6, Nokia Symbian, Android, and the iPhone based phones isnot possible using the standard developer application programming interfaces.These platforms limit the cell information to only the connected tower or do notmake it available at all. Furthermore, the WiFi and GSM fingerprinting neededfor network endpoint localization is limited to predominantly urban areas andonly provides a rough estimate of speed [Skyhook 2009; Wigle 2009; LaMarcaet al. 2005]. Finally, the MSP device used has a predetermined fixed orientationand attachment procedure associated with it.
ACM Transactions on Sensor Networks, Vol. 6, No. 2, Article 13, Publication date: February 2010.

Using Mobile Phones to Determine Transportation Modes • 13:5
Table I. Related Work Implemented on Mobile Phones
Classes Sensor Users Time Accuracy
Anderson and Muller Still, Walk, Motorized GSM 1 45 Mins. 82%
[2006]
[Sohn et al. 2006] Still, Walk, Motorized GSM 3 323 Hours 85%
[Mun et al. 2008] Still, Walk, Motorized GSM, WiFi 2 13 Hours 83%
[Liao et al. 2007] Walk, Motorized (Bus/Car) GPS, GIS 1 60 Days 84%
[Zheng et al. 2008] Walk, Bike, Motorized GPS 65 10 Months 76%
[Miluzzo et al. 2008] Still, Walk, Run Accelerometer 8 4 Hours 78%
Our work expands on these existing systems by enabling fine-grained trans-portation mode classification based on sensors (GPS and accelerometer) avail-able on a commodity device (mobile phone) along with relaxed requirements onhow the device should be worn (any orientation) in addition to being position(6 different) and user agnostic. We note that the approach of using GPS andaccelerometer sensors for transportation mode inference was first mentionedby Marmasse et al. [2004] but never throughly evaluated, and that Denninget al. [2009] and Lester et al. [2008] consider this method as a future directionfor applications that use the MSP.
2.3 Mobile Phones
With the advancement of sensors on mobile phones, researchers and practition-ers are looking to use this device as a platform for activity inference [Consolvoet al. 2008b]. Table I shows a summary of work that has taken place in thisspace along with the types of activity modes inferred, the test user base, and theclassification accuracy. Anderson and Muller [2006] and Sohn et al. [2006] usechanges in GSM cell tower observations (up to seven) to approximate whether auser is still, walking, or in motorized transport. Mun et al. [2008] augments theGSM work (but uses only the connected cell tower) with the addition of featuresderived from WiFi observations for classification purposes. Both GSM and WiFibased systems work well for coarse grained transportation mode classification,such as determining the difference between still, human powered motion, andmotorized transport, but are not as useful for fine-grained classification. Also,these features are dependent on network endpoint density which varies basedon the environment the user is in.
Several systems rely on GPS combined with external information for sens-ing transportation modes. For instance, Zheng et al. [2008] combine GPS witha post-processing step that uses likely transportation modes from a corpus ofcontributed data for classification. Alternatively, Patterson et al. [2003] com-bines GPS with GIS information, such as transportation end points and roadnetworks, and Liao et al. [2007] builds user specific models based on learn-ing destinations and routes from historical data to build transportation modeclassifiers.
Our work differs from existing solutions in that it does not rely on externalindexes since this data might not always be available. Also, GPS only solutionswork well for coarse grained transportation mode classification, but performpoorly when classification of travel modes with similar speed and accelerationprofiles is needed, such as the case with running, biking, and slow motorized
ACM Transactions on Sensor Networks, Vol. 6, No. 2, Article 13, Publication date: February 2010.

13:6 • S. Reddy et al.
travel. Miluzzo et al. [2008] uses a mobile phone with a three-axis accelerom-eter for inferring different classes of walking motion. We show later that bothGPS and accelerometer features are needed when considering additional trans-portation modes.
3. APPROACH
This section contains details in regards to the underlying design principlesand the core contributions associated with the transportation mode classifier.Furthermore, information about the sensor modalities and classifier types con-sidered for our system is provided.
3.1 Design Goals and Contribution
The primary design goal for the transportation mode classifier is user conve-nience. Thus, our system has the following properties:
—contained in one sensing unit;
—flexible in terms of the position and orientation;
—able to work for a variety of users without additional training;
—effective with sensors that exist on mobile phones;
—not reliant on external spatial or user history based indexes.
Although there exists systems for transportation mode classification, veryfew meet our design requirements. Many rely on having multiple devices placedat different positions on the body, having set orientation/position requirements,accessing external spatial or historical user pattern information, or using sens-ing modalities that are not viable or available to be used on mobile phones.The systems that are convenient for users and run on mobile phones are notas reliable for fine-grained transportation mode classification since they use asingle sensing modality (accelerometer, GPS, or network endpoints). Thus, ourcontribution is a classifier that uses information from an accelerometer and aGPS to achieve high accuracy and is able to run on a commodity mobile de-vice that varies in terms of how it is worn, carried, and used. Furthermore,we thoroughly evaluate the system by showing the usefulness of the sensingmodalities employed, justifying the specific classification algorithm chosen, andillustrating that the design goal of user convenience is met through a series oftests based on annotated data collections. Finally, since our applications needto determine the transportation modes along with location when an individualis outside, we implement a energy-aware scheme that automatically turns onthe transportation mode classifier during outdoor operation by using GSM celltower changes as a triggering mechanism.
3.2 Sensor Selection
Since the classifier is designed to be run on a mobile phone system, thereare a few different sensor modalities available for classification. In additionto accelerometer and GPS capabilities, modern phones are being equipped withBluetooth, GSM, and WiFi radios. Features can be derived to estimate speed
ACM Transactions on Sensor Networks, Vol. 6, No. 2, Article 13, Publication date: February 2010.
Using Mobile Phones to Determine Transportation Modes • 13:7
based on the existence and signal strength of Bluetooth beacons, GSM cell tow-ers or WiFi access points. Below we discuss the different sensing modalities inmore detail and provide justification for choosing GPS and accelerometer forthe final classification system. Although our decision in regards to the sensingmodalities to use could be guided by relying on previous work, we re-evaluatedthe sensing choices here since we are considering a specific set of fine-grainedtransportation modes.
3.2.1 Bluetooth. One option is to use Bluetooth as a sensor for activityclassification. Previously, static Bluetooth beacons distributed throughout anindoor setting have been employed for determining activities based on proxim-ity to devices (watching TV, washing devices, cooking), but this sensing modalityhas not been used for inferring transportation mode classifications [Tapia et al.2004]. The main reason that Bluetooth has not been applied to transportationmode classification is because Bluetooth sensors are not ubiquitous in outdoorsettings. Static Bluetooth beacons mainly exist in indoor settings such as officebuildings or homes. Relying on Bluetooth signals exhibited by mobile phoneshas its own problems. For instance, it is difficult to distinguish whether an in-dividual is moving or if the environment around them is changing (other peoplecarrying devices are moving). Hence, Bluetooth is not an effective modality fortransportation mode classification since it does not provide the accuracy neededfor the modes being distinguished.
3.2.2 WiFi and GSM. To determine whether WiFi and GSM featureswould be useful for the fine-grained transportation mode classification, a testusing training data consisting of collecting accelerometer, GPS, WiFi, and GSMraw data from sixteen individuals in an urban settings was performed. Moreinformation about the setup of the data collection can be found in Section 4.3,and the classifier used for this preliminary sensing modality analysis was aC4.5 Decision Tree. When comparing WiFi and GSM features (note that onlythe connected cell information was used) [Mun et al. 2008] to accelerometer andGPS features (further described in Section 3.3), the results indicate that theaccelerometer and GPS features enabled higher accuracy classifiers - around22% greater with an overall accuracy of 91.3%. Furthermore, classifiers builtusing accelerometer information with WiFi, GSM, and GSM/WiFi features, stillresulted in the GPS and accelerometer based classifier to be 3–7% greater inaccuracy. Table II shows the drop in accuracy when using features from dif-ferent modalities as compared to the accelerometer and GPS based classifier.Each row shows which modalities were employed in creating the specific clas-sifier being compared. Overall, the results presented in the table make sensefor two reasons: (1) GSM and WiFi features act as a proxy for the speed of anindividual and when speed profiles are similar, as is the case with slow mov-ing traffic, biking, and walking, these features are not as discriminative; and(2) GSM and WiFi features depend on the density of network end points (celltowers and access points) and even in urban settings, there are areas (recre-ational, low residential) where the density is low or the end points cover a largeregion.
ACM Transactions on Sensor Networks, Vol. 6, No. 2, Article 13, Publication date: February 2010.

13:8 • S. Reddy et al.
Table II. Classification Accuracy Decrease Compared to GPS
and Accelerometer Based System
Accelerometer GSM GPS WiFi Accuracy Decrease
X 10.4%
X 33.2%
X 19.2%
X 35.1%
X X 6.9%
X X 3.9%
X X X 3.0%
X X 13.3%
X X 22.1%
X X 11.9%
We also analyzed whether all modalities should be used for a classifier orif we could simply use accelerometer and GPS features. The classifier with allfour modalities resulted in a negligible increase in accuracy (0.6%) as comparedto using just GPS and accelerometer features. Thus, we conclude that GPS andaccelerometer features are effective for our transportation mode classificationsystem, and that using WiFi and GSM is not necessary since they add mini-mal performance increase while significantly impacting the energy footprint ofthe classifier (see Section 5.6 in regards to the power usage of sampling theseadditional modalities). Furthermore, using GPS enables the system to obtaingranular location information which is useful for our target applications, andnot relying on WiFi and GSM features avoids having to create environmentspecific models to account for network endpoint characteristics in urban, sub-urban, and rural areas [Mun et al. 2008; Chen et al. 2006; Sohn et al. 2006;Anderson and Muller 2006].
3.2.3 Accelerometer and GPS. Accelerometer and GPS information areboth needed for transportation mode classification. In situations where theaccelerometer output is similar, the speed is typically different and vice versa.If the system employs just one of these sensors for classification, a drop in ac-curacy of 10–20% results when compared to using both. Transportation modessuch as still, biking, and motorized travel with accelerometers and walk, run,and bike for the GPS were the most affected since they had similar profileswhen only one sensor is used.
The usefulness of both modalities is further shown in Figure 1. Figure 1(a)contains the speed (meters per second) distribution of 30 minutes of each activ-ity sampled every second from one individual. We note that the exact makeupof the speed distributions can differ on a per user basis (individual’s couldhave a faster/slower walking stride or have different driving habits) and ur-ban canyons can cause speed outliers, but the figure illustrates the “ranges”of speeds for the transportation modes, which were consistent among all indi-viduals in the user base. For instance, stationary activities have speeds mainlyunder 1 meters per second and walking typically has speeds of 0.5–2 meters persecond. Running and biking are similar in their speed distribution while mo-torized activity has a larger range that is usually higher then the other modes.Accelerometer data is very useful when the activity causes a change in motion.
ACM Transactions on Sensor Networks, Vol. 6, No. 2, Article 13, Publication date: February 2010.

Using Mobile Phones to Determine Transportation Modes • 13:9
Fig. 1. Distribution of speeds along with variations in accelerations for the transportation modes.
For instance, stationary activities have a very low variance. Motorized trans-port is similar to stationary activities but is affected by vehicle vibrations androad conditions. Walking and biking exhibit similar accelerometer characteris-tics in certain areas of the body, and running has a large variance. Figure 1(b)shows accelerometer data from all three axes (different colors - red, green, blue)for the case where the user is still initially for a short period of time, then startswalking, running, biking, and is in motorized travel.
3.3 Feature Selection
This section details the decisions involved in selecting the features for the clas-sification system. First, the methodology for picking the raw sample windowsize to make into features is reviewed. Then, the types of features that wereconsidered are detailed. Finally, information about which features were chosenfor the classification system along with the criteria for the decision makingprocess is provided.
3.3.1 Window Size. A window of 1 second is used for the period of clas-sification. This value is validated by previous work in classifying the classesof activities this work targets [Bao and Intille 2004; Huynh and Schiele 2005;
ACM Transactions on Sensor Networks, Vol. 6, No. 2, Article 13, Publication date: February 2010.
13:10 • S. Reddy et al.
Kern et al. 2003]. Smaller window sizes cause classification accuracy to suf-fer due to certain features (accelerometer frequencies) not being effective andlarger window sizes introduce noise since multiple activities could exist. Fur-thermore, a larger window was not chosen so that the classifier would workimmediately when instigated.
3.3.2 Types of Features. The two sensors that are sampled for data includethe accelerometer and the GPS. In terms of the accelerometer, we use the mag-nitude of the force vector by combining the measurements from all three axis as
the basis for the features: Amag =√
(Ax)2 + (Ay )2 + (Az )2. This enables our sys-
tem to assume a random and possibly changing orientation for the mobile phone.Various features including the mean, variance, energy, and the DFT (DiscreteFourier Transform) energy coefficients between 1-10Hz based on magnitude ofthe force vector of the accelerometer were evaluated along with the speed ofthe GPS receiver [Bao and Intille 2004; Kern et al. 2003]. Frequencies between1-10Hz for the accelerometer were chosen for consideration since prior work in-dicates this range is appropriate to detect pedestrian based motion [Welbourneet al. 2005; Sun and Hill 1993; Winter 1990; Antonsson and Mann 1985]. Interms of speed, the value obtained from the GPS receiver directly is used, ifavailable, since it is more accurate than calculating speed from consecutivelocation points.
Note that there is a noise filtering step that occurs for the classificationsystem. GPS points deemed “invalid”, based on analyzing the accuracy (vertical,horizontal, heading, and speed), dilution of precision (time, vertical, horizontal),and changes in speed values of the signal, are discarded. These invalid pointsnormally occur when the phone is significantly shielded or if the person is in anarea that is covered. The filtering process also analyzes accelerometer data. Iftoo few samples are received from the accelerometer to calculate the frequenciesof interest, this data is excluded for classification as well.
3.3.3 Selection Method. Variance along with DFT energy coefficients be-tween 1-3 Hz from the accelerometer and the speed from the GPS receiver wereselected as the feature set using correlation based feature selection (CFS). CFSwas chosen as opposed to Principle Component Analysis (PCA) because it isa feature subset selector that eliminates irrelevant and redundant attributes.Essentially, CFS uses a heuristic “merit” function that finds the subset that ispredictive of the classification groups while reducing redundancy among thefeatures themselves [Ghiselli 1964; Yu and Liu 2003]. On the other hand, PCAis concerned with creating new (and usually fewer) feature directions from lin-ear combinations of original features and transforming data samples onto thenew feature space [Martinez and Kak 2001]. This is an expensive operationsince it requires all the original features to be calculated and then transformedinto the new projection space. Furthermore, using PCA, even with 95% of thevariance explained, results in a 2-3% less accurate classifier than just relyingon CFS based subset features.
To show the “worth” of each feature in the subset, the information gain (orthe predictive power) is measured of each attribute. As Table III shows, the GPS
ACM Transactions on Sensor Networks, Vol. 6, No. 2, Article 13, Publication date: February 2010.

Using Mobile Phones to Determine Transportation Modes • 13:11
Table III. Information Gain Scores of
Features Involved in Subset Chosen
Feature Score
GPS Speed 1.431
Accelerometer Variance 1.426
Accelerometer DFT (3 Hz) 1.205
Accelerometer DFT (2 Hz) 1.125
Accelerometer DFT (1 Hz) 0.915
speed value is the most important with the highest information gain score. Thevariance of the accelerometer signal is close in terms of value and then come thethree DFT energy coefficients from the accelerometer. This result makes sensesince the GPS speed can help to determine when a user is still or in motorizedtransport, the accelerometer variance can be used to infer if an individual isrunning, and the DFT coefficients help in differentiating between the foot-basedtransportation modes.
3.4 Classifiers Selection
To determine which classification system is the most accurate for transporta-tion mode inference, we compared: (a) instance classifiers such as C4.5 DecisionTrees (DT), K-Means Clustering (KMC), Naive Bayes (NB), Nearest Neighbor(NN), and Support Vector Machines (SVM), (b) a continuous Hidden MarkovModel (CHMM), and (c) a two-stage system involving the most accurate in-stance based classifier (which is the decision tree) combined with a discreteHidden Markov Model (DHMM).
3.4.1 Classifier Details. We point readers to Duda et al. [2000] and Wittenand Frank [2005] for definitions of the commonly known classifiers but go intomore detail in regards to the CHMM and the two-staged classification systemwhich follows for clarity:
—Continuous HMM (CHMM). CHMM is a hidden markov model where theoutput symbols (features) are modeled as independent multi-variate Gaus-sian distributions and the hidden states correspond to classification classesAlso, the transition probability between classes is also considered.
—Instance Classifier + Discrete Hidden Markov Model (DHMM). The two-stageclassifier is a instance based classifier followed by a DHMM where the DHMMis trained by the class posterior probability of the instance based classifier.Thus, the DHMM output symbols are the instance-based classifications andthe hidden states are the classification classes. Similar to CHMM, the statetransition probabilities are also modeled.
3.4.2 Parameters and Specification. Many of the classifiers require selec-tion of thresholds and parameters. We review our decision making process toselect these attributes for the classifiers below. In terms of DTs, a major concernis over-fitting, and thus both pre-pruning and post-pruning are employed. Forpre-pruning, the minimum number of points needed for each leaf needs to beset, and for post-pruning, the reduced error technique is employed [Esposito
ACM Transactions on Sensor Networks, Vol. 6, No. 2, Article 13, Publication date: February 2010.

13:12 • S. Reddy et al.
et al. 1997]. The KMC classifier requires the number of clusters to be chosen apriori. Setting the cluster number to 5, which is also the number of classes inthe system, results in the most accurate classifier.
In the NN model, the number of closest neighbors to consider is 1. Higherorder nearest neighbor classifiers are not used since they do not provide signif-icant increase in classification accuracy and require more distance instances tobe maintained for classification. For the SVM classifier, a linear kernel was cho-sen as the basis for the hyperplanes due to its short training time and featuretransformation computation simplicity. Since the system has multiple classesto consider, pairwise binary classifiers are created for the different states, andclassification is performed by finding the class with the highest number of votesfor the input feature space.
The CHMM has five hidden states corresponding to the transportation modesand the output symbols are the accelerometer and GPS receiver features mod-eled as independent multi-variate Gaussian distributions. The two-stage sys-tem uses an instance based classifier followed up by a DHMM where the in-stance based classifier directly uses the raw features and the DHMM is trainedby the class posterior probabilities of the instance based classifier. Thus, theDHMM output symbols are the initial classifications and the hidden statesare the transportation modes. The state transition probabilities are set for theHMMs based on eliminating transitions that are unlikely to happen, such asgoing from biking to running or motorized transport to biking. The specific val-ues were chosen empirically by testing on labeled transportation mode traces.Alternative approaches for modeling the HMM structure include using feweror more hidden states, however this would result in hybrid modes that wouldhave to be reinterpreted back to the base set of five transportation modes thatare desired as output for classification. Furthermore, the classifier could consistof several HMMs corresponding to each of the different transportation modeswith the features being used to figure out which HMM a sequence best matches,but this structure would not provide a method to smooth transportation modeinferences based on transition probabilities.
4. EXPERIMENTAL SETUP
This section details the hardware platform, software setup, and the data col-lection involved in creating the transportation mode classifier. Specifically, weprovide information on the type of cell phone used along with the exact soft-ware setup involved in the training, testing, and final implementation for thesystem.
4.1 Hardware Platform
The system is implemented on the Nokia n95 [Nokia 2008]. This device waschosen due to its sensing functionality and form factor. Along with its 332 MHzARM processor and 128 MB of RAM, it contains a three axis accelerometer witha sensitivity of +-2G and that can sample at 32 Hz and a built-in GPS receiverthat can sample at 1 Hz. Furthermore, a WiFi radio that can scan at 0.33 Hz,GSM cell radio that can sample at 1 Hz, and a Bluetooth radio that can scan
ACM Transactions on Sensor Networks, Vol. 6, No. 2, Article 13, Publication date: February 2010.

Using Mobile Phones to Determine Transportation Modes • 13:13
at .08Hz are included in the device as well. The capacity of included battery is950 mAH.
4.2 Software Setup
To evaluate different classification schemes, the Weka Machine LearningToolkit and the Generalized Hidden Markov Model library were employed[Witten and Frank 2005; GHMM 2008]. The final chosen classifier is run onthe Nokia n95 and programmed using Python for Symbian S60. Python waschosen since it enables rapid development, porting to other platforms, and doesnot have code signing restrictions that require user involvement for the sensingoperations.
4.3 Data Collection
The data set used for training and testing of the transportation mode classi-fier was obtained by asking sixteen individuals, eight male and eight femalebetween the ages of 20-45, to gather fifteen minutes of data while outside foreach of the five transportation modes. The volunteers performed the activitiesin an urban setting with six phones attached simultaneously — positioned onthe arm, waist, chest, hand, pocket, and in a bag with orientations set accord-ing to their preference. Accelerometer, GPS, WiFi, and GSM information wereobtained according to the sample rates described earlier. In order to have GPSspeed information available throughout the data collection, a GPS lock wasobtained initially and the participants were advised to keep the keypad of thephone in the exposed position (slid open). In general, keeping the keypad in theexposed position (as instructed by the Nokia n95 manual) enabled us to main-tain a consistent GPS lock even when the phone is covered by clothing or placedinside a bag. The participants had a choice of using a back-pack, fanny-pack,or a tote (large open purse).
Instructions were given as to the duration of each activity needed and par-ticipants were advised to represent different styles with which they would per-form each activity. The volunteers concentrated on one transportation mode ata time and performed all five consecutively during their data collection session.Ground truth annotations were controlled by the individuals, and post filteringwas performed to eliminate ambiguous states (being stationary on a bike orin motorized transport). The total amount of data collected across all sixteenindividuals was 120 hours, compromised of 1.25 hours of data per position (six)per individual (sixteen).
In addition to the collection described above, two additional data gather-ing efforts were performed. The second data collection involved one volunteer(who was involved in the primary collection) running the classification systemwhile annotating transportation modes during everyday operation in typicaland challenged environments. More information in regards to this data col-lection is provided in Section 5.4. The third data collection involved sixteenindividuals annotating their full day (on average 23.2 hours with a minimumof 20.7 hours and a maximum of 26.8 hours) in terms of transportation modesand indoor/outdoor status while collecting the GSM cell tower identifier (1 Hz).
ACM Transactions on Sensor Networks, Vol. 6, No. 2, Article 13, Publication date: February 2010.
13:14 • S. Reddy et al.
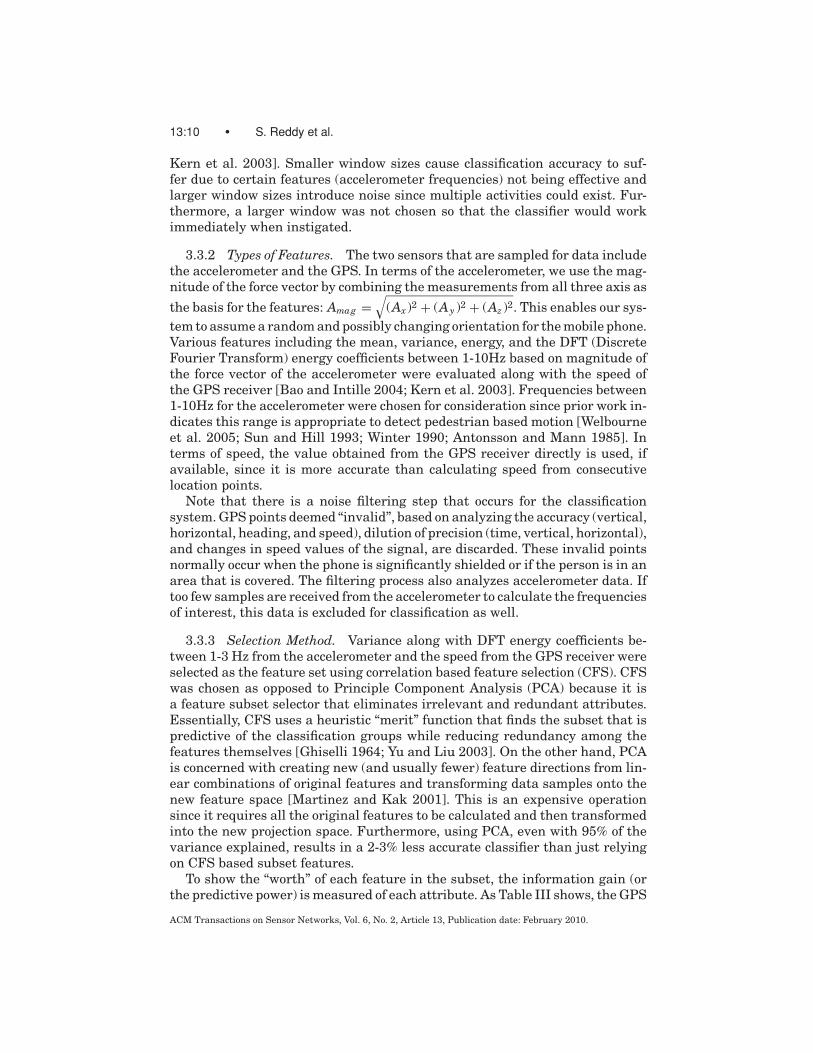
Table IV. Precision Results for Classifiers
Still Walk Run Bike Motor All
DT 95.0 87.6 95.5 84.5 93.9 91.3KMC 54.0 81.0 98.5 45.6 98.9 75.6
NB 88.4 88.1 93.5 75.6 71.3 83.4
NN 96.4 87.3 93.3 84.8 92.7 90.9
SVM 90.7 88.8 95.9 81.6 97.8 91.0
CHMM 89.2 90.0 94.3 80.5 77.6 86.3
DT-DHMM 95.5 92.4 96.4 87.9 96.2 93.7
Table V. Recall Results for Classifiers
Still Walk Run Bike Motor All
DT 97.2 88.4 91.9 85.3 93.4 91.3KMC 99.7 75.3 81.0 34.8 63.2 70.8
NB 97.2 77.4 94.2 51.2 95.3 83.0
NN 96.6 88.0 92.9 84.2 92.9 90.9
SVM 97.4 86.9 92.7 87.1 89.4 90.7
CHMM 97.5 79.0 94.7 63.5 95.9 86.1
DT-DHMM 97.8 90.8 94.4 90.6 94.5 93.6
The annotated days consisted of 8 weekday and 8 weekend periods. This datasetis used to evaluate our algorithm for turning on transportation mode classifi-cation only when an individual is outside.
5. RESULTS
In order to analyze the performance of the transportation mode classifier, threedistinct metrics are employed: accuracy, precision, and recall [Compumine2008]. The testing setup has even numbers of every class so the overall ac-curacy is simply the average of the recall values for each of the transportationmodes [Witten and Frank 2005]. The first test below, which shows a compar-ison of different types of classification models, uses the precision and recallattributes to measure performance. Having both metrics enables an intuitivefeel for the behavior of the individual classification techniques. For the place-ment and user based tests, the accuracy measure is only used since the precisionand recall values are similar.
5.1 Classification Accuracy
To test the different instance based classifiers, 10-fold cross validation is em-ployed where the folds contain equal amounts of each activity and are made upoff random continuous segments from the experiment data set. Table IV and Vshow the precision and recall values for the classifiers. In terms of the instancebased classifiers, the DT is the most effective with an overall precision and re-call levels both equal to 91.3%. The DT had 31 nodes, 16 leaves, and a depth of7 levels. When the DT was combined with a DHMM, the precision and recallimprove to 93.7% and 93.6%. Thus, our final classification system, Figure 2, ismade up of these two classifier modules combined together. The output of theclassification system is the transportation mode with the associated time andGPS location information.
ACM Transactions on Sensor Networks, Vol. 6, No. 2, Article 13, Publication date: February 2010.

Using Mobile Phones to Determine Transportation Modes • 13:15
Fig. 2. Structure of Overall Classifier.
It is plausible that the DT and DHMM combination is the most accurate(combining the other instance based classifiers with the DHMM results in loweraccuracy) since the DT is tuned to differentiate between the boundaries of trans-portation modes, and the DHMM eliminates noise based on temporal knowledgeof the previous transportation mode and the likelihood of transitioning into thenext mode. The DHMM is especially useful in helping fix problems with thenon-stationary states. For instance, there are cases where being on a bike ex-hibits similar feature characteristics as running (especially if the individual ispeddling fast) but since its unlikely that there will be transition from biking torunning this inference is corrected. The same idea applies for the other statesthat were improved by the two-stage classification system. Our classificationsystem is similar to the one employed by Lester et al. [2005] in that discrimina-tive (DT) and a generative (DHMM) models are used in conjunction [Jaakkolaand Haussler 1999]. But our work differs in that our system uses a single DTand DHMM pair that models likely transitions between transportation modesinstead of an ensemble of classifiers feeding into several HMMs that representeach class. The single DHMM with all transportation modes and transitionprobabilities modeled was the most effective structure for type of errors (out-lined above) that were encountered with the DT.
Details in regards to why the other classifiers do not perform as well or arenot employed in the final classification system are provided below. The KMCalgorithm has lower accuracy levels since the features do not naturally clusterinto separable class spaces needed for classification (especially with the bikingstate). The NB algorithm effectiveness suffers since the probabilistic indepen-dencies among the features does not hold - speed, variance, and DFT energycoefficients (1-3Hz) are related to certain extent in terms of the classes. Forthe CHMM, the fact that in the system several of the classes have features,or outputs in CHMM terminology, that overlap in terms of their multi-variateGaussians makes the accuracy of the classifier to be lower. The SVM classi-fier has high accuracy but its performance is still lower than the DT. The NN
ACM Transactions on Sensor Networks, Vol. 6, No. 2, Article 13, Publication date: February 2010.
13:16 • S. Reddy et al.
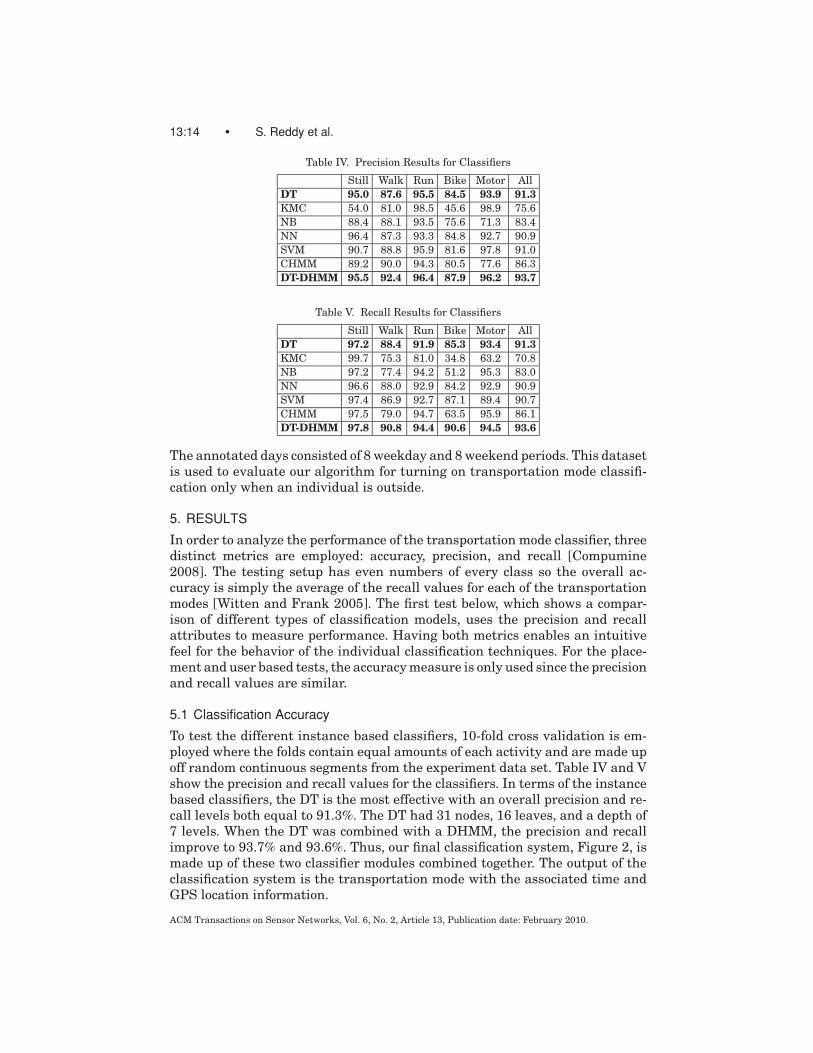
Table VI. Phone Position and
Accuracy
DT+HMM
All Positions 93.6
Arm 94.9
Bag 94.8
Chest 94.5
Hand 95.0
Pocket 94.3
Waist 94.4
method is specifically not preferred due to its computation footprint since dis-tance calculations between every instance in the training set needs to be madefor an inference to take place.
5.2 Device Placement Variation
Given the goal of user convenience, we investigated how phone placement af-fects transportation mode accuracy [Bao and Intille 2004; Lester et al. 2006].Mobile phones are often carried by individuals at different positions, and requir-ing a set position is inconvenient. For instance, males often attach their mobilephones to a belt holder and carry them in their pocket; females often put theirphones in a bag; and individuals that are performing exercise often attach thephone to the arm or chest area. For testing purposes, a general DT+DHMMthat is trained on data from all six positions (arm, bag, chest, hand, pocket,waist) and individual DT+DHMMs trained on data from specific positions werecreated using 10 fold cross validation.
The results, shown in Table VI, indicate that a generalized classifier is onpar in performance to ones trained on specific positions. The average accuracydecrease for the generalized classifier is only 1.1%. Thus, a generalized classifiercan be created so that the user can be agnostic about where to position thephone and still obtain accurate transportation mode inferences. In terms of theposition specific results, the pocket, waist, and chest have lowest accuracy levelssince these can be impacted by body motions such as bending, swaying andtwitching. The arm and hand positions were the most accurate. Transportationmodes such as walking, biking, and running have “strides” that show up atthese positions. Placing the phone in a bag enables high inference accuracysince this position has less variability in movement and is near the body.
The generalized classifier has additional features that make it convenientfor users. For instance, a set orientation is not required for the phone since theforce vector is used for the basis of the accelerometer features and speed of theGPS is employed. Furthermore, the device can be placed inside typical clothesand bags or exposed externally. None the less, the system does have some draw-backs. Currently, the Nokia n95 keypad needs to be in the exposed position inorder to obtain a GPS lock quickly and maintain it in a consistent fashion. Thisphone configuration is the recommended operation mode for our transporta-tion mode classifier. However, if the phone is in a closed state, our experimentsshow that the system still performs well by sacrificing quantity of outputs to
ACM Transactions on Sensor Networks, Vol. 6, No. 2, Article 13, Publication date: February 2010.

Using Mobile Phones to Determine Transportation Modes • 13:17
Table VII. DT+DHMM User Specific
Classification Accuracy Results
User 1 94.5 User 9 96.0
User 2 97.9 User 10 97.6
User 3 93.3 User 11 93.4
User 4 93.8 User 12 96.6
User 5 92.7 User 13 96.3
User 6 96.8 User 14 96.8
User 7 98.0 User 15 95.2
User 8 97.1 User 16 96.7
Average 95.8
maintain performance - filtering occurs to get rid of lower quality GPS signalsby analyzing dilution of precision, accuracy, and changes in speed values, andin general GPS locks are often lost or not maintained in this phone configura-tion. It is important to note that this preference of leaving the keypad in theexposed position is device dependent since the GPS quality issue does not existfor the iPhone or TMobile G1 platform where preliminary tests have indicatedthat the GPS works well without any restrictions on how the device shouldbe configured. Finally, if the phone is placed in a location that is significantlyshielded, the device is not able to obtain GPS speed values and does not func-tion. These types of situations include putting the device significantly distantfrom windows in motorized transport or covering the phone with a very thickmaterial. As future work, we plan to explore a system that can intelligentlyback-off to using less accurate speed estimates derived from network endpointbased features/localization techniques when GPS is not available [Mun et al.2008; Welbourne et al. 2005].
5.3 User Variation
Another factor related to user convenience is whether a generalized classifiercan be created that would work for new users without individual user-specifictraining [Bao and Intille 2004; Lester et al. 2006]. To test the feasibility ofsuch a system, two distinct experiments are performed with the DT+DHMMcombination: (1) user specific mode where only a particular user’s data is usedfor training and testing purposes with 10-fold cross validation and (2) leave oneuser out mode where the classifier is trained with all but one user (fifteen outof sixteen) and tested with the user not in the training set.
Table VII shows results from the user specific mode testing. When trainingand testing is done on an individual user basis, the accuracy increases by 2.2%compared to a generalized classifier that is trained and tested on all individ-uals. Thus, creating user specific classifiers would help in terms of classifierperformance, although the increase in accuracy is minimal when compared tousing a generalized classifier. With leave one user out mode, an average accu-racy of 93.6% and a minimum accuracy of 88.2% is obtained. Table VIII showsthe results for all sixteen users. Based on the results, one can conclude thatcertain users might be unique and a training set that has a broad range ofhow activities could be performed is necessary. In fact, for the user’s that hadthe worst performance in terms of accuracy (user’s #3, #5, #11, and #15), the
ACM Transactions on Sensor Networks, Vol. 6, No. 2, Article 13, Publication date: February 2010.

13:18 • S. Reddy et al.
Table VIII. DT+DHMM Leave One User Out
Accuracy Results
User 1 93.0 User 9 93.1
User 2 93.4 User 10 96.8
User 3 88.2 User 11 91.6
User 4 92.9 User 12 95.7
User 5 90.9 User 13 92.2
User 6 96.3 User 14 95.2
User 7 95.6 User 15 91.0
User 8 96.4 User 16 95.7
Average 93.6
decrease in performance mainly came in the walking, running and biking activ-ities for which individuals often have different styles both in terms of intensityand speed.
Overall, the results of two experiments indicate that it is possible to achievegood performance without requiring users to provide specific training data aslong as the training set contains enough variation in terms of each activity.Furthermore, obtaining this variation could be done with few participants inthe training set and may not require a large mass of individuals. Even withfifteen individuals, the minimum accuracy level was still above 88%. However,testing involving a larger population is needed to validate the hypothesis madebased on this specific study.
5.4 Extended Transportation Mode Traces
Thus far, the classifier has been evaluated based on the explicit data collectionperformed by our base set of sixteen users. But we were interested in deter-mining how the DT+DHMM classifier would perform in “everyday” use. Thus,we asked one of the individuals involved in our initial study to carry the mo-bile phone running the classifier over a period of four weeks and to documentinstances of each of the transportation modes when possible. The idea was toobtain longer traces of each of the modes to test the classifier’s performanceand to learn about scenarios where the classifier was not as effective, which wecould only do by using the classifier in everyday situations. Since document-ing ground truth labels for the transportation modes is an inconvenient andsometimes even a dangerous process, we allowed the volunteer to not have todocument instances of being still when annotating modes that were not sta-tionary (i.e., being still at a red light while in motorized transport, waiting atan intersection when walking or biking, or resting during sessions of running).We note that for our classifier these ambiguous instances will be outputted asstill. This is done so that applications using the transportation mode classifiercan handle these situations based on their specific requirements (i.e., a sys-tem to monitor physical activity would handle these cases differently from animpact/exposure measuring service). The participant had the liberty of carry-ing the device in any orientation and position that was desired, but instructionswere given to have the phone keypad in the exposed position whenever possi-ble in order to obtain and maintain a GPS lock. The results from the extendedtransportation mode traces are presented in Table IX and show clearly that
ACM Transactions on Sensor Networks, Vol. 6, No. 2, Article 13, Publication date: February 2010.

Using Mobile Phones to Determine Transportation Modes • 13:19
Table IX. DT+DHMM Accuracy for Extended
Transportation Mode Traces
Transportation Mode Length (Minutes) Accuracy
Still 236 95.6%
Walk 227 96.8%
Run 103 91.0%
Bike 156 92.8%
Motor 345 93.9%
the DT+DHMM classifier is effective even in longer term everyday use. Theaccuracy (on average 94.0%) is similar to the performance that was found whenanalyzing our base set of sixteen users.
The transportation modes that had lower performance were motorized trans-port, biking, and running. For the case of motorized transport, the errors wereintroduced during slow acceleration after being stopped in traffic. These mo-torized transport instances were mistaken as biking since coasting on a bike(not peddling) is similar in terms of accelerometer and speed information. Also,the DHMM was not as effective in fixing these problems since slow travel oc-cured for an extended period of time. The errors associated with biking andrunning came from misclassification as walking. In terms of biking, these er-rors occurred when the participant initially started biking after stopping fora period of time, and for running, the majority came up during slower speedswhere the state could be considered either running or walking. We are exploringsmoothing techniques, such as considering a window of transportation mode ac-tivity instead of just the previous classification for the DHMM, to help fix theseparticular problems.
In addition to analyzing the classifier performance in extended traces, wewere interested in the accuracy when the system was intentionally used inchallenging urban environments. Thus, we advised our volunteer to performdata collection in urban canyons (streets that are in between blocks of largebuilding structures). Overall, close to 3.5 hours of data was gathered in thisspecific environment with each transportation mode consisting of at least 30minutes. The resulting classifier had an average accuracy of 92.6%. Still, walk-ing, and motorized transport performed the best with over 95% accuracy, whileboth biking and running states had lower accuracies of around 88%. Surpris-ingly the motorized transport state had a high accuracy, but from analyzing thetraces this could be due to the fact that the travel that occurred did not involveextended periods of slow traffic. The biking and running errors were again dueto mistaken outputs of walking. The path errors caused by the urban canyonsseem to affect the lower end speeds more. In general the classifier performedat an adequate level, but improvements can be made by incorporating morechallenged environment ground truth in the base training set.
5.5 Memory and CPU Benchmarks
In addition to the generalizability of the classifiers, the amount of resources interms of CPU and memory (RAM) that the transportation mode classifier takesup while running on the Nokia n95 is of interest. Using the Nokia Energy Pro-filer, twenty minute trials were performed (where the individual metrics were
ACM Transactions on Sensor Networks, Vol. 6, No. 2, Article 13, Publication date: February 2010.

13:20 • S. Reddy et al.
Table X. Memory and CPU Usage for Various
Applications
Activity CPU % RAM (MB)
Phone Idle 2.18 28.91
Active Call 2.31 30.00
Music Player 30.86 30.26
Video Player 14.63 32.58
Game Playing 97.34 37.52
Transport Mode 6.91 29.64
Table XI. Power to Operate Various Sensor
Types, Communication Methods, and
Applications
Activity Power (Watts)
Phone Idle 0.054
Cell Sampling 0.056
Accelerometer Sampling 0.111
Bluetooth Sampling 0.233
GPS Assisted Lock 0.718
GPS Normal Lock 0.407
GPS Sampling 0.380
WiFi Sampling 0.230
Music Player 0.447
Video Player 0.747
Active Call 0.603
Gaming 1.173
Transport Mode 0.425
averaged over the time span of the tests) that compared the resources usedby the transportation mode classifier to other activities that normally occur onthe phone. Table X shows the results. The CPU resources used represents thepercentage of overall CPU taken up and the memory usage shows the amountof RAM in megabytes used. The transportation mode classifier uses CPU re-sources (6.91%) far below optional services, such as playing games, music, orvideos, and the memory usage of the classifier is just above the phone being idle(29.64 megabytes). Thus, running the classifier will not significantly impact theperformance of other applications that a mobile phone user might run. The fea-ture extraction and DT+DHMM classifier takes up 1.85% of the CPU whilethe sampling makes up 2.88%. The sampling CPU usage is due to the sensorcallbacks being setup and called. For instance, the accelerometer callback getsinitiated roughly 32 times per second. The feature calculations and classifieroutput only get processed every one second. Thus, the processing involved forthe classifier is not significant.
5.6 Energy Consumption
The energy consumption of the classifier is important. Table XI contains theenergy usage of the transportation mode classifier along with information inregards to sampling various sensors and performing tasks on the mobile phone.
ACM Transactions on Sensor Networks, Vol. 6, No. 2, Article 13, Publication date: February 2010.

Using Mobile Phones to Determine Transportation Modes • 13:21
The results were obtained by analyzing 5 - twenty-minute trials for each of theactivities. Furthermore, the screen was off for all the tests except for video play-back and game execution which require the screen to be active to run. The GPSand GSM sensors were sampled at 1 Hz, WiFi at 0.33Hz, and the accelerome-ter reported readings on average at 32 Hz. The BT radio scans occurred every10-15 seconds since this operation takes a longer time to complete.
The transportation mode classifier power usage (0.425 watts) is on par withplaying music (0.447) while far below taking phone calls (0.603), watchingvideos (0.747), or playing video games (1.173). The power usage for process-ing features and running the classifier is relatively small (0.003). Thus, most ofpower required for the system is used up for sampling. Note that the Goertzelalgorithm is employed to calculate the frequency components since only cer-tain frequencies are desired [Welbourne et al. 2005; Goertzel 1958]. Runningonly the classifier on a typical Nokia n95 battery (950mAH) in an outdoor set-ting would result in 8.27 hours of operation. Overall, the transportation modeclassifier uses significantly less energy then “add-on” entertainment and voiceservices.
In calculating the energy footprint of the transportation mode classifier, thephone was placed in assisted GPS mode. But even with the assisted mode turnedoff, the power used is similar (this was verified through two longer tests com-paring assisted mode and non-assisted mode for 8 hours of transportation modeclassification in non-scripted everyday operation). This is because the assistedservice is used to improve the time to first fix (TTFF) for the GPS. In assistedmode, information about the currently seen cell towers is sent to an assistedserver which then uses this data to provide signal parameters, which are afunction of the mobile phone’s location, to reduce the GPS TTFF period. Basedon observations with the Nokia n95, the assisted service is typically engagedwhen the transportation mode classifier is initially started (first time a fix of aGPS is required - often referred to as a cold start) and in some occasions if aGPS lock has not been obtained and the location of the phone has changed sig-nificantly or if cell tower information is lost and re-obtained. In general, theseassisted server requests occur infrequently during operation, and even whenthe server is engaged the increased power usage (0.718 watts) occurs for twentyseconds on average (enough time to exchange information between the phoneand the server).
5.7 Energy-Aware Detection
Our objective is to create a transportation mode classifier that captures thebehavior of individuals when they are outside. Hence, it would be more energyefficient to only have the transportation mode classifier run when an individualis actually outdoors. The classifier can be turned off once GPS locks are lost fora period of time (indicating that the user is indoors). But the most effectivemethod to determine when the user is outdoors again is by sampling the GPSand analyzing the presence and quality of location information. Unfortunately,uniformly sampling the GPS for this purpose is power hungry (0.407 watts).Thus, instead of uniformly sampling the GPS receiver once the user loses a lock
ACM Transactions on Sensor Networks, Vol. 6, No. 2, Article 13, Publication date: February 2010.

13:22 • S. Reddy et al.
for a period of time, we propose a triggered approach that relies on changes inthe primary GSM cell tower.
The basic intuition of this method is that when individuals go from an indoorsetting to an outdoor setting they typically move in terms of distance. Movementtriggers the phone to lock onto different GSM cell towers, and attempting tosample the GPS when only changes occur to the primary GSM cell tower wouldbe more efficient in terms of energy usage then blindly uniformly samplingthe GPS. Essentially, changes in GSM cell towers are being used to determinethe start of outdoor trips. Sampling and processing the GSM cell tower is alow energy cost operation with only 0.056 watts being used, which is 0.002watts more than the idle state. In the GSM triggered based method, filteringis employed to eliminate the “ping pong” effect where the connected cell towerchanges back and forth when stationary. Essentially, the filter clusters the pairsof cell tower identifiers that exhibit this behavior in a high frequency [Ravi et al.2008].
To test the performance of the GSM triggered approach, day traces fromsixteen individuals, who labeled indoor/outdoor status and collected GSM celltower data every 1 second, was analyzed. The total time of the day trace datacollection was on average 23.2 hours with a minimum time of 20.7 hours anda maximum time of 26.8 hours. The corresponding outdoor time is on average3.09 hours with a maximum of 12.0 hours and a minimum of 0.93 hours. Thenumber of outdoor events is 114. The GPS lock period is set to 60 seconds, andwe assumed that locks would be successful when triggered outdoors during thattime period.
The results of the GSM triggered approach show that, for the sixteen users,the average percentage of outdoor time identified is 91.5%, the average numberof GPS checks is 68, and the total number of missed outdoor events is only 10.The missed events were on average less than 2 minutes with the longest beingonly 7 minutes. Most of the missed events were cases where the user steppedoutdoors and then back indoors rapidly. In our application space, these eventsare not as important because they do not represent a significant transportationevent. Comparing the GSM triggered approach to optimally uniformly samplingthe GPS to achieve at least the same amount of outdoor time identified resultsin a 12.4% energy savings, even with the additional energy needed to obtaincell tower information, due to fewer GPS checks (73 on average) that needed tobe made. The optimal uniform sampling rate is obtained by analyzing all datato figure out the ideal sampling rate based on the requirements for the amountof outdoor time needed to be represented, and since analyzing data a priori isnot possible in a real application setting, the energy savings estimate is worstcase (most conservative).
In summary, the GSM triggered approach is a very promising mechanism tosave energy for obtaining transportation annotated mobility information. Theindividuals involved in our dataset were mainly in urban or sub-urban areas.In rural areas, where GSM cell towers are located with less density, largerportions of the start of the trip might not be recorded. However, the missingdata can be approximated by analyzing where the individual lost GPS previ-ously and filling in the gap accordingly. Overall, there exist other optimization
ACM Transactions on Sensor Networks, Vol. 6, No. 2, Article 13, Publication date: February 2010.
Using Mobile Phones to Determine Transportation Modes • 13:23
techniques that could be employed to help make obtaining transportation modeannotated mobility information even more energy efficient. Our current methodis just a start, and alternatives techniques should be further explored. For in-stance, accelerometer or WiFi changes along with GSM can be used for out-door event triggers and the GPS sampling could be adapted using a back-offscheme [Nokia-Research 2009; Constandache et al. 2008] or by using contextualinformation such as time of day, day of week, and area of usage [Constandacheet al. 2009]. We discuss such energy optimization techniques along with otherfuture work in the discussion section.
6. DISCUSSION
The transportation mode classification results derived from the user base ofsixteen individuals are very promising. The classification system is accurateregardless of position or orientation of sensors, and a generic classifier is feasiblethat works for different individuals without user-specific training or relyingon external indexes. The results provide design strategies that industry couldemploy to include transportation mode classification as a first order service onmobile phones.
There are opportunities to tune the classification method even more. Forinstance, it would be interesting to investigate if user input, in terms of howthe phone is used, could improve accuracy. One can imagine an initial surveybeing given to the user that asks types of transportation modes that are per-formed and then tuning the classifier based on this knowledge. Furthermore,location dependent user-specific models can be built to distinguish betweenthe type of motorized transport (car, bus, train) used through in-situ experi-ence sampling. This method could also help in determining when cases of un-derground transport have occurred, which is currently not supported by oursystem due to the lack of GPS information. Another area of further work isin making the classification system more robust to loss of sensor availability.If a GPS lock is not available or has poor quality, the classifier could backupto using WiFi or GSM features to help determine speed. Judging the valid-ity of the WiFi and GSM features will be a key factor in how successful thismethod will be since the type of environment an individual is in affects theirusefulness.
Also, research is warranted to make the classification method more energyefficient. Currently, this work focuses solely on efficiently detecting when an in-dividual is outdoors to shutdown activity classification when indoors. But whena user is outside, it might not be necessary to sample the transportation modeclassifier every second (this is, in fact, dependent on application requirements).For instance, the work of Krause et al. [2005] suggests that selective samplingtechniques, such as ones based on entropy, can be employed while still achievinghigh accuracy. Alternatively, one might use low-power sensors to detect changesin transportation modes and then employ more accurate, higher power sensorsto detect the exact type of mode change while still collecting location infor-mation in the background. This type of technique has been applied to reducelocalization energy costs [Constandache et al. 2009] but not yet in the realm of
ACM Transactions on Sensor Networks, Vol. 6, No. 2, Article 13, Publication date: February 2010.

13:24 • S. Reddy et al.
transportation mode classification. Finally, the location module and classifiersystem could consider the cost of capturing and processing of sensing modalitiesto control the tradeoff between accuracy and energy consumption. For example,when the battery is low and the likelihood of having a recharge soon is small, itcould be more helpful to obtain less confident location and transportation modepredictions for a longer period of time as opposed to using the high power sen-sors to get more accurate inferences for a shorter period [Banerjee et al. 2007;Ravi et al. 2008].
Another interesting area of work is how device differences (Nokia n95 vs Ap-ple iPhone or TMobile G1) affects the makeup of the classifier. Our preliminarytests with alternative platforms indicate that the features and the classifica-tion setup is robust to such changes. In fact, the classifier created through thedata collection obtained on the Nokia n95 was ported with high accuracy to theTMobile G1 platform by simply scaling the accelerometer data appropriately.But a more thorough characterization using GPS and accelerometers with dif-ferent sensitivity characteristics and varied device integration positions needsto be completed.
7. CONCLUSION
We created a transportation mode classification system, employing a DT fol-lowed by a DHMM, that distinguishes between being stationary, walking, run-ning, biking, and in motorized travel when an individual is outside using amobile phone equipped with a GPS receiver and an accelerometer. The systemis convenient for a user by not having strict position and orientation require-ments while still achieving a high accuracy level of 93.6%, based on a datasetof one hundred and twenty hours of data from sixteen users. Furthermore,the classifier does not rely on external spatial indexes such as GIS data orhistorical usage patterns and works well even without user-specific traininginformation.
REFERENCES
AGAPIE, E., CHEN, G., HOUSTON, D., HOWARD, E., KIM, J., MUN, M., MONDSCHEIN, A., REDDY, S., ROSARIO,
R., RYDER, J., STEINER, A., BURKE, J., ESTRIN, D., HANSEN, M., and RAHIMI, M. 2008. Seeing our
signals: Combining location traces and web-based models for personal discovery. In Proceed-ings of the 9th Workshop on Mobile Computing Systems and Applications. ACM, New York,
6–10.
ANDERSON, I., AND MULLER, H. 2006. Practical activity recognition using GSM data. Technical
Report CSTR-06-016, Department of Computer Science, University of Bristol.
ANTONSSON, E. AND MANN, R. 1985. The frequency content of gait. J. Biomech. 18, 1, 39–47.
BANERJEE, N., RAHMATI, A., CORNER, M., ROLLINS, S., AND ZHONG, L. 2007. Users and batteries:
Interactions and adaptive energy management in mobile systems. In Lecture Notes in Computer
Science vol. 4717. Springer-Verlag, Berlin, Germany.
BAO, L. AND INTILLE, S. 2004. Activity recognition from user-annotated acceleration data. In Lec-
ture Notes in Computer Science. Springer-Verlag, Berlin, Germany, 1–17.
BODYMEDIA. 2008. Sensewear wms. http://www.sensewear.com/images/WMSbrochure.pdf.
BURKE, J., ESTRIN, D., HANSEN, M., PARKER, A., RAMANATHAN, N., REDDY, S., AND SRIVASTAVA, M. 2006.
Participatory sensing. In World Sensor Web Workshop. ACM, New York, 1–5.
CARBONHERO. 2008. Carbon diem - Is that knowledge now. http://carbondiem.com.
ACM Transactions on Sensor Networks, Vol. 6, No. 2, Article 13, Publication date: February 2010.

Using Mobile Phones to Determine Transportation Modes • 13:25
CHEN, C., ANTON, S., AND HELAL, A. 2008. A brief survey of physical activity monitoring devices.
University of Florida Tech Report MPCL-08-09.
CHEN, M., SOHN, T., CHMELEV, D., HAEHNEL, D., HIGHTOWER, J., HUGHES, J., LAMARCA, A., POTTER, F.,
SMITH, I., AND VARSHAVSKY, A. 2006. Practical metropolitan-scale positioning for gsm phones. In
Lecture Notes in Computer Science 4206, Springer-Verlag, Berlin, Germany. vol. 225.
COMPUMINE. 2008. Evaluating a Classification Model. http://www.compumine.com/web/public/
newsletter/20071/precision-recall.
CONSOLVO, S., KLASNJA, P., MCDONALD, D., AVRAHAMI, D., FROEHLICH, J., LEGRAND, L., LIBBY, R., MOSHER,
K., AND LANDAY, J. 2008a. Flowers or a robot army?: Encouraging awareness & activity with
personal, mobile displays. In Proceedings of the 10th International Conference on UbiquitousComputing. ACM New York, 54–63.
CONSOLVO, S., MCDONALD, D., TOSCOS, T., CHEN, M., FROEHLICH, J., HARRISON, B., KLASNJA, P., LAMARCA,
A., LEGRAND, L., LIBBY, R., SMITH, I., and LANDAY, J. A. 2008b. Activity sensing in the wild: A
field trial of ubifit garden. In Proceedings of the 26th Annual Conference on Human Factors inComputing Systems. ACM, New York, 1797–1806.
CONSTANDACHE, I., GAONKAR, S., SAYLER, M., CHOUDHURY, R., AND COX, L. 2009. EnLoc: Energy-
efficient localization for mobile phones. IEEE Computer Society Press, Los Alamitos, CA. InfocomMini Conference
CONSTANDACHE, I., SAYLER, M., GAONKAR, S., CHOUDHURY, R., AND COX, L. 2008. Energy-aware local-
ization using mobile phones. Mobisys Poster. www.ee.duke.edu.
CROUTER, S., SCHNEIDER, P., KARABULUT, M., AND BASSETT JR, D. 2003. Validity of 10 electronic
pedometers for measuring steps, distance, and energy cost. Med. Sci. Sports Exercise 35, 8, 1455.
DENNING, T., ANDREW, A., CHAUDHRI, R., HARTUNG, C., LESTER, J., BORRIELLO, G., AND DUNCAN, G. 2009.
BALANCE: Towards a usable pervasive wellness application with accurate activity inference. In
Proceedings of the 10th IEEE Workshop on Mobile Computing Systems and Applications (Hot-Mobile 2009). IEEE Computer Society Press, Los Alamitos, CA.
DUDA, R., HART, P., AND STORK, D. 2000. Pattern Clasification. Wiley, New York.
ESPOSITO, F., MALERBA, D., SEMERARO, G., AND KAY, J. 1997. A comparative analysis of methods for
pruning decision trees. In Pattern Analysis and Machine Intelligence, IEEE Trans. 19. 476–491.
FABIAN, A., GYORBıRO, N., AND HOMANYI, G. 2008. Activity recognition system for mobile phones us-
ing the MotionBand device. In Proceedings of the 1st International Conference on Mobile WirelessMiddleware, Operating Systems, and Applications. ICST, Brussels, Belgium.
FARRINGDON, J., MOORE, A., TILBURY, N., CHURCH, J., AND BIEMOND, P. 1999. Wearable sensor badge
& sensor jacket for context awareness. In Proceedings of the 3rd International Symposium onWearable Computers. 107–113.
FROEHLICH, J., DILLAHUNT, T., KLASNJA, P., MANKOFF, J., CONSOLVO, S., HARRISON, B., AND LANDAY, J.
2009. UbiGreen: Investigating a mobile tool for tracking and supporting green transportation
habits. Computer Human Interaction (CHI). ACM, New York.
GANTI, R., JAYACHANDRAN, P., ABDELZAHER, T., AND STANKOVIC, J. 2006. SATIRE: A software archi-
tecture for smart AtTIRE. In Proceedings of the 4th International Conference on Mobile Systems,Applications and Services. ACM New York, 110–123.
GAONKAR, S., LI, J., CHOUDHURY, R., AND COX, L. 2008. Micro-blog: Sharing and querying content
through mobile phones and social participation. In Proceedings of the 6th International Confer-ence on Mobile Systems, Applications and Services. ACM, New York, 174–186.
GHISELLI, E. 1964. Theory of Psychological Measurement. McGraw-Hill, New York.
GHMM. 2008. The General Hidden Markov Model Library. http://ghmm.org.
GOERTZEL, G. 1958. An algorithm for the evaluation of finite trigonometric series. Amer. Math.Monthly 65, 1, 34–35.
HUYNH, T. AND SCHIELE, B. 2005. Analyzing features for activity recognition. In Proceedings Con-ference on Smart Objects and Ambient Intelligence. ACM, New York, 159–163.
IMPACTSPORTS. 2008. ePulse - Armband Heart Rate Monitor. http://impactsports.com.
JAAKKOLA, T., AND HAUSSLER, D. 1999. Exploiting generative models in discriminative classifiers.
Adv. Neural Info. Proc. Syst. 487–493.
KAO, J., LAM, R., PONG, G., TALUKDAR, T., AND WONG, J. 2008. Ecorio - Track Your Mobile Carbon
Footprint. http://ecorio.org.
ACM Transactions on Sensor Networks, Vol. 6, No. 2, Article 13, Publication date: February 2010.

13:26 • S. Reddy et al.
KARABULUT, M., CROUTER, S., AND BASSETT, D. 2005. Comparison of two waist-mounted and two
ankle-mounted electronic pedometers. Europ. J. Applied Physiology 95, 4, 335–343.
KERN, N., SCHIELE, B., AND SCHMIDT, A. 2003. Multi-sensor activity context detection for wearable
computing. In Lecture Notes in Computer Science, Springer-Verlag, Berlin, Germany, 220–234.
KRAUSE, A., IHMIG, M., RANKIN, E., LEONG, D., GUPTA, S., SIEWIOREK, D., SMAILAGIC, A., DEISHER, M.,
AND SENGUPTA, U. 2005. Trading off prediction accuracy and power consumption for context-
aware wearable computing. In Proceedings of the 9th IEEE International Symposium on WearableComputers. IEEE Computer Society Press, Los Alamitos, CA. 20, 25.
LAMARCA, A., CHAWATHE, Y., CONSOLVO, S., HIGHTOWER, J., SMITH, I., SCOTT, J., SOHN, T., HOWARD, J.,
HUGHES, J., POTTER, F., TABERT, J., POWLEDGE, P., BORRIELLO, G., and SCHILIB, B. 2005. Place lab:
Device positioning using radio beacons in the wild. In Proceedings of PERVASIVE. Vol. 3468.
Springer-Verlag, Berlin, Germany, 7.
LESTER, J., CHOUDHURY, T., AND BORRIELLO, G. 2006. A practical approach to recognizing physical
activities. In Lecture Notes in Computer Science, vol. 3968, Springer-Verlag, Berlin, Germany,
1.
LESTER, J., CHOUDHURY, T., KERN, N., BORRIELLO, G., AND HANNAFORD, B. 2005. A hybrid discrimi-
native/generative approach for modeling human activities. In Proceedings of the InternationalJoint Conference on Artificial Intelligence (IJCAI 2005).
LESTER, J., HURVITZ, P., CHAUDHRI, R., HARTUNG, C., AND BORRIELLO, G. 2008. MobileSense - Sensing
modes of transportation in studies of the built environment. In Proceedings of the InternationalWorkshop on Urban, Community, and Social Applications of Networked Sensing Systems. ACM,
New York.
LI, K., SOHN, T., HUANG, S., AND GRISWOLD, W. 2008. Peopletones: A system for the detection and
notification of buddy proximity on mobile phones. In Proceedings of the International Conferenceon Mobile Systems, Applications, and Services. ACM, New York.
LIAO, L., PATTERSON, D., FOX, D., AND KAUTZ, H. 2007. Learning and inferring transportation rou-
tines. Artif. Intell. 171, 5-6, 311–331.
MARMASSE, N., SCHMANDT, C., AND SPECTRE, D. 2004. WatchMe: communication and awareness
between members of a closely-knit group. In Lecture Notes in Computer Science. Springer-Verlag,
Berlin, Germany, 214–231.
MARTINEZ, A. AND KAK, A. 2001. PCA versus LDA. Patt. Anal. Mach. Intell. IEEE Trans. 23, 2,
228–233.
MILUZZO, E., LANE, N., EISENMAN, S., AND CAMPBELL, A. 2007. Cenceme-injecting sensing presence
into social networking applications. In Lecture Notes in Computer Science. vol. 4793. Springer-
Verlag, Berlin, Germany, 1.
MILUZZO, E., LANE, N., FODOR, K., PETERSON, R., LU, H., MUSOLESI, M., EISENMAN, S., ZHENG, X., AND
CAMPBELL, A. 2008. Sensing meets mobile social networks: The design implementation and
evaluation of the cenceMe application. In Proceedings of the 6th ACM Conference on EmbeddedNetwork Sensor Systems. ACM, New York. 337–350.
MOHAN, P., PADMANABHAN, V., AND RAMJEE, R. 2008. Trafficsense: Rich monitoring of road and traffic
conditions using mobile smartphones. In Proceedings of the Conference on Embedded NetworkedSensor Systems (SenSys). ACM, New York, 323–336.
MUN, M., ESTRIN, D., BURKE, J., AND HANSEN, M. 2008. Parsimonious mobility classification using
GSM and WiFi traces. In Proceedings of the 5th Workshop on Embedded Networked Sensors(HotEmNets).
MUN, M., REDDY, S., SAMANTA, V., SHILTON, K., HOWARD, E., LE, D., RAMANTHAN, N., BURKE, J., ESTRIN,
D., HANSEN, M., AND SRIVASTAVA, M. 2009a. CycleSense: Sensing and mapping for better biking.
In Proceedings of the Active Living Conference.
MUN, M., REDDY, S., SHILTON, K., YAU, N., BODA, P., BURKE, J., ESTRIN, D., HANSEN, M., HOWARD, E., AND
WEST, R. 2009b. PEIR, the personal environmental impact report, as a platform for participa-
tory sensing systems research. In Proceedings of the International Conference on Mobile Systems,Applications, and Services. ACM, New York, 55–68.
NIKE. 2008. Apple Computer, Inc., Nike+ iPod Sport Kit. http://apple.com/nike.
NOKIA. 2008. Nokia n95. http://www.nseries.com.
NOKIA-RESEARCH. 2009. Nokia simple context service. https://alpha.nokoscope.com/eb2/.
ACM Transactions on Sensor Networks, Vol. 6, No. 2, Article 13, Publication date: February 2010.
Using Mobile Phones to Determine Transportation Modes • 13:27
OMRON. 2008a. Omron hj-150. http://www.omronhealthcare.com/product/detail.asp?p=1129&
t=187.
OMRON. 2008b. Omron hj-720itc. http://www.omronhealthcare.com/product/1132-187-fitness-
diagnostics-pocket-pedometer-with-pc-software-hj-720itc.
PATTERSON, D., LIAO, L., FOX, D., AND KAUTZ, H. 2003. Inferring high-level behavior from low-level
sensors. In Lecture Notes in Computer Science, Springer-Verlag, Berlin, Germany, 73–89.
PETERSON, N., ESTRIN, D., AND BURKE, J. 2009. Project footstep - Linking physical activity with
location. http://urban.cens.ucla.edu/projects/footstep.
PHAM, N., AND ABDELZAHER, T. 2008. Robust dynamic human activity recognition based on relative
energy allocation. In Lecture Notes in Computer Science, vol. 5067, Springer-Verlag, Berlin,
Germany, 525–530.
RANDELL, C., AND MULLER, H. 2000. Context awareness by analysing accelerometer data. In Pro-ceedings of the 4th International Symposium on Wearable Computers. IEEE Computer Society
Press, Los Alamitos, CA, 175–176.
RAVI, N., SCOTT, J., HAN, L., AND IFTODE, L. 2008. Context-aware battery management for mobile
phones. In Proceedings of the 6th Annual IEEE International Conference on Pervasive Computingand Communications (PerCom2008). IEEE Computer Society Press, Los Alamitos, CA, 224–233.
REDDY, S., SAMANTA, V., BURKE, J., ESTRIN, D., AND SRIVASTAVA, M. 2009a. Walkability - Safe Walkable
Streets in Modern Cities. http://urban.cens.ucla.edu/projects/walkability.
REDDY, S., SHILTON, K., BURKE, J., ESTRIN, D., HANSEN, M., AND SRIVASTAVA, M. 2009b. Using context
annotated mobility profiles to recruit data collectors in participatory sensing. In Proceedings ofthe Symposium on Location and Context Awareness (LOCA). Springer-Verlag, Berlin, Germany.
SAPONAS, T., LESTER, J., FROEHLICH, J., FOGARTY, J., AND LANDAY, J. 2008. iLearn on the iPhone:
Real-time human activity classification on commodity mobile phones. University of Washington
CSE Tech Report UW-CSE-08-04-02.
SCHNEIDER, P., CROUTER, S., AND BASSETT, D. 2004. Pedometer measures of free-living physical
activity: comparison of 13 models. Med. Sci. Sports Exerc 36, 2, 331–335.
SKYHOOK. 2009. Skyhook Wireless: Coverage. http://www.skyhookwireless.com/howitworks/
coverage.php.
SOHN, T., VARSHAVSKY, A., LAMARCA, A., CHEN, M., CHOUDHURY, T., SMITH, I., CONSOLVO, S., HIGHTOWER, J.,
GRISWOLD, W., AND DE LARA, E. 2006. Mobility detection using everyday GSM traces. In Lecture
Notes in Computer Science, vol. 4206, Springer-Verlag, Berlin, Germany, 212.
SUN, M., AND HILL, J. 1993. A method for measuring mechanical work and work efficiency during
human activities. J. Biomech. 26, 3, 229–241.
TAPIA, E., INTILLE, S., AND LARSON, K. 2004. Activity recognition in the home using simple and
sbiquitous sensors. In Lecture Notes in Computer Science. Springer-Verlag, Berlin, Germany,
158–175.
WELBOURNE, E., LESTER, J., LAMARCA, A., AND BORRIELLO, G. 2005. Mobile context inference using
low-cost sensors. In Proceedings of the 1st International Symposium on Location and ContextAwareness. Springer-Verlag, Berlin, Germany, 254–263.
WIGLE. 2009. WiGLE - Wireless Geographic Logging Engine. http://wigle.net/gps/gps/Map/ on-
linemap2/.
WINTER, D. 1990. Biomechanics and Motor Control of Human Movement. Wiley, New York.
WITTEN, I. AND FRANK, E. 2005. Data mining: Practical machine learning tools and techniques.
Morgan-Kaufmann, San Francisco, CA.
YU, L. AND LIU, H. 2003. Feature selection for high-dimensional data: A fast correlation-based
filter solution. In Proceedings of the 20th International Conference on Machine Learning.
856–864.
ZHENG, Y., LI, Q., CHEN, Y., XIE, X., AND MA, W. 2008. Understanding mobility based on GPS data.
In Ubiquitous Computing. ACM New York, 312–321.
Received December 2008; revised April 2009; accepted June 2009
ACM Transactions on Sensor Networks, Vol. 6, No. 2, Article 13, Publication date: February 2010.