using modeling software for operations improvement (pdf format)
TRANSCRIPT

Using Modeling Software for Operations Improvement
Given the advances made in information technology, both hardware andsoftware, it has become possible to create software for operationsimprovement for use in the academic and small business environment that istechnically on-par with the most sophisticated product available. In this paperwe describe one such software, HOM: Operations Management Software forWindows and comment on its managerial orientation. We give examples of itsuse for case analysis. We briefly describe and compare HOM with similarsoftware available on the market and share some of our teaching experiences.
1. Introduction
We believe that for large and small organization's their operating system is a keysource of competitive advantage. While large organizations can rely on internalstaffs, well known consulting organizations (Anderson Consulting, A.T. Kearney,etc.) and complex and expensive software systems (SAP, BAAN, etc.) smallerindependent organizations or operations within these firms require a differentsolution approach. However, given the advances made in information technology,both hardware and software, the solution approach need not be technically inferior tothe most sophisticated product that is available on the market. Thus, we should beable to bring state-of-the art approaches for problem solving and improvement ofoperations into the small and medium business environment.
This can be achieved through creating software that illustrates the power ofalgorithmic, simulation, and model building approaches to solving large andcomplex problems faced by operations managers the world over; and provides a toolthat is not simply academic in content but one that can provide answers to practicingmanagers. It would also be useful for business school students, both undergraduateand graduate, who are trying to analyze cases and solve every-day problems faced byoperations managers. An overriding concern in the design and development of sucha system is that both individual students and practicing managers should be able tocome up to speed and be able to use the software within a short period of time andwith minimal learning effort.
These systems should be also based on two somewhat overlapping concepts. First,we must recognize that managers understand the problem environment and theavailability of data in a language that is different from that required to develop and
Volume 6, Number 3September 2000, pp.1-25Received: February 2000Accepted: September 2000
Michael MosesSridhar Seshadri
Stern School of BusinessNew York University44 West 4th St. #7-60
New York, NY 10012-1126, USA([email protected])([email protected])

USING MODELING SOFTWARE2
implement technical solutions to their problems. Second, the trade off betweenproblem precision and rapid scenario evaluations should always come down on theside that facilitates the latter. Thus, the software system should stress manageriallyoriented data inputs and problem formulation philosophy. Therefore, the “real”technology or the engines for optimization and simulation are hidden from thedecision maker. What are visible to the user are the screens and dialog boxes forstating the problem in managerial language. Alternative scenario analysis should befacilitated by having it built in whenever possible or with simple, user initiatedparameter selection windows. Every attempt should be made to keep the problemformulation, analysis, and report generation format consistent across differentproblem environments. These design features underscore the decision analyticalframework and the need for software to have minimal learning cost.
At a minimum, the problem solving environments should address the followingfive key competitive advantage drivers:
1. Process and customer service improvements by process analysis and waitingline management
2. Response time improvement by time management and process analysis.3. Quality management using statistical process control and acceptance
sampling.4. Supply chain management by inventory modeling and material requirement
planning5. Capacity management by forecasting and aggregate planning.In the next section, we give an overview of the software system (HOM) we
developed for use in the small business and academic environments keeping thedesign considerations discussed in view. We highlight the features of HOM that havebeen specially crafted to better explain the managerial implications of the OperationsManagement techniques; and also briefly comment upon the design challenges indeveloping such a software. In Section 3, we describe how to use HOM. In Section4, we give two examples of the use of HOM to analyze case studies. In Section 5, wecompare HOM to two other substantial but inexpensive software systems availablefor students and businesses, Win QSB created by [1] and POM for Windowsdeveloped by [10]. We conclude in Section 6, with some of our teaching experiencewith HOM.
2. Software Overview
An overview of the capabilities of the HOM software system is given below inTable 1. The special features of the individual modules are then described.
2.1 Process AnalysisAt the present, other than HOM, no low-cost-process-analysis software exists. This
is indeed a limitation for solving process design or process improvement problems.Process analysis is at the heart of Operations Management. It provides insights intoproduct cost and flow time. Service guarantees can not be crafted without recourse tosuch analysis. It addresses capacity management, which is often the starting point forany analysis of operations. The Process Analysis module of HOM can be used tomodel up to 15 products or services. Each product has a unique task sequence, andcan be assigned a unique priority, and lot size. The module is capable of modeling

USING MODELING SOFTWARE3
Table 1Competitive Advantage from Operations Using HOM
Competitive Advantage Driver HOM Software Module• Process Improvements • Process Analysis
• Waiting Line Analysis• Supply Chain Management • Independent Demand Inventory Systems
• Material Requirements Planning (MRP)• Facility Location & Transportation
(Forthcoming)• Time to Market • CPM-PERT-Crashing
• Process Analysis• Capacity Management • Forecasting
• Aggregate Planning• Quality Management • Statistical Process Control
• Acceptance Sampling
several types of labor and resources for performing specific tasks. Each task can bemodeled as processing jobs one at a time, batch by batch, or as a continuous flow. Atask can require a setup in addition to run time. Randomness can be modeled indemand arrival and task processing time. The scheduling discipline can be first comefirst served (FCFS) or one that saves setups. Results available on successfulexecution include: Production of each product, capacity utilization for each resource,labor utilization, delays due to labor and/or material unavailability, as well as theflow time distribution for each product. The unique feature of the process analysismodule is that the users not only obtain capacity and labor utilization statistics (withidentification of the bottleneck resources) but also the entire flow time distribution.Often, the latter is extremely hard to obtain but essential in developing a serviceguarantee, and can not be obtained using back of the envelope calculations whenthere is randomness in job arrival or task processing time.
2.2 Waiting Line ManagementThe typical waiting line package available for educational or small business use
forces the user to make distributional assumptions about the inter-arrival time andservice times. Moreover, these packages rarely if ever provide the standard deviationof the queue length or waiting time. These two variables are of critical importance indesigning a service system or call center. In HOM, the inter-arrival pattern can beany one of Exponential, Erlang (of any degree), General (where only the first twomoments of the distribution are specified), or Empirical. When the distribution isempirical, the user can input observed frequencies. The service time distribution cansimilarly be - Exponential, Erlang, General, or Empirical. HOM has the ability ofsimulating a waiting line environment so that queue-joining disciplines can includeRandom, Shortest Line, Jockey, and Cyclic, and the job selection criteria can be thepopular FCFS or the Shortest Processing Time rule. The standard waiting lineoutputs are produced, namely, the average time in the system, the average time in thequeue, the average number of customers in the system, and the average number ofcustomers in the queue. In addition, HOM graphically depicts the wait timedistribution, and in a unique manner provides the standard deviation of the abovefour statistics.

USING MODELING SOFTWARE4
2.3 Project ManagementPERT and CPM are two of the most frequently used techniques in Operations
Management. Text books on Operations Management invariably cover: Critical PathAnalysis, and PERT. HOM’s project management module includes CPM and PERTanalysis. HOM has virtually no limitation in the size of projects that can be analyzed.In addition, when it comes to crashing, HOM uses linear programming to determinethe activities to crash. The PERT module has a built-in simulator to determine thecompletion time distribution as well as the criticality indices of activities. Thesefeatures are novel to HOM. The standard outputs include: Early and Late Startinformation, Slack, and Gantt Chart. In addition graphic and text outputs areproduced depicting the completion time distribution (for PERT) and the criticalityindex. Thus, HOM has features that extend the capabilities of these traditionaltechniques. For example, the completion time distribution can be used to understandwhat is the nature of variability: Is it a low probability of a very long delay or asymmetric distribution around the mean completion time? It can also be used toprioritize activities for uncertainty reduction by performing rapid what if analysis.
2.4 ForecastingThe forecasting module, due to the variety of techniques and user options, was the
hardest module to design. There are several trade-offs that need to be made withrespect to which aspects of the forecast to offer as a default option and how to allow(in what sequence) changes in the options. These changes have to be made so thatthe decisions take a tree like structure. If the user examines the dialog box where theoptions for the forecast are selected very carefully, s/he will notice that by choosing aparticular option such as simple exponential smoothing will close out other optionssuch as regression. In the parameters dialog box of HOM, options that are eitherfixed by a choice or disallowed due to a choice appear gray in color. This automaticclosing out of options is probably the hardest part of designing the interface, bothfrom the user’s perspective as well as from the algorithmic perspective. Theprogrammer has also to check whether the options are permissible. For example, ifthe smoothing constant for exponential is entered as -0.1 or 2.0, HOM shouldimmediately warn the user that the value is not allowed.
The techniques encapsulated in HOM are: Exponential Smoothing, TrendRegression followed by Exponential Smoothing, FIT Smoothing, Moving Average,Simple Average, Best of these Techniques, Weighted Moving Average, and Winter’sMethod. Multiple Regression is also included as an option. HOM allows for userdetermination or program optimization of smoothing parameters, allows for de-seasonalization and de-trending of data prior to constructing a forecast (in otherwords permits divide and conquer), automatic plotting of data, results, and deviationsfrom actual. HOM also provides a robust set of statistical measures to evaluate thequality of the forecast. The measures are available for both the time series andmultiple regression models, thereby facilitating their comparison.
2.5 InventoryThe inventory management module of HOM can be broadly classified into models
for independent demand inventory management and models for dependent demandinventory management. The nine models that are available under independentdemand inventory management are shown in Figure 1. Under continuous review

USING MODELING SOFTWARE5
models HOM allows, Finite or Infinite Replenishment Rate, Quantity Discounts,Back Ordering, Safety Stock Calculations, and also performs (in a unique manner)the Joint Optimization of Order Quantity and Safety Stock. Under Periodic ReviewModels, HOM allows the user to compute the Safety Stock for achieving a givenlevel of lead-time or fill rate service level. The data for the nine models are enteredin the same format! The novel feature of the design is that upon selecting the model,only certain parts of the data entry spreadsheet can be changed (and are shown inblue).
The dependent demand part of HOM contains a full scale MRP solver. The MRPtakes as input the Bill of Materials and automatically generates the Low Level Code.The design of the data spreadsheet is unique in the sense it allows the user to toggleusing the right mouse button between the MRP records for parts and the Bill ofMaterials information. HOM allows different batching rules (such as Fixed OrderQuantity, Fixed Period Quantity, Lot for Lot, Least Unit Cost, Least Total Cost, andthe Silver Meal heuristic). It allows the user to override the schedule generated byHOM (thus permits rescheduling) and allows the user to specify whether parts can beexpedited or not. In addition, HOM computes the set up and holding cost for eachpart and assembly. This permits the user to optimize the production schedule byrescheduling the parts requirements. These features have been designed so that theuser can carry out what if analysis and later on hook into a capacity managementmodule (possibly implemented in a spreadsheet). The MRP module has been used inan industrial setting with over a 100 distinct parts and 14 sub-assemblies.
2.6 Aggregate PlanningOne of the classic applications of optimization techniques in Operations
Management is concerned with developing production plans over the medium termhorizon. HOM’s aggregate planning module enables this application with certainrealistic features such as incorporation of set up time and set up cost. The user canmodel up to three products, develop plans up to 24 time periods and incorporatehire/fire costs, shift employment minimums and maximums, etc. Costs due to lostsales, subcontracting, or backorders can be specified, along with cost of over time,different amounts of available hours in different periods, safety stocks, as well as,starting and ending inventories. HOM’s engine develops mixed integer optimalsolution. It also emulates chase and level production and workforce strategies, thusenables the user to compare alternate policies. This much computing power isusually available only in uniquely tailored and developed production planningsystems.
2.7 Quality ManagementHOM’s quality management module implements both statistical process control as
well as acceptance sampling. Standard charts includeX , R, s charts; andp, np, c,and u charts. Several statistical tests are provided. These enable the user to judgewhether the process is in control or not. The acceptance-sampling module can beused to plot the Operating Characteristic (OC) Curve and also to determine asampling plan.

USING MODELING SOFTWARE6
Continuous Review Periodic Review
Deterministic Stochastic Stochastic Demand
FiniteReplenishmentRate
InfiniteReplenishmentRate
Leadtimeor FillrateServiceLevel?
Leadtimeor FillrateServiceLevel?
CalculateEconomicProductionQuantity
CalculateEconomicProductionQuantity &ReorderLevel
QuantityDiscountModel
CalculateSafetyStock Givena ServiceLevel
CalculateCosts GivenService Leveland/or OrderQty and ReorderLevel
CalculateServiceLevelGiven ReorderLevel (andOrder Qty. forFill RateService Level)
CalculateQty toOrderGiven aServiceLevel
CalculateServiceLevelGivenReorderLevel (andOrder Qty. forFill RateService Level)
Figure 1 Independent Demand Inventory Models in HOM
3. Using HOM
The operating philosophy behind HOM is to have the user specify (1) broadproblem-related input date (i.e., dependent and independent variables for forecastingdemand) in a familiarspreadsheetformat and (ii) data needed for modelspecification (i.e., the number of periods to forecast in the forecasting model) calledparameters, in a single dialog box (the Parameters Dialog box). For ease of use and

USING MODELING SOFTWARE7
report generation, data can be exported from and imported to HOM from commercialWindows based spreadsheet packages. Results can be exported to word processingsoftware, commercial spreadsheet programs or saved for future reference. EachHOM module has a unique How to Solve help file, found by using the command lineHELP option and then the Index. These help files sequentially move the userthrough all the steps that are required to solve a particular operations problem. Inaddition to module-specific functions (which are explained in each of the How toSolve help files), there is a set of general capabilities that apply to all modules andare discussed in the How to Get Started help file.
The manual contains the technical assumptions, examples and details that are theanalytical underpinnings of each HOM module. The manual is a WORD documentand is resident on the CD.
The HOM package was developed as a low cost alternative. One of the goalscontinues to be: Make the HOM software accessible to students, business, andresearchers the world over and at a low cost. Thus, the software along with manuals,solutions, and updates are available from the Internet at http://www.stern.nyu.edu.Another goal is to keep the software current both technically and technological. Tothis end, we plan to add modules related to supply chain management and logistics(such as facility location and transportation/warehousing network design). To keepHOM updated technologically, we plan to convert it so that it can run on anyplatform (currently Windows 3.1, 95, NT, and 98 are supported). A full 32-bitversion of the software will be released in early 2001.
The initial window in all modules has the same visual topography: a commandline; a tool bar; and an initial spreadsheet window for entering the broad probleminput data. As with any Windows-based product, HOM has a tool bar that givesdirect access to the most-often-used functions. Again, we use a combination ofWindows-specific and HOM-specific icons. The first eight icons are familiar toWindows users and invoke the functions of New, Open and Save files, Print andPreview print files, and information manipulation functions of Cut, Copy and Paste.The next five icons are unique to HOM. These icons are shown below.
The first icon is in the format of a HOM Parameters Dialog box and allows theimmediate jump to this dialog box from any stage in the problem-solving activity.The second icon unique to HOM is in the form of a graph, and using it automaticallyproduces a plot of the data, if feasible, for the last specified variable. The third iconis in the form of a jogger and automatically Runs the last problem that was specifiedwithin the Parameters window. The fourth icon is in the form of a graph and textdocument and clicking upon it displays the Results of the last run. A previouslysaved result, can also be viewed using the Open option to retrieve any previouslysaved results. The fifth icon is in the form of a “hand writing” and is used to create aLog file for a data file or a result file. The log file is time stamped and useful forstoring notes about what-if scenario analysis.
The last two icons in the HOM icon line allow the user to (1) get more generalinformation about the current model, and (2) use a Bubble help for particular items.A comprehensive tutorial case (Mastercraftsmen of Newport) with data files andsample outputs is included as part of the distribution.

USING MODELING SOFTWARE8
In addition to the software and the Tutorial Case, this package contains twointegrated cases, Ice Queen Snow Blowers and United Bank Branches, that allow theuser to apply many of the above models within a single organizational setting. IceQueen presents a set of problems faced by a manufacturer of snow blowers, UnitedBank Branches presents a set of problems faced by a money center bank trying togain efficiency by merging two branch locations. Cases involving only one task area(for example, Toy City Audit for Project and Time Management), as well asinformation-only databases for some classic Harvard Cases (for example, forecastinginput data for theBlanchard case) are also included. Data files for all sampleproblems mentioned in the technical manuals are included in each module directory.HOM is available to instructors, after registration, from the World Wide Web:http://www.stern.nyu.edu/HOM.
4. Examples
In this section, we describe two examples: One from Process Analysis and theother from Project Management.
4.1 Process Analysis - Cookie Making Example1
We model adeterministicprocess for making custom baked cookies. We assumethat only one type of cookie is made and that is sold a dozen at a time. We expectforty-four orders of one dozen each day. Thus:
Number of Products: 1Order Size: 1 dozenDemand per day: 44
The process to make cookies is as follows: Ingredients are first mixed in a bowlthat has a capacity to mix dough for three dozen cookies at a time. (In the examplemodeled, each order for a dozen cookies is different, thus has to be mixedindividually.) The dough is then spooned on to a cookie sheet one at a time. Thesheet is then placed in an oven that can hold a batch of one dozen cookies. Thecookies come out of the oven 10 minutes later and then can be placed anywhere tocool for five minutes. They are then packed one dozen to a box. Finally payment isrequired which takes the same amount of time for a batch up to 100 dozen. Workerrequirements and other details are given below. There are five workcenters in thisprocess as listed below.
Name Type No. of Max dozen cookies that canMachines processedw/o additional set up
MIXSPOON One at a time 1 3OVEN Batch 1 1COOL One at a time 100 1PACK One at a time 1 1PAY Batch 1 100
Labor:Name Number of WorkersBaker 1Helper 1Dummy 100

USING MODELING SOFTWARE9
Process Recipe:
Wrkcntr Avg. Labor Avg.
ProcessStep
Name ofWork center
Set Time/Lot (MIN)
Run Time/Unt (MIN)
Type ofLabor
Setup Time(MIN)
Run Time(MIN)
MIX&SPOON MIXSPOON 6 2 Baker 6 2
BAKE OVEN 10 0 Baker 1 0COOL COOL 0 5 Dummy 0 0
PACK PACK 0 2 Helper 0 2PAY PAY 1 0 Helper 1 0
Process Chart:
Set up Time: 6 0 0 0 1Run Time: 2 10 5 2 0
Labor Used: Baker Baker Dummy Helper HelperLabor Time:Set up Time: 6 0 0 0 1Run Time: 2 1 0 2 0
Some of the data entry screens are shown below during the data entry stage.
Screen 1Add Product Dialog box (each product has to be first added).
Screen 2Entry of Workcenter Data for MIXSPOON (each workcenter data has to be specified).
MixSpoon
Bake Cool Pack Pay

USING MODELING SOFTWARE10
Screen 3Entry of Labor Type Data for Baker (each labor type has to be specified).
Screen 4Parameters Dialog box (the parameters of the simulation are entered in this box)
The time units as well as the conversion factors have been specified in the topthree boxes. For example, each day has 480 minutes. We have asked HOM to tracethe queues at two workcenters, MIXSPOON and OVEN. The simulation is for 1 day.HOM is asked to first compute the utilization levels. On running HOM with thesechoices, the following text output is produced.
Process Analysis Calculations
Theoretical Utilization (%)Workcenter Name Utilization=============== ============
MIXSPOON 73.333OVEN 91.667COOL 0.45833PACK 18.333PAY 9.1667

USING MODELING SOFTWARE11
Labor Type Name Utilization============== =========
BAKER 82.5DUMMY 0HELPER 27.5
The utilization levels are less than 100%, thus we can go to the second step ofrunning the simulation. The result of the simulation for 1 day is shown below.
Process Analysis Calculations
Utilization (%)
Theoretical SimulatedWorkcenter Name Utilization Utilization============= ========= ========MIXSPOON 73.333 71.667OVEN 91.667 88.106COOL 0.45833 0.43504PACK 18.333 17.083PAY 9.1667 8.5416
Theoretical SimulatedLabor Type Name Utilization Utilization============= ========= ========BAKER 82.5 80.625DUMMY 0 0HELPER 27.5 25.625
Simulation Results
Average Jobs Avg. Num. At Maximum Num. UnavoidableWorkcenter Name In Queue Workcenter In Queue Delay============= ========== ============ =========== ==========MIXSPOON 0 0.71667 1 0OVEN 0 0.87708 1 0COOL 0 0.43106 1 0PACK 0 0.17083 1 0PAY 0 0.085417 1 0
** Unavoidable delay is due to waiting for labor or material.Average Std. Dev. of Quantity
Product Name Flow Time Flow Time Produced=========== ======== ========= ========COOKIE 1 DOZ 26 0 41
Product Flow Time Distribution
COOKIE 1 DOZ
Left End Right End Fraction of JobsPoint (T1) Point (T2) w/Flow Time <= T2======== ======== ============
26 26 1

USING MODELING SOFTWARE12
The trace of queues at the mix and spoon and oven workcenters are shown below(the queues are clearly stable):
Process Analysis Calculations
Utilization (%)
Workcenter Name Theoretical Util. (%) Simulated Util. (%)============= ============ ============
MIXSPOON 73.333 60.511
OVEN 91.667 54.167
COOL 0.45833 0.27083
PACK 18.333 10.789
PAY 9.1667 5.3472
Labor Type Name Theoretical Util. (%) Simulated Util. (%)============= ============ ============
BAKER 82.5 65.928
DUMMY 0 0
HELPER 27.5 16.136
4.2 Cookie Making Example -- VariationsThe following variations of this example can be created: Instead of the orders
arriving in a deterministic manner, the squared coefficient of variation of the inter-arrival time between successive customers demand is changed to 1. You see belowthat the queue at the oven will build up and that the system is unstable!

USING MODELING SOFTWARE13
The trace of queues at the mix and spoon and oven work centers:
Simulation Results
Workcenter NameType ofProcessing
Average JobsIn Queue
Avg. Num. AtWorkcenter
Max. Num. AtWorkcenter
AvoidableDelay (%)
MIXSPOON One at Time 1.3687 1.9709 7 2.9732
OVEN In Batches 8.12 8.6334 31 26.889
COOL One at Time 0 0.27083 1 0
PACK One at Time 0 0.10694 1 0
PAY In Batches 0 0.053472 1 0
** Avoidable delay is due to waiting for labor or material.
Average Std. Dev. of Quantity
Product Name Flow Time Flow Time Produced/DAY
COOKIE 1 DOZ 134.52 57.694 25.6667

USING MODELING SOFTWARE14
Product Flow Time Distribution
COOKIE 1 DOZLeft End
Point (T1)Right EndPoint (T2)
Fraction of Jobsw/Flow Time <= T2
34 59.025 0.12987
59.025 84.05 0.19481
84.05 109.07 0.31169
109.07 134.1 0.53247
134.1 159.12 0.68831
159.12 184.15 0.85714
184.15 209.17 0.8961
209.17 234.2 0.92208
234.2 259.22 0.97403259.22 284.25 1
The queue build up at the oven is due to a phenomenon called machineinterference. Notice that the avoidable delay at the OVEN is in excess of 25%. Theaverage flowtime also increases to five times its previous value. The service timeguarantee for 90% of the customers exceeds 230 minutes (from 26 minutes!). Theproblem arises because the Baker is heavily utilized, and therefore can not be in twoplaces (the MIXSPOON and the OVEN) at the same time. A simple solution is toassign the Baker’s work to the Helper so far as the loading of the oven is concerned.With this change the system becomes stable. The traces are given below. Theaverage and standard deviation of flow time are 37.98 and 16.93 minutes. Theservice guarantee for 90% of customers comes down to 67 minutes.
Other modeling variations are described in the manual. In general, the types ofmodels that can be created are unlimited.

USING MODELING SOFTWARE15
4.3 Project Management - Table Manufacturing ExampleWe illustrate the capabilities of the Project Management Module using a short case
study: Christopher Townsend, the co-founder of the Newport Cabinetmaking School,was thinking about his furniture making business in the summer of 1750. He hadjust returned from the Quaker summer meeting held in Salem, MA that year and hadseen some of the latest production techniques used by the larger Quaker furnituremaking shops of that city. His son, John was almost finished with his seven-yearapprenticeship and was demonstrating skill equal to his own in every facet of thefurniture making craft.
Christopher currently built tables by completing every task himself (serialprocessing). He would select and trim the wood for the legs and top, which wouldtake a total of one day, then cut and carve the legs (4 days), then cut and carve thetop (3 days), then assemble the parts (2 days) then stain and finish (1 ½ days) andpack the table for delivery (½ day). Christopher usually worked 24 days a month.
In Salem, he learned that some tasks could be allocated to other workers and couldbe done at the same time as other tasks (parallel processing). Since John's skillswere so advanced, Christopher was wondering by how much he could shorten thedelivery time for a table (flow time). At a minimum, he wanted to know what theeffect would be if John would cut and carve the legs at the same time as he wasmaking the top? (It also takes John four days to cut and carve a set of legs).
Christopher also knew that his brother, Job's sons were also gaining skill ascabinetmakers and that he could hire them to help with the work. At a cost of 2pounds per day he could cut up to 2 days off the time to make legs. At 3 pounds perday he could cut 1 day off the time to make the top, at 4 pounds per day he couldreduce the assembly time by 1 day and at 1.5 pounds per half day he could reducethe stain and finish time by ½ day. Christopher is wondering if he employed Job'ssons how much it would cost for each day's reduction in the time it would take Johnand himself to produce a table.
Christopher knows that adding extra workers might add some uncertainty tocertain of his completion time estimates. The new range of possibilities are givenbelow:
Christopher would like to be 90% confident in any completion time estimate hegives his customers. What should his completion time quote be (service guarantee)?Christopher is very confident in his own abilities and knows he can always completetasks in the expected time. Which tasks would you recommend he work on, andwhy?
The HOM module project management can be used to solve these questions. Therequired input file is given below.
Times
Task Pessimistic Expected OptimisticBuywood 2 1 1Makeleg 5 4 3
Maketop 4 3 2
Assemble 5 2 1Stain 3 1.5 1
Pack 0.5 0.5 0.5
USING MODELING SOFTWARE16
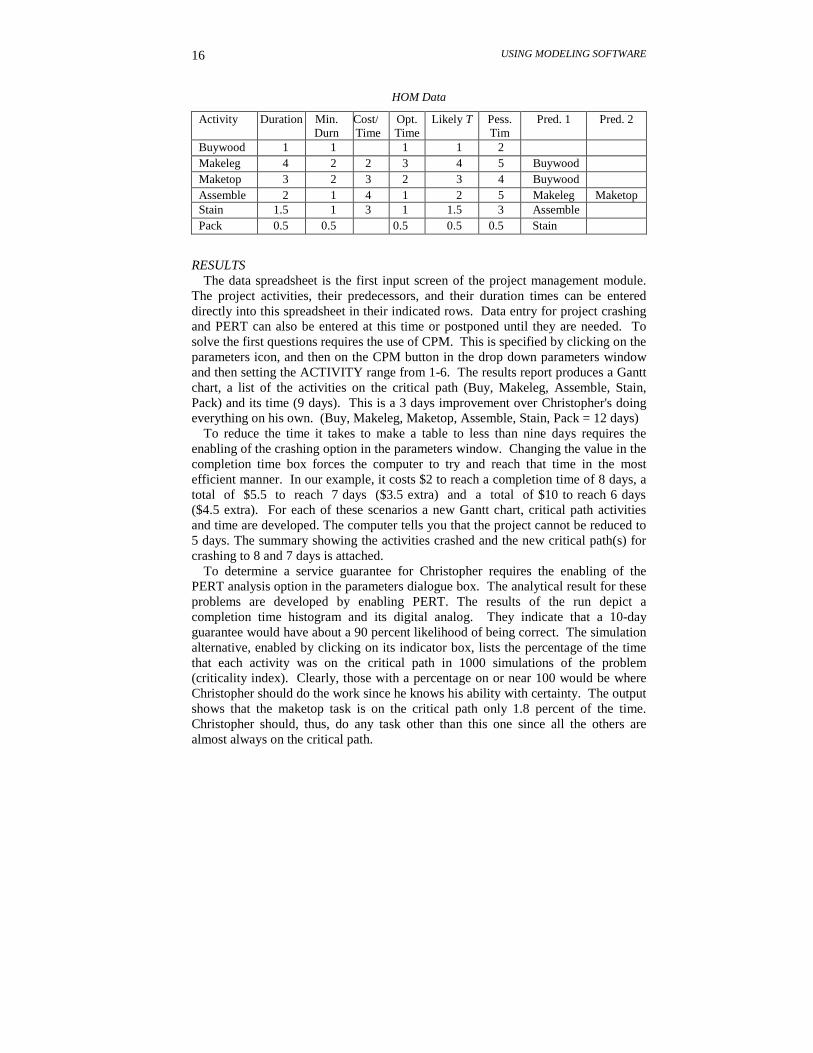
HOM Data
Activity Duration Min.Durn
Cost/Time
Opt.Time
Likely T Pess.Tim
Pred. 1 Pred. 2
Buywood 1 1 1 1 2Makeleg 4 2 2 3 4 5 BuywoodMaketop 3 2 3 2 3 4 BuywoodAssemble 2 1 4 1 2 5 Makeleg MaketopStain 1.5 1 3 1 1.5 3 AssemblePack 0.5 0.5 0.5 0.5 0.5 Stain
RESULTSThe data spreadsheet is the first input screen of the project management module.
The project activities, their predecessors, and their duration times can be entereddirectly into this spreadsheet in their indicated rows. Data entry for project crashingand PERT can also be entered at this time or postponed until they are needed. Tosolve the first questions requires the use of CPM. This is specified by clicking on theparameters icon, and then on the CPM button in the drop down parameters windowand then setting the ACTIVITY range from 1-6. The results report produces a Ganttchart, a list of the activities on the critical path (Buy, Makeleg, Assemble, Stain,Pack) and its time (9 days). This is a 3 days improvement over Christopher's doingeverything on his own. (Buy, Makeleg, Maketop, Assemble, Stain, Pack = 12 days)
To reduce the time it takes to make a table to less than nine days requires theenabling of the crashing option in the parameters window. Changing the value in thecompletion time box forces the computer to try and reach that time in the mostefficient manner. In our example, it costs $2 to reach a completion time of 8 days, atotal of $5.5 to reach 7 days ($3.5 extra) and a total of $10 to reach 6 days($4.5 extra). For each of these scenarios a new Gantt chart, critical path activitiesand time are developed. The computer tells you that the project cannot be reduced to5 days. The summary showing the activities crashed and the new critical path(s) forcrashing to 8 and 7 days is attached.
To determine a service guarantee for Christopher requires the enabling of thePERT analysis option in the parameters dialogue box. The analytical result for theseproblems are developed by enabling PERT. The results of the run depict acompletion time histogram and its digital analog. They indicate that a 10-dayguarantee would have about a 90 percent likelihood of being correct. The simulationalternative, enabled by clicking on its indicator box, lists the percentage of the timethat each activity was on the critical path in 1000 simulations of the problem(criticality index). Clearly, those with a percentage on or near 100 would be whereChristopher should do the work since he knows his ability with certainty. The outputshows that the maketop task is on the critical path only 1.8 percent of the time.Christopher should, thus, do any task other than this one since all the others arealmost always on the critical path.
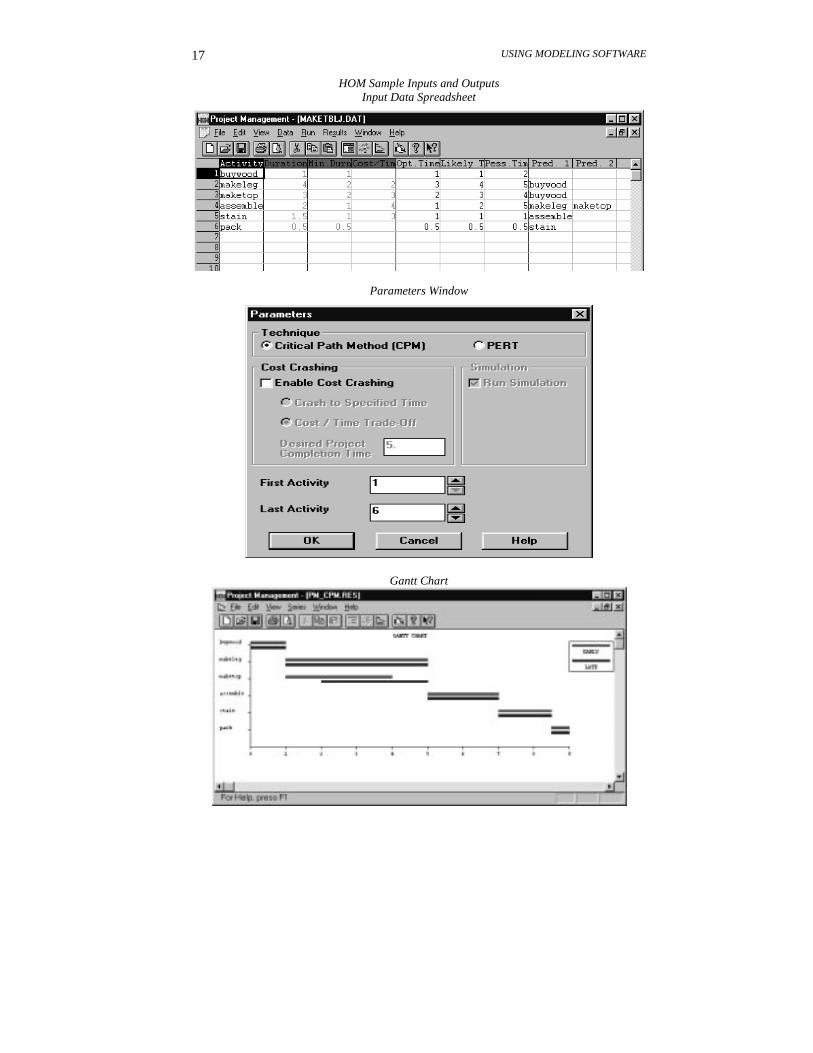
USING MODELING SOFTWARE17
HOM Sample Inputs and OutputsInput Data Spreadsheet
Parameters Window
Gantt Chart

USING MODELING SOFTWARE18
Output Table of Critical Path Calculations
Critical Path Method Calculations Results
Activity Name Early Start Early Finish Late Start Late Finish Slack=========== ===== ========= ======= ======== =====buywood 0 1 0 1 0makeleg 1 5 1 5 0maketop 1 4 2 5 1assemble 5 7 5 7 0stain 7 8.5 7 8.5 0pack 8.5 9 8.5 9 0
Expected Completion Time: 9Critical Path: buywood makeleg assemble stain pack
Output of Crashing to8 Days
Critical Path Method with Cost Crashing Calculations Results.ActivityName
Crashed by Cost ofCrashing
PresentDuration
EarlyStart
EarlyFinish
LateStart
LateFinish
Slack
===== ====== ====== ====== ====== ===== ====== ==== =====
buywood 0 0 1 0 1 0 1 0
makeleg 1 2 3 1 4 1 4 0
maketop 0 0 3 1 4 1 4 0
assemble 0 0 2 4 6 4 6 0
stain 0 0 1.5 6 7.5 6 7.5 0
pack 0 0 0.5 7.5 8 7.5 8 0
Expected Completion Time: 8
Total Crashing Cost: 2
Critical Paths:buywood makeleg assemble stain packbuywood maketop assemble stain pack
Results of Crashing to7 days
Critical Path Method with Cost Crashing Calculations Results.
ActivityName
CrashedBy
Cost ofCrashing
PresentDuration
EarlyStart
EarlyFinish
LateStart
LateFinish
Slack
====== ======= ======= ======= ====== ====== ====== ====== ======buywood 0 0 1 0 1 0 1 0makeleg 1 2 3 1 4 1 4 0maketop 0 0 3 1 4 1 4 0assemble 0.5 2 1.5 4 5.5 4 5.5 0stain 0.5 1.5 1 5.5 6.5 5.5 6.5 0pack 0 0 0.5 6.5 7 6.5 7 0Expected Completion Time:7Total Crashing Cost: 5.5Critical Paths:buywood makeleg assemble stain packbuywood maketop assemble stain pack

USING MODELING SOFTWARE19
Output of Simulation
PERT Simulation (Criticality) Calculations ResultsActivity Name Criticality Indices======== ========buywood 1makeleg 0.982maketop 0.018assemble 1stain 1pack 1
Project completion timeMinimum: 7.14945Maximum: 11.4058Mean: 9.02302Standard Deviation: 0.766755
Completion frequency distribution (1000 runs performed):
Interval Start Interval End Frequency (%) (Counts)======== ======== ======== ========
7.149 7.575 1.6 167.575 8.001 5.7 578.001 8.426 15.7 1578.426 8.852 20.4 2048.852 9.278 21.4 2149.278 9.703 16.5 1659.703 10.13 9.8 98
10.13 10.55 5.3 5310.55 10.98 2.4 2410.98 11.41 1.2 12

USING MODELING SOFTWARE20
5. Comparison with Similar Software Packages
We briefly compare HOM with other Operations Management educationalsoftware in this section. The comparison is not meant to be an exhaustive surveyof all such products. Our objective in making this comparison is to comparepedagogical approaches. There are two ways of classifying the software that isavailable for Operations Management: (1) Is the emphasis on Operations Research oron Operations Management? (2) Is the software a spreadsheet add-in or not? Thereare two reasons we make these distinctions at the outset: (1) There are severalspecializedsoftware products that cover topics such as linear, non-linear, andcombinatorial optimization, for example LINDO and LINGO (LINDO Systems),MATLAB (The MathWorks, Inc.), and ILOG’s OPL Studio (ILOG Corporation).These belong to the realm of Operations Research. Such products are less orientedtowards managerial problem solving and more convenient for teaching OperationsResearch solution techniques as well as to teach how to mathematically formulate anoptimization problem. These products do not neatly fit into the lecture sequencefollowed in Operations Management, such as, process analysis, time to market,supply chain management, etc. Also, the specialized products do not cover all thetechniques used in an Operations Management course. There are severaleducationalsoftware products in the Operations Research area that cover many of the techniquestaught in an Operations Management course. In contrast to these, the software meantfor teaching Operations Management cover as much or more material and usually aretailored to solve problems from one or more OM text books. (2) Spreadsheets are aviable approach for teaching students how to formulate and solve problems faced byOperations Managers and Operations Researchers. Now a days almost everytextbook on Operations Research has a special section in each chapter on using aspreadsheet to implement the techniques covered in that chapter. With theoptimization software now embedded in Microsoft’s Excel, it has become easier topose and solve challenging problems. Moreover, Visual Basic scripts can be createdto allow the user to change not just the data, such as the task duration, but also theparameters of the problem, such as the number of tasks in a project. Examples ofsuch an approach are found in [11], [8] and [2,3] The limitations of this approach aretwofold, first, as the spreadsheet is upgraded the old macros and programs have to beupgraded, and second, the approach is not yet suitable for facilitating tasks such as:easy variation in the parameters, allowing or disallowing certain combination ofoptions (such as can be achieved using a dialog box) or solving very large problemsor saving and comparing outputs side by side or even for developing a consistentmethod of data entry and problem formulation for all modules.
In fact, HOM began as a spreadsheet add-in. However, due to rapid changes in thespreadsheet versions, we had to place much more emphasis on managing multipleversions rather on the development of the HOM software product. Therefore, weabandoned the approach of having HOM within a spreadsheet and instead took thepresent approach that uses a spreadsheet within HOM. On the other hand,spreadsheets remain the tool of choice for most managers and they are the tools thatmanagers work with day-in-and-day-out. Thus, given the widespread usage ofspreadsheets we expect that over time the differences between the software and thespreadsheet will reduce. For example, we plan to completely integrate the input andoutput windows so that they take on the look and feel of a spreadsheet. Thus, inputs

USING MODELING SOFTWARE21
and outputs will be represented as worksheets within the same spreadsheet andfigures will be presented as embedded objects that can be imported into anyspreadsheet or word-processing software. This will preserve the look and feel of amodern day spreadsheet but allow the software to be tailored to the problemformulation and solution without being tied into a particular version of a spreadsheet.Finally, C++ and Fortran are the standard languages for codifying algorithms. Untilit becomes easy to use these languages within a spreadsheet, it will be difficult tocreate products that solve medium to large sized problems, such as those encounteredin Aggregate Planning or Process Analysis.
We have spelt out many of the desirable features of software that is meant formanagers and students in the field of Operations Management in the previousparagraph. We hasten to add that some of these features are favored due to ourpersonal experience in software development and also because the features supportour approach to teaching and solving operations problems. They are by no meansuniversally accepted! Especially, there is a deep divide amongst professors whethertechniques should be taught in-class, whether students should get their “hands dirty”by solving a problem by hand or step-by-step using a software or should studentssimply comprehend how to formulate a problem, understand the choices that areavailable, and carry out sensitivity analysis. We subscribe to a combination of thesecond and the last approach, namely, the student should be able to quickly solve aproblem by hand and where necessary use a powerful tool to understand the fineraspects of the problem or solution.
The list of features that can be used to describe software for OperationsManagement is probably more easily created, and will comprise the items shownbelow: (1) Topics covered. (2) Problem Formulation: Parameters and Data. (3) DataEntry. (4) Problem Size/Modeling Flexibility. (5) Models Selection. (6) SolutionApproach. (7) Output Screen. (8) Sensitivity Analysis. (9) Import and Export. (10)Help Features. (11) Supplements. (12) Downloadable from Internet. (13) Platformssupported. (14) Expository cases. (15) Other Features. WinQSB created by Chang(1998) and POM for Windows developed by Weiss (1997) are the two softwareproducts other than HOM that have many of these features. These products arebriefly compared with HOM.
WinQSB is a versatile product that offers several modules for teaching “modelingoriented” Operations Research and Operations Management topics. (1) Topicscovered: WinQSB offers several Operations Research related modules that are notcovered under HOM, specifically, Dynamic Programming, Decision Analysis,Linear, Integer, Goal, Quadratic, and Nonlinear programming; Markov Process,Network Flow Models and Scheduling. WinQSB does not offer Process Analysisinstead it allows the user to simulate multiple stage queueing systems. Otherwise, thecoverage of Operations Management topics is the same as HOM. (2) ProblemFormulation: Parameters and Data: WinQSB’s approach is to first select the modeland then enter the parameters and the data. Thus, it is model oriented and notproblem focused. Thus, for example, in Aggregate Planning the choices are SimpleModel, Transportation Model, and General LP Model. Similarly, the choices forInventory are offered under EOQ Model, (s,Q) Model etc. (3) Data Entry: The dataentry screen does not open up until the model is chosen, unlike HOM. The screen isnot a spreadsheet, but has a grid like appearance. (4) Problem Size/ModelingFlexibility: In general the modules have similar capability as HOM’s. However, in

USING MODELING SOFTWARE22
Aggregate Planning the modules do not allow for setup time or setup cost. Processanalysis is restricted to straight-line flows unlike HOM. And, the managerialflexibility and choice under Waiting Line Management module of HOM is greater.(5) Model Selection: The model selection is done first, whereas in HOM parametersand models are selected in a single window and also made as far as possible to beindependent of the data. The HOM approach facilitates repeat analysis with differentparameters without having to re-enter the data. (6) Solution Approach: WinQSBallows the user to seek optimal solution wherever possible, similar to HOM. (7)Output Screen: The graphical outputs are better in WinQSB. The outputs are still notcompletely spreadsheet like. (8) Sensitivity Analysis: WinQSB does not haveautomatic sensitivity analysis that is provided in some of HOM’s modules. (9)Import and Export: The spreadsheet supported by HOM appears to be easier to copyand paste information. (10) Help Features: WinQSB focuses on the technical aspects,such as formulae for forecasting. This is in contrast to HOM, where the user is givena step-by-step “How to Solve” tutorial on how to forecast. (11) Supplements: Sampleproblems. (12) Downloadable from Internet: No. (13) Platforms supported:Windows. (14) Expository cases: Not available. (15) Other Features: WinQSB isdeveloped using Visual Basic as can be inferred from the dynamic link libraryobjects installed. HOM is more compact and allows for seamless integration in the32-bit Windows environment because it uses compatible Visual C++ and VisualFortran compilers. All in all, WinQSB is an extremely impressive and professionalproduct that is suited to model oriented teaching.
POM for Windows is a program that delivers elementary solutions to a wide rangeof operating problems. (1) Topics covered: POM offers several Operations Researchrelated modules and a host of shop-floor manufacturing techniques that are notcovered in HOM. These additional modules are Assignment, Lot Sizing, LinearProgramming, Plant Layout, Scheduling, Simulation and Transportation. The majorOperations Management techniques are not covered in the depth presented by HOMor WinQSB. Process Analysis and Stochastic Inventory models are not addressed atall. (2) Problem Formulation: Parameters and Data: POM’s approach is to first havethe user select the parameters to be used in the formulation, then enter the modeltype, and then the data. Thus, for Aggregate Planning the user first indicates thenumber of periods and whether backorders or lost sales are permitted; then specifiesthe model type, i.e., simple production, produce to demand, etc.; and then therelevant data, such as, the demand, capacity and cost. Similarly, the waiting linemodule is used by first selecting the model amongst M/M/1, M/G/1 or M/M/s; thenwhether or not to use costs and then the data on arrival and service rates. Thus, thisapproach is in-line with that of WinQSB with a model rather than a problem focus.(3) Data Entry: The data entry screen does not open up unless the model is chosenunlike HOM. The screen is not a spreadsheet but data can be copied to it from aclipboard. It is not easy to view multiple data sets or the data and the results screenusing the tile or cascade windows function. (4) Problem Size/Modeling Flexibility:In general, the maximum size of problems that can solved using POM issubstantially less than the corresponding size in HOM or WinQSB. For example, theForecasting module in POM allows a maximum of six variables and 90 observationscompared to 20 variables and 1000 observations in HOM. There is no method fordealing with seasonality, no provision for Winter’s method or for finding the best fit,namely, for optimizing the model parameters. The Aggregate Planning module does

USING MODELING SOFTWARE23
not allow for optimization or for including setup time and setup cost or forspecifying minimum personnel in a shift. Simulation is not allowed in Waiting Linesor Project Management. The Waiting Line module does not cover GI/G/S systems orsystems with empirical distributions for the inter-arrival or service time. (5) ModelSelection: Like WinQSB, model selection is done first. This is in contrast to HOMwhere the data is entered first and model as well as parameters are selected later. TheHOM approach facilitates repeat analysis with different parameters without havingto re-enter the data. (6) Solution Approach: Unlike HOM or WinQSB, optimumseeking or simulation methodology is often not used in POM. Aggregate Planning,Project Crashing, and “Best Fit” in Forecasting are a few examples. POM can notdetermine activity criticality indices or probabilistic project completion times, normodel “join the shortest queue” or “jockeying” in waiting lines. (7) Output Screen:Graphs are clear and sharp and more on level with WinQSB than HOM. There aresome pre-programmed graphical alternatives such as in Waiting Line analysis, whichis a nice feature similar to HOM. (8) Sensitivity Analysis: There is little hard-wiredsensitivity analysis as in HOM where waiting line analysis yields results for +/- 5%change in service rates. (9) Import and Export: Straightforward using the clipboard.(10) Help Features: On-line help tells the user the data items that should be enteredbut the “How to Solve” feature of HOM is missing. (11) Supplements: None. (12)Downloadable from Internet: No. (13) Platforms supported: Windows. (14)Expository cases: No. (15) Other Features: POM also appears to be developed usingVisual Basic.
6. Teaching Experience with HOM
Using HOM in the classroom requires that the instructor devote some time tofamiliarize students with the menu structure and data entry conventions. Someexamples of how we go about doing this in our courses are given below.
Our Operations Management course places emphasis on process analysis. Theprocess analysis module of HOM is thus invaluable when used to discuss set up timeand lot size trade-offs, the effect of product mix on capacity and profitability,staffing issues, as well as, flow time management. On the other hand, due to theversatility of the HOM module, the time required to describe this module can besubstantial. Nearly, half a class (40 minutes) is required to show how the data isentered, any unique definitions explained and how the options are selected. Forexample, in process analysis, each task can be “one at a time”, “batch” or“continuous flow.” The differences between these types of operations must beexplained if they have not already been covered in class. On the whole, once theinitial effort has been made, students rapidly appreciate the power of computers foranalyzing processes. All the other modules are introduced with a “20 minute how to”lecture in the class before their use is required. This gives the student a basic feel forhow the data should be entered, the scope for analysis and interpretation of results.
For large problems, such as a process with ten products and/or complex recipes ora project with 30 activities, HOM data files are provided for the student. These datafiles contain the initial set up of the problem. The student is then required to improveupon the current situation and is set definite targets to achieve. As another example,in an advanced class, the MRP module and a spreadsheet based capacity calculatorare provided to the student. The objective is to develop a capacity constrained

USING MODELING SOFTWARE24
production plan that minimizes the work-in-progress and finished goods inventorycarrying cost while simultaneously avoiding significant backlogs of productsdemanded.
We have used HOM in our core Operations Management classes since 1994. Themost powerful motivator for using HOM in the classroom is its ability to solverealistic problems of moderate size with relative ease. In addition, we are able todemonstrate counter-intuitive results that are not available through performing back-of-the-envelope calculations; such as, situations in which: there is simultaneousexcess capacity of labor and long waiting lines due to interference of work,deliberate under-staffing in the cheaper first shift due to minimum workforce sizerequirements in the costlier second shift, high probability of stockout co-existingwith high fill rate service level, etc. Lastly, more complex analysis, such as thecomputation of optimal lotsize in stochastic networks, simultaneous optimization ofthe order quantity and safety stock level, and the evaluation of reduction inprocessing uncertainty, are also facilitated using HOM. Thus, weare not only able tobring state-of-the art approaches for problem solving into the classroom or the smallbusiness environment but also to sensitize students and managers to hidden and/ormore complex trade-offs.
Based on user feedback, we have learnt that the software is powerful enough that itcan be used to solve class problems or to find a first cut solution to problems thatmight be encountered on the job. Also the time and effort spent in learning how tomodel problems and interpret results in HOM can be carried forward into future useof this or other commercial process improvement software packages. The feedbackfrom students and instructors that have used this software has generally beenpositive. The more intuitive modules, such as Project Management and Forecasting,have drawn greater praise. Process Analysis is the most complex module and drawscriticism due to the amount of learning required. Students and instructors havecommented that the output formats and graphics can be improved and that usersshould be able to cut and paste graphs from the output screen to other software.
Finally, to win the user over teaching note solutions to all cases must be madeavailable. David Juran has created several such notes. Examples are found [email protected].
7. AcknowledgementsWe thank the editor and two anonymous referees for several helpful comments
with regard to the contents, the exposition, and the organization of the paper.
Footnote:1. Data for this example is taken fromKristen’s Cookie Co.published by the
Harvard Publishing Corp.
8. References1. Chang, Yih-Long,WinQSB: Decision Support Software for MS/OM, John
Wiley & Sons, Inc., New York, 1998.2. D. A. Menasce and V. A. F. Almeida, Capacity Planning for Web
Performance, Prentice Hall, PTR, 1998.3. D. A. Menasce and V. A. F. Almeida, Scaling for E-Business, Prentice Hall,
PTR, 2000.

USING MODELING SOFTWARE25
4. Eppen, G. D., F. J. Gould and C. P. Schmidt,Introductory ManagementScienceEnglewood Cliffs, New Jersey, Prentice Hall, 1993.
5. ILOG, Gentilly, France (http://www.ilog.com).6. LINDO Systems, Inc., 1415 North Dayton Street, Chicago, IL 60622
(http://www.lindo.com).7. Michael Moses and Sridhar Seshadri. Operations Management: Software
Windows Manual, Irwin-McGraw Hill Pub. Co., New York, 1999.8. Savage, S. L., Insight.xla: Business Analysis Software, Brooks/Cole Pub Co,
ITP Educational Division, 7625 Empire Drive Florence KY 41042, 1998.9. The MathWorks, Inc., 3 Apple Hill Drive Natick, MA 01760-2098
http://www.mathworks.com/10. Weiss, H., POM for Windows, Prentice Hall, Upper Saddle River, NJ, 1997.11. Winston, W. L., S. C. Albright, Practical Management Science: Spreadsheet
Modeling and Applications, Duxbury Press, Belmont, CA, 1997.