using ms project - defense acquisition university · using ms project evm 202 september 2016 5 the...
TRANSCRIPT
EVM 202 September 2016 1
Using MS Project
Introduction Microsoft (MS) Project is a project management tool used by many organizations within the
Department of Defense (DoD). MS Project provides access to scheduling and resource data
that program managers and other EVM professionals can use as part of an integrated program
management approach for complex programs and projects.
This job aid addresses the following features and functionality of MS Project:
Part 1—MS Project Overview
o Default screen layout
o Analysis Gantt view
o Split window view
Part 2—Step-by-Step Instructions
o Open MS Project files
o Select view
o Display additional information
o Edit Analysis Gantt view
o Filter data
Things to Know Before You Begin Access to MS Project is provided by your individual organization. If you need access to MS
Project, you must request access from your organization's system administrator (or other
appropriate contact).
Note: Your organization may use a different project management tool than MS
Project. Check with the appropriate contact within your organization to confirm which
tool you should use.
The built-in Help functionality provides additional information about MS Project’s features and
functionality. You can access Help directly from within MS Project.
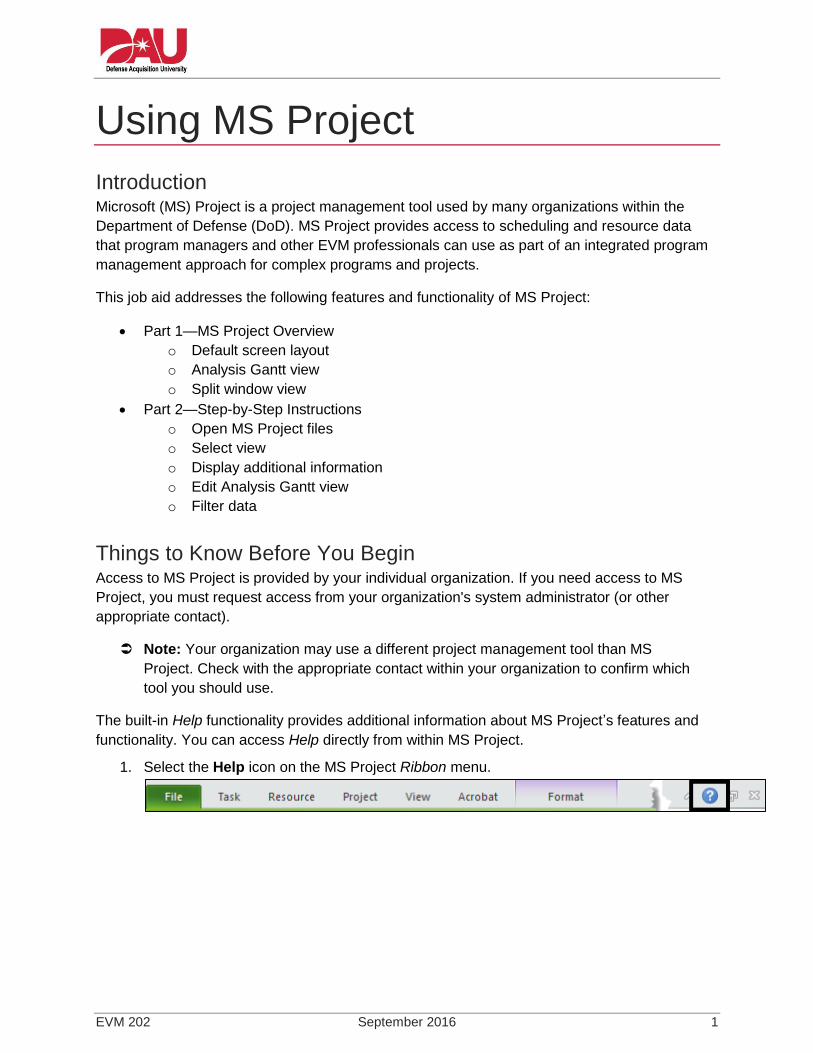
1. Select the Help icon on the MS Project Ribbon menu.
Using MS Project
EVM 202 September 2016 2
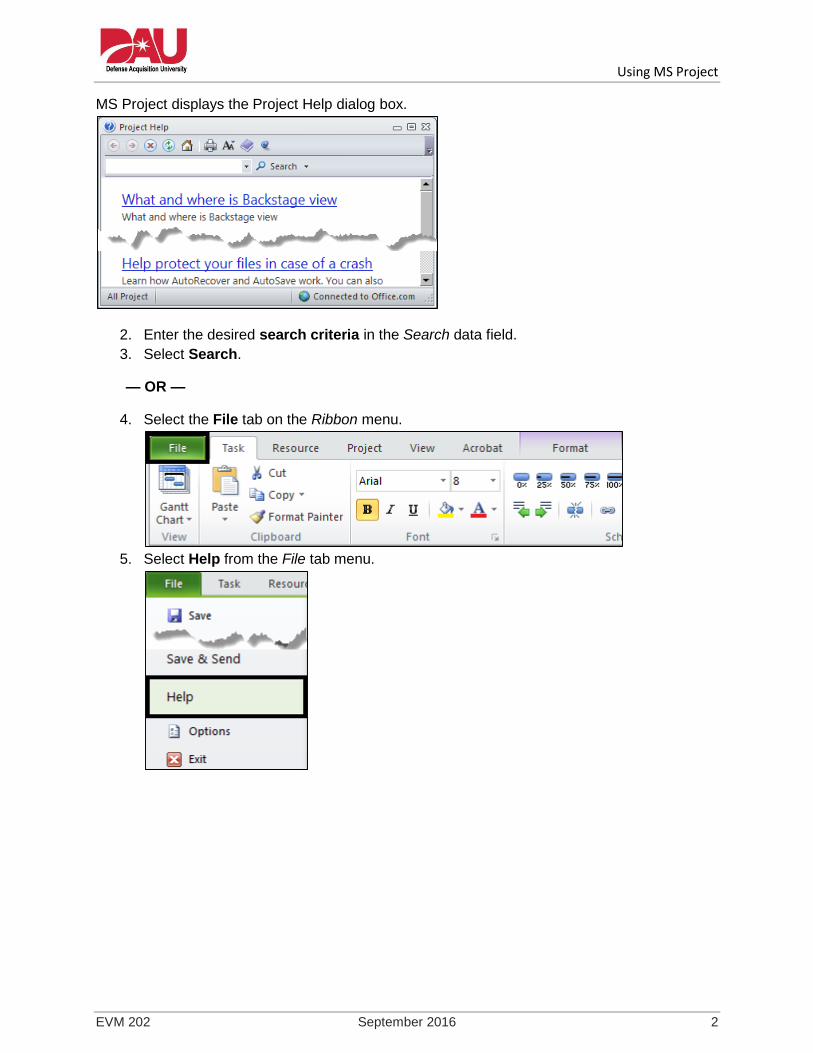
MS Project displays the Project Help dialog box.
2. Enter the desired search criteria in the Search data field.
3. Select Search.
— OR —
4. Select the File tab on the Ribbon menu.
5. Select Help from the File tab menu.

Using MS Project
EVM 202 September 2016 3
MS Project displays the Project Help window.
6. Select the desired Help feature to access additional information.

Using MS Project
EVM 202 September 2016 4
PART 1—MS Project Overview
Default Screen Layout The default MS Project view displays a Gantt Chart view of the selected project in a single pane
window. The Gantt Chart view is split into two portions:
1. Table view
2. Bar chart view
The Tabs provide access to features and functionality that allow you to customize the way you
manage and view your project's data.
Each Tab has an associated Ribbon Menu with commands specific to the selected tab.

Using MS Project
EVM 202 September 2016 5
The Status Bar at the bottom of the screen displays details about the active view, such as the
scheduling mode or if a filter has been applied.
Analysis Gantt View The Analysis Gantt view is similar to the default Gantt Chart view, but displays additional
information on the bar chart portion. This view typically is preferred because it allows for the
comparison of the baseline schedule to the current schedule.
The Analysis Gantt view displays task information as text on the left in table form. On the right
side, bars graphically represent schedule information related to each task.
Using MS Project
EVM 202 September 2016 6
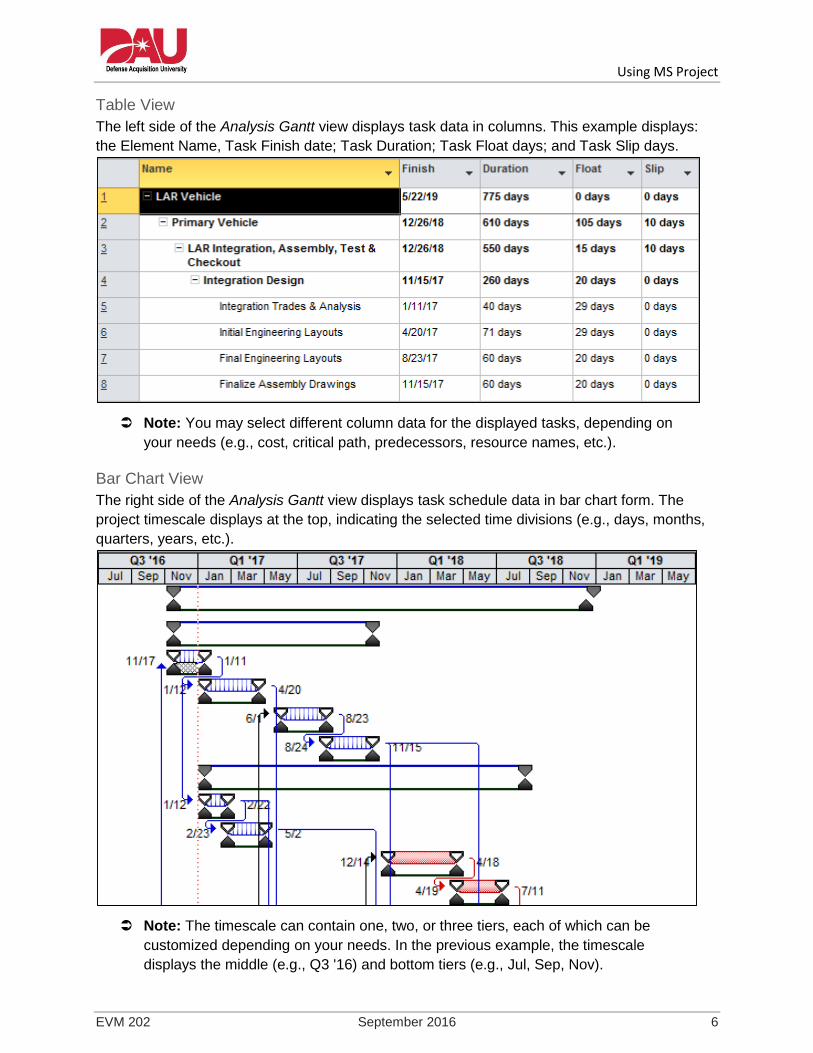
Table View
The left side of the Analysis Gantt view displays task data in columns. This example displays:
the Element Name, Task Finish date; Task Duration; Task Float days; and Task Slip days.
Note: You may select different column data for the displayed tasks, depending on
your needs (e.g., cost, critical path, predecessors, resource names, etc.).
Bar Chart View
The right side of the Analysis Gantt view displays task schedule data in bar chart form. The
project timescale displays at the top, indicating the selected time divisions (e.g., days, months,
quarters, years, etc.).
Note: The timescale can contain one, two, or three tiers, each of which can be
customized depending on your needs. In the previous example, the timescale
displays the middle (e.g., Q3 '16) and bottom tiers (e.g., Jul, Sep, Nov).
Using MS Project
EVM 202 September 2016 7
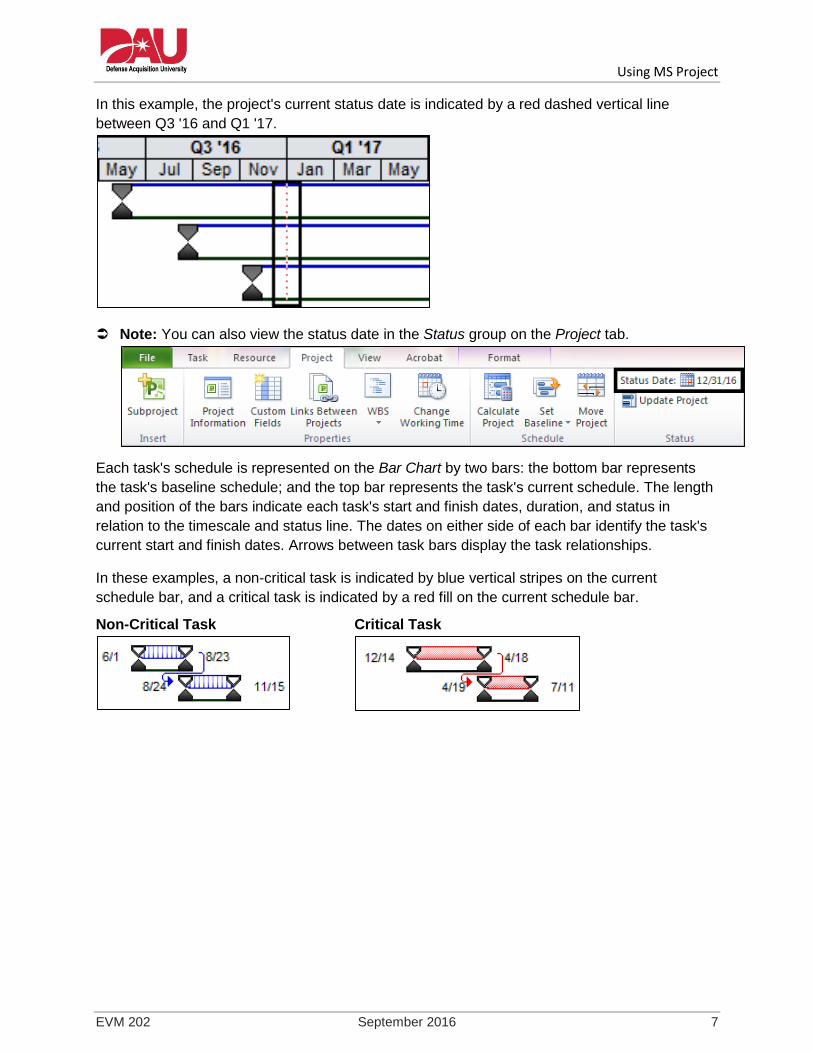
In this example, the project's current status date is indicated by a red dashed vertical line
between Q3 '16 and Q1 '17.
Note: You can also view the status date in the Status group on the Project tab.
Each task's schedule is represented on the Bar Chart by two bars: the bottom bar represents
the task's baseline schedule; and the top bar represents the task's current schedule. The length
and position of the bars indicate each task's start and finish dates, duration, and status in
relation to the timescale and status line. The dates on either side of each bar identify the task's
current start and finish dates. Arrows between task bars display the task relationships.
In these examples, a non-critical task is indicated by blue vertical stripes on the current
schedule bar, and a critical task is indicated by a red fill on the current schedule bar.
Non-Critical Task
Critical Task
Using MS Project
EVM 202 September 2016 8
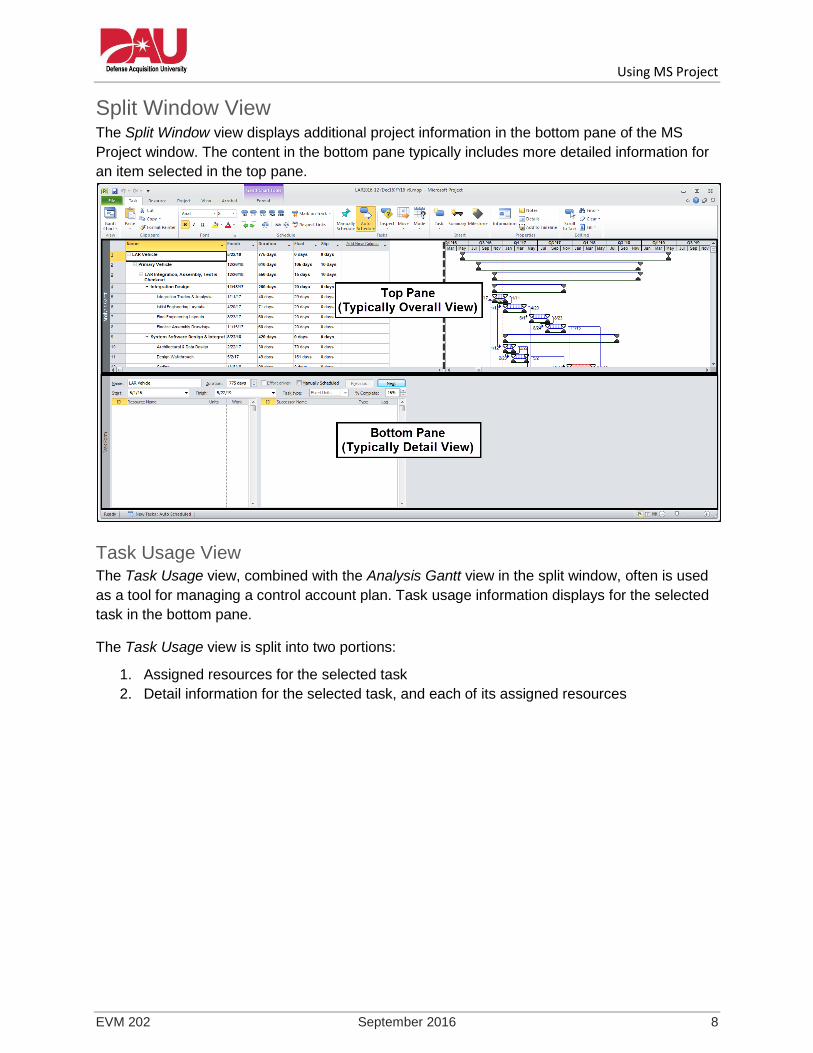
Split Window View The Split Window view displays additional project information in the bottom pane of the MS
Project window. The content in the bottom pane typically includes more detailed information for
an item selected in the top pane.
Task Usage View The Task Usage view, combined with the Analysis Gantt view in the split window, often is used
as a tool for managing a control account plan. Task usage information displays for the selected
task in the bottom pane.
The Task Usage view is split into two portions:
1. Assigned resources for the selected task
2. Detail information for the selected task, and each of its assigned resources

Using MS Project
EVM 202 September 2016 9
This example displays information about the Exhaust System summary task. The top pane
displays the Analysis Gantt view, and the bottom pane displays the assigned resources and
detailed resource information for the selected task: Develop Interface Specs – Exhaust System.
Assigned Resources
The Assigned Resources section of the Task Usage view displays summary information about
all of the selected task's assigned resources.
This example displays the assigned resources for the Develop Interface Specs – Exhaust
System task, and their associated baseline work and work hours, and baseline cost and cost
amounts.
Note: You may select different column data for the displayed task, depending on
your needs.

Using MS Project
EVM 202 September 2016 10
Details
The Details section of the Task Usage view breaks out information about all of the selected
task's assigned resources across the program timeline.
This example breaks out information about each resource for the Develop Interface Specs –
Exhaust System task. In this case, work, cost amounts, and baseline work hours are broken out
from June through October.
Note: You may select different detail data for the displayed task, depending on your
needs.
Using MS Project
EVM 202 September 2016 11
Part 2—Step-By-Step Instructions
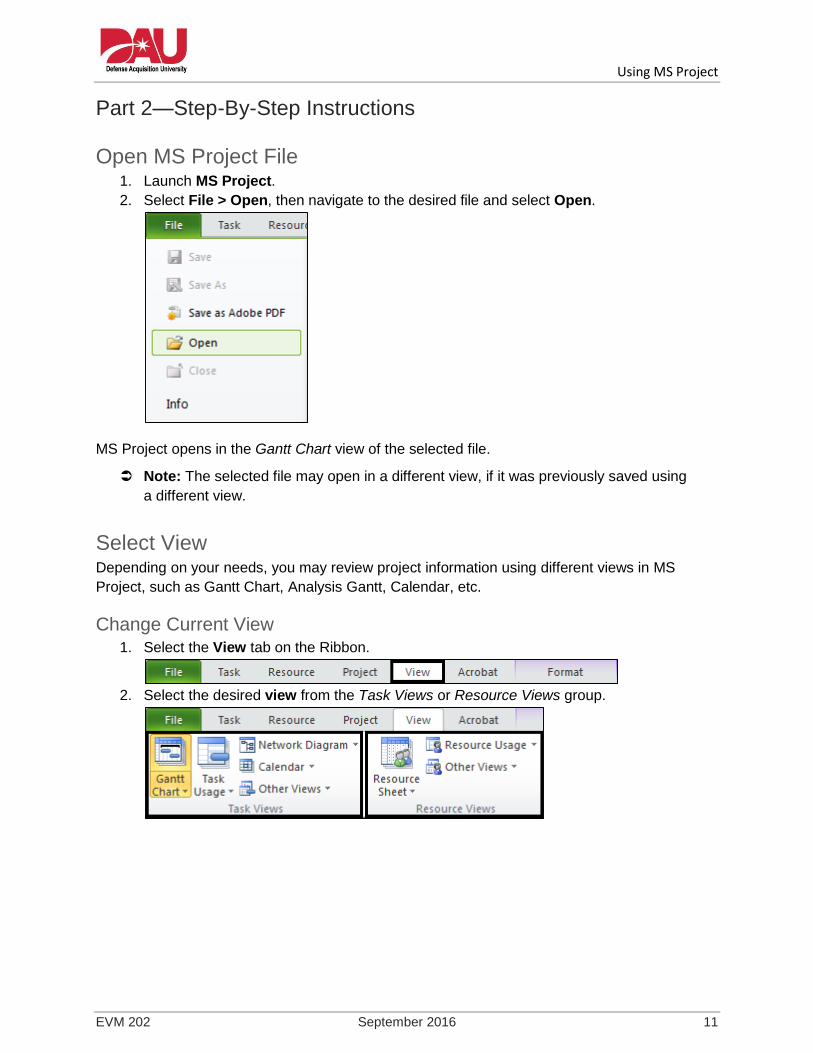
Open MS Project File 1. Launch MS Project.
2. Select File > Open, then navigate to the desired file and select Open.
MS Project opens in the Gantt Chart view of the selected file.
Note: The selected file may open in a different view, if it was previously saved using
a different view.
Select View Depending on your needs, you may review project information using different views in MS
Project, such as Gantt Chart, Analysis Gantt, Calendar, etc.
Change Current View 1. Select the View tab on the Ribbon.
2. Select the desired view from the Task Views or Resource Views group.

Using MS Project
EVM 202 September 2016 12
Note: You may choose from additional views by selecting options from the drop-
down menus available within each of the views.
MS Project indicates the current view above the Format tab. The following sample displays the
Gantt Chart view. This indicator also displays when viewing the selected file in the Analysis
Gantt view.

Using MS Project
EVM 202 September 2016 13
Select Split View 1. Select the View tab on the Ribbon.
2. Select the Details check box in the Split View group.
3. Select the desired view from the Details drop-down menu.
MS Project displays the selected Details view in the bottom pane.
Display Additional Information
Analysis Gantt Table View 1. Select the desired Task from the list in the Table portion of the Analysis Gantt view.
2. Select the Task tab on the Ribbon.
3. Select Information from the Properties group.

Using MS Project
EVM 202 September 2016 14
MS Project displays a Task Information dialog box with details about the selected task, including
general task data, task predecessors, assigned resources, and more.
Note: You may also launch the Task Information dialog box by double-clicking the
desired task in the Table portion of the Analysis Gantt view.
Note: You may view additional information for other views (e.g., Resource Sheet,
Resource Usage, etc.) by following similar steps (i.e., Select Information from the
Properties group on the Resource tab, or double-clicking the desired item.).
Analysis Gantt Bar Chart View 1. Place your cursor over the desired item (i.e., bar, line, or graphic) in the Bar Chart
portion of the Analysis Gantt view.
2. Hold the cursor in place.
MS Office displays a legend box with details about the targeted item/task. The detailed
information includes the task:
Type (e.g., summary, non-critical, critical)
Name
Start and finish dates
Duration

Using MS Project
EVM 202 September 2016 15
This example displays legend boxes for the LAR Vehicle summary baseline, Initial Engineering
Layouts non-critical task, and Coding critical task.
Edit Analysis Gantt View
Insert/Hide Columns in Table View 1. Insert columns:
a. Select the Format tab on the Ribbon.
b. Select Insert Column from the Columns group, or select the Add New Column
drop-down menu.
c. Select the desired column from the list.
Using MS Project
EVM 202 September 2016 16
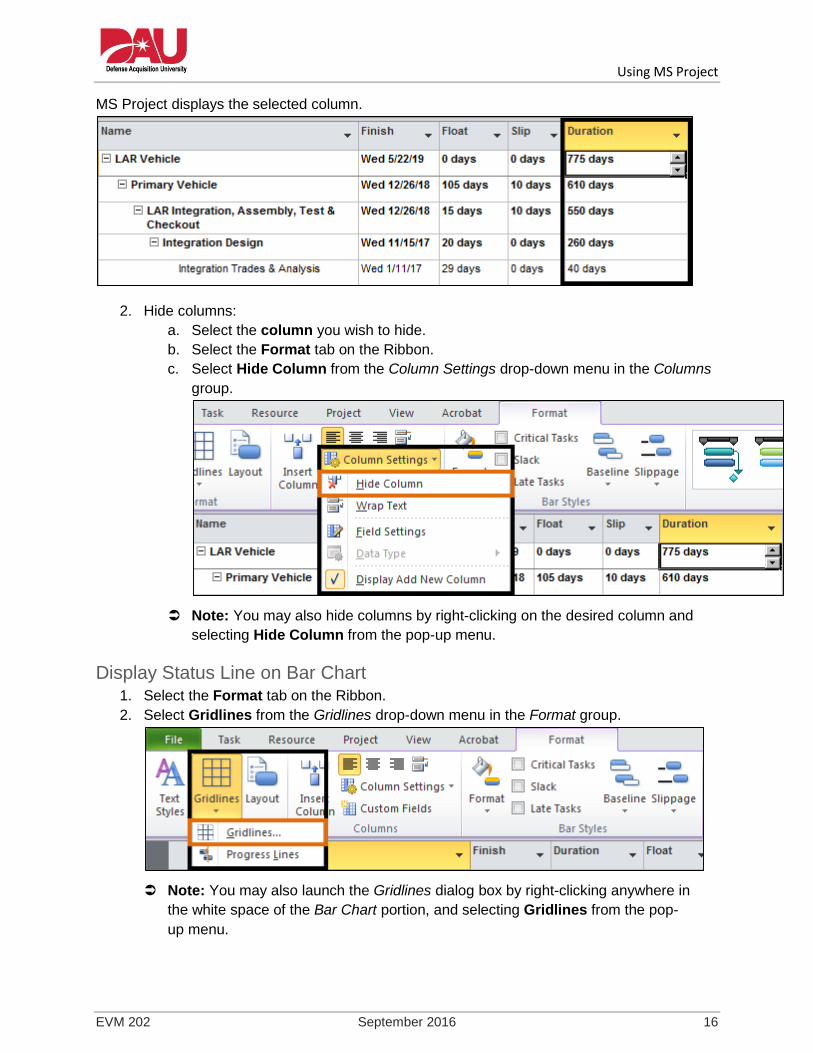
MS Project displays the selected column.
2. Hide columns:
a. Select the column you wish to hide.
b. Select the Format tab on the Ribbon.
c. Select Hide Column from the Column Settings drop-down menu in the Columns
group.
Note: You may also hide columns by right-clicking on the desired column and
selecting Hide Column from the pop-up menu.
Display Status Line on Bar Chart 1. Select the Format tab on the Ribbon.
2. Select Gridlines from the Gridlines drop-down menu in the Format group.
Note: You may also launch the Gridlines dialog box by right-clicking anywhere in
the white space of the Bar Chart portion, and selecting Gridlines from the pop-
up menu.
Using MS Project
EVM 202 September 2016 17
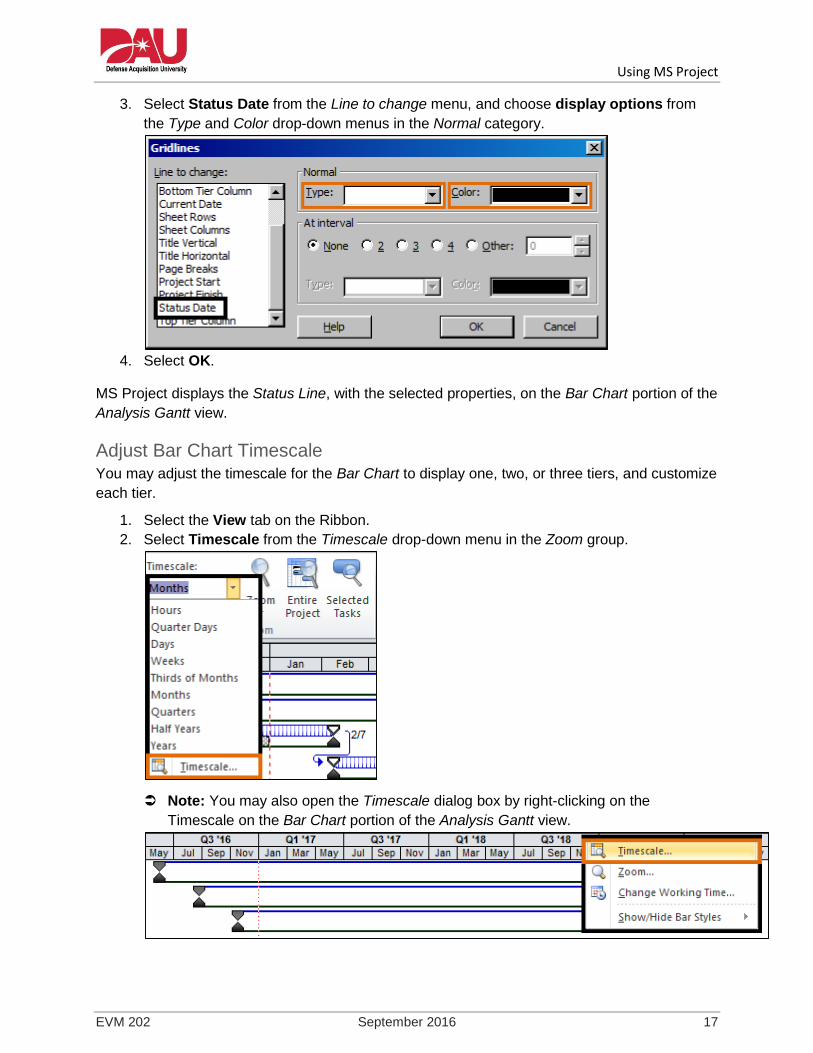
3. Select Status Date from the Line to change menu, and choose display options from
the Type and Color drop-down menus in the Normal category.
4. Select OK.
MS Project displays the Status Line, with the selected properties, on the Bar Chart portion of the
Analysis Gantt view.
Adjust Bar Chart Timescale You may adjust the timescale for the Bar Chart to display one, two, or three tiers, and customize
each tier.
1. Select the View tab on the Ribbon.
2. Select Timescale from the Timescale drop-down menu in the Zoom group.
Note: You may also open the Timescale dialog box by right-clicking on the
Timescale on the Bar Chart portion of the Analysis Gantt view.

Using MS Project
EVM 202 September 2016 18
The Timescale dialog box displays with the Middle Tier tab already selected.
3. Select the desired number of Tiers from the Show drop-down menu in the Timescale
options category.
4. Format each tier:
a. Select the desired tab.
b. Select the desired options from the tier formatting category.
c. Repeat steps 4a and 4b for each tier.
5. Select OK.
Using MS Project
EVM 202 September 2016 19
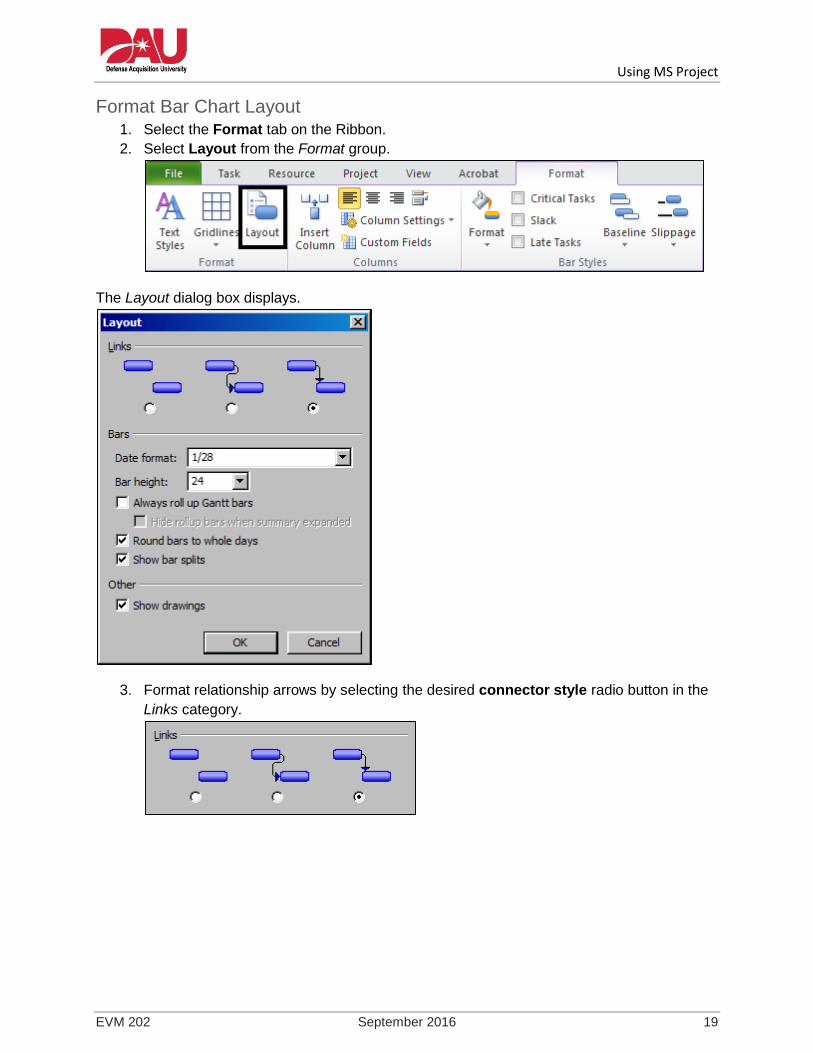
Format Bar Chart Layout 1. Select the Format tab on the Ribbon.
2. Select Layout from the Format group.
The Layout dialog box displays.
3. Format relationship arrows by selecting the desired connector style radio button in the
Links category.

Using MS Project
EVM 202 September 2016 20
4. Format the Gantt bars by selecting the desired options in the Bars category.
5. Select OK.
MS Project displays the Bar Chart view with the selected properties.
Filter Data
View/Hide Summary Tasks and Outline Numbers 1. Select the Format tab on the Ribbon.
2. Select the check box for the desired feature in the Show/Hide group.
MS Project displays or hides the corresponding features in the Table and/or Bar Chart portions
of the Analysis Gantt view (or other selected view, if applicable).

Using MS Project
EVM 202 September 2016 21
Filter on Column Data You can filter column data using MS Project's built-in AutoFilters.
1. Select the View tab on the Ribbon.
2. Select Display AutoFilter from the Filter drop-down menu in the Data group.
MS Project displays AutoFilter arrows on the column headings in the Table portion of the
Analysis Gantt view (or other selected view, if applicable).
3. Select the AutoFilter arrow for the desired column.
Using MS Project
EVM 202 September 2016 22
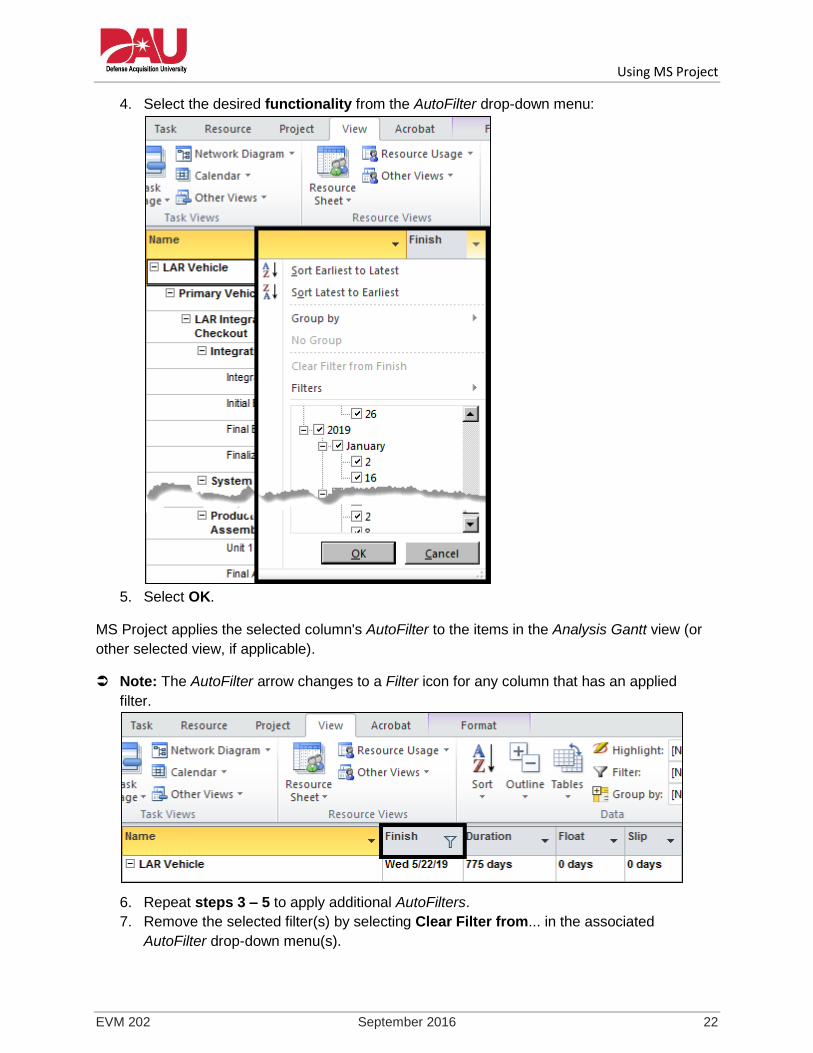
4. Select the desired functionality from the AutoFilter drop-down menu:
5. Select OK.
MS Project applies the selected column's AutoFilter to the items in the Analysis Gantt view (or
other selected view, if applicable).
Note: The AutoFilter arrow changes to a Filter icon for any column that has an applied
filter.
6. Repeat steps 3 – 5 to apply additional AutoFilters.
7. Remove the selected filter(s) by selecting Clear Filter from... in the associated
AutoFilter drop-down menu(s).

Using MS Project
EVM 202 September 2016 23
Add a Custom Filter MS Project includes several built-in filters, and you may also create your own custom filters.
1. Select the View tab on the Ribbon.
2. Apply a filter:
a. Select the desired Filter from the Filter drop-down menu in the Data group.
Note: Access additional filters by selecting More Filters… in the Filter drop-
down menu.
b. Enter additional filter information as required.
Note: Items in the drop-down menu ending with an ellipsis (e.g., Date Range…,
Task Range…, etc.) require you to enter additional information into an associated
dialog box.
c. Select OK.
d. Repeat steps 2a – 2c to apply additional filters.
3. Create a new filter:
a. Select New Filter from the Filter drop-down menu in the Data group.
MS Project displays the Filter Definition dialog box.
Using MS Project
EVM 202 September 2016 24
b. Enter a Name for the new filter.
c. Select the desired criteria for the new filter
d. Select OK.
e. Repeat steps 3a – 3d to create additional filters.
Note: See the MS Project embedded Help functionality for more detail about creating
filters.