using pmplan advance alnik solutions copyright 2008 version 3.4.0.81 or higher required all features...
TRANSCRIPT

Using PMPlan Advance
AlNik Solutions
Copyright 2008
Version 3.4.0.81 or higher required all features shown

Agenda
• Review of Basic Features• Review of Reports• File Protection• Working with Master
Resource Pool(s)• Interfacing with MS Project• Creating Slide Reports
– Manually– Auto Generate
• Creating Custom Reports• Controlling Graphical
Formats
• Scaling Work Effort• “Multi-Users” Project Plan
Development• “Multi-Users” EVM Input• Transferring to MS Excel
and Word• Repeating Tasks• Scheduling Tips• MPM Interface• ProPricer Interface• Creating Job Categories

Review of Basic Features

New Project Form
• Title• Start Date• Objective• Fiscal Month• Default Loading
Method• Work Days• Starting Day of Work
Week

Initial after starting new project

Developing WBS – General Notes

Activity Definition – Using Task Properties Dialog
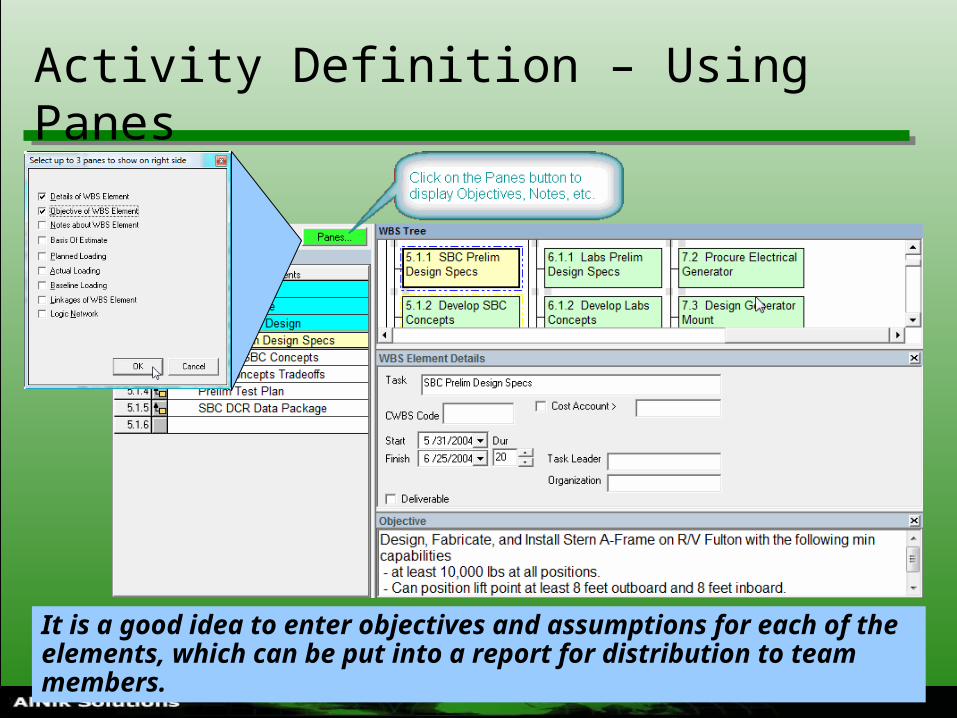
Activity Definition – Using Panes
It is a good idea to enter objectives and assumptions for each of the elements, which can be put into a report for distribution to team members.

Moving Tasks
Use the Drag Method to move tasks. Cut and Paste will lose external linkages.

Milestones Tab
Milestones are critical events, and not Activities for planning costs. Therefore, Milestones are scheduled events that depict major project milestones such as IDR, PDR, etc, and are linked logically to WBS elements.

Activity Sequencing – Manual Methods

Activity Sequencing – Dragging Method

Milestones on Schedule TabWith the triangle cursor, left clicking here will create a milestone on the date shown in the upper right corner.
If hold down the left button, can drag the milestone to a new date and row.
If click, the right button. The milestone properties dialog box will be displayed.

Milestone Properties Dialog Box
• General Tab– Can change displayed
properties
• Linkages Tab– Provides table for creating,
deleting, and modifying linkages
• Note Tab– Provides place to write
comments about the milestone.
• Format Tab– Can change symbol type, size,
fill color, and border color– Don’t select a fill color of black,
since a completed milestone will be filled with black.

Using the Calendar Scroom Control
Drag Scale
Back One Month
Drag Start
Drag Start
Forward One Month
Back Six Month
Add One Month
Forward Six MonthRemove One Month
Add Six Month
Remove Six Month
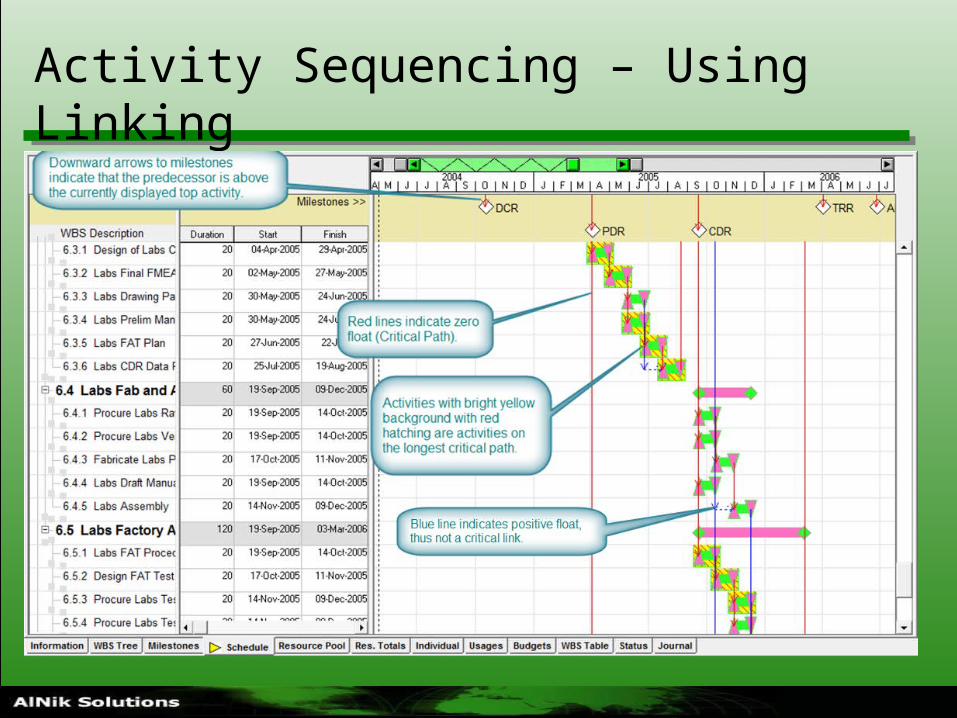
Activity Sequencing – Using Linking

Activity Sequencing – Linking Modes
Start - Finish
Start – Start
Finish – Finish
Finish – Start
Over Successor
Over PredecessorDefaultLinking Modes
Depressed button determines next linkage mode, which will display cursor as shown in table below. This value determines lag (positive) or
lead (negative) of next link created.
Center Circle is hotspot of Cursor.

Linking Process in Schedule Tab
Click graphic to start movie
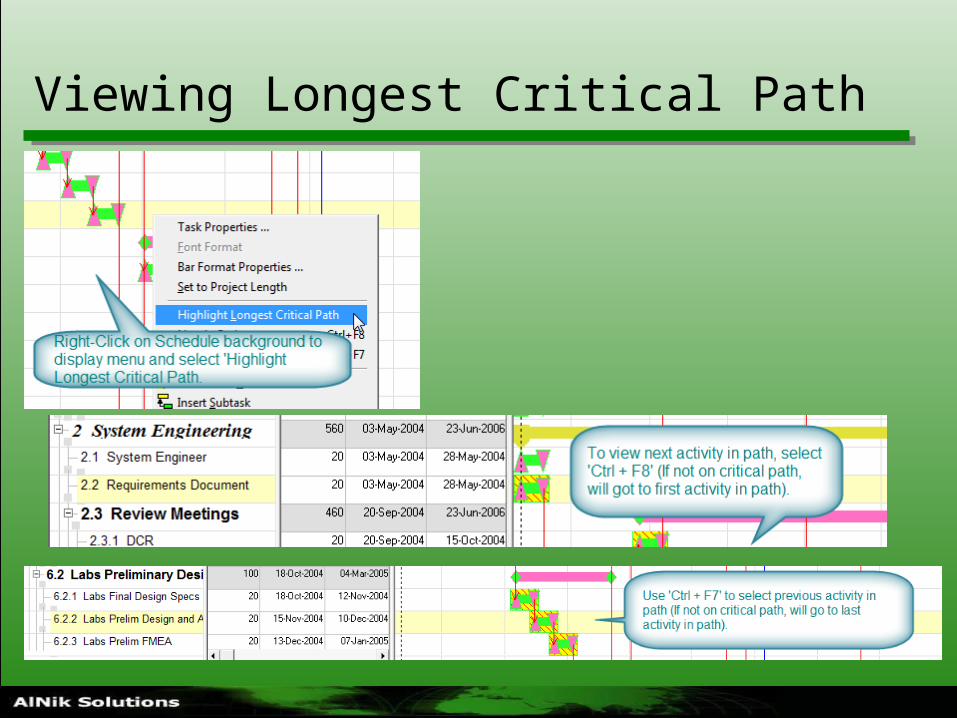
Viewing Longest Critical Path

Activity Sequencing – Logic Network
Select ‘Logic Network’ from ‘Panes’ button in WBS Tree Tab
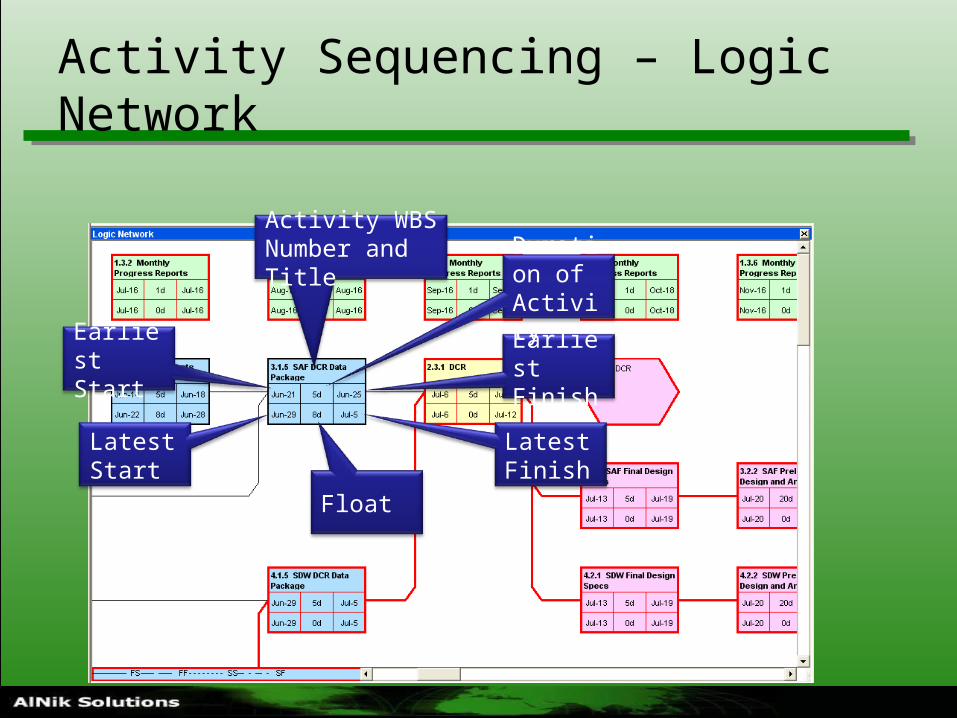
Activity Sequencing – Logic Network
Earliest Finish
Activity WBS Number and Title Duration
of Activity
Earliest Start
Latest Finish
Latest Start
Float

Resource Pool

PMPlan Rules for Loading and Costing
• Planned Resource Loading can only be entered at the Activity Level. The user can review rollup impacts on the upper levels of the WBS.
• Loading can be accomplished at three locations:– Resource Totals Tab– Individual Tab– Loading by WBS Element in the Planned Loading Pane
• Actual Costs and Resources can only be entered at the Control Account Level.
• Shortening the duration of an Activity with resource loading results in all loading occurring after the end of the shorter activity, being assigned to the last workday of the activity.

Loading and Costing – Resource Totals

Resource Planning – Details
Detailed information can be entered for travel, material, services, etc., providing evidence to support the estimates.

BOE Mode for Resource Totals

Basis Of Estimate Views
• Text for defining the “Basis Of Estimate” can be filled in at three locations:– Right-click on an activity,
select “Task Information, select “BOE” tab (sample to right)
– Add BOE pane to WBS Tree Tab
– Setting Res Totals in BOE mode in the Tools | Options
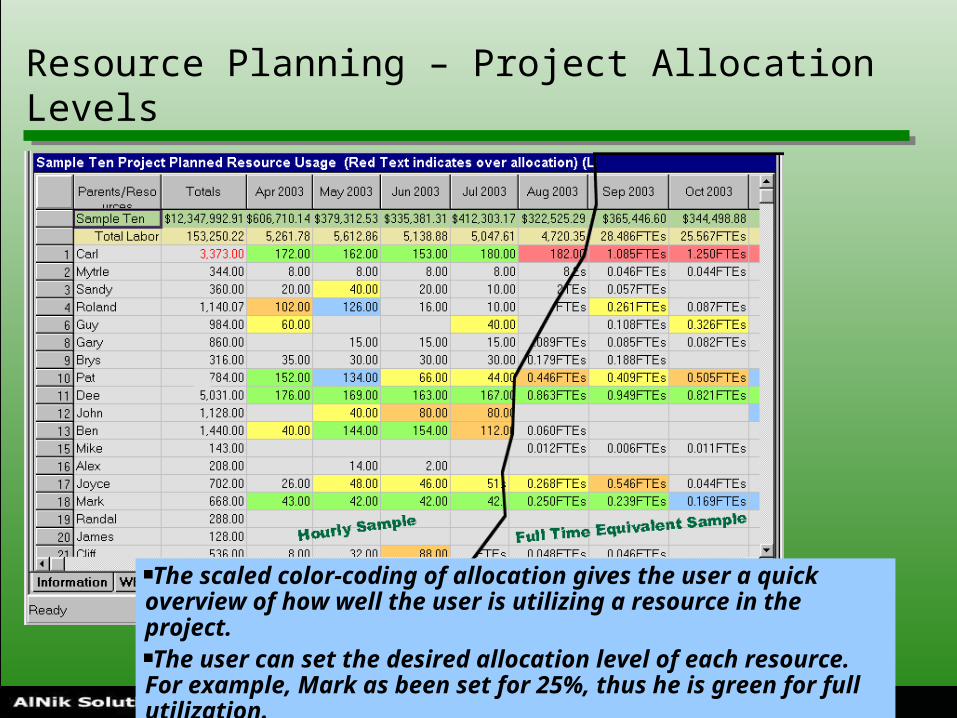
Resource Planning – Project Allocation Levels
The scaled color-coding of allocation gives the user a quick overview of how well the user is utilizing a resource in the project.The user can set the desired allocation level of each resource. For example, Mark as been set for 25%, thus he is green for full utilization.

Cost Estimating - Budgets
Budgets can be viewed in daily, weekly, monthly, quarterly, annual, or fiscal time periods. The numbers can also be cumulative.

Loading and Costing – Individual Tab
Planning for individual labor resource, by activity and schedule.
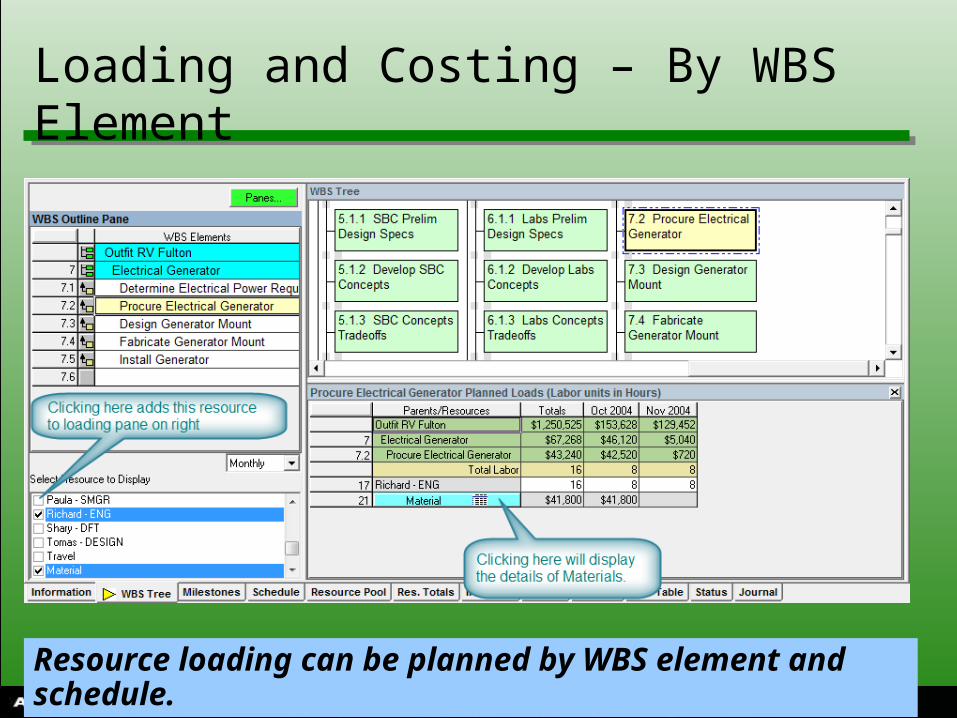
Loading and Costing – By WBS Element
Resource loading can be planned by WBS element and schedule.

Control Accounts and Deliverables
This table is for identifying Work Packages, Deliverables, and for entering text in different fields of each task/activity. This table can be Customized!

Status Tab – Performance Reporting
PMPlan can import actual costs from an intranet source.

Variance Analysis Report

Review of Reports
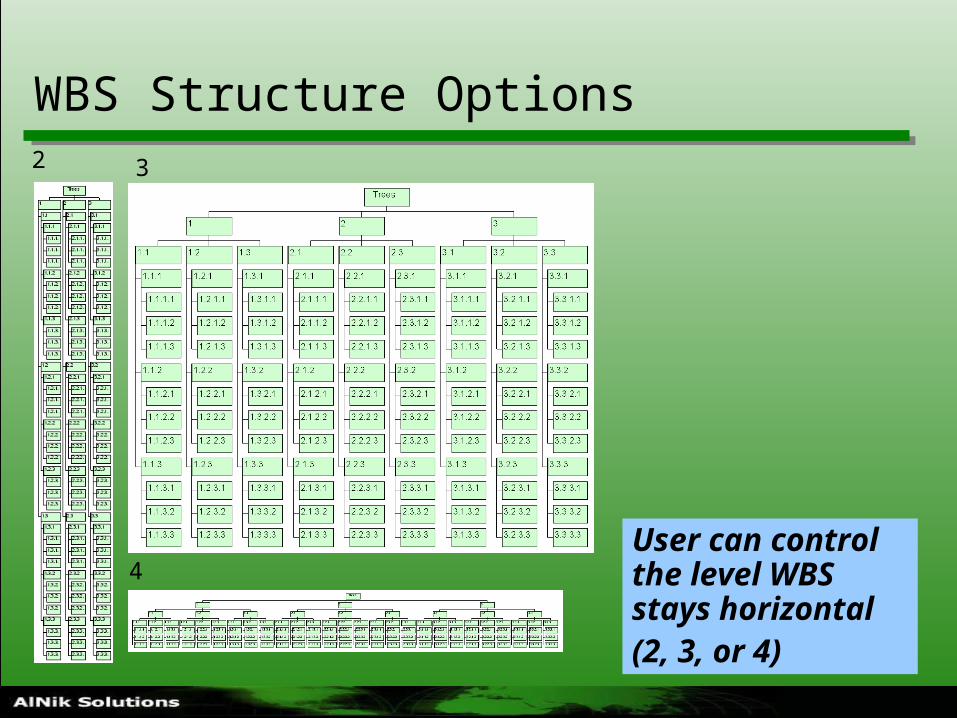
WBS Structure Options
User can control the level WBS stays horizontal (2, 3, or 4)
2 3
4

WBS Dictionary Report
The narrative outline can be exported from PMPlan into an RTF Word Processor.

Basis of Estimate (Horizontal Mode)Project: Bedroom Set for Dennis and Emily
Quotation Backup Data
Task Description, Resource RequirementsProposal Number: CP2004-149 Date/Time 12-Jan-07 10:39
Contract Number: GOV47-2004-34985
CWBS Code: 1000CD Leader: Bonnie Lead Sign: _______________
WBS Title: Concept Development Organization: Fine Furniture PE Sign: _______________
TL SOW Para: 5.2.1.1 PM Sign: _______________
WBS SOW:
WBS No. Planned Task Resource Totals Start Date End DateDuration
(days)Budget Labor Totals Bonnie Travel
1 Concept Development 02/Jan/2002 30/Jan/2002 21 $5,440 64 64 $1,600
Basis>
1.1 Portfolio of Bedroom Furniture 02/Jan/2002 15/Jan/2002 10 $1,440 24 24
Basis>The estimate for creating the portifolio is based on the aveage time to put together previous portifolio.
1.2 Meet with Dennis and Emily 16/Jan/2002 16/Jan/2002 1 $2,560 16 16 $1,600
Basis>
Travel time is 2 hours to airport, 8 hours to San Diego, 4 hour meeting with clients, 8 hours return plus 1 hour to get home for a total of 23 hours, but choose to charge clients only 16 hours.
1.3 Design Specifications 17/Jan/2002 30/Jan/2002 10 $1,440 24 24
Basis> Assuming 4 pieces x 6 hours per piece.
Assumptions and Rationale: Non-Labor Details for Concept DevelopmentPlanned Loading for TravelTravel Between Persons Days Airfare per Per Diem Ground Cost/Trip Basis
Costs ->
Nashua, NH to San Diego,CA 1 2 $1,200 $150 $100 $1,600 Agent
Travel Between Trips
$1,600
Nashua, NH to San Diego,CA 1
The individual resources are shown horizontally and only the loaded resources are displayed
This mode includes BOE’s of the subtasks
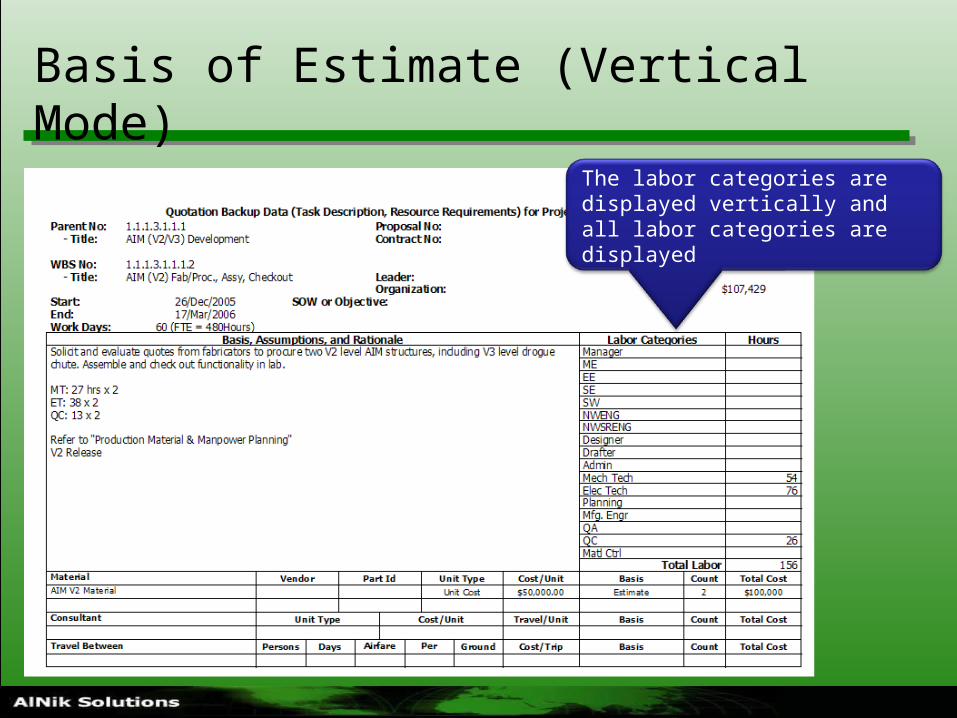
Basis of Estimate (Vertical Mode)
The labor categories are displayed vertically and all labor categories are displayed

Scheduled Deliverables Report
The List of Deliverables may be exported into a proposal.

Task Manager Work Authorization

Work Authorization (Cont.)
All information in this Work Authorization is available from information entered into PMPlan.

Cost/Schedule Status Report
Earned Value reporting.

Graphic Performance Report
The Variance Trend graph provides a better indication of performance issues.

Gantt Status Report
A visual picture of project status against schedule.
This activity is incomplete and is behind schedule
This activity is ahead of schedule
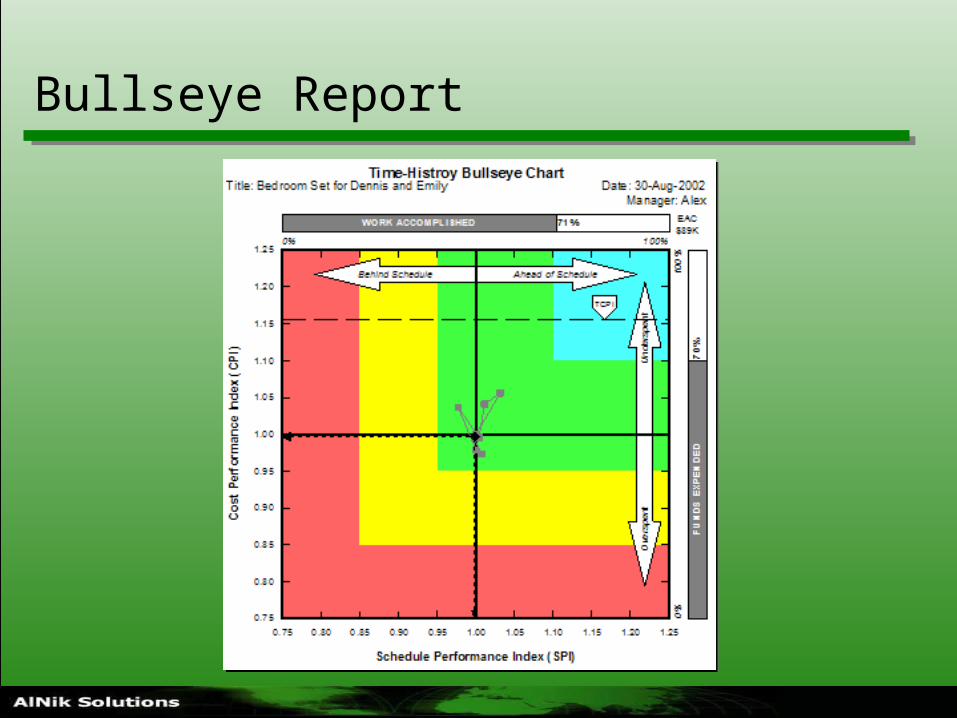
Bullseye Report

Project File Protection Modes
• A PMPlan Project File can be protected from being changed or viewed.
• To display the Protection Dialog, select Menu (Tools | Protection)
• Password must be 5 to 8 letters or numbers. No special characters. Letters are not case sensitive.

Working with Master Resource Pool(s)
MRP Controller• Create Resource Pool setting the Rate
Factor to 1 and Effective Date early enough for all current projects.
• Password protect Resource Pool (Use letters and numbers only) (Using this will force user to get a new resource pool when missing staff are needed)
• Set Project File Protection to require password to open.
• Save Project File.
• When user requests MRP– Open MRP project file– Select Resource Pool Tab– Adjust Rate Factor for type of project– Save Resource Pool (will have .anr file
extension).– Send Resource Pool file to user
Project User• Request a Resource Pool file.• Open project file• Load resource pool file by selecting
menu (Tools | Utilities | Load Resource Pool) (If user loads from within Resource Pool Tab, the application will go to the WBS Tree Tab).
• If need additional staff, request MRP Controller to add to master resource pool.
• Re-Loading a Resource Pool File will not change your current loading.

Interfacing with MS Project

Importing a MS Project File
Steps to Import• Open PMPlan
• Select ‘Cancel’ on startup dialog
• Select menu ‘File | Import MS Project’
• Select an MS Project file to be imported (it cannot be protected).
• If you get the message “Link already exists”, click okay
• Depending on the number of linkages, it can take several minutes to import.
Data Imported• Task Titles (first 40 characters)
and WBS
• Milestones are set to 1 day activities
• Standard Work Calendar
• Starts and Finishes (Baseline, Planned, Actual)
• Linkages and Constraints (Summary Linkages are moved to equivalent activities)
• Resource Pool
• Resource Loading auto-spread over activities duration

Issues that need to be considered after Importing from MS Project
• Select ‘Information’ Tab, replace the Project Description text ‘Was Blank’
• The user should save the file, quit and restart PMPlan to get the Gantt Format to reset to the default settings
• % Complete information does not import
• MS Project assigns ‘Start No Earlier than’ date constraint on all non-linked activities that start after the project start, therefore if two of these activities are linked, the user may need to remove the constraint on the successor activity to get it to re-schedule.

Exporting to MS Project
• Select ‘File | Export MS Project’• Creates MS Project compatible file with an
extension of .mdb• WBS, Schedule (Baseline, Planned, and Actual),
linkages are exported.• To send a client a standard .mpp file, the user
needs to open the .mdb file in MS Project. Then save as a file with the .mpp extension.
• Export always overwrites an existing file.

Exporting to MS Project (continued)
• Currently, PMPlan exports the following information directly to an MS Access file that is compatible with MS Project 2000 through 2007.– Default workweek settings– Milestones (Positioned at top of listing) – Work Breakdown Structure – Schedule (Baseline, Planned, Actual)– Percent Complete– Logic Network Links– Plus extra data shown on next slide

Exporting to MS Project (continued)
The other PMPlan data that is exported to MS Project is defined in the this table. It will be necessary in MS Project to manually insert the columns (fields) of interest to receive this data.
PMPlan Fields MS Project Fields
Control Account Text1
Group Text2
WBS Number Text3
CWBS Code Text4
Leader Contact
Text1 to Text14 Text11 to Text24
Cost1 to Cost8 Cost1 to Cost8
Is Deliverable Flag1
Is Control Account Flag2
YesNos0 to YesNos9 Flag10 to Flag19
Date1 to Date8 Date1 to Date8
Approved Date Date9
Number0 to Number9 Number1 to Number10
Byte0 to Byte8 Number11 to Number19

Reconcile Schedule between MS Project & PMPlan
• Export from PMPlan to MS Project• To reconcile schedule in MS Project, the user can
– Add and delete tasks– Add and delete milestones (new milestones that are positioned above the
first level 2 task will be treated has major milestones, all others will be treated as 1 day activities
– Change the planned and actual dates, and– Add, delete, and modify linkages.
• To reconcile schedule in PMPlan, select Menu ‘File | Update Schedule from MS Project’
• User needs to answer two questions,– Does the user want to copy any new tasks or milestones– Are the Milestones grouped at the top and tasks at bottom
• PMPlan will update planned schedule, linkages, and add new tasks or milestones

Creating Presentation Sets

Tips for Manually Creating Presentations
• Set reports to Landscape
• Consider using ‘Fit to Page’
• To Send individual reports to PowerPoint, use the Slide Button
• Once a presentation is started, do not work in PowerPoint until all slides are created from PMPlan.

Slide Notes
• Some of the Slides of this Presentation were generated by clicking ‘Slide’ button in Report Preview.
• Some of the Slides of this Presentation were generated using a presentation script created in Notepad.
• Instructions for each type of report that can be generated by a script will be addressed later in this presentation.
• The balloons with text are manually generated notes to provide you with tips to get this slide.
• The presentation will remain open until closed by user.• If PMPlan fails to paste the report, delete the empty slide
and click the ‘Slide’ button again.

PMPlan Sample Slides
• Bedroom Set for Dennis and Emily
• Created: 9/10/2006 10:54:53 AM
The first time ‘Slide’ is clicked, • Microsoft PowerPoint is opened, • A new presentation is created,• If user has a blank.pot (presentation template file), it is loaded, • This slide is generated with Project Title and Time Stamp,• Then a slide of the current PMPlan Preview Report is created,• Each additional click of the ‘Slide’ button, a new slide is added.

Work Breakdown Structure
1 Concept Development
1.1 Portfolio of Bedroom Furniture
1.2 Meet with Dennis and Emily
1.3 Design Specifications
Bedroom Set for Dennis and Emily
2 Preliminary Design
2.1 Canopy Bed
2.2 Corner Desk
2.3 High-Boy
2.4 Amoire
2.5 Presentation Portfolio
2.6 Meeting with Client
2.7 Detail Design Specs
3 Final Design
3.1 Canopy Bed
3.2 Corner Desk
3.3 High-Boy
3.4 Amoire
3.5 Presentation Portfolio
3.6 Meeting with Client
3.7 Build Specs
4 Fabrication Phase
4.1 Produre Material
4.2 Canopy Bed
4.3 Corner Desk
4.4 High-Boy
4.5 Amoire
4.6 Deliver and Install Bedroom Set
Page Setup should be landscape and set to ‘Fit to Page’
In ‘Tool | Options’, set textbox size to
control aspect ratio.

Listing of Deliverables
Description Planned Forecasted Actual Date Approved1.1 Portfolio of Bedroom Furniture 15/Jan/2002 15/Jan/2002 15/Jan/2002 01/Mar/20022.5 Presentation Portfolio 27/Mar/2002 27/Mar/2002 27/Mar/20023.5 Presentation Portfolio 24/May/2002 24/May/2002 24/May/20024.6 Deliver and Install Bedroom 23/Dec/2002 23/Dec/2002
Deliverables for Bedroom Set for Dennis and Emily
WBSNumber
Description Planned Finish
4.6 Deliver and Install Bedroom Set 23-Dec-2002
Deliverables to Complete
PMPlan automatically crops the margins and resize, while maintaining pasted aspect ratio, each report to fill user’s
Object Area

Schedule2001
Dec Jan Feb Mar Apr May Jun Jul Aug Sep Oct Nov
2002
Dec
Status Date: 30/Aug/2002
Milestones
CDR PDR FDRInstalled
WBS Description Duration Start Finish
1 Concept Develop 21 1/2/2002 1/30/2002
2 Preliminary Desig 52 1/31/2002 4/12/2002
3 Final Design 41 4/15/2002 6/10/2002
4 Fabrication Phas 140 6/11/2002 12/23/2002
4.1 Produre Material 40 6/11/2002 8/5/2002
4.2 Canopy Bed 20 8/6/2002 9/2/2002
4.3 Corner Desk 20 8/6/2002 9/2/2002
4.4 High-Boy 80 8/6/2002 11/25/2002
4.5 Amoire 20 8/6/2002 9/2/2002
4.6 Deliver and Install Bedroom Set
20 11/26/2002 12/23/2002
In ‘Tool | Options’, the show Project
Row is unselected

Resource Totals
WBS No. Planned Task Resource Totals Budget Labor Totals Bonnie Charley Danielle
Frances
Gaston Hermine
Jeanne Karl Travel Material
1 Bedroom Set for Dennis and Emily $87,649 1,495 232 270 141 144 160 176 252 120 $6,400 $6,435
2 1 Concept Development $5,440 64 64 $1,600
3 1.1 Portfolio of Bedroom Furniture $1,440 24 24
4 1.2 Meet with Dennis and Emily $2,560 16 16 $1,600
5 1.3 Design Specifications $1,440 24 24
6 2 Preliminary Design $16,624 307 80 19 80 128 $1,600
7 2.1 Canopy Bed $1,344 27 8 19
8 2.2 Corner Desk $1,920 40 8 32
9 2.3 High-Boy $2,640 56 8 48
10 2.4 Amoire $6,240 136 8 128
11 2.5 Presentation Portfolio $480 8 8
12 2.6 Meeting with Client $2,560 16 16 $1,600
13 2.7 Detail Design Specs $1,440 24 24
14 3 Final Design $11,680 200 72 32 64 32 $1,600
15 3.1 Canopy Bed $1,440 32 32
16 3.2 Corner Desk $1,440 32 32
17 3.3 High-Boy $1,440 32 32
18 3.4 Amoire $1,440 32 32
19 3.5 Presentation Portfolio $1,920 32 32
20 3.6 Meeting with Client $2,560 16 16 $1,600
21 3.7 Build Specs $1,440 24 24
22 4 Fabrication Phase $53,905 924 16 270 90 176 252 120 $1,600 $6,435
23 4.1 Produre Material $5,355 8 8 $4,875
24 4.2 Canopy Bed $6,000 120 40 80
25 4.3 Corner Desk $6,000 120 40 80
26 4.4 High-Boy $19,980 402 126 252 24
27 4.5 Amoire $6,000 120 40 80
28 4.6 Deliver and Install Bedroom Set $10,570 154 16 16 90 16 16 $1,600 $1,560
Before doing the preview, the ‘Is RD’ column width was set to zero

Resource Loading
WBS No. Task Loading for Bonnie Totals Jan 2002 Feb 2002 Mar 2002 Apr 2002 May 2002 Jun 2002 Jul 2002 Aug 2002 Sep 2002 Oct 2002 Nov 2002 Dec 2002
1 Bedroom Set for Dennis and Emily 232 66 28 26 24 58 14 3 13
2 1 Concept Development 64 64
3 1.1 Portfolio of Bedroom Furniture 24 24
4 1.2 Meet with Dennis and Emily 16 16
5 1.3 Design Specifications 24 24
6 2 Preliminary Design 80 2 28 26 24
7 2.1 Canopy Bed 8 1 7
8 2.2 Corner Desk 8 0 8
9 2.3 High-Boy 8 0 5 2
10 2.4 Amoire 8 1 8
11 2.5 Presentation Portfolio 8 8
12 2.6 Meeting with Client 16 16
13 2.7 Detail Design Specs 24 24
14 3 Final Design 72 58 14
15 3.1 Canopy Bed
16 3.2 Corner Desk
17 3.3 High-Boy
18 3.4 Amoire
19 3.5 Presentation Portfolio 32 32
20 3.6 Meeting with Client 16 16
21 3.7 Build Specs 24 10 14
22 4 Fabrication Phase 16 3 13
23 4.1 Produre Material
24 4.2 Canopy Bed
25 4.3 Corner Desk
26 4.4 High-Boy
27 4.5 Amoire
28 4.6 Deliver and Install Bedroom Set 16 3 13

Project Resources Usage
Parents/Resources Totals Jan 2002 Feb 2002 Mar 2002 Apr 2002 May 2002 Jun 2002 Jul 2002 Aug 2002 Sep 2002 Oct 2002 Nov 2002 Dec 2002
Bedroom Set for Dennis and Emily $87,649 $6,126 $10,666 $3,832 $4,896 $7,360 $5,907 $276 $23,093 $7,484 $7,211 $4,872 $5,928
Total Labor 1,495 79 228 41 101 109 17 5 462 150 145 36 123
1 Bonnie 232 66 28 26 24 58 14 3 13
2 Charley 270 3 5 153 48 46 3 13
3 Danielle 141 2 18 19 13 18 72
4 Frances 144 3 62 14 38 26
5 Gaston 160 8 120 19 13
6 Hermine 176 152 8 3 13
7 Jeanne 252 76 84 92
8 Karl 120 82 10 7 8 13
9 Travel $6,400 $1,600 $1,600 $1,600 $1,600
10 Material $6,435 $4,875 $1,560

Project Budgets
WBS No. Planned Budgets Totals Jan2002
Feb2002
Mar2002
Apr2002
May2002
Jun2002
Jul 2002 Aug2002
Sep2002
Oct2002
Nov2002
Dec2002
1 Bedroom Set for Dennis and Emily $87,649 $6,126 $10,666 $3,832 $4,896 $7,360 $5,907 $276 $23,093 $7,484 $7,211 $4,872 $5,928
2 1 Concept Development $5,440 $5,440
3 1.1 Portfolio of Bedroom Furniture $1,440 $1,440
4 1.2 Meet with Dennis and Emily $2,560 $2,560
5 1.3 Design Specifications $1,440 $1,440
6 2 Preliminary Design $16,624 $686 $10,666 $3,832 $1,440
7 2.1 Canopy Bed $1,344 $112 $1,232
8 2.2 Corner Desk $1,920 $96 $1,824
9 2.3 High-Boy $2,640 $88 $1,760 $792
10 2.4 Amoire $6,240 $390 $5,850
11 2.5 Presentation Portfolio $480 $480
12 2.6 Meeting with Client $2,560 $2,560
13 2.7 Detail Design Specs $1,440 $1,440
14 3 Final Design $11,680 $3,456 $7,360 $864
15 3.1 Canopy Bed $1,440 $864 $576
16 3.2 Corner Desk $1,440 $864 $576
17 3.3 High-Boy $1,440 $864 $576
18 3.4 Amoire $1,440 $864 $576
19 3.5 Presentation Portfolio $1,920 $1,920
20 3.6 Meeting with Client $2,560 $2,560
21 3.7 Build Specs $1,440 $576 $864
22 4 Fabrication Phase $53,905 $5,043 $276 $23,093 $7,484 $7,211 $4,872 $5,928
23 4.1 Produre Material $5,355 $5,043 $276 $36
24 4.2 Canopy Bed $6,000 $5,700 $300
25 4.3 Corner Desk $6,000 $5,700 $300
26 4.4 High-Boy $19,980 $5,957 $6,584 $7,211 $230
27 4.5 Amoire $6,000 $5,700 $300
28 4.6 Deliver and Install Bedroom Set $10,570 $4,642 $5,928

Deliverables to Complete
WBSNumber
Description Planned Finish
4.6 Deliver and Install Bedroom Set 23-Dec-2002
Deliverables to Complete
When previewing custom reports, the Slide Title is based on report
title.
The table was dragged downward
manually.

Project Status
WBS No. Description ControlAccount
TotalBudget
PlannedValue
PercentComplete
EarnedValue
Actual Cost OpenCommitmen
ScheduleVariance
CostVariance
Estimate atCompletion
Variance atCompletion
SPI CPI
Total with Fee $100,000 $69,260 $69,174 $69,374 $0 ($86) ($200) $98,999 $1,001
Management Reserve $5,321 $5,321
Undistributed Budget ($2,970) ($2,970)
Fee $10,000 $7,104 $7,104 $7,104 $10,000
1 Bedroom Set for Dennis and Emily $87,649 $62,156 70.82 $62,070 $62,270 $0 ($86) ($200) $88,999 ($1,350) 0.999 0.99
2 1 Concept Development CD $5,440 $5,440 100.00 $5,440 $5,395 $0 $0 $45 $5,395 $45 1.000 1.00
3 1.1 Portfolio of Bedroom Furniture $1,440 $1,440 100.00 $1,440 --- --- $0 --- --- --- 1.000 ---
4 1.2 Meet with Dennis and Emily $2,560 $2,560 100.00 $2,560 --- --- $0 --- --- --- 1.000 ---
5 1.3 Design Specifications $1,440 $1,440 100.00 $1,440 --- --- $0 --- --- --- 1.000 ---
6 2 Preliminary Design PD $16,624 $16,624 100.00 $16,624 $15,675 $0 $0 $949 $15,675 $949 1.000 1.06
7 2.1 Canopy Bed $1,344 $1,344 100.00 $1,344 --- --- $0 --- --- --- 1.000 ---
8 2.2 Corner Desk $1,920 $1,920 100.00 $1,920 --- --- $0 --- --- --- 1.000 ---
9 2.3 High-Boy $2,640 $2,640 100.00 $2,640 --- --- $0 --- --- --- 1.000 ---
10 2.4 Amoire $6,240 $6,240 100.00 $6,240 --- --- $0 --- --- --- 1.000 ---
11 2.5 Presentation Portfolio $480 $480 100.00 $480 --- --- $0 --- --- --- 1.000 ---
12 2.6 Meeting with Client $2,560 $2,560 100.00 $2,560 --- --- $0 --- --- --- 1.000 ---
13 2.7 Detail Design Specs $1,440 $1,440 100.00 $1,440 --- --- $0 --- --- --- 1.000 ---
14 3 Final Design FD $11,680 $11,680 100.00 $11,680 $11,600 $0 $0 $80 $11,600 $80 1.000 1.00
15 3.1 Canopy Bed $1,440 $1,440 100.00 $1,440 --- --- $0 --- --- --- 1.000 ---
16 3.2 Corner Desk $1,440 $1,440 100.00 $1,440 --- --- $0 --- --- --- 1.000 ---
17 3.3 High-Boy $1,440 $1,440 100.00 $1,440 --- --- $0 --- --- --- 1.000 ---
18 3.4 Amoire $1,440 $1,440 100.00 $1,440 --- --- $0 --- --- --- 1.000 ---
19 3.5 Presentation Portfolio $1,920 $1,920 100.00 $1,920 --- --- $0 --- --- --- 1.000 ---
20 3.6 Meeting with Client $2,560 $2,560 100.00 $2,560 --- --- $0 --- --- --- 1.000 ---
21 3.7 Build Specs $1,440 $1,440 100.00 $1,440 --- --- $0 --- --- --- 1.000 ---
22 4 Fabrication Phase FP $53,905 $28,412 52.55 $28,326 $29,600 $0 ($86) ($1,274) $56,329 ($2,424) 0.997 0.95
23 4.1 Produre Material $5,355 $5,355 100.00 $5,355 --- --- $0 --- --- --- 1.000 ---
24 4.2 Canopy Bed $6,000 $5,700 80.00 $4,800 --- --- ($900) --- --- --- 0.842 ---
25 4.3 Corner Desk $6,000 $5,700 80.00 $4,800 --- --- ($900) --- --- --- 0.842 ---
26 4.4 High-Boy $19,980 $5,957 36.89 $7,371 --- --- $1,415 --- --- --- 1.237 ---
27 4.5 Amoire $6,000 $5,700 100.00 $6,000 --- --- $300 --- --- --- 1.053 ---
28 4.6 Deliver and Install Bedroom $10,570 $0 0.00 $0 --- --- $0 --- --- --- No Planned Cost ---
This is the full Status Tab Table

Project Status
WBS No.
Description Total Budget PercentComplete
Actual Cost ScheduleVariance
Cost Variance Estimate atCompletion
Variance atCompletion
SPI CPI
Total with Fee $100,000 $69,374 ($86) ($200) $98,999 $1,001
Management Reserve $5,321 $5,321
Undistributed Budget ($2,970) ($2,970)
Fee $10,000 $7,104 $10,000
1 Bedroom Set for Dennis and Emily $87,649 70.82 $62,270 ($86) ($200) $88,999 ($1,350) 0.999 0.997
2 1 Concept Development $5,440 100.00 $5,395 $0 $45 $5,395 $45 1.000 1.008
3 1.1 Portfolio of Bedroom Furniture $1,440 100.00 --- $0 --- --- --- 1.000 ---
4 1.2 Meet with Dennis and Emily $2,560 100.00 --- $0 --- --- --- 1.000 ---
5 1.3 Design Specifications $1,440 100.00 --- $0 --- --- --- 1.000 ---
6 2 Preliminary Design $16,624 100.00 $15,675 $0 $949 $15,675 $949 1.000 1.061
7 2.1 Canopy Bed $1,344 100.00 --- $0 --- --- --- 1.000 ---
8 2.2 Corner Desk $1,920 100.00 --- $0 --- --- --- 1.000 ---
9 2.3 High-Boy $2,640 100.00 --- $0 --- --- --- 1.000 ---
10 2.4 Amoire $6,240 100.00 --- $0 --- --- --- 1.000 ---
11 2.5 Presentation Portfolio $480 100.00 --- $0 --- --- --- 1.000 ---
12 2.6 Meeting with Client $2,560 100.00 --- $0 --- --- --- 1.000 ---
13 2.7 Detail Design Specs $1,440 100.00 --- $0 --- --- --- 1.000 ---
14 3 Final Design $11,680 100.00 $11,600 $0 $80 $11,600 $80 1.000 1.007
15 3.1 Canopy Bed $1,440 100.00 --- $0 --- --- --- 1.000 ---
16 3.2 Corner Desk $1,440 100.00 --- $0 --- --- --- 1.000 ---
17 3.3 High-Boy $1,440 100.00 --- $0 --- --- --- 1.000 ---
18 3.4 Amoire $1,440 100.00 --- $0 --- --- --- 1.000 ---
19 3.5 Presentation Portfolio $1,920 100.00 --- $0 --- --- --- 1.000 ---
20 3.6 Meeting with Client $2,560 100.00 --- $0 --- --- --- 1.000 ---
21 3.7 Build Specs $1,440 100.00 --- $0 --- --- --- 1.000 ---
22 4 Fabrication Phase $53,905 52.55 $29,600 ($86) ($1,274) $56,329 ($2,424) 0.997 0.957
23 4.1 Produre Material $5,355 100.00 --- $0 --- --- --- 1.000 ---
24 4.2 Canopy Bed $6,000 80.00 --- ($900) --- --- --- 0.842 ---
25 4.3 Corner Desk $6,000 80.00 --- ($900) --- --- --- 0.842 ---
26 4.4 High-Boy $19,980 36.89 --- $1,415 --- --- --- 1.237 ---
27 4.5 Amoire $6,000 100.00 --- $300 --- --- --- 1.053 ---
28 4.6 Deliver and Install Bedroom Set $10,570 0.00 --- $0 --- --- --- No Planned Cost ---
Before ‘Previewing’, four columns were set to zero, thus providing larger text.

Cost/Schedule Status Report
Contractor: Best Furniture
Cost/Schedule Status Report Signature, Title & Date
Alex
Contract Type:
Type No:CP2004-149
Program Name/NumberBedroom Set for Dennis and EmilyGOV47-2004-34985
Report Date:30/Aug/2002
Contract Data
Original ContractTarget Cost
Negotiated ContractChanges
Current TargetCost
Est. Cost of AuthorizedUnpriced Work
Contract BudgetBase
$100,000 $0 $100,000 $0 $100,000
Performance Data
Work Breakdown Structure
Cumulative To Date At Completion
Budgeted Cost Work Actual *CostWork
Performed
VarianceBudgeted
LatestRevisedEstimate
VarianceScheduled Performed Schedule Cost
Bedroom Set for Dennis and Emily $62,156 $62,070 $62,270 ($86) ($200) $87,649 $88,999 ($1,350)
Concept Development $5,440 $5,440 $5,395 $0 $45 $5,440 $5,395 $45
Preliminary Design $16,624 $16,624 $15,675 $0 $949 $16,624 $15,675 $949
Final Design $11,680 $11,680 $11,600 $0 $80 $11,680 $11,600 $80
Fabrication Phase $28,412 $28,326 $29,600 ($86) ($1,274) $53,905 $56,329 ($2,424)
Fee $7,104 $7,104 $7,104 $10,000 $10,000
Undistributed Budget $0 ($2,970) ($2,970)
Management Reserve $0 $5,321 $5,321
Total with Fee $69,260 $69,174 $69,374 ($86) ($200) $100,000 $98,999 $1,001Baseline Date: 30/Aug/2002 * Includes open purchase commitment of $0 ** CPI Calculated Estimate At Completion

Cost Performance Report
Contractor: Best Furniture
Cost Performance ReportSignature, Title & Date
AlexContract Type:
Type No:CP2004-149
Program Name/NumberBedroom Set for Dennis and EmilyGOV47-2004-34985
Report Date:From 31/Jul/2002 To 30/Aug/2002
Contract Data
Original ContractTarget Cost
Negotiated ContractChanges
Current TargetCost
Est. Cost of AuthorizedUnpriced Work
Contract BudgetBase
$100,000 $0 $100,000 $0 $100,000
Performance Data
Work Breakdown Structure
Current Period Cumulative To Date At Completion
Budgeted Cost Work Actual *Cost WorkPerformed
Variance Budgeted Cost WorkActual *
Cost Work Variance
BudgetedLatest
RevisedEstimate**
Variance
Scheduled Performed Schedule Cost Scheduled Performed Schedule Cost
Bedroom Set for Dennis and Emily $23,093 $21,771 $24,100 ($1,322) ($2,329) $62,156 $62,070 $62,270 ($86) ($200) $87,649 $88,999 ($1,350)
Concept Development $0 $0 $0 $0 $0 $5,440 $5,440 $5,395 $0 $45 $5,440 $5,395 $45
Preliminary Design $0 $0 $0 $0 $0 $16,624 $16,624 $15,675 $0 $949 $16,624 $15,675 $949
Final Design $0 $0 $0 $0 $0 $11,680 $11,680 $11,600 $0 $80 $11,680 $11,600 $80
Fabrication Phase $23,093 $21,771 $24,100 ($1,322) ($2,329) $28,412 $28,326 $29,600 ($86) ($1,274) $53,905 $56,329 ($2,424)
Fee $2,749 $2,749 $2,749 $0 $0 $7,104 $7,104 $7,104 $10,000 $10,000
Undistributed Budget $0 $0 $0 $0 $0 $0 ($2,970) ($2,970)
Management Reserve $0 $0 $0 $0 $0 $0 $5,321 $5,321
Total with Fee $25,842 $24,520 $26,849 ($1,322) ($2,329) $69,260 $69,174 $69,374 ($86) ($200) $100,000 $98,999 $1,001
Baseline Date: 30/Aug/2002 * Includes open purchase commitment of $0 ** CPI Calculated Estimate At Completion

Graphic Performance ReportGraphic Performance Report
Date: 30-Aug-2002Title: Bedroom Set for Dennis and EmilyManager: Alex
1.3
1.2
1.1
1.0
0.9
0.8
0.7
Jan Feb Mar Apr May Jun Jul Aug Sep Oct Nov
2002
Dec$110
$100
$90
$80
$70
$60
$50
$40
$30
$20
$10
$0
<SPI> Schedule<CPI> Cost
Budgeted CostEarned CostActual Cost
Ex
pe
nd
itu
res
/Pe
rfo
rma
nc
eP
erf
orm
an
ce
In ‘Preview Options’, the ‘Hide Cause, etc. was
selected.
Page Setup should be landscape
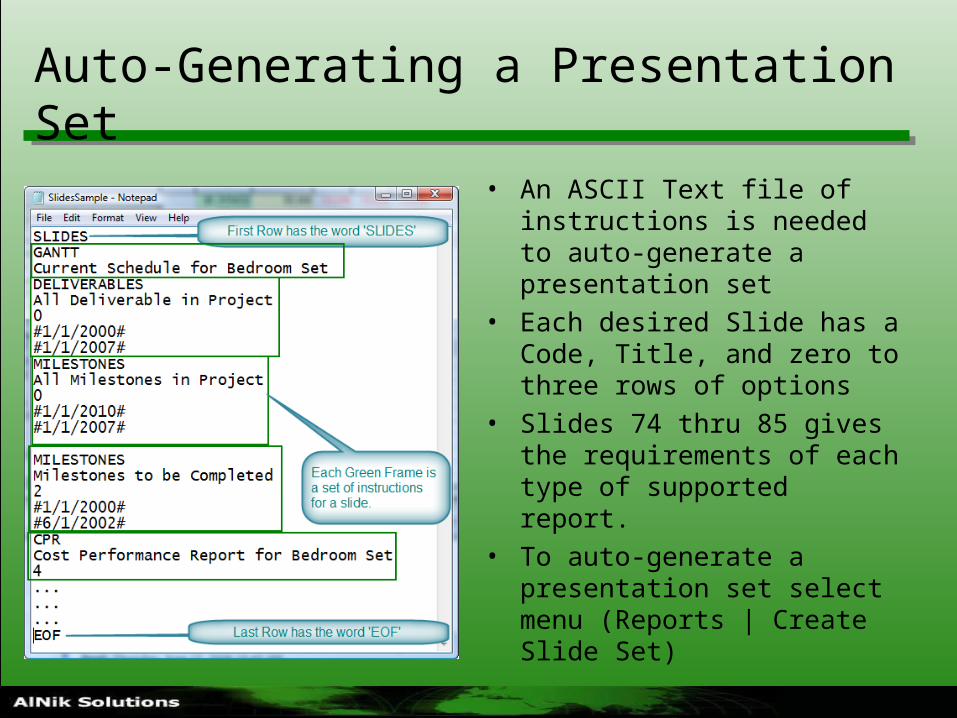
Auto-Generating a Presentation Set
• An ASCII Text file of instructions is needed to auto-generate a presentation set
• Each desired Slide has a Code, Title, and zero to three rows of options
• Slides 74 thru 85 gives the requirements of each type of supported report.
• To auto-generate a presentation set select menu (Reports | Create Slide Set)
Work Breakdown Structure
• First Line is Code: WBSTREE
• Next Line is Title
• Next Line defines how many levels to show the WBS horizontally (valid values are 2, 3, or 4)

Schedule
• First Line is Code: GANTT
• Next Line is Title
• No options at current time
• Prior to running the script, set report to Landscape and desired details.

Deliverables
• First Line is Code: DELIVERABLES• Next Line is Title• Next line is Filter Code:
– 0 show all– 1 show completed– 2 show not completed– 3 show approved– 4 show not approved
• Next line is Start Date which must use # before and after date• Next line is End Date which must use # before and after date• To determine which deliverables to show, first the filter is applied, then
any deliverables that have dates outside of the start to end date are hidden.

Milestones
• First Line is Code: MILESTONES• Next Line is Title• Next line is Filter Code:
– 0 show all– 1 show completed– 2 show not completed– 3 show approved– 4 show not approved
• Next line is Start Date which must use # before and after date• Next line is End Date which must use # before and after date• To determine which milestones to show, first the filter is applied, then
any milestones that have dates outside of the start to end date are hidden.

Cost Performance Report
• First Line is Code: CPR• Next Line is Title• Next line is Level to show data:
– 0 down to all cost control accounts– 1 Project Level only– 2 down to Level 2– 3 down to Level 3– 4 down to Level 4
• If a control account is at a higher level than requested, the information will stop at that level in that branch of the WBS.

Cost/Schedule Status Report
• First Line is Code: CSSR• Next Line is Title• Next line is Level to show data:
– 0 down to all cost control accounts– 1 Project Level only– 2 down to Level 2– 3 down to Level 3– 4 down to Level 4
• If a control account is at a higher level than requested level, the information will stop at that level in that branch of the WBS.

Graphic Performance Report
• First Line is Code: GPR• Next Line is Title• Next line is Element ID of WBS Element:
– E0 is always for project level– To see Element ID of a WBS add the
ElementID column to the WBS Table Tab.– Only Element IDs of WBS elements that are
cost control account or higher.
• Next line is 1 to hide the text boxes at the bottom of the graphic, or 0 to display.

Bullseye Report
• First Line is Code: BULLSEYE• Next Line is Title• Next line is Element ID of WBS Element:
– E0 is always for project level– To see Element ID of a WBS add the
ElementID column to the WBS Table Tab.– Only Element IDs of WBS elements that are
cost control account or higher.

Resource Totals
• First Line is Code: RESTOTALS• Next Line is Title• Next line is Phases to Use (add the value of each phase
(for example 5 would show Planned and Actual):– 1 Baseline– 2 Planned– 3 Actual
• Next line is code for what parts of WBS to show using the following values:– 0 show all, 1 to outline shown in WBS Tree Tab– 2 down to Control Accounts,– 3 through 8 for down to level which is the value minus 1

Summary Earned Value Report
• First line in Code: SUMMARYEV
• Next Line is Title
• This report transposes the top row of the project status report, into a vertical listing.

Budgets
• First Line is Code: BUDGETS• Next Line is Title• Next line is Phases to Use (add the value of each phase (for example 5 would
show Planned and Actual):– 1 Baseline– 2 Planned– 3 Actual
• Next line is type of period to show:– 0 Monthly– 1 Weekly– 2 Daily– 3 Quarterly– 4 Annually
• Next line is code for what parts of WBS to show using the following values:– 0 show all, 1 to outline shown in WBS Tree Tab– 2 down to Control Accounts,– 3 through 8 for down to level which is the value minus 1

Project Resource Usage
• First Line is Code: USAGE• Next Line is Title• Next line is Phases to Use (add the value of each phase
(for example 5 would show Planned and Actual):– 1 Baseline– 2 Planned– 3 Actual
• Next line is type of period to show:– 0 Monthly– 1 Weekly– 2 Daily– 3 Quarterly– 4 Annually

Project Status (same as Status Tab)
• First Line is Code: STATUS• Next Line is Title• Next line indicates which columns to hide (add the
value of each column {for example 85 would hide Control Account, Planned Value, Earned Value, and Open Commitment or 2047 would only show SPI and CPI}):– 1 Control Account, 2 Total Budget, 4 Planned Value,– 8 Percent Complete, 16 Earned Value, 32 Actual Value,– 64 Open, 128 SV, 256 CV, 512 EAC, 1024 VAC– 2048 SPI, and 4096 CPI

Creating Custom Reports

Creating Custom Reports
• The user can create custom reports using any fields in the Task/Activity Collection.
• For further information refer to pages 154 to 161 in the manual located in the folder with the PMPlan Application – Folder (C:\Program Files\AlNik\PMPlan). – The filename is “PMPlan Manual.pdf”
• The application folder also has a few reports that can be loaded.

To Create Custom Reports
• To create custom reports, select the following menu options
• Project | Print Reports | Custom Reports
• After this menu selection, the following form will be displayed. If it is the first time that it has been used on a project, the reports table will be empty.
• To create a new report, click the ‘New’ button, which will display an input box for the user to enter a unique title for the report. If the user desires to save this report template, this title will be used for the filename with an ‘.ant’ extension. This title is also the default header used for the report. When the user creates a new report, PMPlan initially creates two columns, for the WBS Number and Description.
Custom Reports - Adding Columns
• The new column will be inserted to the left (Note: If the last column, will have choice to insert it to the right).
• Select the field from the ‘Field’ list box.• Click the ‘Insert’ button.• When a new column is inserted, the default settings are entered for it.
(The white cells can be modified).• Each Column, displays 10 cells, which are the following:
– Field – This is the name of a field that is used by the task in PMPlan. It cannot be changed by the user.
– Title – This is the title that will appear at the top of the column.– Align – This setting determines the alignment of the column– Format – This is for specifying the format of the data, especially
numbers and dates (Refer to the ‘Formatting Data’ section for guidance on formatting).

Custom Reports - Adding Columns (continued)
– Width – This is the width of column where each count is the average width of a letter. If ‘Auto-width Columns’ is selected, the PMPlan will resize each column to display all of the text.
– Sort – This cell is used to determine the sort order of this column. The sorts the data based on left to right settings (See ‘Sorting Dates’ section for special rules for sorting date fields)
– Criteria – This cell is used to determine which rows to display (See ‘Using Criteria’ section for how to setup criteria.
– Show – When checked this column will be displayed. A typical reason to uncheck this cell is when you want to use a field for criteria, but don’t want to display it.
– Formula – This cell is only available for the following custom fields; Byte, Number, Cost, Date, and Text (Refer to the ‘Writing Formulas’ section for creating formulas).
– Rollup – This cell is only available when the ‘Formula’ cell is being used. If checked, the math of the lower WBS element is summarized in the parent WBS element.

Custom Reports - Filtering Rows
• Which rows are displayed in the tabular report is determined in a two step process. The first process is to apply the WBS filter (for example: if ‘Activities Only’ is selected, all of the parent elements are hidden). The second process is to use the criteria from left to right is the Columns settings. If the criterion is false, the row is hidden. Each criterion is applied to currently unhidden rows, thus all of the criteria must be true to display a row.
• To view a tabular report, click the ‘Show’ button.

Custom Reports - Formatting Data
• Formating Data• To format dates, you can use the following combinations.• For Year• yy displays last two digits of the year• yyyy displays all four digits of the year• For Month• m displays one or two digits of month (i.e. 7 , 11)• mm displays month with two digits (i.e. 07 , 11)• mmm displays three letter abbreviation of month (i.e. Jul, Nov)• mmmm displays full name of moth (i.e. July, November)

Custom Reports - Formatting Data (continued)
• For Day• d displays one or two digits of day of month (i.e. 8, 28)• dd displays day with two digits (i.e. 08, 28)• Separators• Space - / , .• Examples of date formats• mmmm d, yyyy July 4, 2003• dd-mmm-yyyy 04-Jul-2003• dd.mm.yy 04.07.03• m/yy 7/03

Custom Reports - Sorting Dates
• The sorting is done against the text in each cell, thus the only way to get date to sort correctly the user needs to use the following format ‘yyyy-mm-dd’.
• If the user wants to display the date in a different format, – Insert two columns of the same date field– Set the format of the sorting column to ‘yyyy-mm-dd’, select sorting
order, and uncheck ‘Show’ cell.– Set the format of the display date column as desired using the
rules in ‘Formatting Data’.

Custom Reports – Using Criteria
• The criterion entered is applied to the value in each table cell of a column. The following criteria rules can be used:
• Blank or = with text for equal criterion (1 or = 1)• Indicate text with single or double quotes at each end (“abc” or ‘abc’)• Indicate date with ‘#’ (#15-Jun-2003#)• Condition ‘=’ for equal• Condition ‘=>’ for equal or greater than• Condition ‘<=’ for less than or equal• Condition ‘>’ for greater than• Condition ‘<’ for less than• Condition ‘<>’ for not equal to

Custom Reports – Using Criteria (continued)
• Condition ‘Like’ is used for a text wildcard– Like “abc*”, any text that starts with ‘abc’ is a match– Like “*abc”, any text that ends with ‘abc’ is a match– Like “*abc*”, any text that contains ‘abc’ is a match
• Use ‘OR’ for more than one type of match (= “ab” OR = “cbe”)• Use ‘AND’ for a range (=> #01-Mar-2003# AND <= #31-Mar-2003#)

Custom Reports – Writing Formulas
• General Note: To use a field in an equation use the field name listed in the ‘Field’ list box surrounded with square brackets (i.e. [Budgeted]). The field name is case sensitive.
• Number Equations– To create number equations, the user can use fields (Cost and
Number types) with numbers using the standard math operators +-*/. For example let’s assume the user wants to get the average labor rate for each work package. For this, the following is done;
• Insert a custom ‘Cost’ column• Change Title to ‘Average Labor Rate’• In the formula cell, enter [Budgeted]/[TotalPlannedLabor]• Set the WBS Filter to ‘Work Packages Only’
• Text Equations– To create text equations (catenations), insert a ‘Text’ column and
catenate text fields with other text using the following modifiers (For results, [field name] value assumed to be ‘abcdefgh’, n = 3, and m=4).
– “any text” between double quotes• Result = any text

Custom Reports – Writing Formulas (continued)
– [field name]• Result = abcdefgh
– Left([field name], n) where n = number of starting characters to use• Result = abc
– Right([field name], n) where n = number of ending characters to use• Result = fgh
– Mid([field name], n) where n = the starting character to use• Result = cdefgh
– Mid([field name], n, m) where m=number of characters to use• Result = cdef
– To catenate more than one modifier use the ‘&’ character • (i.e. [Leader] & “, <” & Left([Group],3) & “>”
• Date Equations– The user can currently add or subtract calendar days from a date
(for example: [PlannedStart]-14)

Sample Custom Reports
• Substitute Report– Replace classified/sensitive titles with new titles for
external distribution– Filter for Control Accounts only– Add column to show balance remaining
• Near Future Activities– Select activities between two dates– Filter by responsible group– Sorted by date

Custom Reports – Substitute Sample

Custom Report - Near Future Activities

Controlling Graphical Formats

Graphic Format - WBS
• Use the Tool bar to control Font Attributes• Use the Options | WBS to control rest of graphic attributes of WBS
• The WBS Number and Title use the assigned font size. All other text use regular font two sizes smaller.
• To see the affect of changes without closing the Options Dialog, click the ‘Apply’ button
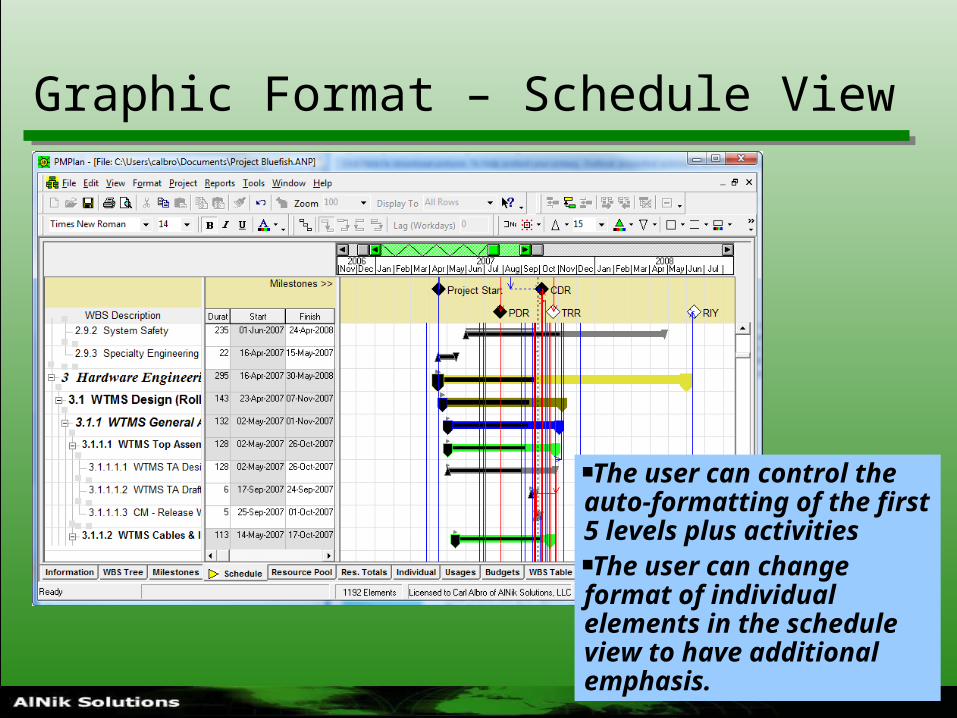
Graphic Format – Schedule View
The user can control the auto-formatting of the first 5 levels plus activitiesThe user can change format of individual elements in the schedule view to have additional emphasis.

Graphic Format – Schedule View
Toolbar selections effect level bounded by dashed box.
The checked items will be displayed in Schedule
Check this box to have new settings apply to all new projects.
Click this button to reset to application settings

Changing Default Formats for New Projects
• Select menu option ‘Tools | Options | Schedule’
• Modify the formats• Check ‘Apply to
Application’• Select Apply button

Scaling Work Effort

“Multi-User” Project Plan Development
• Start a new project• Develop at least the level 2 tasks and enter Leader name for
each task• Develop the list of Resources• Create a set of files using the Earned Value Files feature
(Menu Project | Status | Create Earned Value Files)• Each Task Leader develops their branch of the WBS • Using the original Project file; merge each of the files into the
original file using the ‘Merge Replication’. The Merge is keyed to the leader, thus their file can only affect WBS elements that they are in charge of. This process will add the new elements with all loading, schedule, and notes (BOE, Objectives, and Notes) into the original file. If an element exists in the original, any changes in the copy will be transferred into the original file. This includes deleting, adding, and modifying.

“Multi-Users” EVM Input
• Open project to status• Set new status date• Enter or Load ‘Cumulative Actual Costs’• Create a set of files using the Earned Value Files feature
(Menu Project | Status | Create Earned Value Files)• Each Task Leader enters Percent Complete, Actual Start,
and Actual Finish for their activities.• Using the original Project file; merge each of the files into
the original file using the ‘Project | Status | Import Earned Value File’. The Merge is keyed to the leader, thus their file can only affect the percent complete and actual dates of their WBS elements.

Transferring to MS Word and MS Excel• Microsoft Excel
– Method #1• Select any cell in the desired table• Click menu ‘Edit | Copy Table’• In Excel, use ‘Control + V’ or otherwise ‘Paste’ the Table into Excel
– Method #2• If the report “Preview Options” dialog is displayed
– Set the Options, Check the box , then select “Next”– After the preview is displayed, the report can be pasted into Excel
• Microsoft Word– Method #1
• If the preview displays an “Export” button • Click the Export button• In the dialog, create a filename, which will have the extension .rtf• Open the new .rtf file into Word
– Method #2• If preview displays a “Copy” button • Click the Copy button, then Paste it into Word

Repeating Tasks
The ability to put groups of activities on the same row provides a compact schedule for display.
For creating repeating tasks use the following approach:
• Create the initial set of tasks setting schedule, linkages, and resource loading.
• Select ‘Project | Outline | Repeating Tasks’ menu choices
• In Dialog box, select repeat period and number of repeats (which includes the selected set).
Each Set must not overlap the next set

Scheduling Tips
Changing Project Start Date Rescheduling
• PMPlan can force the linked activities to reschedule based on current actual dates (Go to ‘Project | Gantt | Reschedule’).
Change the Project Start Date here:Must be changed prior to setting the Project Baseline, or performing Project Status.User will be given the option to move all of the schedule or to move only the start with all early starts set to the new start.

MPM Interface
• In MPM setup the basic project information including the resource pool which needs to have the same resources as in the PMPlan resource pool. You will be getting the WBS, schedule, and estimates from PMPlan.
• Set the PMPlan Resource IDs = MPM Resource Codes/IDs
• Setup all of the Cost Control Accounts within PMPlan
• Export the MPM files by selecting ‘File | MPM Exports | Initiation Set of Files’. This will create the
– WBS Description file down to the Cost Control Accounts,– WBS Schedule file down to the Cost Control Accounts,– Estimate file for labor in hours and ODCs in prime dollars at each of the Cost
Control Accounts,
– If you answer yes for milestone EV method, a Milestone file is created converting all activities below each Cost Control Accounts to Milestones with finish dates and having weight value related to their value versus the Cost Control Account budget.
• Each month you would export the Milestone or BCWP file for EV.

ProPricer Interface - Setup
• Open the Project File• Go to the ‘Resource Pool’• For each resource enter the ProPricer Code into the ID column (it is ok for more than
one resource have the same code. The application will combine for export). This should be provided by the ProPricer Staff.
• Go to the ‘WBS Table’ Tab• Insert three custom columns using the Right-Click in column header method
– ‘Byte0’ ‘ProPricer Flag’
– ‘Text1’ ‘ProPricer Location’
– ‘Text2’ ‘ProPricer LOB’
• In the flag column, enter value of 2 for the elements that are going to be sent to ProPricer as Tasks (suggest Cost Account Level).
• In the flag column, enter value 1 in the elements above the Tasks marked with 2.• In ‘Location’ column, enter value per instructions from ProPricer Staff.• In ‘LOB’ column, enter value per instructions from ProPricer Staff.• If you want to send BOE text to ProPricer be sure to fill out the BOE text for each Task
marked with a 2.

ProPricer – Transfer Files
• Select menu ‘File | Generate ProPricer Files’
• When done you will get a message box.
• PMPlan generates 4 files in the project file folder.
• The names of these files all start with Project filename plus– ProPricerWBS.csv which is the upper level WBS
– ProPricerTasks.csv which has all of the Tasks to be used for pricing
– ProPricerResources.csv which provides the resource loading including material
– ProPricerBOEs.csv which provides the BOE text by Tasks

Creating Job Category Pools
Click here to display Job Categories
Effective Date must be on or before the Project Start Date
Selecting “Extra Rates” allows the creation of scheduled salary actions
If Job Categories have been selected, make the appropriate category selection in the ‘Type’ listing