using relevance to inspire engagement in disengaged
TRANSCRIPT
BearWorks BearWorks
MSU Graduate Theses
Spring 2016
Using Relevance To Inspire Engagement In Disengaged Using Relevance To Inspire Engagement In Disengaged
Secondary Mathematics Students Secondary Mathematics Students
Cherie Lynn Burkett
As with any intellectual project, the content and views expressed in this thesis may be
considered objectionable by some readers. However, this student-scholar’s work has been
judged to have academic value by the student’s thesis committee members trained in the
discipline. The content and views expressed in this thesis are those of the student-scholar and
are not endorsed by Missouri State University, its Graduate College, or its employees.
Follow this and additional works at: https://bearworks.missouristate.edu/theses
Part of the Science and Mathematics Education Commons
Recommended Citation Recommended Citation Burkett, Cherie Lynn, "Using Relevance To Inspire Engagement In Disengaged Secondary Mathematics Students" (2016). MSU Graduate Theses. 1912. https://bearworks.missouristate.edu/theses/1912
This article or document was made available through BearWorks, the institutional repository of Missouri State University. The work contained in it may be protected by copyright and require permission of the copyright holder for reuse or redistribution. For more information, please contact [email protected].

USING RELEVANCE TO INSPIRE ENGAGEMENT IN DISENGAGED
SECONDARY MATHEMATICS STUDENTS
A Masters Thesis
Presented to
The Graduate College of
Missouri State University
TEMPLATE
In Partial Fulfillment
Of the Requirements for the Degree
Master of Science in Education, Secondary Education
By
Cherie Burkett
May 2016

ii
USING RELEVANCE TO INSPIRE ENGAGEMENT IN DISENGAGED
SECONDARY MATHEMATICS STUDENTS
Mathematics
Missouri State University, May 2016
Master of Science in Education
Cherie Burkett
ABSTRACT
With the advances being made in technology, our nation is in dire need of a work force
degreed with mathematics and science. In the past few decades, the United States has
seen a decline in the proportion of college graduates who majored in mathematics-
intensive subjects. If our demand is high, why is our supply decreasing? Research
suggests that traditional teaching methods using skills-based curricula make it difficult
for students to take an interest in a confusing topic like mathematics in which they see no
immediate relevance. I have spent a semester engaged in action research taking steps to
increase student engagement in the mathematics classroom by helping them find the
relevance to their daily lives. Activities were selected with special attention on including
real world problems that address common interests of the students. Analysis of
qualitative and quantitative data indicate that that students do prefer activities relevant to
their everyday lives to traditional skills-based practice. Through the use of these
activities, the students gained academic knowledge and improved their attitudes toward
learning and using mathematics.
KEYWORDS: learning, mathematics education, teaching, action research, real-world
problems, student attitudes, relevance, engagement.
This abstract is approved as to form and content
_______________________________
Dr. Adam Harbaugh
Chairperson, Advisory Committee
Missouri State University
iii
USING RELEVANCE TO INSPIRE ENGAGEMENT IN DISENGAGED
SECONDARY MATHEMATICS STUDENTS
By
Cherie Burkett
A Masters Thesis
Submitted to the Graduate College
Of Missouri State University
In Partial Fulfillment of the Requirements
For the Degree of Master of Science in Education, Secondary Education
May 2016
Approved:
_______________________________________
Dr. Adam Harbaugh
_______________________________________
Dr. David Goodwin
_______________________________________
Dr. Gay Ragan
_______________________________________
Dr. Julie Masterson: Dean, Graduate College

iv
TABLE OF CONTENTS
Chapter I: Overview of the Study ........................................................................................1
Rationale for the Study ............................................................................................1
Purpose of the Study ................................................................................................3
Research Questions ..................................................................................................4
Research Design.......................................................................................................4
Significance of the Study .........................................................................................5
Assumptions .............................................................................................................6
Limitations ...............................................................................................................7
Definitions of Terms ................................................................................................7
Chapter II: Review of Related Literature.............................................................................8
Acknowledging a Problem .......................................................................................9
Finding the Cause ..................................................................................................10
Potential Adjustments ............................................................................................13
Summary ................................................................................................................15
Chapter III: Methodology ..................................................................................................17
Research Design.....................................................................................................17
Site of the Study .....................................................................................................18
Participants .............................................................................................................19
Ethical Considerations ...........................................................................................19
Data Collection Procedures ....................................................................................20
Instrumentation ......................................................................................................21
Role of the Researcher ...........................................................................................22
Data Analysis .........................................................................................................23
Summary ................................................................................................................25
Chapter IV: Results ...........................................................................................................26
Question 1 ..............................................................................................................26
Question 2 ..............................................................................................................37
Question 3 ..............................................................................................................40
Summary ................................................................................................................42
Chapter V: Conclusions .....................................................................................................43
Outcomes ...............................................................................................................43
Implications............................................................................................................46
References ..........................................................................................................................49
Appendices ........................................................................................................................52
Appendix A. Informed Consent Letter ..................................................................52
Appendix B. Post-Unit Questionnaire ...................................................................53

v
Appendix C. Pre-Activity Assessment Percentages ..............................................54
Appendix D. Post-Activity Assessment Percentages .............................................55
Appendix E. Pre-Activity Assessment Graphing Linear Equations ......................56
Appendix F. Post-Activity Assessment Graphing Linear Equations .....................57
Appendix G. Pre-Activity Assessment Combinations and Permutations ..............58
Appendix H. Post-Activity Assessment Combinations and Permutations ............59
Appendix I. Aiken’s Enjoyment of Mathematics Scale.........................................60
Appendix J. Pre-Unit Questionnaire ......................................................................61
Appendix K. Dueling Discounts Activity ..............................................................62
Appendix L. Birthday Shopping Activity ..............................................................64
Appendix M. Algebra vs. Cockroach Activity ......................................................66
Appendix N. Is Wendy’s Right Activity................................................................67
Appendix O. Shopping Activities Survey ..............................................................69
Appendix P. Algebra vs. Cockroack Game Survey ...............................................70
Appendix Q. Wendy’s Activity Survey .................................................................71
Appendix R. Aiken’s Enjoyment Scale Pre-Intervention Results .........................72
Appendix S. Aiken’s Enjoyment Scale Post-Intervention Results ........................73
vi
LIST OF TABLES
Table 1. Pre-Unit Questionnaire Question 3 ......................................................................27
Table 2. Post-Unit Questionnaire Question 3 ....................................................................27
Table 3. Students’ Perceptions of the Relevance to Their Everyday Lives. ......................28
Table 4. Students’ Inclination to Engage in an Interactive Game .....................................29
Table 5. Pre-and Post-Unit Questionnaire Question 4 .......................................................31
Table 6. Students’ Preference for Worksheet vs. Activity ................................................32
Table 7. Students’ Attitudes toward Participating in these Activities ..............................33
Table 8. Post-Activity Questionnaire Question 5 .............................................................38
vii
LIST OF FIGURES
Figure 1. Pre-and Post-Activity Assessment on Percentages Unit ....................................38
Figure 2. Pre-and Post-Activity Assessment on Graphing Linear Equations Unit ............39
Figure 3. Pre-and Post-Activity Assessment on Combinations and Permutations Unit ....40

1
CHAPTER I: OVERVIEW OF THE STUDY
By both global and national standards, American students are testing poorly in
mathematics. Although the demands of mathematics and science degrees are on the rise
due to technological advances, the proportion of new college graduates who major in
mathematics-intensive subjects has declined by nearly half over the past 60 years
(Vigdor, 2013). This decline is not only affecting our nation’s economy, but our college
campuses as well. For example, at the beginning of 2012, the academic committee of
Texas Wesleyan University decided to no longer offer a major in mathematics due to low
participation and difficulty level (Resendez, 2012). The United States is losing its edge
in innovation as the mathematics skills of our students atrophy (Vigdor, 2013). As a
concerned nation, we must ask why has the United States lost ground, and what course
must we follow to gain it back? Finding ways to make mathematics relevant for students
who are typically disengaged could have a profound effect on their futures by providing
them with the skills and positive attitudes that will help them get jobs in technology-
infused fields.
Rationale for the Study
Students are often unaware of how many occupational doors they close when they
choose a path of study that does not include enough mathematics and science. If students
are not fully aware of the benefits of pursuing science, technology, engineering, and
mathematics (STEM) courses throughout high school, taking these courses can seem like
a waste of time and effort. Yet many university and college programs require

2
mathematics and science course work as prerequisites for admission, even those in fields
like culinary arts, technical theatre, or fitness – areas which at first glance are fields
unrelated to STEM. Students should be informed of the importance of mathematics
courses for their future careers. “Evidence indicates that there is a disconnection between
the educational choices some students make at the secondary level and their post-
secondary or career goals” (Hurd, 2013, p. 3).
American students report being bored by mathematics, science, and engineering
(Whitney, Leonard, Leonard, Camelio, & Camelio, 2005). Smartphones, tablets and a
number of other technology driven devises are used on a daily basis by students but they
are not pursuing the skills necessary to build them (The Editorial Board, 2013).
Educators need to catch and hold students’ interest in mathematics in order to tap the full
potential of talents in this much needed area and to entice them to pursue related careers.
Expertise in mathematics is necessary for important advances in our society in
engineering and information technologies (Watt, Richardson, & Pietsch, 2009). Our
students exist in a world where technology provides them with instantaneous information
and results and we, as educators, need to use teaching methods that both accept and
reflect this new reality. New efforts will be required to gain and hold this instantly
gratified generations’ attention and engage them in tasks they find stimulating and
meaningful.
Nicol (2002) reports one of the biggest reasons for that lack of interest is that
students have been turned off to STEM subjects as they move from kindergarten to high
school. In Nicol’s (2002) study, technology is attributed for “hiding” the mathematics,
claiming that because the mathematics takes place behind the scenes teachers and

3
students are not as aware of how it is being used in their everyday lives. Students are
taught using outdated curricula and traditional teaching methods, and, in ill-conceived
attempts to force relevance, teachers use ineffective, contrived word problems. I have
witnessed a student’s frustration when after one such encounter with a contrived word
problem, a former student of mine commented, “I work at Subway and we don’t have
third degree polynomials there.” The current system for teaching mathematics is not
providing enough experiences that allow students to benefit from solving problems they
find meaningful rather than traditional drills (The Editorial Board, 2013).
Purpose of the Study
The purpose of this research was to investigate how to improve student
engagement in mathematics through choosing activities that my students, typically
passive participants and reluctant learners, would find relevant and entertaining. “The
key here is for the teacher to find different and meaningful applications of the
mathematics to maintain interest and attention” (Sousa, 2008, p. 138). My goal was to
introduce activities that created a need for and an interest in the mathematics lesson, and
then provided the lesson so that the activity could be completed. Taking mathematics out
of textbooks and illuminating its use in their lives and future careers should entice
students who are insecure in their own abilities into pursuing more mathematics intensive
coursework, which can lead to more career choices. Although all students need a strong
grasp of the fundamentals of critical thinking and problem solving, including algebra and
geometry, they should be experiencing applications of mathematics that are relevant to

4
their everyday lives. These experiences will likely bring about an increase in student
engagement.
Research Questions
With the aim of increasing student engagement in mathematics through making
the mathematics relevant and entertaining, the following research questions were
investigated:
1. What outcomes do classroom activities that students perceive as applicable to
daily living have on their attitudes toward learning and using mathematics?
2. What impact does the use of relevant, real-world inspired activities have on
secondary mathematics students’ academic achievement?
3. What impact does the use of relevant, real-world inspired activities have on
secondary mathematics students’ level of engagement in classroom
activities?
Research Design
As a high school mathematics teacher, I conducted an action research study
within my Professional Mathematics course. This course is designed for juniors who
need a third mathematics credit to reach graduation requirements, who are not interested
or were not recommend by previous mathematics teachers to take Algebra II, and for
seniors who do not want to take Calculus or Trigonometry, but do want a fourth
mathematics credit. The prerequisites for Professional Mathematics is a credit in Algebra
1 and a credit in either Geometry or Geometry Concepts with no minimum grade
requirement. Students enrolled in Professional Mathematics most likely did not meet the
minimum grade requirement in Algebra I and/or Geometry in order to take Algebra 2.
Students taking Professional Mathematics are not expected to have especially strong

5
mathematics skills, nor are most of them expected to be college bound; most calculations
required of the students in this course will be elementary although advanced
mathematical concepts and are taught as needed. During the course of the semester,
activities were carefully selected by me and the two other Professional Mathematics
teachers. We selected the activities based on the belief that the students would find them
relevant to everyday living.
The attitude and ability levels of students’ were measured before and after each of
three units of instruction. I used an action research design that combined both
quantitative and qualitative methods. Pre- and post-statistical analysis measuring
frequencies, mean, median and mode was conducted to determine the interest levels and
ability of my students before and after each unit of instruction. The interest levels were
measured using Likert scales and pre- and post-assessment exams were used to measure
ability levels. I maintained observational logs to record student behaviors (level of
engagement), reactions to the activities, and the students understanding. The students
were asked to answer open-ended questions at the end of each unit and activity. The use
of such open-ended questions had the particular advantage of being flexible and allowing
my students to describe how they feel in their own words which make it easier for the
teacher to get a personal assessment of what the students really believe.
Significance of the Study
This research confronts concerns that by both global and national standards,
American students are testing poorly in mathematics and therefore not pursuing STEM-
related careers that will fill the growing demands due to technological advances. The
6
proportion of new college graduates who major in mathematics-intensive subjects has
declined by nearly half over the past sixty years (Vigdor, 2013). The crux of these
problem lies with a defeatist attitude among students, which in turn leads to
disengagement (Whitney et al., 2005). I anticipated that this research would have
positive outcomes for both the students and the teachers, envisioning that the activities
and methods used would:
1. help teachers develop an advanced understanding of how students’
academically relevant interests can be stimulated, nurtured, and maintained
through methods which include group work, discussion, peer learning, and
real-world problem solving, and
2. help encourage students to become more actively engaged in mathematics by
helping them find the connection between what happens in the classroom with
what is happening in their daily lives, while improving student attitude,
understanding, and enjoyment in mathematics.
As an experienced mathematics teacher, I believe that finding ways to produce such
outcomes will contribute significantly to the continuous professional development of
teachers. The anticipated outcomes are very favorable for both teachers and students and
they afford teachers the opportunity to develop their knowledge of mathematics and to
improve lesson development for students through finding activities that rely on finding
meaningful answers to real-world questions.
Assumptions
The action research project involved the students in my Professional Mathematics
classroom and the following assumptions were made in preparation for this project:
1. I was able to choose activities that the students would perceive as relevant to
their daily lives.

7
2. The students would complete the activities with an open mind and positive
attitude toward trying something new and different.
3. The students answered survey questions honestly and felt comfortable
providing feedback.
Limitations
Aspects of this study that were considered limitations related to research are:
1. The ethnic makeup of this community does not generalize to other areas in the
state or country because of the unusually small percentage of minority
students in the sample.
2. The small sample size limited generalizations to all students.
3. The study was limited to the experiences and perceptions of the teacher
conducting the research and students participating in the study.
Definitions of Terms
For the purpose of this study, the following terms are defined:
1. Traditional teaching methods: Teachers are the source of knowledge and the
students are passive receivers. Teachers use lectures as a means of delivery
and use textbooks to assign work. Students learn primarily through listening
and observation (Sousa, 2008, p. 144).
2. Relevance: learning experiences that are either directly applicable to the
personal aspirations, interests, or cultural experiences of students (personal
relevance) or that are connected in some way to real-world issues, problems,
and contexts (life relevance) (The Glossary of Education Reform).
3. Engagement: the degree of attention, curiosity, interest, optimism, and
passion that students show when they are learning or being taught, which
extends to the level of motivation they have to learn and progress in their
education (The Glossary of Education Reform).

8
CHAPTER II: REVIEW OF RELATED LITERATURE
Over the past thirty years, our daily lives have been significantly changed by
technology. The escalation of the internet, the cell phone, and other technological
advances have changed many aspects of our lives including entertainment, banking,
shopping, job searching, and networking, just to name a few. It is safe to conclude that
these changes have affected the type of jobs that are available today. “A few decades
ago, employers were in search of typists, switchboard operators, mimeograph repair
technicians, keypunchers and elevator operators” (Herman, 1999, p. 1). The current job
market has employers are seeking webmasters, cyber threat analysts, IT system operators,
technical writers, and software developers. The question that we must now ask is, are we
as educators preparing our students to meet the needs of this new job market? According
to Vigdor (2013), “concern about our students’ math achievement is nothing new” (p. 1).
Tests and studies continue to show that America has fallen far from its place as a leader
in mathematics and science and not only are our students not doing comparatively well as
students in many other countries, but U.S. students are showing little future interest in the
field of mathematics and science (Langdon, McKittrick, Beede, Khan, Doms, &
Economics and Statistics Administration, 2011). Many factors are contributing to this
lack of interest including a “one-size-fits-all” curriculum as well as classrooms that have
bored students who do not know how to connect what they do in the classroom to what
they do outside the classroom (Nicol, 2002). To reverse the trend of the current crisis in
mathematics education, we, as educators, should inform ourselves on how to engage our
students and get them to want the mathematics. This knowledge will enable teachers to
9
create an environment where students can engage in learning they find meaningful and be
more active decision makers about their future educational and career-related choices
involving mathematics. I propose that from many meaningful experiences blooms a
higher self-efficacy for mathematical thinking and problem solving which will encourage
students to take more risk and reach for higher level mathematics courses.
Acknowledging a Problem
According to the Organization for Economic Cooperation and Development
(OECD) United States students “lag behind their global peers” (Vigdor, 2013, p. 1) and
as a result the U. S. is losing its competitive edge when it comes to mathematics,
technology, and science (Beard, 2013). “In the twenty-first century workplace,
mathematical capability is a key determinant of productivity” (Vigdor, 2013, p. 4).
Technological advances require a deep understanding of mathematics (Garii & Okumu,
2008). The Program for International Student Assessment (PISA), known as “the world’s
report card” (Peterson, Woessmann, Hanushek, & Lastra-Anadon, 2011, p. 52), is
administered by OECD to representative samples of 15 year-old students in 65 of the
world’s school systems. In 2011 the United States ranked 32nd in the percentage of
students proficient in mathematics among countries participating in PISA (Peterson et al.,
2011), which places the United States in the middle of the pack globally. Additionally,
the performance on the 2000 and 2009 (PISA) exams confirms not only a lack of
progress, but that the United States is one of several countries whose mathematics
performance worsened over the 9-year time period (Vigdor, 2013). The evidence of

10
stagnation among secondary school students seems at odds with our national focus on
improving mathematics education (Bertram & McDonald, 2013).
Setting aside a global comparison, a national proficiency standard was set by the
board that governs the National Assessment of Educational Progress (NAEP). This
assessment is administered by the U.S. Department of Education and is known as the
“nation’s report card.” In 2007 and again in 2011, just 32% of 8th-grade students in both
public and private school in the United States met the proficiency standard in
mathematics (Peterson et al., 2011). Because two-thirds of our nation’s students failed to
reach a proficiency standard, we have to question what is going wrong.
Finding the Cause
One explanation for the lagging mathematics performance of U.S. students lies at
the feet of the movement to bring “rigor to the masses” (Vigdor, 2013) brought on by No
Child Left Behind (No Child Left Behind, 2001). Reformers did not consider that the
higher-performing students could be compromised in the attempt to homogenize the
mathematics curriculum in secondary schools. Although the movement proved
successful at sometimes improving the performance of the average mathematics student,
these successes came at the cost of the interest of the nation’s most promising students
for mathematically intensive studies (Vigdor, 2013). The National Center for Education
Statistics (2005) reports that, in 2004, fewer students were studying mathematics at the
university-level than in 1970. The attempt to introduce new rigor and bring higher-order
subjects to more students in secondary school appears to have resulted in a strong
movement away from mathematics at the collegiate level. “As a nation, we are not
11
supporting the mathematical background needed to maintain the structure of our current
technology nor the development of needed technologies or new uses of existing
technologies” (Garii & Okumu, 2008, p. 3). Although no one wants to argue against the
gains in performance of the average mathematics student, we must find a way to capture
those gains but not at the expense of our future innovators in the STEM fields (Beard,
2013). We need to do a better job of inspiring our students to become innovators and find
a passion for mathematics, science, and technology (Bertram & McDonald, 2013).
STEM workers drive our nation’s innovation and competitiveness by generating new
ideas, new companies and new industries (Hurd, 2013). However, U.S. businesses
frequently voice concerns over the supply and availability of STEM workers. “Over the
past 10 years, growth in STEM jobs was three times as fast as growth in non-STEM jobs”
(Langdon et al., 2011, p. 1).
Another circumstance behind the decline in mathematic interest is the struggle
mathematic educators have in finding a way to narrow the disconnect between the course
content and the possibilities of careers paths our students will have once they finish
school (Beard, 2013). The key is to find a way to link the mathematics in the classroom
to practical realties of the world of students (Garii & Okumu, 2008). However, the role
of mathematics in society is changing. Garii and Okumu (2008), write, “The more that
technology impacts and influences our daily lives, the less mathematics is visible” (p. 2).
Even as teachers, we do not always explicitly “see” the mathematics, nor are we able to
perceive when mathematics is used on a daily basis because it is hidden by technological
advances (Nicol, 2002; Garii & Okumu, 2008). As teachers, we know the importance of
application problems in the curriculum. Therefore, we tend to create contrived problems

12
as a substitute for meaningful and relevant problems for our students (Nicol, 2002).
Although we may feel good for making an effort, that effort is not fooling our students.
If mathematics educators want to bridge the gap between what happens in the classroom
and what happens in daily living, we are going to have to uncover the hidden
mathematics (Nicol, 2002).
An ongoing war between traditionalist and constructivist philosophies could offer
another insight to the decline of American mathematics student’s proficiency levels.
“Traditionalists argue for a return to the basics (basic facts, skills, rote practice, and
memorization)” delivered in the form of lecture followed by an abundance of worksheets
and/or bookwork (Kinach, 2010, p. 368). However, a survey of secondary students
reported that learning from lectures is boring (Whitney et al., 2005) and boredom breeds
apathetic students who seldom take on the challenge to pursue careers in mathematics
and science.
The twenty-first century student has never known a world without cell phones for
instant communication, Google for instant answers, and video games for instant
entertainment (Grinager, 2006). As educators, we cannot expect the teaching methods
used to teach us will work on this new generation of students with “instant” expectations
(Prensky, 2008). “For better or for worse, the school as an institution is still very much
with us, and most of the teaching and learning that happens there has remained
completely untouched by the influence of technology” (Buckingham, 2002, p. 113). Our
students’ relationships with digital technology are not being formed at school, but rather
in the domain of popular culture. An indispensable aspect of leisure time is spent on the
Internet, mobile phones, computer games, and interactive televisions. As educators, we
13
should find ways to enlist these digital technologies for the purpose of delivering the
established curriculum and engaging our students more critically and creatively
(Grinager, 2006).
Potential Adjustments
In his book How the Brain Learns Mathematics, Sousa (2008) “proposes two
essential criteria for long-term learning: meaning and rehearsal” (Kinach, 2010, p. 368).
He explains that meaning, a very personal thing that is greatly influenced by an
individual’s experiences, is important because it determines the probability that
information will be learned and retained in long-term memory (Sousa, 2008). During the
adolescent years novelty becomes more intense. Curiosity in adolescents will drive them
to try a new challenge, but, once they have mastered the task, they lose interest and
disengage. This conflicts with the idea of the 40-problem worksheets as a means of
engaging students in mathematics. Mastery at 10 or 15 problems will bore the student
into dreading assignments. “The key here is for the teacher to find different and
meaningful applications of the mathematics to maintain interest and attention” (Sousa,
2008, p. 138). Additionally, these applications should be presented in a variety of ways
in the classroom, such as through cooperative learning, discussion, and peer- to- peer
teaching.
Sousa (2008) reports that “any new learning is more likely to be retained if the
learner has adequate time to process and reprocess it” (p. 51). Rehearsal is the continuing
reprocessing of information and it is a critical part of creating long term memory (Sousa,
2008). Scientists currently believe that before information makes it to long-term memory

14
it must pass through two types of temporary memory: immediate and working (Kinach,
2010). Information will only transfer from immediate to working memory if the students
perceive the information as meaningful and relevant. Once in working memory, it is only
through rehearsal that information makes it to long-term memory. Sousa (2008) cautions
that there are two kinds of rehearsal, rote and elaborative, and that only elaborative
rehearsal leads to meaningful recall. Elaborative rehearsal encourages students to link
new and prior learning, thereby creating meaning and transfer to long-term memory.
“Once in long-term memory, information or procedural understanding can be modified
and used to think creatively, collaborate with others and solve global dilemmas” (Kinach,
2010, p. 369).
As stated earlier, finding relevant and meaningful activities to use in the
classroom is difficult for many teachers for a number of reasons. Two explanations are
that technology is hiding the mathematics (Nicol, 2002) and teachers are not from the
same technological generation as our students. An important distinction that I feel must
be made is the difference between “digital natives and digital immigrants” (Prensky,
2001). The current generation of students who are attending school are considered digital
natives. They have always been surrounded by and accustomed to using computers,
videogames, digital music players, cell phones, and other tools and devices of the digital
age. These students are fundamentally different from those of us who have adapted to
these technologies over time, the digital immigrants. “Digital natives are accustomed to
receiving information rapidly; can parallel process and multi-task; prefer viewing
graphics before text; and function best when networked” (Grinager, 2006, p. 3). It is this

15
generational difference that educators need to consider when adjusting teaching methods
and content to better engage digital natives in learning.
We need to change the classroom experience for our students. Our curriculum
must go beyond lectures, worksheets, and contrived word problems if we want to engage
our students and bring mathematics alive for them. When asked, students will tell you
they want “an interesting class” (Whitney et al., 2005, p. 32) where they can learn by
playing games, work in groups, and apply what they are learning in the classroom to what
they saw on television and do at their part-time jobs. Furthermore, “they wished to be
actively involved in their learning, to be moving around and engaged” (Whitney et al.,
2005, p. 34).
Summary
The United States has a problem in mathematics education. Considering the
changes occurring in our daily lives, is it really a stretch to realize that we need to change
our classrooms? There is a decline in the number of college graduates in mathematics
related fields. Students are not relating to the mathematical concepts because classrooms
are boring and application problems are contrived. Teachers have a difficult time finding
real world mathematics that interests the students because we tend to leave students out
of the planning process. Two factors, the increase in technology and the hidden
mathematics in daily activities, also makes it difficult to bring the mathematics from the
world into the classroom. Teachers need to change the climate of the classroom and
leave traditional lecture and rote practice behind and make the study of mathematics
meaningful and engaging for all students (Nicol, 2002). In order for the United States to

16
compete in the global market, we will have to do a better job of inspiring our students to
embrace the subjects of mathematics and science. “If America is to maintain our high
standard of living, we must continue to innovate…. Math and science are the engines of
innovation. With these engines we can lead the world” (Peterson et al., 2011, p. 58).

17
CHAPTER III: METHODOLOGY
As a high school mathematics teacher, I conducted an action research study
within my Professional Mathematics course with the intent to raise the level of student
engagement through activities that students find relevant and meaningful. In order to
focus on raising levels of student engagement, I think it is essential to gather information
about their life outside the classroom and to create an environment where students have
the freedom to express how they feel about the activities. It seems vital that the teacher
assess before during and after the activity and make observations and modifications along
the way. As Brighton (2009) states, “action research is distinct from other designs in that
it emerges from stakeholders themselves” (p. 40). Therefore, an action research study
was the most appropriate way to assess the necessary components for creating activities
students find relevant.
Research Design
My first step was to identify my area of concern, which was the level of
engagement for students learning mathematics. I noticed students wanting to sleep in
class, not turning in homework, and disengaging in class almost from the moment they
entered the room. I spent some time in conversations with the two other Professional
Mathematics teachers and learned that their students where practicing similar behaviors.
My second step was to devise a plan of action. I started by deciding that my
timeline would be a single semester of study, August through December. During this
semester I used a series of intervention activities aligned with the learning objectives

18
mandated by district curriculum standards. My intention was to introduce activities that
the students would be interested in due to their relevance or entertainment factor in order
to ensure engagement. The activities contained a mathematics element that most students
would not be able to complete without some assistance, creating a need for the
mathematics lesson and, hence, increased the level of interest and engagement from the
students. I designed a pre-assessment instrument that enabled me to gather data on my
students’ attitudes, experiences, and familiarity with the mathematics to be taught with
the lesson. After the intervention activities, I provided a post-assessment instrument used
to gather the same data types followed by analysis to determine the impact of the
activities.
Site of the Study
The study was conducted at a high school in southwest Missouri in one course
taught over one semester. The high school had 1,800 students, grades 6-12, including the
Middle Years Scholars Program of which the majority of the gifted middle school aged
students in the city attend. During the time frame of the study, the population of the
school consisted of 71% White, 11% Black, 8% Hispanic, 7% Asian, and 1% Indian,
with 52% of the student population receiving free/reduced lunch. The attendance rate at
the high school was 93%, which was 2% lower than the Missouri average, and the 2015
graduation rate was around 89%. The school was also home to the International
Baccalaureate program (IB) which was designed for high school juniors and seniors and
offered a rigorous, pre-university curriculum for which students prepare during their
freshmen and sophomore years; the Middle Years Program was designed to prepare

19
younger students for the rigorous demands of the IB program. In 2016, there were 140
administrators and teachers on staff, 11 of which taught mathematics courses and 3 of
those 11 taught the Professional Mathematics course.
Participants
Purposive sampling was used for this study. I used my 26 Professional
Mathematics students in this study from a population of 66 students enrolled across all
three Professional Mathematics courses. Students in this course are not expected to have
especially strong mathematics skills nor have they been historically successful in other
mathematics courses; most calculations are elementary, although advanced mathematical
concepts were taught as needed.
The class demographics were a match to the school demographics listed
previously. The ages of the students ranged from 17 to 19 with 68% being 17 years old,
28% were 18 years old and 4% were 19 years old. The population of the class was 60%
female and 40% male, half were juniors and half were seniors. The mathematics
background of the students varied greatly with 8% had taken and passed Algebra II and
92% came to Professional Mathematics from Geometry or Geometry Concepts (a lower
level course designed for non-college-bound student).
Ethical Considerations
Approval for this project was obtained from the Missouri State University
Institutional Review Board (August 20, 2015; approval #16-0022). Ethical guidelines
were adhered to throughout the study. Due to the nature of this study, there were no
20
foreseeable risks or discomforts known to the participants, as all mathematics content
was taught in exactly the same manner it would have been whether research was being
conducted or not. A signed informed consent letter (see Appendix A) was collected from
all participating students and their guardians.
Data Collection Procedures
At key times during the project, I gathered data for analysis. As with other types
of research, the findings are stronger because I examined multiple types of data. I
collected pre- and post-activity assessments of students’ mathematics skills, pre- and
post-attitude surveys, pre- and post-questionnaires and post-activity surveys.
At the beginning of the school year, I administered a student information
questionnaire in order to determine what kind of activities the students were involved in
outside of the classroom. I found that 46% of my class was employed in the fast food
industry and I used this fact, along with information about their other areas of interest
such as spending money and video games, to select and prepare four activities as a means
of providing tasks that the students should find more meaningful and relevant to their
daily lives. Pre- and post-activity analyses, including frequency distributions, mean,
median and mode and standard deviation, were conducted to determine the interest levels
and the ability of the students before and after each of the four activities.
At the end of each activity, the students were asked to answer five questions (see
Appendix B) about the intervention lesson. I compared the students’ comments with my
log notes in order for me to make necessary revisions and adjustments as I prepared the
next intervention lesson.

21
Although my study was designed to find a way to improve student engagement
through relevant and meaningful activities in mathematics, the overall assumption was
that having engaged and curious students would create a desire to learn mathematics and
through the activities their mathematic ability level would increase. The pre- and post-
activity assessments (see Appendices C-H) were used to measure any gains in the
student’s mathematic knowledge and skills that were being achieved as a result of
instruction.
I also used my personal reflections as data. While I planned and taught the
intervention activities, I kept a reflective journal noting which students showed increased
engagement and skill, which instructional strategies led to such improvement, and which
learners still struggled to stay engaged. I looked for patterns in the content and activities
that the students seem to prefer with the intent use them when planning future activities.
Instrumentation
In order to gain a quantitative measure of student attitude levels, Aiken’s (1974)
subject specific mathematics scale (see Appendix I) was used at the beginning of the
semester to get a baseline measure and then again at the end of the semester. Data was
collected for three content units: (1) percentages, (2) graphing linear equations, and (3)
combinations and permutations. For each unit, the following instructional design was
followed:
Pre-activity assessment: four questions designed to measure the students’
content knowledge prior to instruction (see Appendices C, E, and G);
Pre-unit questionnaire: four questions designed to measure the students
attitude toward the upcoming activity-based on the pre-activity diagnostic
assessment (see Appendix J);

22
Activity: Four activities chosen based on students common interest. Two
activities used during the percentage unit, one used during the linear equation
unit and one used during the combinations and permutations unit (see
Appendices K, L, M and N);
Post-activity assessment: four questions similar in content to the pre-activity
diagnostic assessment, designed to measure the students’ content knowledge
after instruction (see Appendices D, F, and H);
Post-unit questionnaire: five questions designed to measure the students’
attitude toward their performance on the activity and the post-activity
assessment (see Appendix B);
Post-Activity Survey: a Likert scale survey designed to measure the students’
attitudes toward the activity and learning and using mathematics (see
Appendices O, P, and Q).
To cultivate student engagement, I used four activities that I thought the students
would find relevant based on the information gathered from questionnaires. These
activities were not original creations but resources found on the Internet that were
adjusted to meet the requirement for the course curriculum standards. The activities are
as follows:
Dueling Discounts (Meyer, 2013) and Birthday Shopping (Russell, 2015): two
activities that require the students to use percentages to calculate discounts
while shopping and calculate tax on purchases. (Appendices K and L);
Algebra vs. Cockroaches: a Web-based computer game that requires the
student to write the equation of a line that the cockroaches are traveling.
(Appendix M);
Is Wendy’s Right (Turbiville, 2011): an activity that requires the student to
use combinations and permutations in order to determine if an advertisement
used by the company is true. (Appendix N).
Role of the Researcher
“You know what's amiss in your students' learning, but not how to make it right.
You're not stuck; you're ready for action research” (Brighton, 2009, p. 41). The most

23
difficult part of my job as a mathematics teacher is answering the question, “Why do I
need to know this?” I believe this question stems from a level of frustration that many
mathematics students encounter during the learning process due to the fact that they
cannot see the need for the mathematics. As the teacher involved in this action research
study, I was open to experimenting and trying out various teaching methods and activities
to see if I could help my students not only find a need for the mathematics but be
inquisitive about it.
Once I had the students’ interest, I used it to engage the students and had them
actively involved and asking questions. Typically I take on the role of lecturer in my
classroom; with these activities, my role shifted to providing assistance and scaffolding
when needed as students worked collaboratively and autonomously to solve problems. I
had the students work in small groups on a shared task and discuss their mathematical
thinking.
I kept a journal of my journey through this research project as a means to
investigate and improve my teaching practice. I focused my entries on both of the
intended outcome of the intervention activities and the actual outcomes. I made notations
about the level of engagement of the students as well as the climate of the classroom in
terms of mood and student attitudes.
Data Analysis
Analysis of the data was an on-going process throughout the semester. The
Aiken’s Enjoyment of Mathematics scale was a Likert scale with values of 1 assigned to
“strongly disagree”, 2 assigned to “disagree”, 3 assigned to “undecided”, 4 assigned to
24
“agree” and 5 assigned to “strongly agree” for questions 1, 2, 4, 6, 7, 9, and 11 which
were worded in a positive manner. To get a valid total for the Likert scale, a reversed
value was assigned to questions 3, 5, 8, and 10, which were the negative worded
questions such that 1 is assigned to “strongly agree”, 2 is assigned to “agree”, 3 is
assigned to undecided, 4 is assigned to “disagree” and 5 is assigned to “strongly
disagree”. All items on the unit questionnaires that are a Likert scale were scored in the
same manner as described above. I created the pre- and post-assessment exams and I
scored them on a scale of 0 to 5, 1 point for each correct answer. No partial scores were
given on the assessments, the answer was either right and received a point or wrong and
did not receive a point. Free response questions from the unit questionnaires were
grouped into categories with groups consisting of similar type answers and outliers were
noticed and noted.
In order to determine if any of the activities had an impact on student attitudes
and mathematical ability, the numerical data collected from the pre- and post-attitude
surveys and the diagnostic exams were analyzed with descriptive statistics, such as
measures of central tendency (i.e., mean, median, and mode) and variability (e.g.,
standard deviation). I used IBM SPSS Statistics for Windows, version 20.0 (SPSS) to
run a paired sample t-test to determine whether the level of interest and ability changed in
a statistically significant way from the pre-data to the post-data after completing each
activity. The reader should note that due to the small sample size (n = 26), the statistical
significance of this data analysis is not likely to generalize outside the population of 66
students enrolled in Professional Mathematics.

25
Summary
The purpose of this research was to investigate how to improve student
engagement in mathematics by using activities that typically disengaged students would
find relevant and entertaining. With the aim of increasing student engagement in
mathematics through making the mathematics relevant and entertaining, the following
research questions were investigated: (1) What outcomes do classroom activities that
students perceive as applicable to daily living have on their attitudes toward learning and
using mathematics? (2) What impact does the use of relevant, real-world inspired
activities have on secondary mathematics students’ academic achievement? (3) What
impact does the use of relevant, real-world inspired activities have on secondary
mathematics students’ level of engagement in classroom activities? I conducted an action
research study within my Professional Mathematics course creating a sample size of 26
students. Students who take this course have a history of low math scores, low levels of
participation, and typically report not enjoying mathematics courses. Activities believed
to be considered relevant by the students were selected and implemented. Both
diagnostic and attitude assessments were given prior to the activities and after. I
completed my data collection with journal entries of my observations during the
activities.

26
CHAPTER IV: RESULTS
This chapter contains the detailed results of the data collection and will report
findings in relation to the research questions for this study. Presented in this results
chapter will be the answers to the following questions:
1. What outcomes do classroom activities that students perceive as applicable to
daily living have on their attitudes toward learning and using mathematics?
2. What impact does the use of relevant, real-world inspired activities have on
secondary mathematics students’ academic achievement?
3. What impact does the use of relevant, real-world inspired activities have on
secondary mathematics students’ level of engagement in classroom activities?
Question 1
What outcomes do classroom activities that students perceive as applicable to
daily living have on their attitudes toward learning and using mathematics?
Student Perceptions. The answer to question 1 should be analyzed in two parts.
Before student attitudes can be analyzed, I must first must determine if the students found
these activities to be applicable to their everyday lives. Question 3 on the pre-unit
questionnaire reads, “Based on the pre-assessment questions which of the following best
describes how you feel this mathematics concept plays a part in your daily living. Circle
the number that best describes how you feel.” Question 3 in the post-unit questionnaire is
exactly the same, with “pre-assessment” replaced with “post-assessment” and the
wording for response choice 4 was slightly altered. The numbered responses 1 through 5
and their results are listed in Table 1 and 2.

27
All three units have an increase in the number of students answering that they
probably or absolutely need to know the mathematical concept being taught. The
Percentages unit shows an increase from 15% in Table 1 to 46% in Table 2, the Linear
equations unit shows an increase from 12% in Table 1 to 20% in Table 2, and the
Combinations and Permutation unit shows and increase from 15% in Table 1 to 34% in
Table 2.
Table 1: Pre-Unit Questionnaire Question 3 (n = 26).
Response - (percent)
Units
Absolutely do not need
to know this
at all
I might need to know this
one day but
I'm not worried
about it now
Undecided
I probably need to know
this so I'm
looking forward to
this unit
Absolutely must know
this
Median Mean St. Dev.
Percentages 27 15 42 15 0 3 2.5 1.1
Linear equations 27 12 50 12 0 3 2.5 1
Combinations and
permutations
27 15 42 15 0 3 2.5 1
Table 2: Post-Unit Questionnaire Question 3 (n = 26).
Response - (percent)
Units
Absolutely do
not need to
know this at all
I might need
to know this
one day but I'm not
worried about
it now
Undecided
I probably
need to
know this so I'm
looking
forward to this unit
Absolutely
must
know this
Median Mean St. Dev.
Percentages 8 15 31 31 15 3 3.3 1.2
Linear equations 23 31 27 8 12 2 2.5 1.3
Combinations
and permutations
23 8 35 19 15 3 3 1.4
A paired sample t-test showed that for the pre-and post-activity questionnaire question 3
for the linear unit and the combinations and permutations unit there was no statistically

28
significant difference, however the percentage unit did prove to have a statistically
significant, t(25) = -4.7, p = .003, positive change in the students perception in the
relevance of percentages to their daily lives. The reader should note that due to the small
sample size this outcome is not likely to generalize outside the research population.
In the Wendy’s and Shopping surveys questions 3, 7, 8, 9, and 10 all address the
student’s perceptions of the relevance of the content to their everyday lives. The
questions and their results are listed in Table 3.
Table 3: Students’ Perceptions of the Relevance to Their Everyday Lives (n=26)
Response (percent)
Survey Question
Strongly
Disagree
Disagree
Undecided
Agree
Strongly
Agree Median Mean St. Dev.
(3) I am interested in doing more activities that involve
everyday life math rather than
worksheets
Shopping 4 17 35 26 18 3 3.3 1.1
Wendy's 0 8 21 54 17 4 3.8 0.8
(7) I think activities that use everyday life math help me
enjoy math class
Shopping 9 17 22 35 17 4 3.3 1.3
Wendy's 4 12 17 50 17 4 3.6 1
(8) I think this activity that used
everyday life math makes me more aware of how I can use
what I learn in the classroom in
my everyday life
Shopping 17 17 17 22 26 3 3.2 1.5
Wendy's 0 0 29 63 8 4 3.8 0.6
(9) I don't think I need any of
the math I have learning in this
activity in my everyday life.
Shopping 30 9 35 13 13 3 3.3 1.4
Wendy's 0 42 33 21 4 3 3.1 0.9
(10) I do not think that the math
I learned while doing this
activity will help prepare me for
the workforce or for college.
Shopping 30 9 35 13 13 3 3.3 1.4
Wendy's 17 21 33 8 21 3 3 1.4

29
First, it is clear from the results of the activity surveys that students found these
activities were applicable to their everyday lives with less than 35% of the students’
either disagree or strongly disagree that the mathematics they learned in the Shopping
and Wendy’s activities was used in their everyday life. A second finding was that less
than 26% of the students are not interested in doing more activities that involve everyday
life mathematics and do not think that the activities helped them enjoy this mathematics
class.
As discussed in Chapter 2, the relevance of technology in our students’ life should
not be overlooked. Question 4, 5, 11, and 12 from the Algebra vs. Cockroach game
address the students’ inclination to consider an interactive game using technology more
relevant to their everyday life than the traditional pencil and paper approach. The
questions and the results are presented in Table 4.
Table 4: Students’ Inclination to Engage in an Interactive Game (n=26)
Response - (percent)
Survey Question
Strongly Disagree
Disagree
Neither Agree Nor
Disagree
Agree
Strongly Agree
Median Mean St. Dev.
(5) I learned a lot about graphing
lines while playing the game. 14 32 36 18 0 3 2.6 1
(11) I am interest in playing more games that help me learn math. 14 14 50 9 14 3 3 1.2
(4) I would rather do a worksheet on graphing lines that play the
Algebra vs. The Cockroaches
game. 0 14 32 14 41 2 2.2 1.1
(12) I would rather do worksheets than play game to learn math. 8 23 31 31 8 3.5 3.4 1.6
The results from the Algebra vs. Cockroach game were undeniably less favorable
than the other activities. Only 18% of the students reported learning about graphing lines

30
through playing the game and over 50% of the students reported they would rather do a
traditional worksheet than play this particular game. However, over 30% are willing to
try a different game rather than doing worksheets.
Student Attitudes. The first survey given at the beginning of the year was the
Aiken Enjoyment Scale. This survey was used as a baseline for the students’ attitude
toward learning and using mathematics prior to any interventions. The same survey was
administered at the end of the semester after all interventions had occurred. The
complete results for both can be found in Appendices R and S. A pared sample t-test
showed that the pre-and post-Aiken Enjoyment scale survey did have a statistically
significant positive change, t(25)= -4.408, p<.001 which indicates the students’ attitudes
toward learning and using mathematics improved. The reader should note that due to the
small sample size this outcome is not likely to generalize outside the research population.
The one question from the survey that had the largest increase is the question that read “I
would like to develop my mathematical skills and study this subject more.” On the
survey given at the beginning of the semester only 6% of the students either agree or
strongly agree but on the survey given at the end of the semester 39% of the students
agree or strongly agree.
A pre-and post-unit questionnaire was given to measure the students’ attitudes at
the beginning of each unit immediately after answering question on the pre-unit
diagnostic assessment. The students were asked, “Which of the following best describes
how you feel about starting this activity? Circle the number that best describes how you
feel.” Number choices 1 through 5 are described in Table 5 (question 4 on the pre-unit
questionnaire can be found in Appendix J). After finishing the intervention activity the

31
students were asked, “Which of the following best describes how you feel after
completing this activity? Circle the number that best describes how you feel.” Number
choices 1 through 5 are described in Table 5 (question 4 on the post-unit questionnaire
found in Appendix B).
Table 5: Pre- and Post-Unit Questionnaire Question 4 (n=26).
Response - (percent)
Unit
Nervous and bored
Nervous but
excited
Undecided
Confident but bored
Confident and
excited Median Mean St. Dev.
Percentages Pre-Unit 12 19 23 27 19 3 3.2 1.3
Post-Unit 8 12 19 54 8 4 3.4 1.1
Linear equations
Pre-Unit 15 8 35 35 8 3 3.1 1.2
Post-Unit 8 23 35 19 15 3 3.1 1.2
Combinations and
permutations
Pre-Unit 19 15 35 31 0 3 2.8 1.1
Post-Unit 4 8 12 65 12 4 3.7 0.9
A paired sample t-test showed that the pre-and post-activity questionnaire
Question 4 for the Percent unit and the Linear Equations unit did not have a statistically
significant change; however due to my small sample size, an increase in scores may not
be statistically significant but in education the smallest improvement is of practical
significance. The Combinations and Permutation activity did show to have a statistically
significant positive change, t(25)=-4.7, p<.001. The reader should note that due to the
small sample size this outcome is not likely to generalize outside the research population.
Journal entries for the days the pre-unit questionnaire was given for the Percent
and Linear unit had very similar results. Entries indicated several students had studied
both percentages and graphing linear equations in previous classes and felt these units
were going to somewhat be a waste of time. My notes indicate a student reassuring the

32
class that doing a unit on previously studied material meant an “easy A.” In contrast, one
student was noted to comment, “I hate percentages, I never do good on them” and then
joked about being absent for the next class period. Notes made during the administration
of the Combinations and Permutations pre-unit questionnaire indicate fewer students
having previous exposure to the subject. One student asked, “Did we do this in middle
school? Dog, that was a long time ago.”
For the purpose of this study, it was my assumption that most of the students had
not been exposed to extensive use of relevant, interactive activities in their previous
mathematics courses. Questions 3 and 5 on the Wendy’s and Shopping activities surveys
and Question 12 on the Algebra vs. Cockroaches activity address the students’ preference
for traditional worksheet practice as opposed to practicing the mathematical content
through classroom activities. The results are listed in Table 6.
Table 6: Students’ Preference for Worksheet vs Activity (n=26).
Response - (percent)
Survey Question
Strongly
Disagree
Somewhat
Disagree
Neither
agree nor
Disagree
Somewhat
Agree
Strongly
Agree
Median Mean St. Dev.
(3) I am Interested in doing more activities
that involve math that I
could use in everyday life.
Shopping 4 17 35 26 18 3 3.3 1.1
Wendy's 0 8 21 54 17 4 3.8 0.8
(5) I would rather do
worksheets than do
activities.
Shopping 17 40 17 13 13 4 3.3 1.3
Wendy's 29 29 21 21 0 4 3.7 1.1
(12) I would rather do
worksheet than play a game to learn about
math. 26 4 22 9 40 3 2.7 1.6
The results indicate that 44% of the students either somewhat agreed or strongly

33
agreed in an interest in doing more activities that involve mathematics that they can use
in their everyday lives. It should also be noted that 49% of the students reported that they
somewhat agreed or strongly agreed that they would rather do a worksheet rather than
play the Algebra vs. Cockroach game indicates where only 21% and 23% reported that
they would rather do a worksheet than the Shopping and Wendy’s activities, respectively.
Question 3 from the Wendy’s Activity survey had a mean score of 3.8 and a standard
deviation of 0.8 which indicates that the students are in agreement about doing more
activities after completing the Wendy’s activity.
Questions 2 and 7 from the Wendy’s and Shopping activities and Questions 1and
9 from the Algebra vs. Cockroach activities address the students’ attitudes toward
participating in these activities. The results are listed in Table 7.
Table 7: Students’ Attitudes toward Participating in these Activities (n=26).
Response - (percent)
Survey Question
Strongly
Disagree
Disagree Undecided Agree Strongly
Agree Median Mean St. Dev.
(2) The activity made me curious about other examples of everyday
math that I might find.
Shopping 4 13 26 52 3 4 3.5 0.9 Wendy's 4 17 29 33 17 3.5 3.4 1.1
(7) I think activities that use
everyday life math help me enjoy math class
Shopping 8 17 22 34 17 4 3.4 1.2
Wendy's 4 13 17 50 16 4 3.6 1.1 (1)The Algebra vs. The Cockroaches
game was fun. 35 13 35 13 4 3 2.4 1.2
(9) Making mistakes and not killing
the cockroaches made me want to figure out how to kill them even
more. 4 4 36 23 32 2 2.3 1.1
The results indicate that more than 50% of the students either agree or strongly
agree that the Shopping and Wendy’s activities made them curious about other example

34
of everyday math and believe the activities helped them enjoy math class. The students
did not find the Algebra vs. The cockroaches gave fun with 48% reporting they disagree
or strongly disagree with the question 1.
Question 2, an open-ended question on the post-unit questionnaire reads, “How
did the activities compare to previous instruction on this topic in prior courses? (better,
worse, about the same and why).” The majority of the students, 54%, reported favorable
attitudes towards the percentage and combination and permutation units. A major
distinction between the two units is the fact that 67% of the students reported that they
did not remember ever studying permutations and combinations before and 38% of the
students reported that the Wendy’s activity was a fun way to learn about combinations
and permutations. In notes taken by me from a class discussion, one student reported
what she believed to be a flaw in several of the problems. She reported, “Just because I
have 5 pants, 10 shirts, and 3 pairs of shoes does not mean I will have 150 outfits. Not all
my pants will match all my shirts and I can’t wear my Nikes with my dress slacks. You
should have thought about that first.”
In response to this comment, I asked the students to consider a situation where
this problem would be a reasonable real world scenario. A student with a part time job
explained that question could be applicable to work uniforms. She explained that her job
requires her to wear blue or black slacks with solid polo-styled top and any close-toed
shoe. The students decided that more meaningful detail made the problem more
believable. On the pre-unit questionnaire all students reported having some recall of
studying percentages before and 46% of those students did not have a favorable memory
of the subject and the responses were an even mixture of reports of “finally getting it”

35
and “still don’t get it.” On the post-unit questionnaire several students had favorable
comments about the shopping aspect of the activities like, “It’s cool to get up and walk
around like we shopping while we do our work.”
My journal entries from the shopping activities indicate that the majority of the
students seemed to be enjoying the activities while taking the mathematics portion of the
activity seriously. Day 1 of Birthday Shopping read “I am shocked by the number of
times I have been asked for help on the running total portion of the activity. Why is that
confusing them?” The difficulty that many students had on this section did not seem to
affect the students’ attitudes. They got help when they needed it and continued with the
task. One student in particular was extremely reluctant about completing the task, even
after I offered to help her with the activity. She commented, “You don’t have to do all
this calculating while you shop, the lady checking you out will put your stuff back if you
ain’t got the money.” Several students responded that such an event would cause them to
be embarrassed and in an effort to avoid such embarrassment is reason enough to learn
about sales tax and coupons.
My journal entries from the Algebra vs. Cockroach game reflect a large number
of frustrated students. Journal entry 1 of Cockroach game read, “NEVER AGAIN, boy
did I miss the mark on this one!” I had to work individually with 93% of the students. I
reported in my journal how shocked I was to find so many students so defeated at Stage
two of the game. Stage two is where the student must identify the slope of the line that
the cockroaches are running on. Journal entry 4 of Cockroach activity read “note to self:
Students don’t listen! I had to show 80% of the class AGAIN how to use the hint button.”
Once I showed the students how to use the “Hint” button on the game, many of them

36
found a new determination for completing the game. Most of the complaints about the
game came from the fact that if the game timed out on you, which happened after sixty
seconds of play, you had to start the round over. Students would be on equation four out
of five and the game would time out on the fourth equation and students would have to
start the round all over. This is what they reported on the post-unit questionnaire to be
the most frustrating part of the game. At some time during the game, 25% of the students
asked if they were allowed to find a substitute game to play. The decision was made that
they could search for a new game given the criteria that the game had to involve graphing
or answering questions about linear equations. No appropriate alternative games were
found on that day.
Notes in my teacher journal on the days of the Wendy’s activity indicated a great
level of interest from the students about the advertisement that claimed 256 ways to
personalize a Wendy’s burger. Journal entry 1, day 1 of Wendy’s activity read, “Wow!
That went better than I imagined. I was worried that the advertisement being from 2009
would cause the students to lose interest but I was wrong!” Groups of students were
discussing the validity of the claim and 7 students felt the claim to be too high. Other
groups were noted to be discussing similar advertisements for other companies like Sonic
with comments like, “Sonic’s number is way bigger than Wendy’s.” Many students were
eager to know the answer and voiced disappointment that they would not know the
answer by the end of the day. Journal entry 4, Day 2 read, “Defiantly second guessing
my decision to split the activity.” My notes during the two days of instruction indicate
that students had lost interest in the Wendy’s advertisement claim. One student was
noted as saying, “This is too much work for that one question. I don’t care that much.”

37
However, once we finished the combination and permutation notes and exercises, the day
that we revisited the Wendy’s advertisement activity, based on the observed student
conversations the previous level of curiosity had returned and the class seemed once
again to be excited to determine if the advertisement claim was true.
Question 2
What impact does the use of relevant, real-world inspired activities have on
secondary mathematics students’ academic achievement?
Question 2 in the pre-unit questionnaire reads, “Describe your previous
experience with this topic from other classes.” Of the 26 students in the course, 15
students reported having studied percentages in other courses with 38% claiming a less
than favorable outcome. All students reported studying linear equations in previous
courses with 57% asserting a moderate to high level of mastery. Most of the class, 92%
indicated that they had never before studied combinations and permutations, one in
particular going on to comment, “this even sounds hard.” In contrast, 8% of students
were sure that they had been exposed to a lesson on this topic in middle school.
Question 5 in the post-unit questionnaire reads, “Which of the following best
describes how you feel about your performance on the post assessment?” The results of
number choices 1 through 5 can be found in the Table 8. Prior to the Algebra vs.
Cockroach game, 57% of the students claimed a high level of mastery in graphing linear
equations on question 1, an open-ended question on the pre-unit questionnaire (see
Appendix J). The results in Table 8 show only 8% felt like they mastered the post-unit
assessment. For the percentage unit, 50% of the students felt they might have missed a

38
question or answered all questions correctly. Results for the combinations and
permutations unit show 46% of the students felt they might have missed a question or
answered all questions correctly.
Table 8: Post-Activity Questionnaire Question 5 (n = 26).
Response - (percent)
Units
I did not
know how to do any of the
problems
I am sure I
failed but I got at least one
right
I don't
know
I might have
missed a question
I answered
all questions correctly
Median Mean St. Dev.
Percentages 4 12 35 27 23 3.5 3.5 1.1
Linear equations 8 0 46 39 8 3 3.4 0.9
Combinations and permutations
0 42 31 31 15 3 3.5 0.9
At the beginning and end of each of the three units, a pre-and post- assessment
was given to measure the students’ change in content knowledge. The results for the unit
about percentages, the unit about graphing linear equations, and the unit about
permutations and combinations are presented in Figures 1, 2, and 3, respectively.
Figure 1. Pre- and Post-Activity Assessment on Percentage Unit
0
1
2
3
4
5
6
1 2 3 4 5 6 7 8 9 10 11 12 13 14 15 16 17 18 19 20 21 22 23 24 25 26
Score
Students
Percentage Unit
Pre-Activity Post-Activity

39
The mean score on the Percentages pre-test was 1.7, and the mean score on the
post-test was 3.6. A paired sample t-test shows that the increase in mean score is
statistically significant with a p < .001. The reader should note that due to the small
sample size this outcome is not likely to generalize outside the research population, but in
education even the smallest improvement is of practical significance.
Figure 2. Pre- and Post-Activity Assessment on Graphing Linear Equations Unit
The mean score on the pre-test for graphing linear equations was 2.5, and the
mean score on the post-test was 3.7. A paired sample t-test shows that the increase in
mean score is statistically significant with a p < .001. The reader should note that due to
the small sample size this outcome is not likely to generalize outside the research
population, but in education even the smallest improvement is of practical significance.
0
1
2
3
4
5
6
1 2 3 4 5 6 7 8 9 10 11 12 13 14 15 16 17 18 19 20 21 22 23 24 25 26
Score
Students
Graphing Linear Equations Unit
Pre-Activity Post-Activity

40
Figure 3. Pre- and Post-Activity Assessment on Combinations and Permutations Unit
The mean score on the pre-test for the Combinations and Permutations was 0.9,
and the mean score on the post-test was 3.7. A paired sample t-test shows that the
increase in mean score is statistically significant with a p < .001. The reader should note
that due to the small sample size this outcome is not likely to generalize outside the
research population, but in education even the smallest improvement is of practical
significance.
Question 3
What impact does the use of relevant, real-world inspired activities have on
secondary mathematics students’ level of engagement in classroom activities? My
teacher journal entries from the two days of the shopping activities record that I had to
ask four students to get up and join the activities. Teacher journal entry 3, day 2 read,
“Second day, second activity and second time I had to get a couple of potential slackers
0
1
2
3
4
5
6
1 2 3 4 5 6 7 8 9 10 11 12 13 14 15 16 17 18 19 20 21 22 23 24 25 26
Score
Students
Combinations and Permutations
Pre-Activity Post-Activity

41
up out of their seats. If this continues it could be a long semester.” After closer
inspection, three other students were found to be just walking around but had not
committed to being fully involved in the activity. The remaining 73% of the class was
actively engaged and fully committed to the assigned tasks.
My notes from the day the students played the Algebra vs. Cockroach game
indicate a lower level of engagement. Journal entry 2 of Cockroach game read, “Ugghh,
not enough of me to go around…so many sitting and waiting on me to help. Note to self:
find a different game!” The students were asked to complete at least three levels of the
game. Level 1 is writing equations for horizontal lines, Level 2 is writing equations for
lines that pass through the origin, and Level 3 is writing equations for lines that have a
positive slope and a non-zero y-intercept. The game kept track of how many levels of
play the students completed, how many equations they wrote correctly, how many
attempts were made, and how many times they timed out. At first the students thought a
player had to be at the end of a round in order to print a report of their play, but once it
was discovered that you could print a report at any time during play I had 24% students
not complete the level they were on and 8% did not even complete the required third
level.
The recorded notes from the days spent on the Wendy’s activity show that every
student was actively engaged during the introduction discussion. Journal entry 6, day 1
of Wendy’s activity read, “SOOOOO impressed with the kiddos today! The phone call
to Wendy’s made my week! I wonder if they would have been as eager to do it if I had
made it part of the assignment?” The students went beyond what the activity asked them
to do and called a local Wendy’s and spoke to the manager about available toppings. The

42
decision I made to introduce the activity and then spend a few days learning the terms
and formulas used in combinations and permutations was seriously reconsidered. During
that time of instruction more than half of the students lost interest and became disengaged
during the days between the introduction and the finale. However, the day we revisited
the Wendy’s advertisement claim and started the discussion on what toppings were
possible for a Wendy’s burger there was 100% participation. There was a drop in
engagement once the first five students finished and others started to realize that
everyone should have the same answer. Some of the later ones to finish heard the final
answer from their peers and did not complete the calculation for themselves. The reader
should note that the Wendy’s activity was the only activity that required teaching a new
mathematical concept to the students.
Summary
For research question 1, I found that for all four activities the percentage of
student that found the activity relevant to their everyday lives was more that the
percentage that did not. All findings may not have been statistically significant due to the
small sample size. However, in education the smallest improvement is of practical
significance, a more subjective measurement, meaning that there was enough of a change
to affect a decision being made. In addition, the data shows an increase in the student’s
attitudes about learning and using mathematics. For research question 2, I found that
academic growth took place after all activities. For research question 3, I found that there
was an improvement in levels of engagement when the students are involved in the
selected activities.

43
CHAPTER V: CONCLUSIONS
My intention through this research was to see if students found classroom
activities and lessons relevant to their everyday life, then would they increase their level
of engagement, achieve academic growth, and improve a typically negative attitude
toward learning and using mathematics. The students participated in four activities, each
of which related to some aspect of their everyday lives. The students engaged in
mathematics as a result of using a less traditional teaching method. The activities
resulted in teamwork, peer tutoring, student-led inquiries, academic growth and, most
important, a slight improvement in their attitude toward learning and using mathematics.
Outcomes
As noted in Chapter 4, analyses of the Aiken’s survey, the unit questionnaires, the
activity surveys, and my teacher journal entries all indicate that the students’ attitudes
have improved. My journal entries and the Activity Attitude Surveys show that, with
each activity, the attitude improvement grew slightly more than the previous activity. My
journal entries show that, with the first activity, there was a slight hesitation from the
students to fully engage. They needed more prompting and attention from me. My
research in Chapter 2 reported change in the classroom is necessary in order to improve
student performance (Beard, 2013; Bertram, 2013; Buckingham, 2002; Grianger, 2006;
Prensky, 2008; Sousa, 2008), however I believe that the resistance to change is a very
common human trait. Although a change creates a valid feeling of insecurity for some,
the feeling is short lived and the rewards gained from this particular change in teaching

44
methods are often worth the momentary uncomfortable feelings experienced by those
involved.
Surveys and questionnaires are not the only way to measure an improved attitude
toward learning and using mathematics. I saw a change in attitudes of the students’ by
other things such as the posture of the students when they sit up straight in their seats
instead of the common slumping of the disengaged student. I have no sleepers in class,
and more students are voluntarily sitting in groups toward the front of the classroom
nearer the teacher desk. The sulky dispositions associated with having to “unplug” from
electronic devices have been replaced with a temperament eager to utilize their
technology to tackle the day’s assignment.
As noted in Chapter 4, all the activities allowed for academic growth from the
students. It should be noted that it is not surprising that the unit that showed the most
academic growth was the Combinations and Permutations unit because the students had
the least amount of previous knowledge in this content area. Also noteworthy is the fact
that academic growth still happened in the Linear Equations unit despite the students not
enjoying the game. This academic growth seems to validate Sousa’s (2008) claim that
students will learn through meaning applications of mathematics.
In all four cases the activities increased engagement. The shopping activities
were the first to be used and there were a four students who needed personal
encouragement to get up and participate. Based on my observations I felt some of them
first thought I would not be available for help during the activity. I think the change from
a teacher centered environment to a student centered one gave the students the impression
that they were on their own. However, once the first students received help from me, the

45
others were quick to send out distress calls for help and assistance. This high demand for
me is where other students started stepping in. The students that received help from me
first were quick to pass on the necessary information to their peers. I found that the
benefits of peer tutoring gave the students the opportunity to customize their learning
experience, which according to Prensky (2008), customization is a daily experience for
the digital natives. In an effort to make a connection to what happens in the students’
daily lives to what happens in the classroom, the peer tutoring had a positive influence on
the level of engagement.
The Algebra vs. Cockroach game was the next activity and although the students
showed a high level of interest and excitement at the prospect of playing a video game
during class time, the enthusiasm died quickly. According to the feedback received from
the students on the activity survey and interviews, the most common complaint about the
game was the time out feature. The students reported feeling rushed as the number of
cockroaches grew and then very frustrated when any accomplishments were wiped away
and they were forced to start over in the event of a time out. I believe if the students had
some control over the time allowed for each round the game would have received better
reviews. Despite the unfavorable feelings about the Algebra vs. Cockroach game, it must
be noted that the students were still interested in playing games to learn and practice
mathematics. Several students have volunteered to search for a more favored game for
future use.
The final activity for this research project was “Is Wendy’s Right?” Before
starting the activity I had to decide if I would introduce it and then teach the necessary
lessons or wait and introduce it after teaching the content. I decided to use the activity as

46
a hook, something to generate interest, to give them a reason to stay engaged and acquire
the necessary information to complete the task. During the two days of instruction I was
almost certain that my decision was not the right one and that I would not be able to
regenerate the initial interest in order to complete the task. However, once we started
making suggestions for possible toppings for a Wendy’s burger, all students were
engaged and excited to complete the task. As Prensky (2008) suggested, allowing
students to remain “plugged in” and use their electronic devises to make inquiries about
the Wendy’s menu and place a call to a local Wendy’s helped improve engagement
during this activity.
Implications
An implication of this action research study is that my students want more
activities. Given a choice between a 50 multiple-choice question test and an activity that
involved multiple mathematics concepts for a semester exam, the students chose the
activity. The final exam project was not an official part of this action research project but
I believe that it serves as proof that the students are interested in learning and using what
they learn in the manner. This project took two weeks for the students to complete. It
contained 12 separate assignments which required research on cost of living, education
requirements for potential future jobs qualifications, and potential earning for these jobs.
This project required mathematics from several units including percentages and linear
equations. This final exam activity also required the students to write about their findings
and yet, they would rather do that than one 90-minute, 50 question, multiple-choice test.
I hope this speaks volumes to others who are fortunate enough to teach a course that
47
allows for some freedom with the curriculum planning.
For me, the teacher researcher, I learned how to be more comfortable releasing
some of my control over the classroom. The background of this group of students did not
show a group of students who would be willing to take some control over their
educational experience. Many students typically come to me with a history of having to
repeat classes, high absenteeism, and a reputation of disengagement. These potential
obstacles do not make it easy for me to give them control of their learning.
At the onset of this research project, the students seemed unable to move forward
without help from me if they encountered some stumbling block nor were they bothered
if their questions went unnoticed and unanswered. Somewhere along the way they
started depending on each other a little more by sending one representative from the
group to come and interact with me and then return to their group and share what they
learned. I witnessed them take control over a discussion about the possible toppings for a
Wendy’s burger and decide for themselves to call the franchise and speak to someone
who could provide an answer. That was one of the best moments of this research. The
call was placed on the speaker phone so all could hear. The two students speaking on
behalf of the class were professional and conducted the call with respect for the manager
and represented the class well.
At this point in the semester, the very same students who were once inclined to sit
back and let their question go unanswered were now taking the initiative to take action
and find the answers. This change in the students’ attitude toward learning is one of the
significant in my opinion. They may not be aware, but they have accepted the

48
responsibility to be in charge of their own learning which will prove helpful whether they
go into the workforce after high school or higher education.
Chapter 2 discussed in detail the rise in STEM jobs and the pronounced need for
more students to study STEM related disciplines and then work in STEM related fields.
Such an outcome was my goal and this report would be lacking without some discussion
on the outcome of this goal. From my class of 26 students I have one student who
decided to pursue a career in teaching mathematics at the elementary level. Another
student, through a bridge building activity not discussed in the paper, discovered a love
and natural ability and interest in building. He plans are to enter the military and then
later study architecture. I still have students absent without good reason. I still have
students who will not turn in an assignment without badgering from me. I still have the
“great pretenders”, those who have mastered the art of looking like they are actively
engaged when in fact they are just passing time. I still have those that will have to repeat
this class. But the small gains that some of these students have made over the course of
this semester gives me hope for them and their futures.

49
REFERENCES
Aiken, L. (1974, March). Two scales of attitude toward mathematics. Journal for
Research in Mathematics Education, 5(2), 67-71. Retrieved from
http://www.jstor.org/stable/748616
Beard, K. (2013, November 13). Behind America’s decline in math, science and
technology. U.S.News & World Report. Retrieved from
http://www.usnews.com/news/articles/2013/11/13/behind-americas-decline-in-math-
science-and-technology
Bertram, V. & McDonald, J. (2013, November 11). Bringing real-world science to the
classroom. U.S.News & World Report. Retrieved from
http://www.usnews.com/opinion/articles/2013/11/11/how-to-get-middle-and-high-
school-students-interested-in-stem
Brighton, C. M. (2009). Embarking on action research. Educational Leadership, 66(5),
40-44.
Buckingham, D. (2002). Beyond technology: Children’s learning in the age of digital
culture. Malden, MA: Polity Press.
Engagement. (n.d.). In The glossary of education reform. Retrieved from
http://edglossary.org/student-engagement/
Garii, B. & Okumu, L. (2008). Mathematics and the world: What do teachers recognize
as mathematics in real world practice. The Montana Mathematics Enthusiast, 5(2-3),
291-304.
Grinager, H. (2006). How educations technology leads to improved student achievement.
Educational Issues, [Online]. Available:
https://www.ncsl.org/portals/1/documents/educ/item013161.pdf, [2015, April 11].
Herman, A. (1999) Future work: trends and challenges. Worklife Report, 12(2), 9.
Retrieved from
http://www.dol.gov/oasam/programs/history/herman/reports/futurework/execsum.htm
Hurd, J. (2013, November 4) Lack of interest in science is hurting the economy. The
Varsity. Retrieved from http://thevarsity.ca/2013/11/04/lack-of-interest-in-science-is-
hurting-the-economy/
Kinach, B. M. (2010). Review of 'How the brain learns mathematics'. The Journal Of
Educational Research, 103(5), 368-369. doi:10.1080/00220671.2010.483995

50
Langdon, D., McKittrick, G., Beede, D., Khan, B., Doms, M., & Economics and
Statistics Administration, (2011). STEM: Good Jobs Now and for the Future. ESA
Issue Brief #03-11. US Department Of Commerce.
Meyer, D. (2013, March 6). Dueling Discounts. Retrieved from
http://threeacts.mrmeyer.com/duelingdiscounts/
National Center for Education Statistics. (2005). Table 249. Bachelor's degrees conferred
by degree granting institutions, by discipline division, selected years 1970-1971
through 2003-2004. In Digest of Educational Statistics, 2005. Washington, DC: U.S.
Department of Education, Institute of Educational Science.
Nicol, C. (2002). Where's the math? Prospective teachers visit the workplace.
Educational Studies in Mathematics, 50(3), 289-309.
No Child Left Behind (NCLB) Act of 2001, 20 U.S.C.A. § 6301 et seq. (2001).
Peterson, P. E., Woessmann, L., Hanushek, E. A., & Lastra-Anadon, C. (2011). Globally
challenged: Are U.S. students ready to compete? The latest on each state's
international standing in math and reading. PEPG 11-03. Program on Education
Policy and Governance, Harvard University
Prensky, M. (2001). Digital natives, digital immigrants. On the Horizon, 9(5). Retrieved
from http://marcprensky.com/articles-in-publications/
Prensky, M. (2008). Turning on the lights. Educational Leadership, 65(6), 40-45.
Relevance. (n.d.). In The glossary of education reform. Retrieved from
http://edglossary.org/relevance/
Resendez, J. L. (2012, September 16). Lack of Interest Eliminates Math Major at Texas
Wesleyan. The Rambler.Org. Retrieved from http://therambler.org/2012/09/16/lack-
of-interest-eliminates-math-major-at-texas-wesleyan
Russell, A. (2015). Birthday shopping activity. Created for Central High School’s
Professional Mathematics course.
Sousa, D. A. (2008). How the Brain Learns Mathematics. Thousand Oaks, CA: Corwin
Press.
The Editorial Board (2013, December 7). Who Says Math has to be Boring. The New
York Times. Retrieved from
http://www.nytimes.com/2013/12/08/opinion/sunday/who-says-math-has-to-be-
boring.html?_r=2&
Turbiville, N. (2011, September 7). Is Wendy’s Right. Walking in Mathland:

51
http://walkinginmathland.weebly.com/teaching-math-blog/wendy
Vigdor, J. (2013). Solving America's Math Problem. Education Next, 13(1), 1-9
Watt, H., Richardson, P., & Pietsch, J. (2009). Choosing to teach in the “STEM”
disciplines: Characteristics and motivations of science technology, and mathematics
teachers from Australia and the United States. Teacher Education: Policy Practice
and Research, University of Michigan: Nova Science Publishers.
Whitney, J., Leonard, M., Leonard, W., Camelio, M., & Camelio, V. (2005). Seek
balance, connect with others, and reach all students: High school students describe a
moral imperative for teachers. High School Journal, 89(2), 29-38.

52
APPENDICES
Appendix A: Informed Consent Letter
You (your child) have been asked to participate in a research study as part of my
requirements for a Master of Science in Education. Before you agree to participate in this
study, it is important that you read and understand the following explanation for the study
and the procedures involved.
The purpose of this research is to investigate how to promote student interest in
mathematics through creating problems that Professional Math students will find
relevant, fun, and engaging. I will be using a variety of teaching methods such as
confidence building activities involving technologies such as calculators and computers,
group activities to encourage involvement, and lessons that relate the math in the
classroom to experiences in everyday life.
If you (your child) participate in this research, I will be writing about the results of
confidential surveys given throughout the semester. The activities and lessons will be the
same for all students, those participating in my research and those non-participants.
There are no foreseeable risks or discomforts to you (your child) as the participant.
Your participation in the research is strictly voluntary. You may refuse to participate, or
choose to stop your participation at any point in the research without fear of penalty or
negative consequence.
The information/data you (your child) provide for this research will be treated
confidentially, and all data will be kept in a secured file by the researcher as is always the
case with student information. Results of the research will be reported as aggregate
summery data only, and no individually identifiable information will be presented.
You also have the right to review the results of the research if you wish to do so. A copy
of the results may be obtained by contacting:
Adam Harbaugh – (xxx) xxx-xxxx, (Thesis Advisor)
Cherie Burkett – (xxx) xxx-xxxx, (Thesis Researcher)
Participant consent
I, (print full name)__________________________, the guardian of
____________________ have read and understand the foregoing information explaining
the purpose of this research and my rights and responsibilities as a subject. My signature
below designates my consent for my child to participate in this research, according to the
terms and conditions listed above.
Signature ______________________________________
Date______________________________

53
Appendix B: Post-Unit Questionnaire
Now that you have completed the unit, I would like to ask you a few questions about the
activities in this unit.
1. How did you feel about your performance on the activities?
2. How did the activities compare to previous lessons on this topic in prior courses?
(better, worse, about the same and why)
3. Based on the post-assessment questions which of the following best describes
how you feel this mathematics concept plays a part in you daily living. Circle the
number that best describes how you feel.
1 Absolutely do not need to know this at all
2 I might need to know this one day but I’m not sure I learned anything
3 Undecided
4 I probably need to know this so I’m glad I participated in this unit
5 Absolutely glad to know this
4. Which of the following best describes how you feel about participating in an
activity similar to this one in the future? Circle the number that best describes
how you feel.
1 Nervous and bored
2 Nervous but excited
3 Undecided
4 Confident but bored
5 Confident and excited
5. Which of the following best describes how you feel about your performance on
the post-assessment?
1 I did not know how to do any of the problems
2 I am sure I failed but I got at least on right
3 I don’t know
4 I might have missed a question
5 I answered all questions correctly
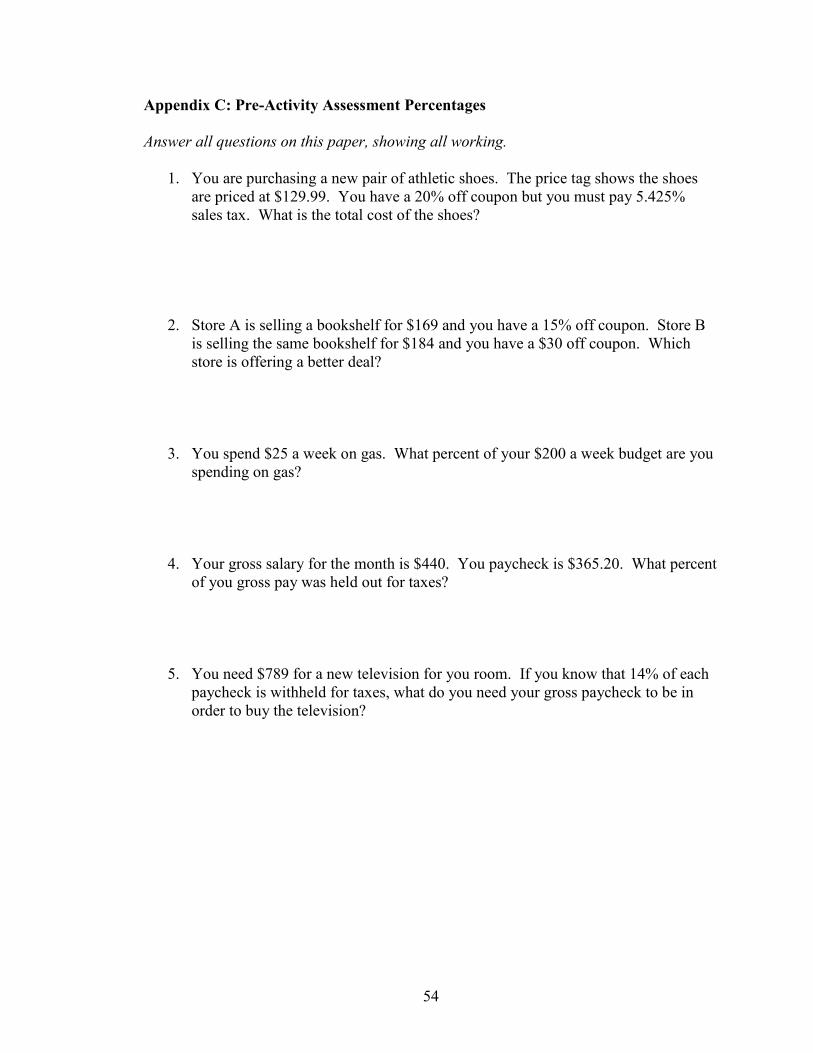
54
Appendix C: Pre-Activity Assessment Percentages
Answer all questions on this paper, showing all working.
1. You are purchasing a new pair of athletic shoes. The price tag shows the shoes
are priced at $129.99. You have a 20% off coupon but you must pay 5.425%
sales tax. What is the total cost of the shoes?
2. Store A is selling a bookshelf for $169 and you have a 15% off coupon. Store B
is selling the same bookshelf for $184 and you have a $30 off coupon. Which
store is offering a better deal?
3. You spend $25 a week on gas. What percent of your $200 a week budget are you
spending on gas?
4. Your gross salary for the month is $440. You paycheck is $365.20. What percent
of you gross pay was held out for taxes?
5. You need $789 for a new television for you room. If you know that 14% of each
paycheck is withheld for taxes, what do you need your gross paycheck to be in
order to buy the television?

55
Appendix D: Post-Activity Assessment Percentages
Answer all questions on this paper, showing all working.
1. You are purchasing a new pair of athletic shoes. The price tag shows the shoes
are priced at $119.99. You have a 15% off coupon but you must pay 5.425%
sales tax. What is the total cost of the shoes?
2. Store A is selling a bookshelf for $127 and you have a 15% off coupon. Store B
is selling the same bookshelf for $144 and you have a $30 off coupon. Which
store is offering a better deal?
3. You spend $20 a week on gas. What percent of your $220 a week budget are you
spending on gas?
4. Your gross salary for the month is $400. You paycheck is $328. What percent of
you gross pay was held out for taxes?
5. You need $889 for a new television for you room. If you know that 14% of each
paycheck is withheld for taxes, what do you need your gross paycheck to be in
order to buy the television?
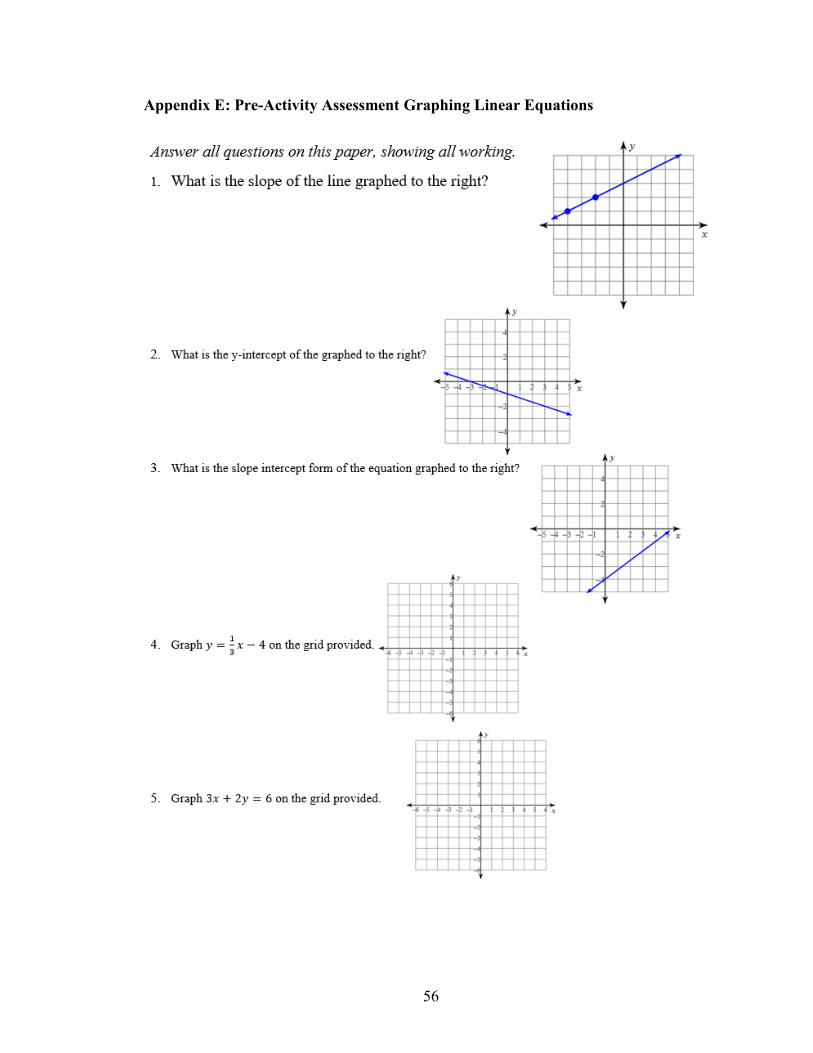
56
Appendix E: Pre-Activity Assessment Graphing Linear Equations

57
Appendix F: Post-Activity Assessment Graphing Linear Equations
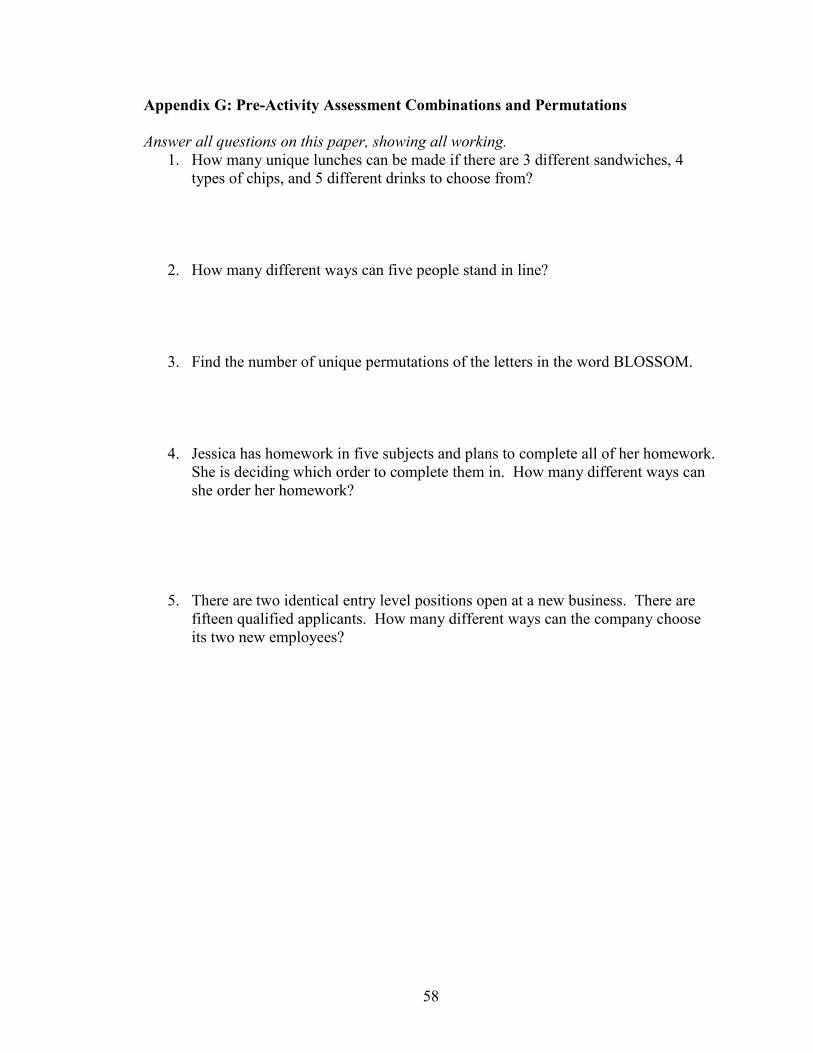
58
Appendix G: Pre-Activity Assessment Combinations and Permutations
Answer all questions on this paper, showing all working.
1. How many unique lunches can be made if there are 3 different sandwiches, 4
types of chips, and 5 different drinks to choose from?
2. How many different ways can five people stand in line?
3. Find the number of unique permutations of the letters in the word BLOSSOM.
4. Jessica has homework in five subjects and plans to complete all of her homework.
She is deciding which order to complete them in. How many different ways can
she order her homework?
5. There are two identical entry level positions open at a new business. There are
fifteen qualified applicants. How many different ways can the company choose
its two new employees?

59
Appendix H: Post-Activity Assessment Combinations and Permutations
Answer all questions on this paper, showing all working.
1. How many unique lunches can be made if there are 2 different sandwiches, 5
types of chips, and 3 different drinks to choose from?
2. How many different ways can 9 people stand in line?
3. Find the number of unique permutations of the letters in the word MISSISSIPPI.
4. Jessica has homework in seven subjects and plans to complete all of her
homework. She is deciding which order to complete them in. How many
different ways can she order her homework?
5. There are three identical entry level positions open at a new business. There are
twelve qualified applicants. How many different ways can the company choose
its three new employees?
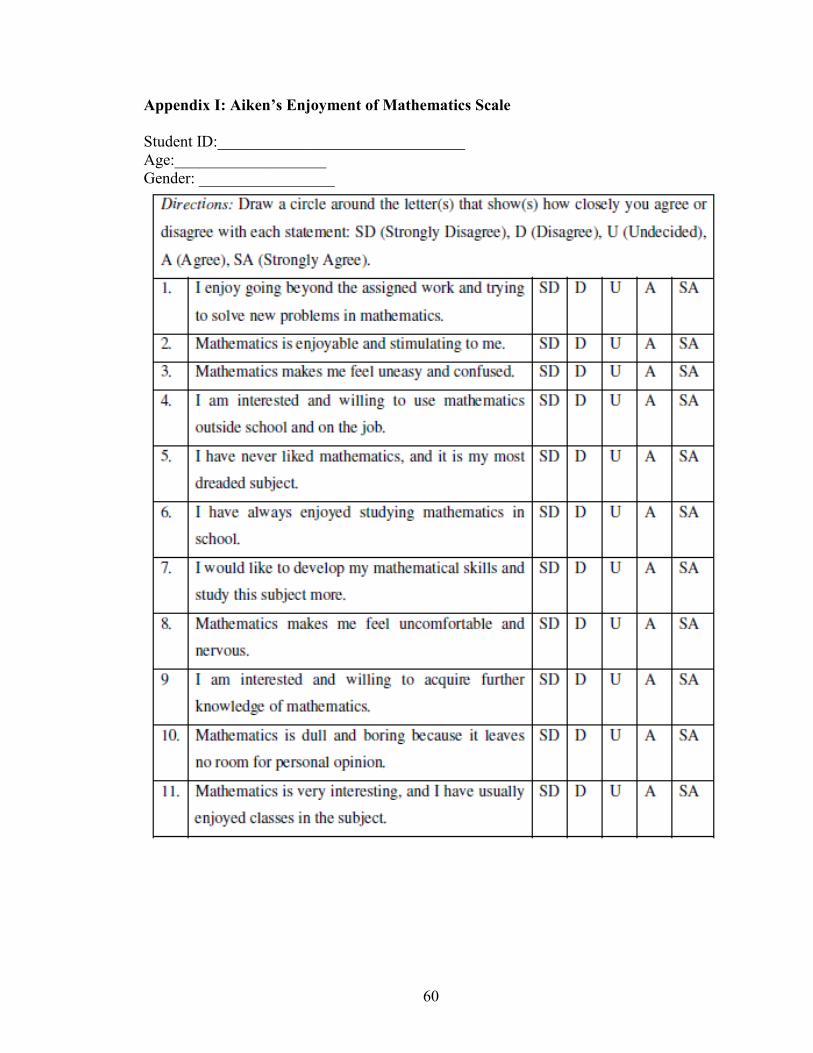
60
Appendix I: Aiken’s Enjoyment of Mathematics Scale
Student ID:_______________________________
Age:___________________
Gender: _________________

61
Appendix J: Pre-Unit Questionnaire
I have four questions for you to answer about this unit before we begin.
1. How do you feel about this new unit based on the questions on the pre-
assessment?
2. Describe your previous experience with this topic from other classes.
3. Based on the pre-assessment questions which of the following best describes how
you feel this mathematics concept plays a part in you daily living. Circle the
number that best describes how you feel.
1 Absolutely do not need to know this at all
2 I might need to know this one day but I’m not worried about it now
3 Undecided
4 I probably need to know this so I’m looking forward to this lesson unit
5 Absolutely must know this
4. Which of the following best describes how you feel about starting this activity?
Circle the number that best describes how you feel. Explain why.
1 Nervous and bored
2 Nervous but excited
3 Undecided
4 Confident but bored
5 Confident and excited

62
Appendix K: Dueling Discounts Activity

63
Three Act: Dueling Discounts
Item Original Cost 20% discount
Amt
Cost with
20% discount
$20 off
Cost
Make a conjecture about when you should take a 20% discount over a $20 off coupon.
Make a conjecture about when you should take a 30% discount over a $30 off coupon.
Generalize this to an x% discount versus an $x off coupon.

64
Appendix L: Birthday Shopping Activity
It’s Saturday night and your wife/husband’s birthday. You are going to make a special
dinner for your family of four. The thing is, you only have $16 to spend and tax is 7%.
Here is what your wife/husband requested for dinner.
Steak or grilled chicken
Cheesy potatoes or mashed potatoes
Any kind of vegetable
Some sort of bread
Birthday cake for dessert.
To make a healthy meal, each person should have at least 4-6 ounces
of meat/protein, though people usually eat more than this (there are 16 ounces in one
pound), and at least one cup of vegetables.
Make a shopping list with all the ingredients you are going to purchase and their prices.
Total your list and add the 7% tax to make sure you won’t go over budget.
Item Item Quantity Price Per Total Before
Tax
Total After
Tax
Running Total

65
Prices for the grocery store
Steak: Originally $5.89 per pound (sold only by the pound). On sale for 25% off.
Boneless skinless chicken breasts: Originally $2.49 per pound (sold only by the pound).
On sale for buy a pound, get one free.
Bag of russet potatoes: $2.99
Shredded cheese: $3.19 for a 10 ounce bag. On sale for 20% off.
Canned green beans: $0.69 per can, 2.5 cups per can.
Fresh baby carrots: $1.49 per bag, 4.5 cups for bag.
Canned carrots: $0.70 per can, 2.5 cups per can. On sale for buy one get one half off.
Fresh broccoli: $0.89 per pound (one pound is about 2 cups).
Loaf of baked French bread: $1.99
Bag of rolls: $1.89 per dozen or 6 for $1.19
Frozen garlic bread: $2.39
Cake from the bakery: $11.99. Day old cake, on sale for 50% off.
Box of cake mix: $1.39. Requires 2 eggs.
Eggs: $1.59 per dozen
It should work out that they could buy steak or day old bakery cake, but not both. If they
buy steak, they shouldn’t be able to buy cheese for the potatoes.
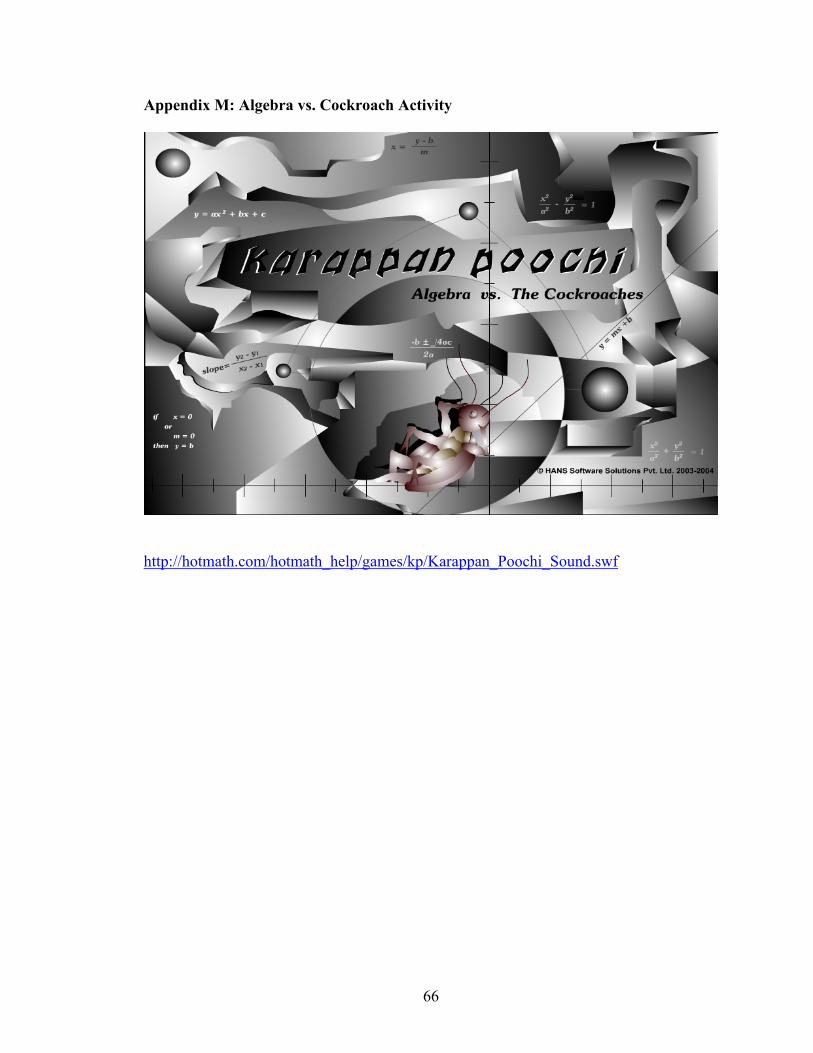
66
Appendix M: Algebra vs. Cockroach Activity
http://hotmath.com/hotmath_help/games/kp/Karappan_Poochi_Sound.swf
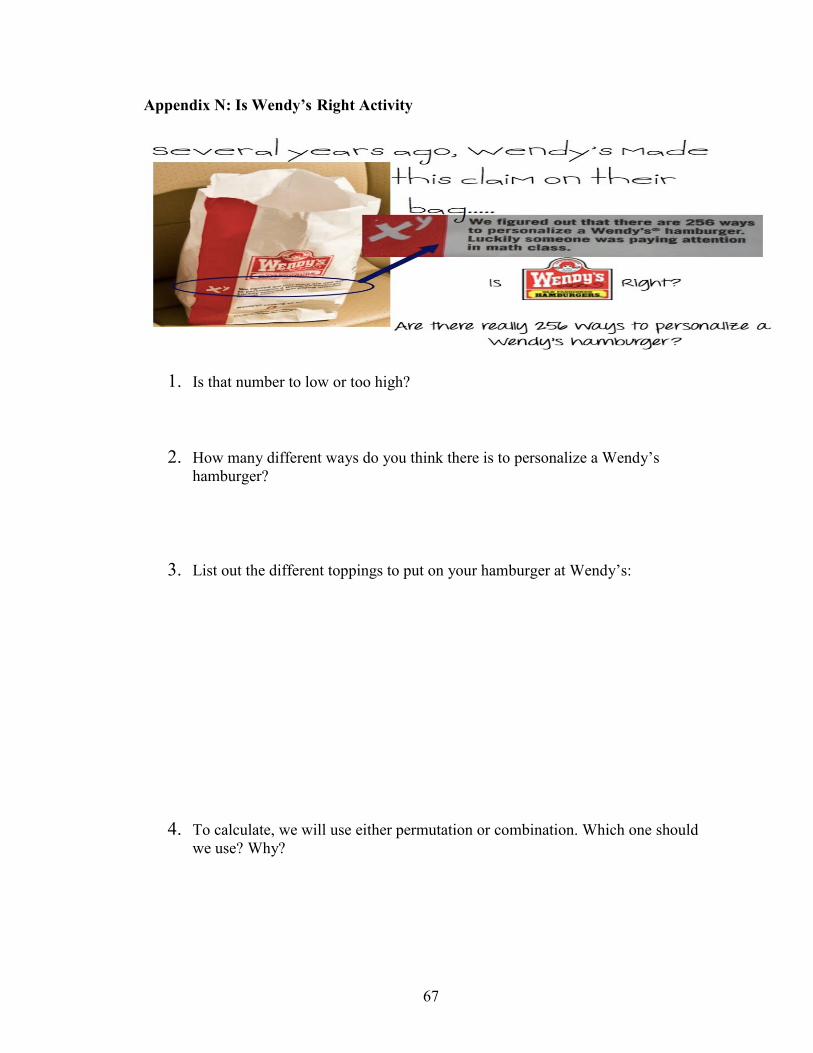
67
Appendix N: Is Wendy’s Right Activity
1. Is that number to low or too high?
2. How many different ways do you think there is to personalize a Wendy’s
hamburger?
3. List out the different toppings to put on your hamburger at Wendy’s:
4. To calculate, we will use either permutation or combination. Which one should
we use? Why?

68
5. What is the formula for combination?
6. What is the formula for permutation?
7. Calculate!
There are _______ ways to personalize a Wendy’s hamburger!
8. The number of ways to personalize that you found is for a single patty burger. How
could we find the number of ways to personalize for a single, double, or triple stack?
9. Calculate the number of ways to personalize a Wendy’s single, double, and triple
stack
http://walkinginmathland.weebly.com/teaching-math-blog/wendy
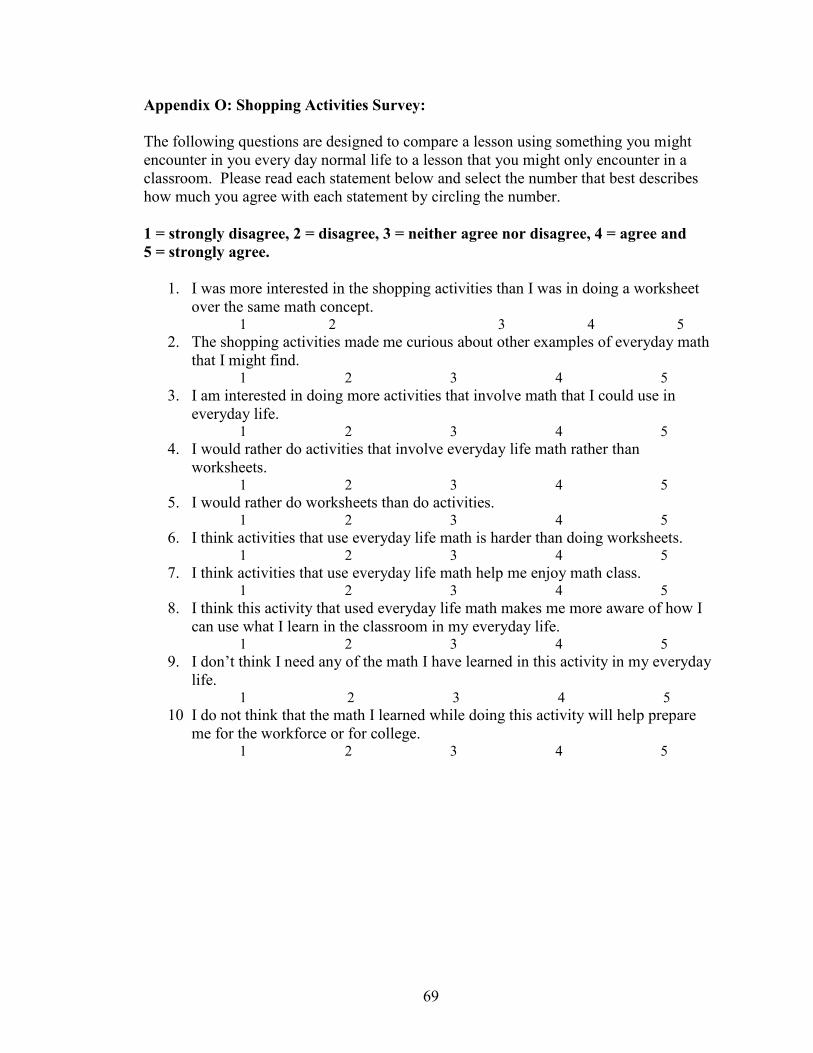
69
Appendix O: Shopping Activities Survey:
The following questions are designed to compare a lesson using something you might
encounter in you every day normal life to a lesson that you might only encounter in a
classroom. Please read each statement below and select the number that best describes
how much you agree with each statement by circling the number.
1 = strongly disagree, 2 = disagree, 3 = neither agree nor disagree, 4 = agree and
5 = strongly agree.
1. I was more interested in the shopping activities than I was in doing a worksheet
over the same math concept. 1 2 3 4 5
2. The shopping activities made me curious about other examples of everyday math
that I might find. 1 2 3 4 5
3. I am interested in doing more activities that involve math that I could use in
everyday life. 1 2 3 4 5
4. I would rather do activities that involve everyday life math rather than
worksheets. 1 2 3 4 5
5. I would rather do worksheets than do activities. 1 2 3 4 5
6. I think activities that use everyday life math is harder than doing worksheets. 1 2 3 4 5
7. I think activities that use everyday life math help me enjoy math class. 1 2 3 4 5
8. I think this activity that used everyday life math makes me more aware of how I
can use what I learn in the classroom in my everyday life. 1 2 3 4 5
9. I don’t think I need any of the math I have learned in this activity in my everyday
life. 1 2 3 4 5
10 I do not think that the math I learned while doing this activity will help prepare
me for the workforce or for college. 1 2 3 4 5

70
Appendix P: Algebra vs. Cockroach Game Survey
The following questions are designed to compare a lesson using something you might
encounter in you every day normal life to a lesson that you might only encounter in a
classroom. Please read each statement below and select the number that best describes
how much you agree with each statement by circling the number.
1 = strongly disagree, 2 = disagree, 3 = neither agree nor disagree, 4 = agree and
5 = strongly agree.
1. The Algebra vs. Cockroaches game was fun.
1 2 3 4 5
2. The Algebra vs. Cockroaches game was boring.
1 2 3 4 5
3. The Algebra vs. Cockroaches game took my mind off the fact that I was doing an
algebra assignment.
1 2 3 4 5
4. I would rather do a worksheet on graphing lines than play the Algebra vs.
Cockroaches game.
1 2 3 4 5
5. I learned a lot about graphing line while playing the game.
1 2 3 4 5
6. I did not learn anything about graphing lines playing the game.
1 2 3 4 5
7. I feel very prepared for a quiz after playing the game.
1 2 3 4 5
8. I will need to study more before taking a quiz on graphing lines.
1 2 3 4 5
9. Making mistakes and not killing the cockroaches made me want to quit playing
the game.
1 2 3 4 5
10. Making mistakes and knot killing the cockroaches made me want to figure out
how to kill them even more.
1 2 3 4 5
11. I am interested in playing more games that help me learn math.
1 2 3 4 5
12. I would rather do worksheets than play games to learn about math. 1 2 3 4 5

71
Appendix Q: Wendy’s Activity Survey
The following questions are designed to compare a lesson using something you might
encounter in you every day normal life to a lesson that you might only encounter in a
classroom. Please read each statement below and select the number that best describes
how much you agree with each statement by circling the number.
1 = strongly disagree, 2 = disagree, 3 = neither agree nor disagree, 4 = agree and
5 = strongly agree.
1. I was more interested in the Wendy’s assignment than I was in the worksheet
that we did over the same material. 1 2 3 4 5
2. The Wendy’s problem made me curious about other examples of everyday
math that I might find. 1 2 3 4 5
3. I am interested in doing more activities that involve math that I could use in
everyday life. 1 2 3 4 5
4. I would rather do activities that involve everyday life math rather than
worksheets. 1 2 3 4 5
5. I would rather do worksheets than do activities. 1 2 3 4 5
6. I think activities that use everyday life math is harder than doing worksheets. 1 2 3 4 5
7. I think activities that use everyday life math help me enjoy math class. 1 2 3 4 5
8. I think this activity that used everyday life math makes me more aware of how
I can use what I learn in the classroom in my everyday life. 1 2 3 4 5
9. I don’t think I need any of the math I have learned in this activity in my
everyday life. 1 2 3 4 5
10. I think activities that use everyday math will not help prepare me for work or
for college. 1 2 3 4 5

72
Appendix R: Aiken’s Enjoyment Scale Pre-Intervention Results
(n = 26) Response - (percent)
Survey Question
Strongly
Disagree
Disagree Undecided Agree Strongly
Agree Median Mean St. Dev.
I enjoy going beyond the
assigned work and trying to
solve new problems in mathematics. 27 23 27 15 7 2.5 2.5 1.3
Mathematics is enjoyable
and stimulating to me. 23 23 27 19 8 3 2.7 1.3
I am interested and willing to use mathematics outside
school and on the job. 31 11 23 27 8 3 2.7 1.4
I have always enjoyed
studying mathematics in school. 19 27 27 23 4 3 2.7 1.2
I would like to develop my
mathematical skills and study this subject more. 31 31 15 6 0 2 2.3 1.2
I am interested and willing
to acquire further
knowledge of mathematics. 23 15 31 27 4 3 2.7 1.2
Mathematics is very interesting and I have
usually enjoyed classes in
the subject. 15 27 23 27 8 3 2.8 1.2
Mathematics makes me feel
uneasy and confused. 15 16 15 31 27 2 2.6 1.4
I have never liked mathematics, and it is my
worst dreaded subject. 8 19 19 31 23 2 2.6 1.3
Mathematics makes me feel uncomfortable and nervous. 7 27 15 35 15 2.5 2.8 1.2
Mathematics is dull and
boring because it leaves no
room for personal opinion. 8 19 23 31 19 2.5 2.7 1.2
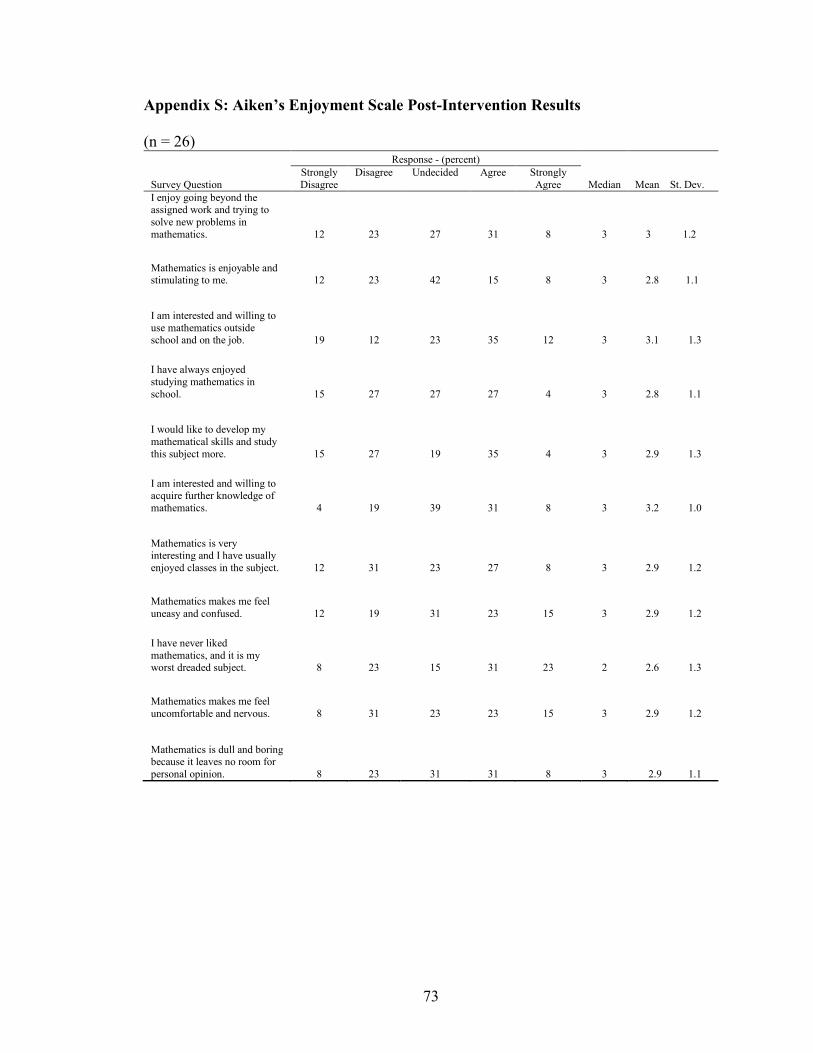
73
Appendix S: Aiken’s Enjoyment Scale Post-Intervention Results
(n = 26) Response - (percent)
Survey Question
Strongly
Disagree
Disagree Undecided Agree Strongly
Agree Median Mean St. Dev.
I enjoy going beyond the assigned work and trying to
solve new problems in
mathematics. 12 23 27 31 8 3 3 1.2
Mathematics is enjoyable and stimulating to me. 12 23 42 15 8 3 2.8 1.1
I am interested and willing to
use mathematics outside school and on the job. 19 12 23 35 12 3 3.1 1.3
I have always enjoyed
studying mathematics in
school. 15 27 27 27 4 3 2.8 1.1
I would like to develop my
mathematical skills and study
this subject more. 15 27 19 35 4 3 2.9 1.3
I am interested and willing to
acquire further knowledge of
mathematics. 4 19 39 31 8 3 3.2 1.0
Mathematics is very interesting and I have usually
enjoyed classes in the subject. 12 31 23 27 8 3 2.9 1.2
Mathematics makes me feel
uneasy and confused. 12 19 31 23 15 3 2.9 1.2
I have never liked
mathematics, and it is my worst dreaded subject. 8 23 15 31 23 2 2.6 1.3
Mathematics makes me feel
uncomfortable and nervous. 8 31 23 23 15 3 2.9 1.2
Mathematics is dull and boring because it leaves no room for
personal opinion. 8 23 31 31 8 3 2.9 1.1