using structure/function relationships to identify cqas ... · using structure/function...
TRANSCRIPT
Using Structure/Function Relationships to Identify CQAs and Develop Analytical Specifications
Michael J. Lewis, Maggie Huang, Qingrong Yan, Qing Mike Tang, and Ping Hu
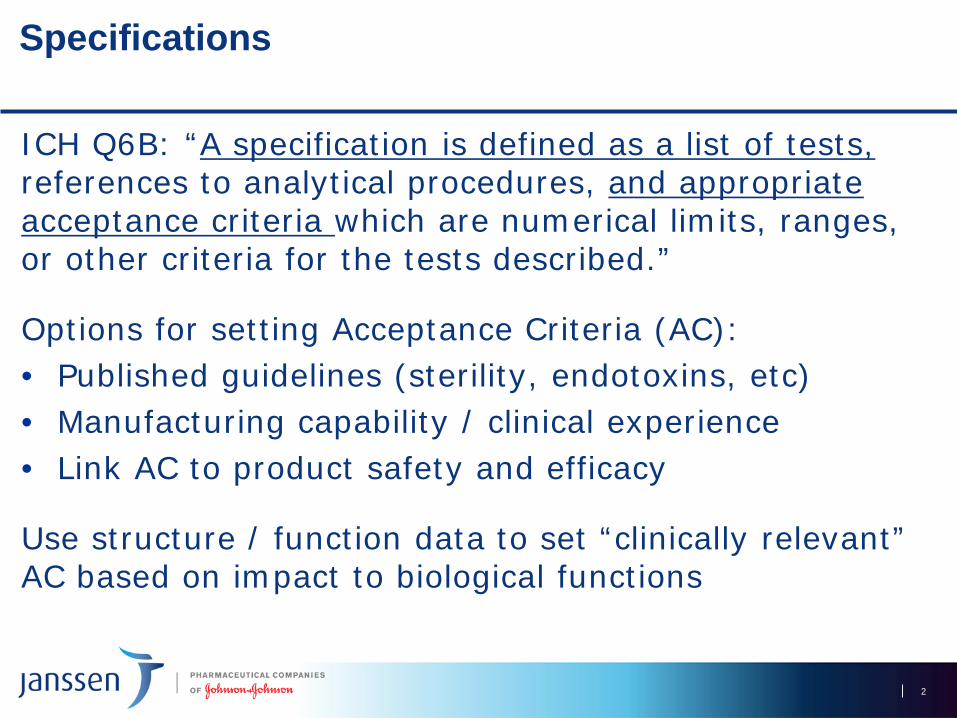
ICH Q6B: “A specification is defined as a list of tests, references to analytical procedures, and appropriate acceptance criteria which are numerical limits, ranges, or other criteria for the tests described.”
Options for setting Acceptance Criteria (AC):• Published guidelines (sterility, endotoxins, etc)• Manufacturing capability / clinical experience• Link AC to product safety and efficacy
Use structure / function data to set “clinically relevant” AC based on impact to biological functions
2
Specifications
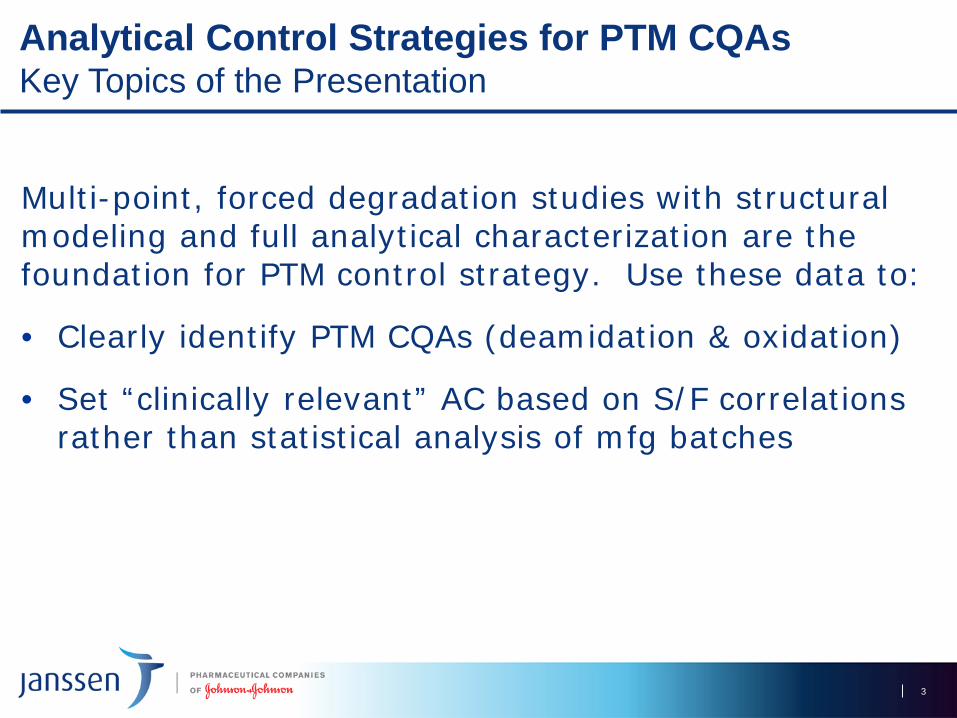
Multi-point, forced degradation studies with structural modeling and full analytical characterization are the foundation for PTM control strategy. Use these data to:
• Clearly identify PTM CQAs (deamidation & oxidation)
• Set “clinically relevant” AC based on S/F correlations rather than statistical analysis of mfg batches
3
Analytical Control Strategies for PTM CQAsKey Topics of the Presentation

Forced Deg Workflow
Quality Attributes Analytical MethodsPrimary Structure Peptide MapGlycosylation and Glycation Oligo Map and Intact MassCharge Heterogeneity cIEFSize Heterogeneity SE-HPLC and cSDSHigher Order Structure CD, AUC and DSCBiological Functions (depending on MOA)
Bioassay and Ag BindingCDC, ADCC, FcγR and FcRn Binding
• Evaluate heat, peroxides, light, pH and glucose stress• Prep 4-6 samples under each stress condition• Fully characterize all samples using the assays below
to identify CQAs and establish S/F correlations
5
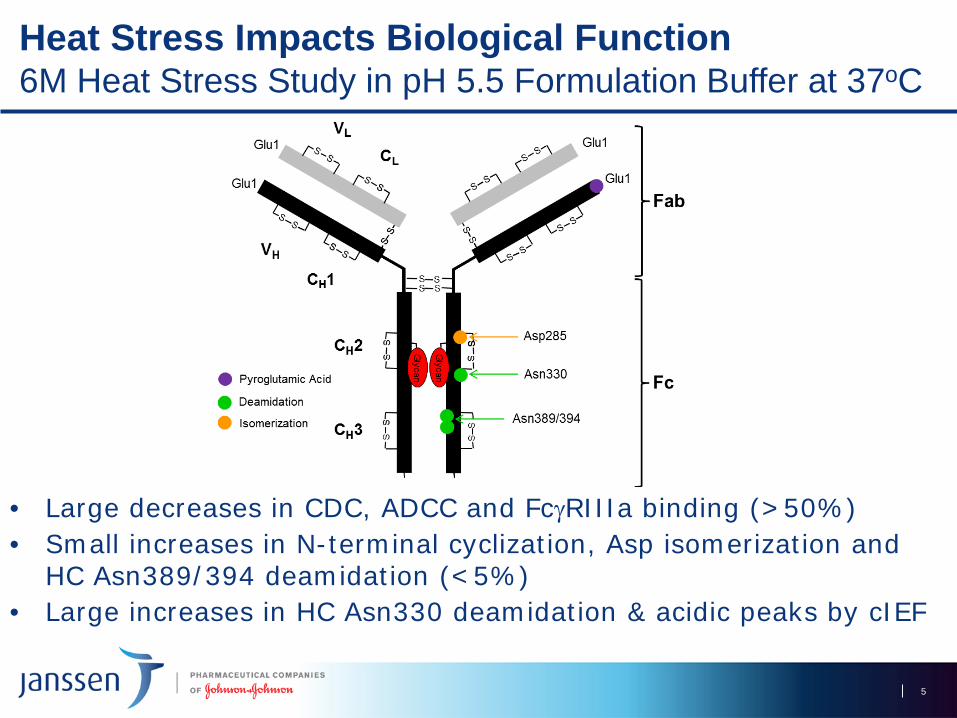
Heat Stress Impacts Biological Function6M Heat Stress Study in pH 5.5 Formulation Buffer at 37oC
• Large decreases in CDC, ADCC and FcγRIIIa binding (>50%)• Small increases in N-terminal cyclization, Asp isomerization and
HC Asn389/394 deamidation (<5%) • Large increases in HC Asn330 deamidation & acidic peaks by cIEF

6
Unique pH Profile for HC Asn330 Deamidation Comparison of 3 IgG1 mAbs at 37oC
pH 5-6
pH 7.4
pH 8.5
66
• Asn330 deamidation occurs very slowly in mild acidic buffer (6%/mon at 37ºC)
• Asn330 deamidation does not occur at neutral or higher pH. Manufacturing process variation has little impact on Asn330 deamidation.
7
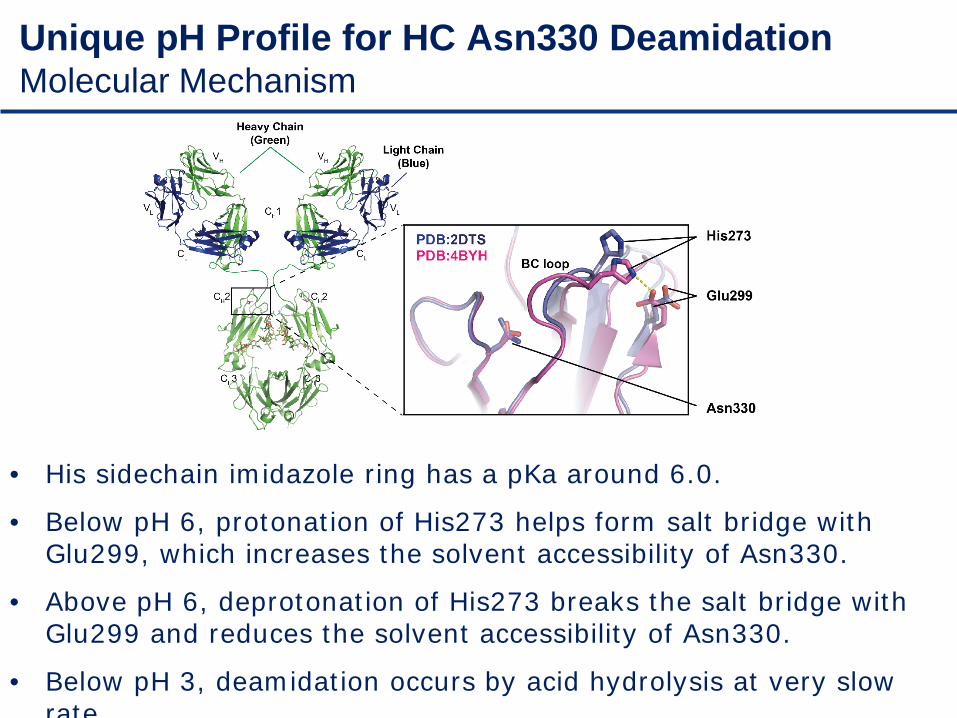
• His sidechain imidazole ring has a pKa around 6.0.
• Below pH 6, protonation of His273 helps form salt bridge with Glu299, which increases the solvent accessibility of Asn330.
• Above pH 6, deprotonation of His273 breaks the salt bridge with Glu299 and reduces the solvent accessibility of Asn330.
• Below pH 3, deamidation occurs by acid hydrolysis at very slow rate
Unique pH Profile for HC Asn330 Deamidation Molecular Mechanism
8
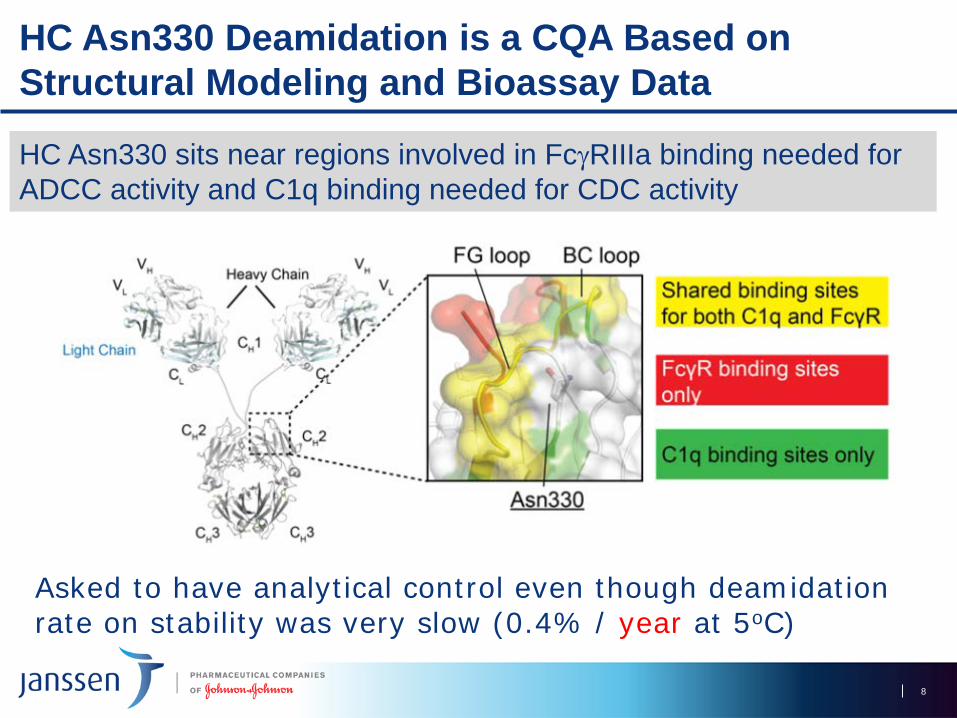
HC Asn330 Deamidation is a CQA Based on Structural Modeling and Bioassay Data
HC Asn330 sits near regions involved in FcγRIIIa binding needed for ADCC activity and C1q binding needed for CDC activity
Asked to have analytical control even though deamidation rate on stability was very slow (0.4% / year at 5oC)
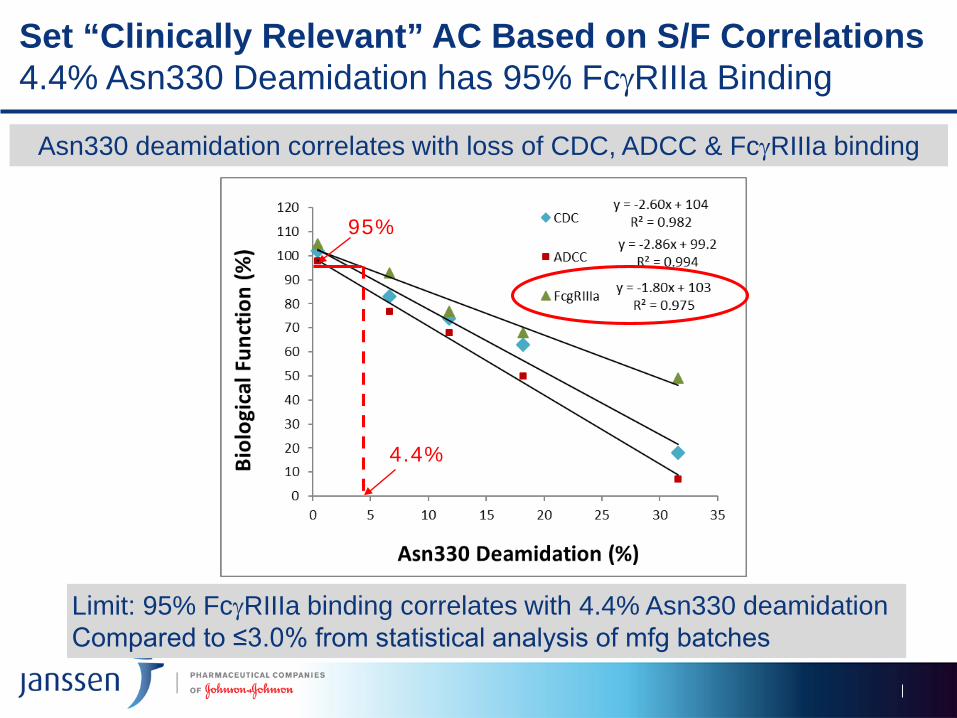
Asn330 deamidation correlates with loss of CDC, ADCC & FcγRIIIa binding
Limit: 95% FcγRIIIa binding correlates with 4.4% Asn330 deamidation Compared to ≤3.0% from statistical analysis of mfg batches
Set “Clinically Relevant” AC Based on S/F Correlations4.4% Asn330 Deamidation has 95% FcγRIIIa Binding
4.4%
95%
10
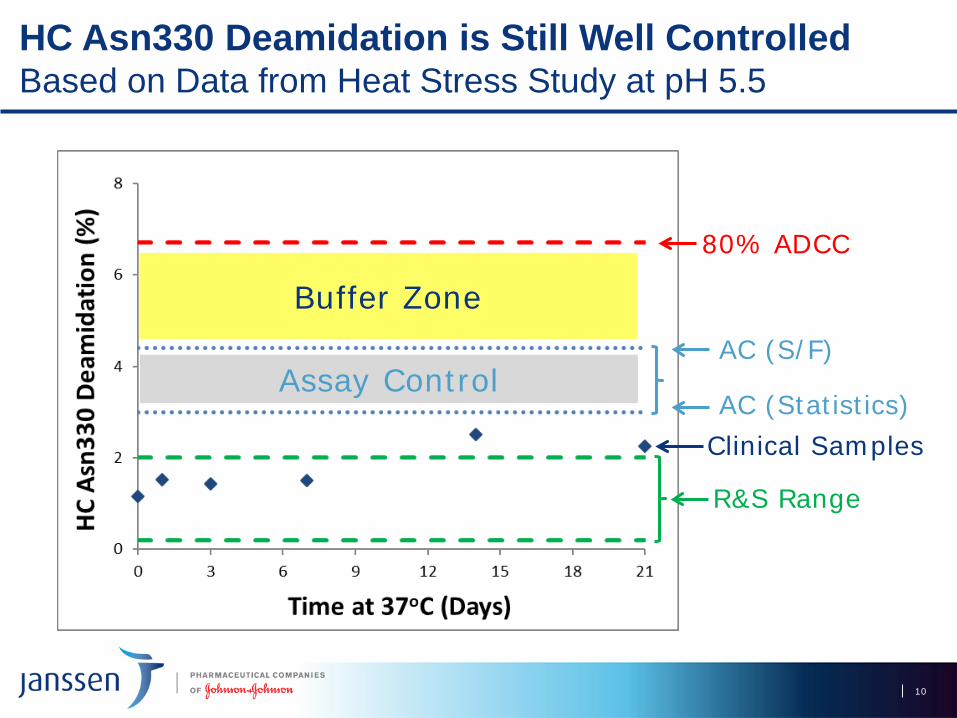
HC Asn330 Deamidation is Still Well ControlledBased on Data from Heat Stress Study at pH 5.5
80% ADCC
AC (S/F)
R&S Range
Clinical Samples
Buffer Zone
Assay ControlAC (Statistics)

11
Control of Asn330 Deamidation by cIEF Data from Heat Stress Study at pH 5.5
Asn330 Deamidation correlates with increase in acidic peaks by cIEF
Release / Stability Acceptance Criteria: 23-40% acidic peaksLimit: 40% Acidic Peaks correlates with 3.7% Asn330 deamidation
11
3.7%
40%
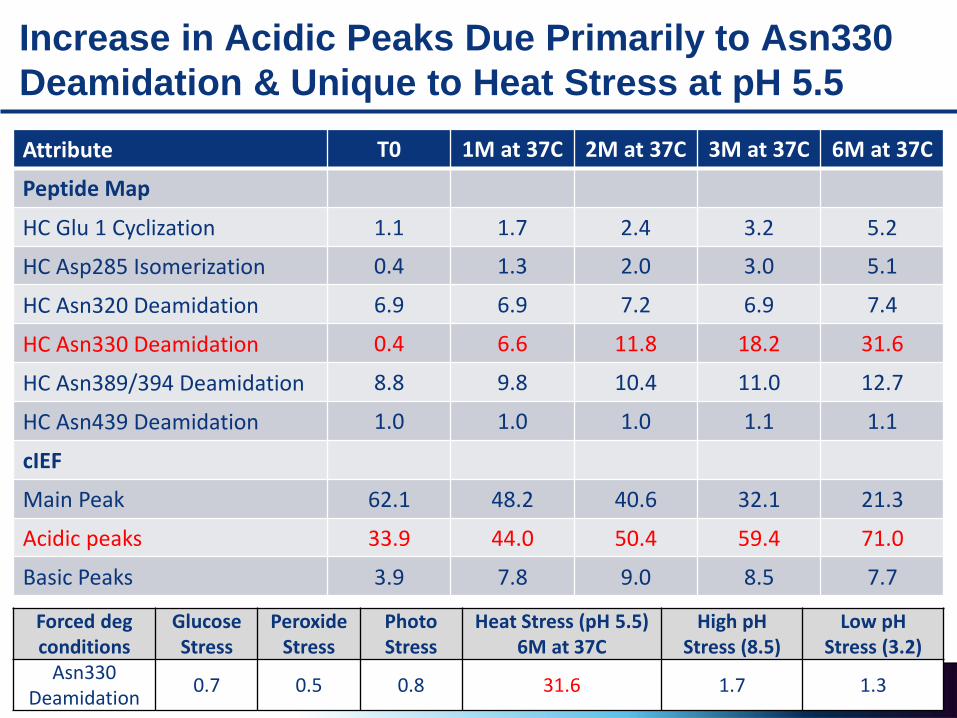
Increase in Acidic Peaks Due Primarily to Asn330 Deamidation & Unique to Heat Stress at pH 5.5Attribute T0 1M at 37C 2M at 37C 3M at 37C 6M at 37C
Peptide Map
HC Glu 1 Cyclization 1.1 1.7 2.4 3.2 5.2
HC Asp285 Isomerization 0.4 1.3 2.0 3.0 5.1
HC Asn320 Deamidation 6.9 6.9 7.2 6.9 7.4
HC Asn330 Deamidation 0.4 6.6 11.8 18.2 31.6
HC Asn389/394 Deamidation 8.8 9.8 10.4 11.0 12.7
HC Asn439 Deamidation 1.0 1.0 1.0 1.1 1.1
cIEF
Main Peak 62.1 48.2 40.6 32.1 21.3
Acidic peaks 33.9 44.0 50.4 59.4 71.0
Basic Peaks 3.9 7.8 9.0 8.5 7.7
Forced deg conditions
Glucose Stress
Peroxide Stress
Photo Stress
Heat Stress (pH 5.5)6M at 37C
High pHStress (8.5)
Low pHStress (3.2)
Asn330 Deamidation 0.7 0.5 0.8 31.6 1.7 1.3
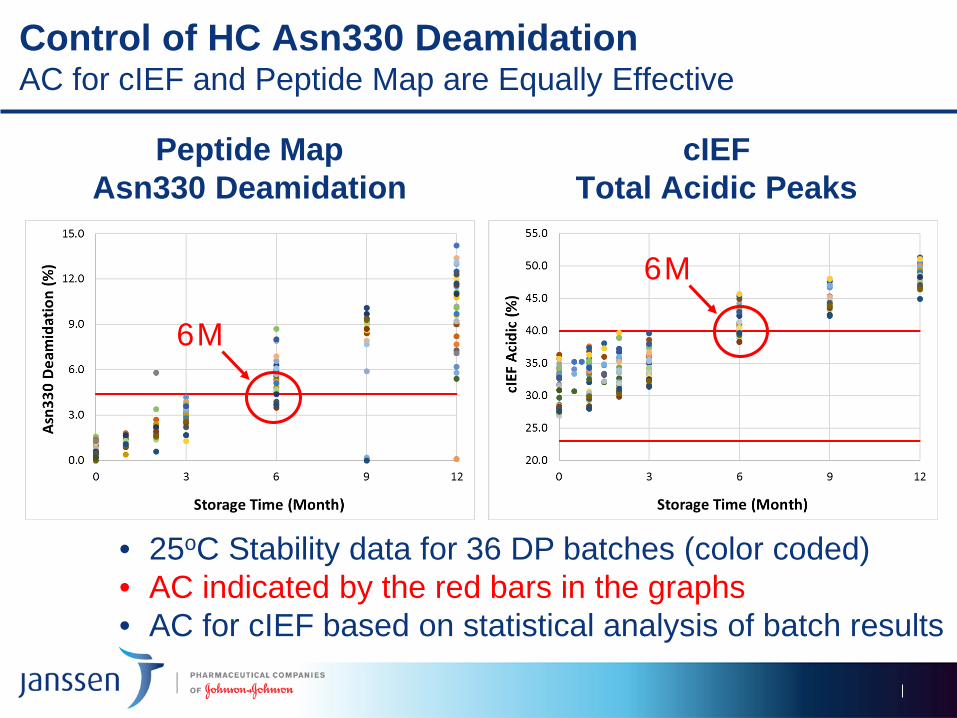
Control of HC Asn330 DeamidationAC for cIEF and Peptide Map are Equally Effective
Peptide MapAsn330 Deamidation
cIEFTotal Acidic Peaks
• 25oC Stability data for 36 DP batches (color coded)• AC indicated by the red bars in the graphs• AC for cIEF based on statistical analysis of batch results
6M
6M
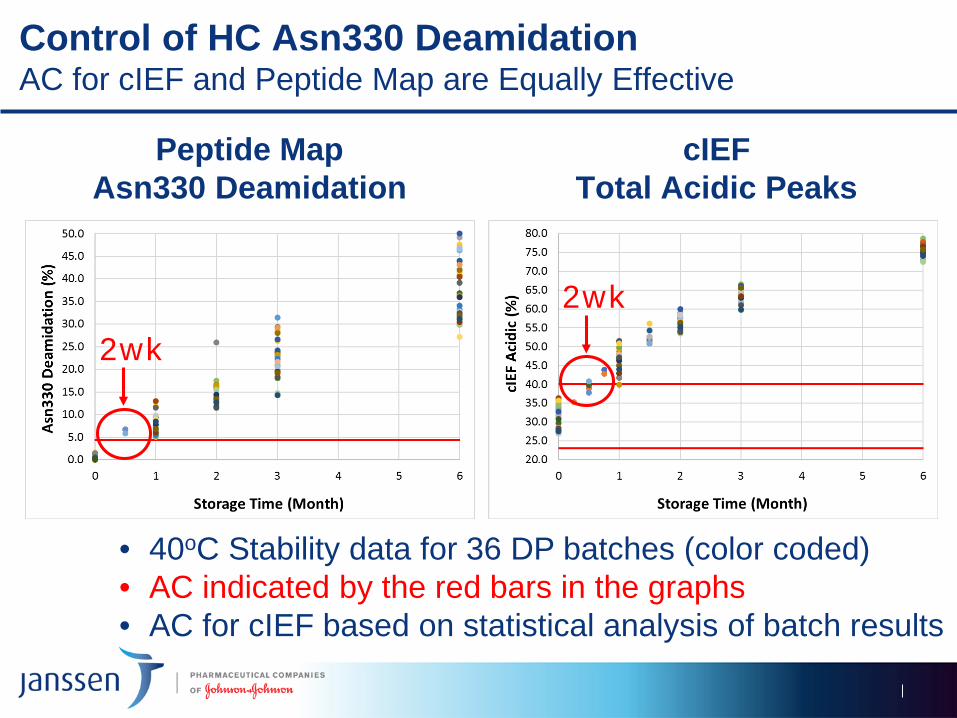
Control of HC Asn330 DeamidationAC for cIEF and Peptide Map are Equally Effective
Peptide MapAsn330 Deamidation
cIEFTotal Acidic Peaks
• 40oC Stability data for 36 DP batches (color coded)• AC indicated by the red bars in the graphs• AC for cIEF based on statistical analysis of batch results
2wk2wk
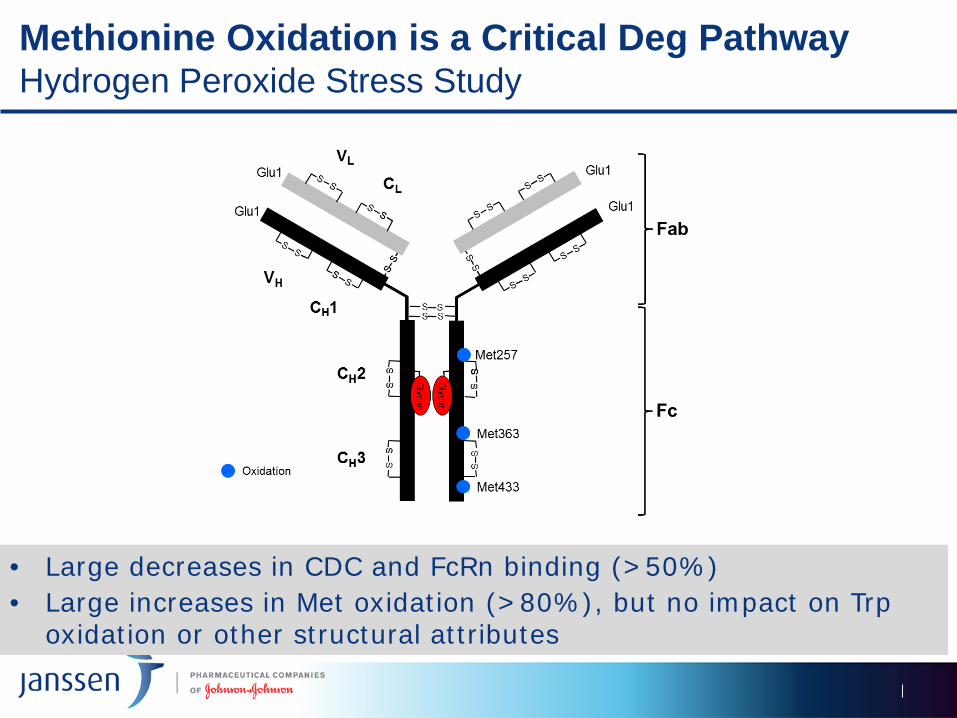
Methionine Oxidation is a Critical Deg Pathway Hydrogen Peroxide Stress Study
• Large decreases in CDC and FcRn binding (>50%)• Large increases in Met oxidation (>80%), but no impact on Trp
oxidation or other structural attributes
16
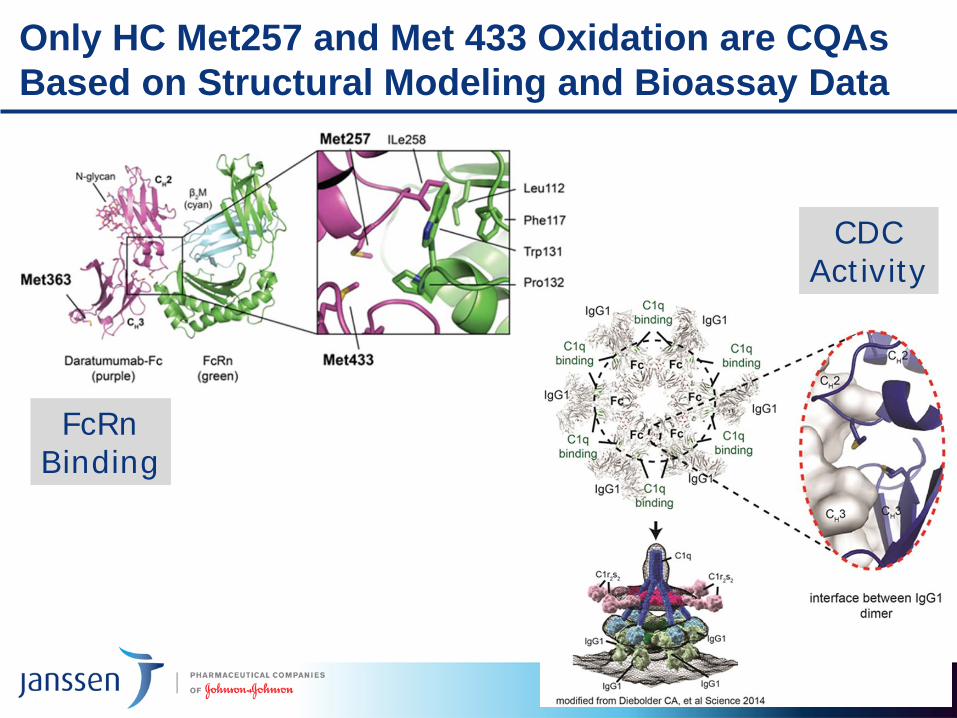
FcRnBinding
CDCActivity
Only HC Met257 and Met 433 Oxidation are CQAs Based on Structural Modeling and Bioassay Data

17
Met257 oxidation impacts FcRn binding and CDC activity
Limit: 95% CDC correlates with 8.0% Met257 oxidationCompared to ≤5.6% from statistical analysis of mfg batches
Set “Clinically Relevant” AC Based on S/F Correlations8.0% HC Met257 Oxidation has 95% CDC Activity
8.0%
95%
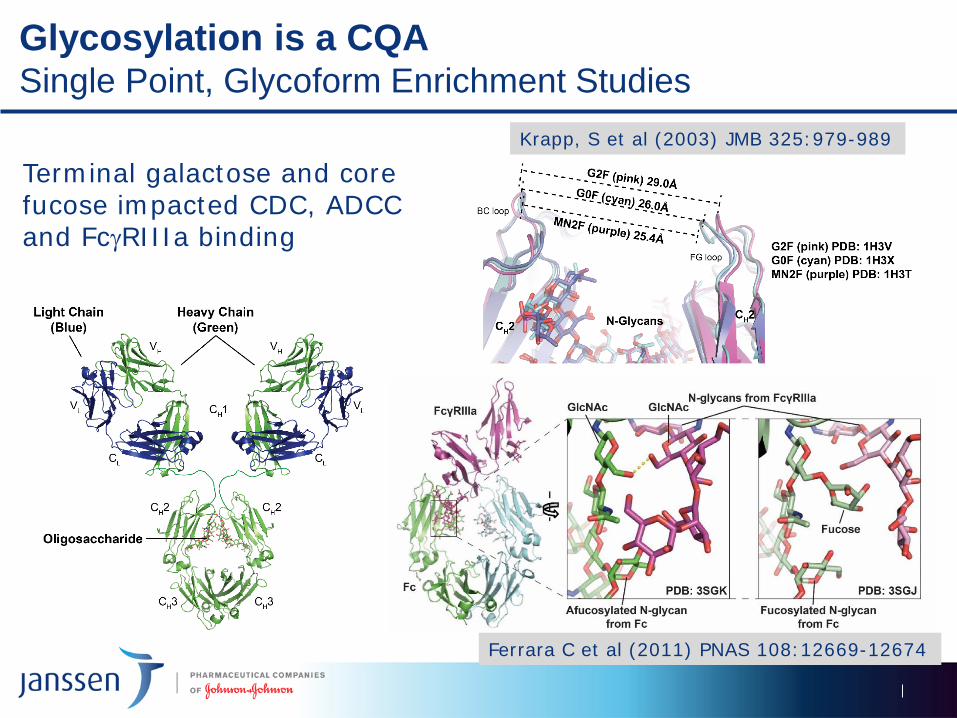
Glycosylation is a CQASingle Point, Glycoform Enrichment Studies
Ferrara C et al (2011) PNAS 108:12669-12674
Krapp, S et al (2003) JMB 325:979-989
Terminal galactose and core fucose impacted CDC, ADCC and FcγRIIIa binding

19
• Current AC for G1F is 15-27% based on statistical analysis ofclinical batches
• mAb with up to 50% G1F met the AC for ADCC and CDC activity
Set “Clinically Relevant” AC Based on S/F CorrelationsResults of G1F Spiking Study
Activity (%)Acceptance Criteria ADCC CDC
15-27% 93-103 89-102
15-32% 93-107 89-107
5% increase in G1F=4% increase in ADCC =5% increase in CDC
• Multi-point, forced degradation or glycoform enrichment studies provide a wealth of information
• Can clearly identify PTM CQAs (deamidation, oxidation and terminal galactose)
• Can set “clinically relevant” AC based on impact to function rather than statistical analysis of mfg batches
• Can develop robust analytical control strategies using acceptance criteria from multiple methods
20
SummaryAnalytical Control Strategy for PTM CQAs

THANKS!!
Analytical DevelopmentPing HuQingrong YanMaggie Huang and Mike TangShelly Ji, Amy Chiasson, Fanrong Kong Sui-Po Zhang, Chi So, Tam SodenIzabela Sokolowska, Jingjie MoMehul Patel, Don Neblock and Gulnur Elove