using the drawing and animation tools in powerpoint® to build
TRANSCRIPT
Using the Drawing and Animation Tools in PowerPoint®
to Build Your Own Visual Perception Demonstrations
Kenith V. Sobel
University of Central Arkansas
Author contact information:
Kenith V. Sobel Department of Psychology and Counseling University of Central Arkansas 201 Donaghey Ave. Mashburn Hall 260 Conway, AR 72035 Phone: 501-450-5440 E-mail: [email protected] Copyright 2010 by Kenith V. Sobel. All rights reserved. You may reproduce multiple copies of this material for your own personal use, including use in your classes and/or sharing with individual colleagues as long as the author’s name and institution and the Office of Teaching Resources in Psychology heading or other identifying information appear on the copied document. No other permission is implied or granted to print, copy, reproduce, or distribute additional copies of this material. Anyone who wishes to produce copies for purposes other than those specified above must obtain the permission of the author.
Perception Demonstrations in PowerPoint 2
Abstract
Although innumerable computer-based visual demonstrations are available to enhance the
teaching of perceptual concepts, quite often a demonstration that worked flawlessly on an office
computer will break down when ported to the classroom. In contrast, Microsoft’s presentation
graphics program PowerPoint® is a familiar and reliable tool for creating and presenting one’s
own color images and animated text and graphics. Here I describe the drawing and animation
tools in PowerPoint that may be unfamiliar even to the experienced user and how to use them to
make three well-known perceptual demonstrations. All three can profitably be used with
introductory as well as advanced students and even to illustrate general principles of how we see
the world. Creating the demonstrations described here can form the basis for making your own
collection.
Perception Demonstrations in PowerPoint 3
In recent years there has been a profusion of websites and CD-ROMs packed with visual
demonstrations appropriate for teaching perception to students in General Psychology as well as
upper-division courses. Visual demonstrations are nearly indispensable to convey abstract and
complex material to students, and animation has been found to be particularly effective at
promoting comprehension (Brown, Haynes, & Schmidt, 2008; ChanLin, 1998). However, it is a
common experience that visual demonstrations that worked well on an office computer will
break down in the classroom. Furthermore, for a professor who presents class material in
PowerPoint, having to exit PowerPoint in order to open another application such as a web
browser can interrupt the flow of lecture. Although many professors are adept at using
PowerPoint to present color images and animated text and graphics (Hardin, 2007; Leffingwell,
Thomas, & Elliott, 2007), they may be unfamiliar with the drawing and animation tools in
PowerPoint, or they may have never realized how useful these tools can be for creating
perceptual demonstrations. Here I show how to create your own visual demonstrations that can
be embedded within your pre-existing PowerPoint lecture slides.
The drawing and animation tools in PowerPoint are surprisingly powerful and flexible,
but can be intimidating. Below I step through the process of creating three displays that are well-
known to vision scientists: (a) simultaneous contrast [begins on p. 4], (b) the Kanizsa triangle
[begins on p. 10] , and (c) structure from motion [begins on p. 18]. In the various versions of
PowerPoint available for Windows and the Macintosh over the past 10 years, the particular steps
needed to access the drawing and animation tools have changed, but the tools themselves have
remained fairly stable. In the procedures below I describe how to access the tools in PowerPoint
2007 for Windows; different versions of PowerPoint require different menu commands or
keystrokes to access the tools, but the tools themselves work pretty much as described. I have

Perception Demonstrations in PowerPoint 4
arranged the three demonstrations so that the effort and knowledge required increase slightly
from one to the next, and some procedures that are described in detail for one demonstration are
not so meticulously described later.
Some Notes on Stylistic Conventions Used Here
• I use the same orthographic and naming conventions as in the PowerPoint help program,
in which names of items and button captions are written in boldface.
• An arrow symbol (→) to indicates that one command follows another, or is in a drop-
down menu or dialog box from a previous command.
• Both Windows and Mac keyboards have several command keys that typically have an
effect only when held down at the same time as another key. The most familiar example is
holding Shift while typing an alphanumeric key into a word processing program, which makes
the uppercase version of the alphanumeric character appear on the screen. Both Windows and
Mac keyboards have Ctrl, Alt, and Shift, and Macs also have Apple; to indicate that the Control
key should be held down as the g key is pressed, I write “Press Ctrl-g.”
• I use “Click” as shorthand for “Click the left button”; to specify clicking the right button I
write “Right click.” On Macs the mouse has just one button so there is no way to click the “right
button”; instead, holding down Ctrl and clicking the single button typically has the same effect
on a Mac as right-clicking in Windows.
Simultaneous Contrast
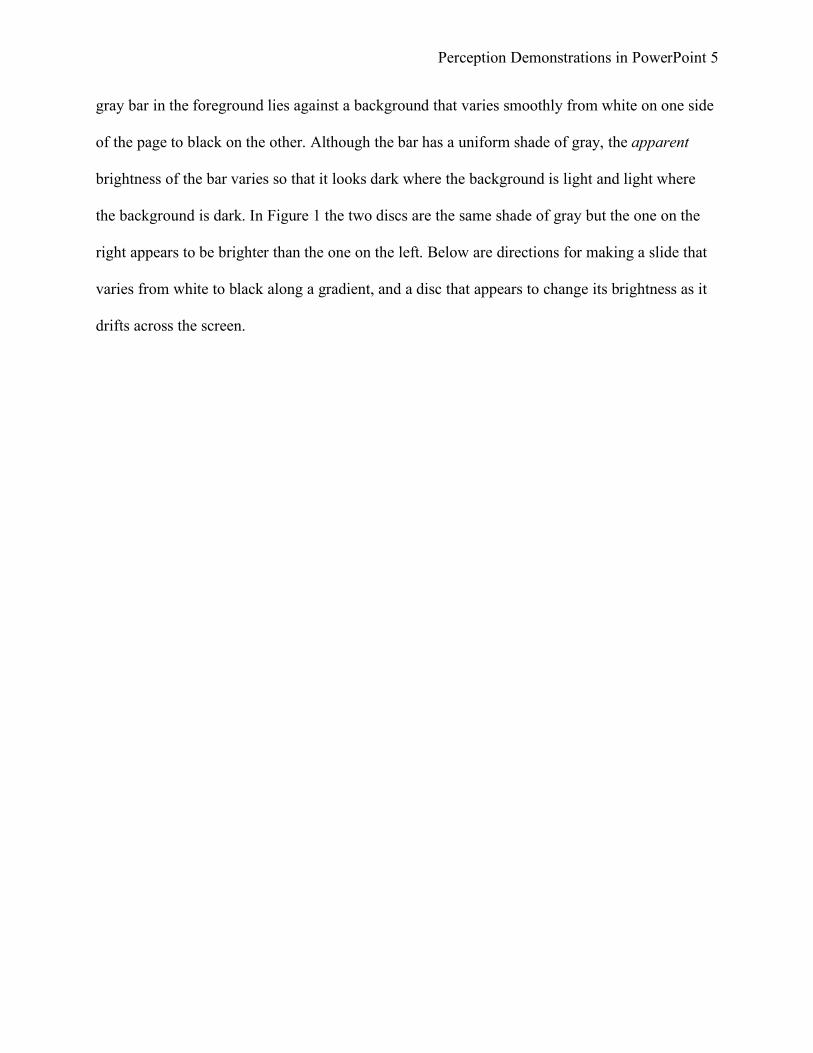
One recurring theme in perception is the fact that we do not perceive features such as
brightness in isolation, but only in contrast to the brightness at adjacent locations. In Seckel’s
(2002, p. 20) collection of optical illusions is a version of simultaneous contrast, in which a long
Perception Demonstrations in PowerPoint 5
gray bar in the foreground lies against a background that varies smoothly from white on one side
of the page to black on the other. Although the bar has a uniform shade of gray, the apparent
brightness of the bar varies so that it looks dark where the background is light and light where
the background is dark. In Figure 1 the two discs are the same shade of gray but the one on the
right appears to be brighter than the one on the left. Below are directions for making a slide that
varies from white to black along a gradient, and a disc that appears to change its brightness as it
drifts across the screen.

Perception Demonstrations in PowerPoint 6
Figure 1. Simultaneous contrast: The two gray discs are equally bright, but the one on the
right appears brighter than the one on the left.
Make a Blank Slide With a Gradient Background
When you open PowerPoint there should already be a slide ready for revision.
1. Click the Home tab
Notice that there is a toolbar with numerous tools arranged in groups; to draw your attention to a
portion of the toolbar I mention a group, then a tool in that group.
2. In the Slides group, click Layout → select the Blank slide.
Perception Demonstrations in PowerPoint 7
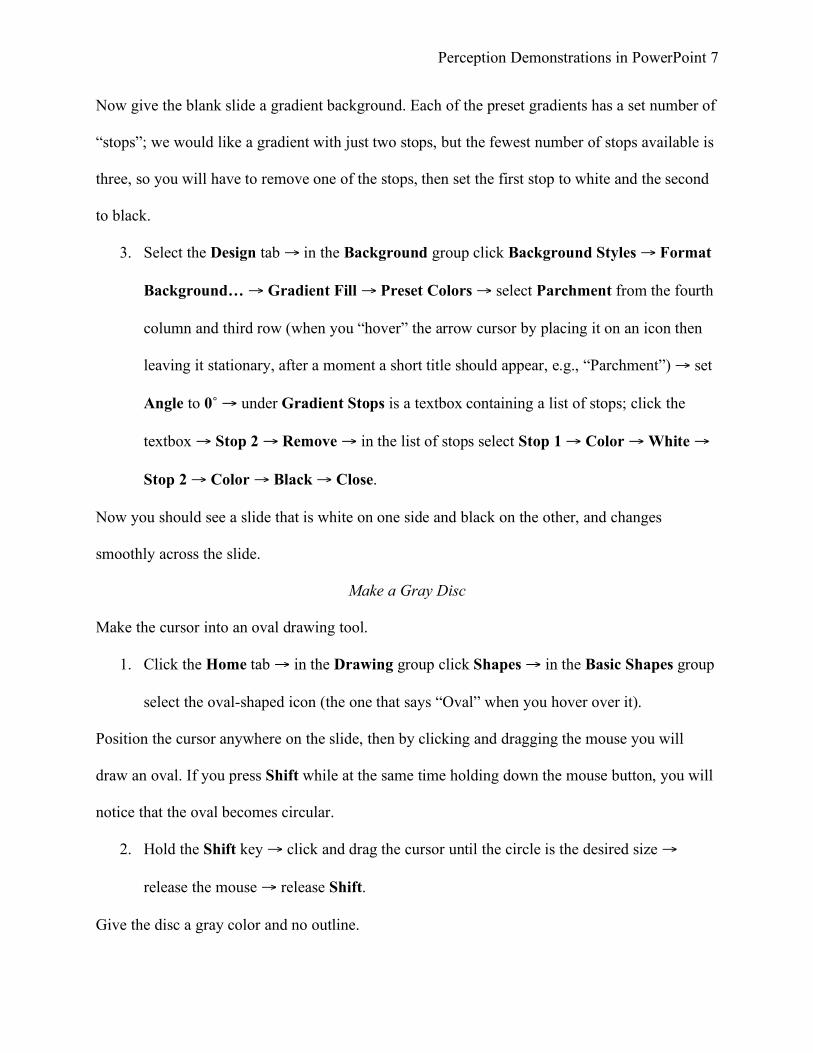
Now give the blank slide a gradient background. Each of the preset gradients has a set number of
“stops”; we would like a gradient with just two stops, but the fewest number of stops available is
three, so you will have to remove one of the stops, then set the first stop to white and the second
to black.
3. Select the Design tab → in the Background group click Background Styles → Format
Background… → Gradient Fill → Preset Colors → select Parchment from the fourth
column and third row (when you “hover” the arrow cursor by placing it on an icon then
leaving it stationary, after a moment a short title should appear, e.g., “Parchment”) → set
Angle to 0˚ → under Gradient Stops is a textbox containing a list of stops; click the
textbox → Stop 2 → Remove → in the list of stops select Stop 1 → Color → White →
Stop 2 → Color → Black → Close.
Now you should see a slide that is white on one side and black on the other, and changes
smoothly across the slide.
Make a Gray Disc
Make the cursor into an oval drawing tool.
1. Click the Home tab → in the Drawing group click Shapes → in the Basic Shapes group
select the oval-shaped icon (the one that says “Oval” when you hover over it).
Position the cursor anywhere on the slide, then by clicking and dragging the mouse you will
draw an oval. If you press Shift while at the same time holding down the mouse button, you will
notice that the oval becomes circular.
2. Hold the Shift key → click and drag the cursor until the circle is the desired size →
release the mouse → release Shift.
Give the disc a gray color and no outline.
Perception Demonstrations in PowerPoint 8
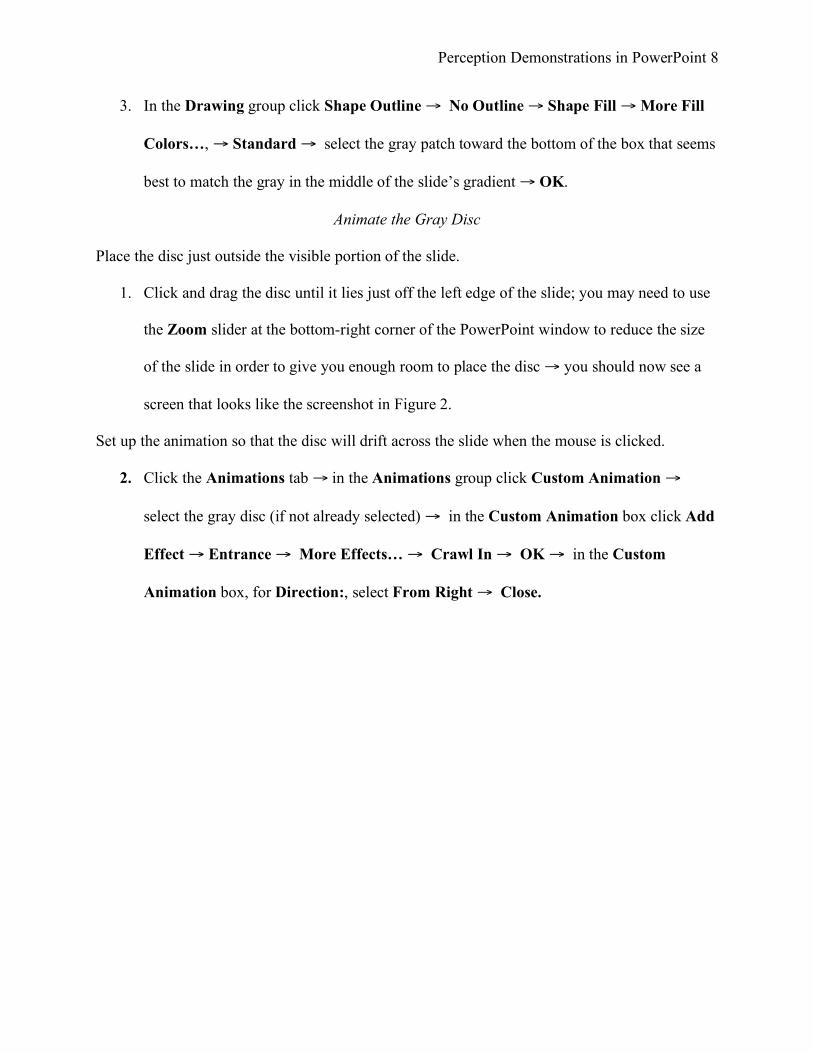
3. In the Drawing group click Shape Outline → No Outline → Shape Fill → More Fill
Colors…, → Standard → select the gray patch toward the bottom of the box that seems
best to match the gray in the middle of the slide’s gradient → OK.
Animate the Gray Disc
Place the disc just outside the visible portion of the slide.
1. Click and drag the disc until it lies just off the left edge of the slide; you may need to use
the Zoom slider at the bottom-right corner of the PowerPoint window to reduce the size
of the slide in order to give you enough room to place the disc → you should now see a
screen that looks like the screenshot in Figure 2.
Set up the animation so that the disc will drift across the slide when the mouse is clicked.
2. Click the Animations tab → in the Animations group click Custom Animation →
select the gray disc (if not already selected) → in the Custom Animation box click Add
Effect → Entrance → More Effects… → Crawl In → OK → in the Custom
Animation box, for Direction:, select From Right → Close.
Perception Demonstrations in PowerPoint 9
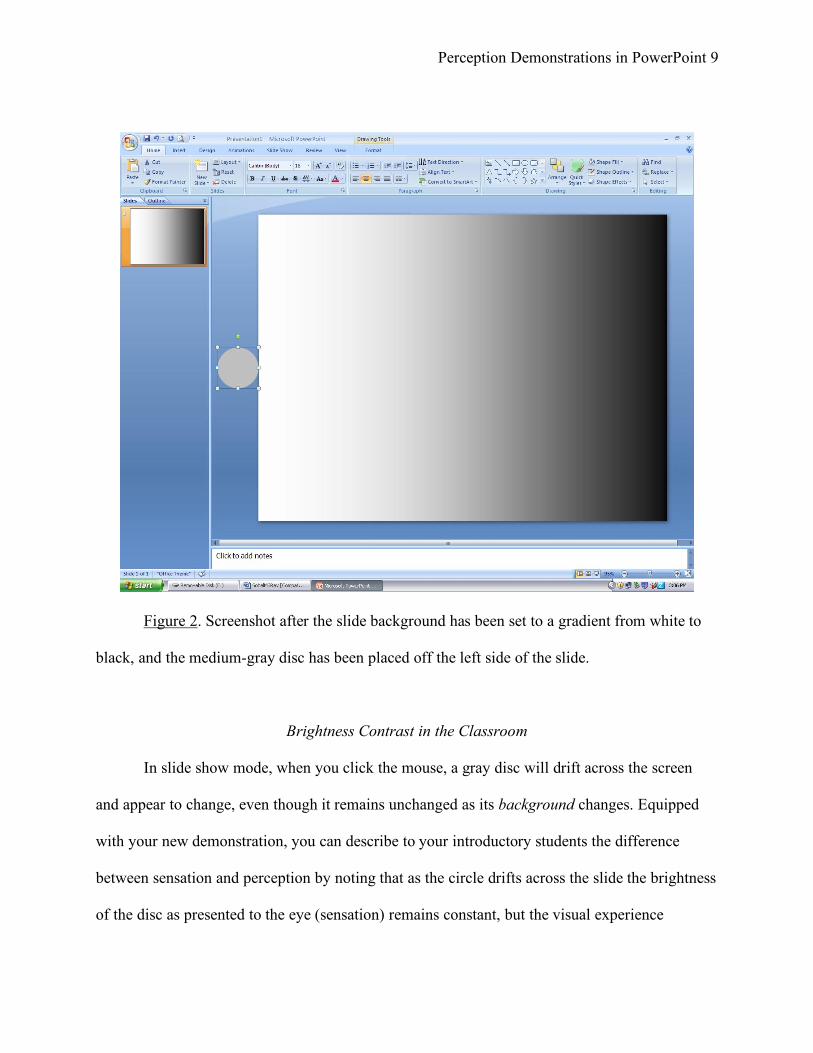
Figure 2. Screenshot after the slide background has been set to a gradient from white to
black, and the medium-gray disc has been placed off the left side of the slide.
Brightness Contrast in the Classroom
In slide show mode, when you click the mouse, a gray disc will drift across the screen
and appear to change, even though it remains unchanged as its background changes. Equipped
with your new demonstration, you can describe to your introductory students the difference
between sensation and perception by noting that as the circle drifts across the slide the brightness
of the disc as presented to the eye (sensation) remains constant, but the visual experience

Perception Demonstrations in PowerPoint 10
(perception) changes continuously. Advanced students can benefit from seeing how center-
surround organization in retinal ganglion cells underlies the experience of brightness contrast.
More generally, the fact that appearance varies with context explains why we prefer pictures of
ourselves in which we are surrounded by large friends rather than skinny friends; size, like
brightness is perceived in context, so we feel as if we look skinnier when surrounded by large
friends.
Kanizsa Triangle
Gaetano Kanizsa was a gifted artist and vision scientist who created dozens of drawings
(see Kanizsa, 1979) that illustrate key principles of Gestalt psychology, including the well-
known triangle that bears his name, depicted on the left in Figure 3. Because the three sectored
circles in Kanizsa figures such as Figure 3 resemble the Pacman character in the eponymous
videogame, “pacman” is typically used as a shorthand for the less descriptive and more
cumbersome “sectored circle.” While researching Kanizsa figures (Sobel & Blake, 2003) I
noticed that they appear completely differently when the pacmen are rotated from their canonical
orientation, and as a result I was inspired to create the display on the right in Figure 3. Below I
show how to create the two figures so that you will be able to toggle instantly from one to the
other, alternately creating then destroying the experience of a good Gestalt with the push of a
button.
Perception Demonstrations in PowerPoint 11
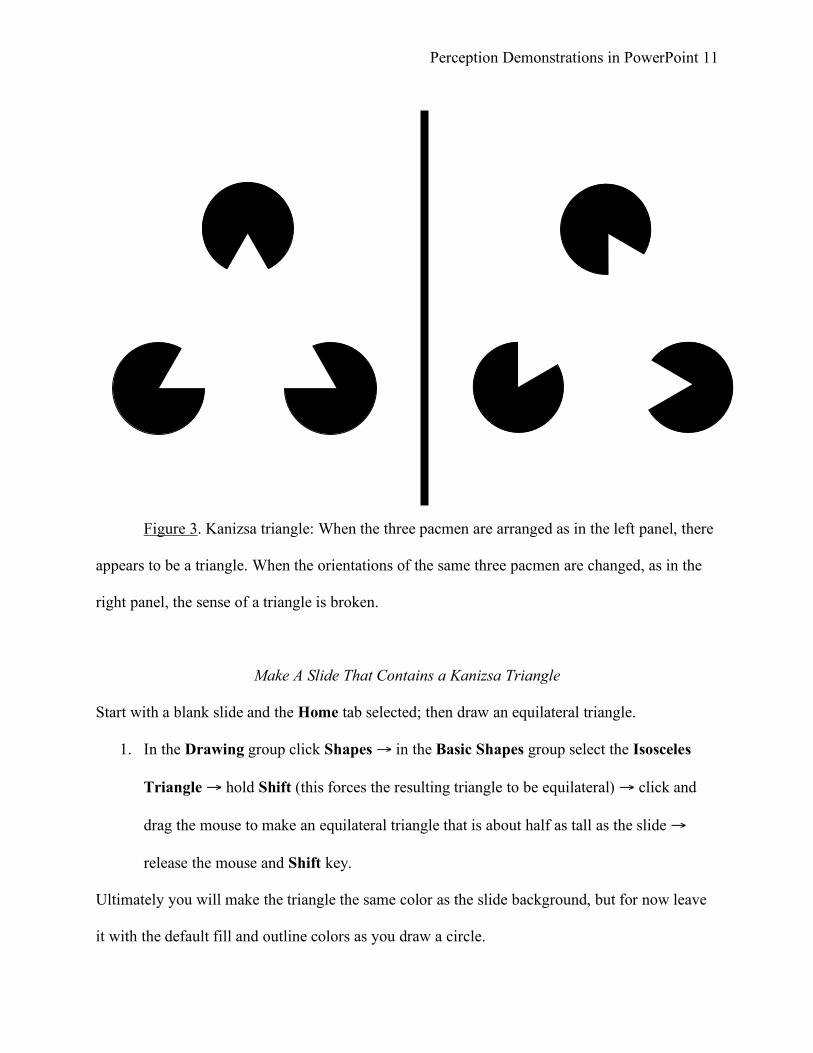
Figure 3. Kanizsa triangle: When the three pacmen are arranged as in the left panel, there
appears to be a triangle. When the orientations of the same three pacmen are changed, as in the
right panel, the sense of a triangle is broken.
Make A Slide That Contains a Kanizsa Triangle
Start with a blank slide and the Home tab selected; then draw an equilateral triangle.
1. In the Drawing group click Shapes → in the Basic Shapes group select the Isosceles
Triangle → hold Shift (this forces the resulting triangle to be equilateral) → click and
drag the mouse to make an equilateral triangle that is about half as tall as the slide →
release the mouse and Shift key.
Ultimately you will make the triangle the same color as the slide background, but for now leave
it with the default fill and outline colors as you draw a circle.
Perception Demonstrations in PowerPoint 12
2. In the Drawing group click Shapes → in the Basic Shapes group select Oval → hold the
Shift key → click and drag the mouse to make an circle that is about a third as tall as the
triangle → release the mouse and Shift key → select fill and outline colors for the circle
that suit your tastes (I used black in Figure 3) → click and drag the circle so that its
center coincides with one of the triangle’s vertices.
You may notice that as you drag the circle around it moves a little jerkily and that you may not
be able to place the circle exactly where you would like; the shape “snaps” to an invisible grid.
Holding down the Alt key in Windows or the Apple key on a Macintosh as you drag the shape
around will allow you to position the circle exactly where you would like it. When you are
satisfied with the placement of the circle, make and arrange two duplicate circles.
3. Select the circle (if not already selected) → typing Ctrl-d in Windows or Apple-d on a
Mac makes a duplicate circle → click and drag the newly created duplicate circle until its
center coincides with a second of the triangle’s vertices → make another duplicate circle
and move it into position at the third vertex.
You may notice that the circles appear as if they are closer to you than the triangle because they
“hide” the triangle from your view, but for the Kanizsa triangle you need the triangle to be in
front.
4. Right click the triangle (Ctrl-click on a Mac) → in the menu that appears, select Bring to
Front in Windows → on a Mac, select Arrange then Bring to Front.
Finally, make the fill and outline of the triangle the same color as the slide background so that
the triangle is invisible. You have created your own Kanizsa triangle.
Make a Slide in Which the Gestalt is Ruined
Duplicate the slide you made that contains the Kanizsa triangle.
Perception Demonstrations in PowerPoint 13
1. In the pane that contains the Outline and Slides tabs, select Slides → select the slide
containing the Kanizsa triangle → in the Slides group, select New Slide → Duplicate
Selected Slides.
The remainder of work for the Kanizsa triangle takes place in the newly created duplicate slide.
Make a duplicate of the bottom-right circle and place it to coincide with the original bottom-right
circle as a placeholder.
2. Select the bottom-right circle → Ctrl-d in Windows or Apple-d on a Mac → drag the
duplicate circle to the same location as the original bottom-right circle → right click the
duplicate circle and send it to the back.
Make the triangle smaller so that it still occludes a wedge in the original bottom-right circle but
does not occlude either of the other two circles.
3. Place the cursor on the tiny shape to the upper left hand corner of the triangle’s frame as
seen in Figure 4 → press and hold Shift to keep the triangle an equilateral → drag the
cursor towards the bottom-right circle until the edge of the triangle lies just outside the
bottom-right circle → release the mouse and Shift key.
Perception Demonstrations in PowerPoint 14
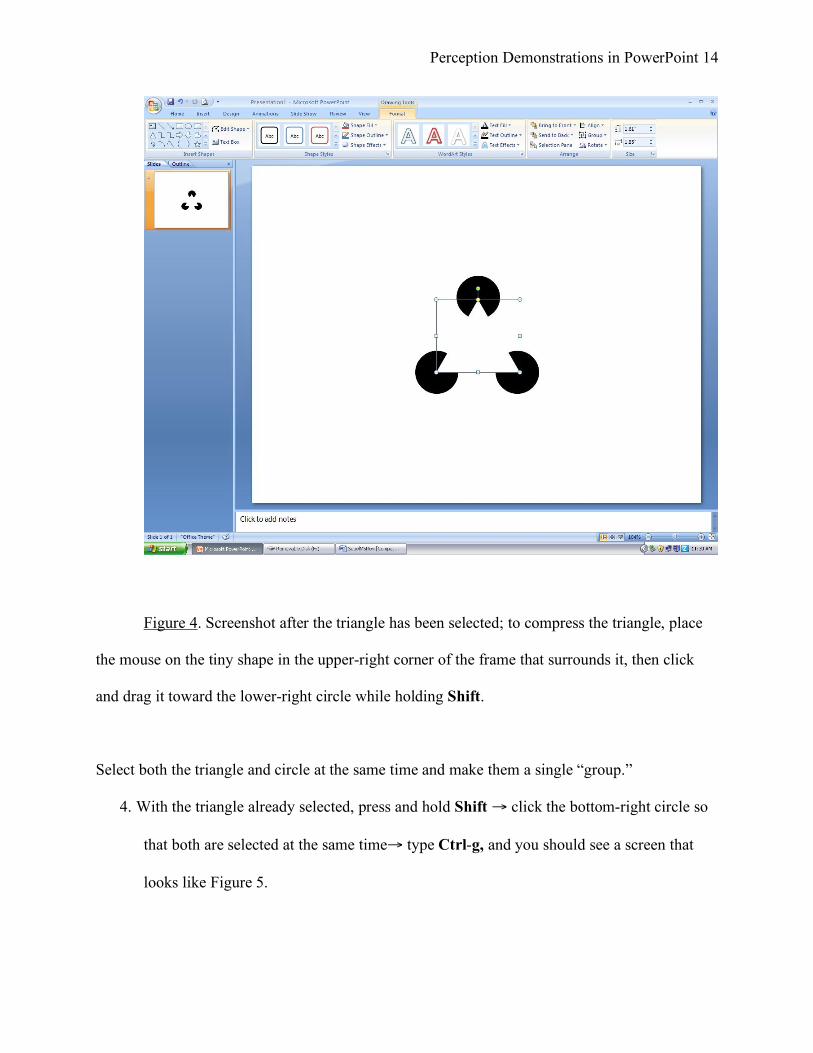
Figure 4. Screenshot after the triangle has been selected; to compress the triangle, place
the mouse on the tiny shape in the upper-right corner of the frame that surrounds it, then click
and drag it toward the lower-right circle while holding Shift.
Select both the triangle and circle at the same time and make them a single “group.”
4. With the triangle already selected, press and hold Shift → click the bottom-right circle so
that both are selected at the same time→ type Ctrl-g, and you should see a screen that
looks like Figure 5.
Perception Demonstrations in PowerPoint 15
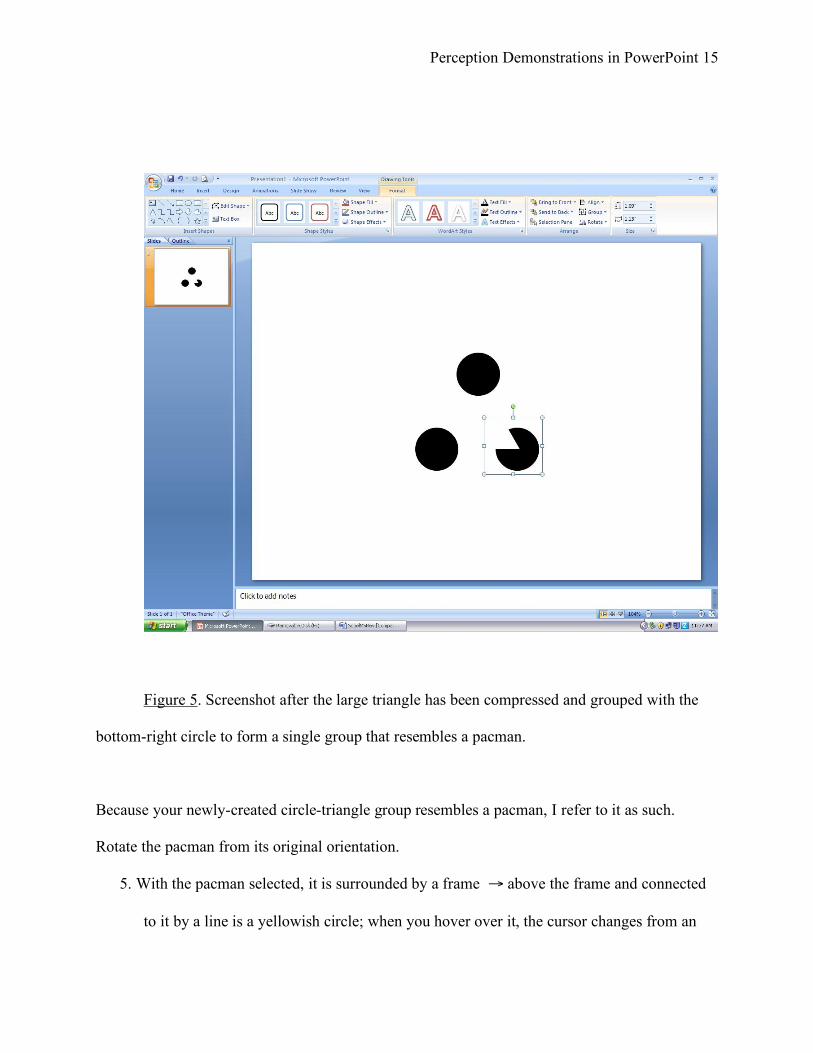
Figure 5. Screenshot after the large triangle has been compressed and grouped with the
bottom-right circle to form a single group that resembles a pacman.
Because your newly-created circle-triangle group resembles a pacman, I refer to it as such.
Rotate the pacman from its original orientation.
5. With the pacman selected, it is surrounded by a frame → above the frame and connected
to it by a line is a yellowish circle; when you hover over it, the cursor changes from an
Perception Demonstrations in PowerPoint 16
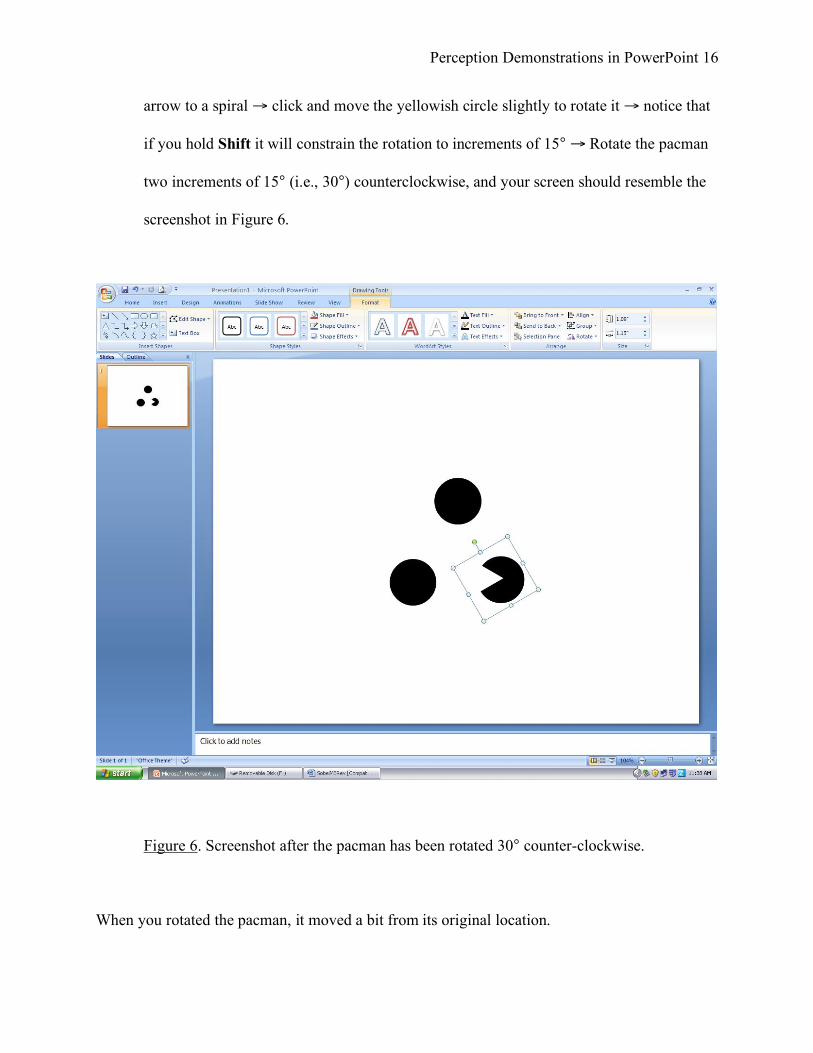
arrow to a spiral → click and move the yellowish circle slightly to rotate it → notice that
if you hold Shift it will constrain the rotation to increments of 15° → Rotate the pacman
two increments of 15° (i.e., 30°) counterclockwise, and your screen should resemble the
screenshot in Figure 6.
Figure 6. Screenshot after the pacman has been rotated 30° counter-clockwise.
When you rotated the pacman, it moved a bit from its original location.
Perception Demonstrations in PowerPoint 17
6. Move the pacman so that it lies directly on top of the placeholder circle that you made in
Step 2 (remember to use the Alt or Apple key to make fine adjustments to the pacman’s
position).
7. Duplicate the pacman, then rotate it eight increments of 15° (i.e., 120°) clockwise and
position it on the bottom-left circle, then make another duplicate and rotate it 120°
clockwise, and position it on the top circle.
Gestalt in the Classroom
The central theme of Gestalt might be paraphrased to say that when sensations are
arranged just right, the resulting experience is more than the sum of the parts. These two slides
clearly and immediately convey the essence of Gestalt to an introductory audience: Both slides
contain the same objects (three pacmen), but in just one of the slides the pacmen are arranged
just right so that an apparent triangle is visible as well; because of the good Gestalt, there appears
to be more than the sum of the parts. For more advanced students you might mention
neurophysiological studies (such as von der Heydt & Perterhans, 1989) showing that cells early
in visual processing respond to illusory contours such as the three edges of the triangle; we all
feel as if we can see a triangle because cells in our early visual processing are saying “I can see
it!”
Perception Demonstrations in PowerPoint 18
Structure From Motion
One of Gibson’s (1979) many provocative claims about vision is that we do not see by
staring fixedly at objects from a single perspective. Instead we actively investigate objects,
turning them over in our hands to look at them from every possible angle. Perhaps one reason we
feel compelled to actively investigate unfamiliar objects is that motion can impart a potent sense
of three-dimensional structure to an object that might have appeared flat if seen from a single
perspective (Wallach & O’Connell, 1953). The artist Marcel Duchamp experimented with
animated displays that created a sense of three-dimensional structure (Tomkins, 1996), much like
the shape in Figure 7. Although flat, when rotated it appears to have a clear three-dimensional
shape, as if you were looking down on the hollow cone of a volcano.
Perception Demonstrations in PowerPoint 19
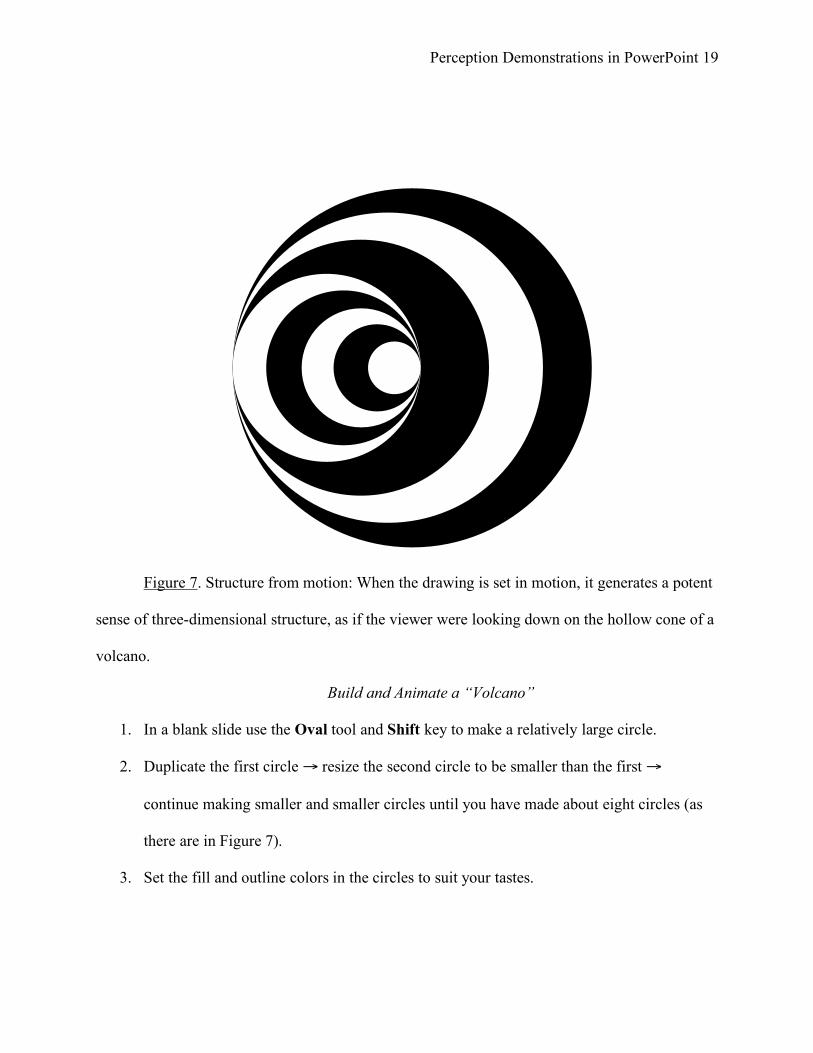
Figure 7. Structure from motion: When the drawing is set in motion, it generates a potent
sense of three-dimensional structure, as if the viewer were looking down on the hollow cone of a
volcano.
Build and Animate a “Volcano”
1. In a blank slide use the Oval tool and Shift key to make a relatively large circle.
2. Duplicate the first circle → resize the second circle to be smaller than the first →
continue making smaller and smaller circles until you have made about eight circles (as
there are in Figure 7).
3. Set the fill and outline colors in the circles to suit your tastes.
Perception Demonstrations in PowerPoint 20
4. Select every circle in the slide by typing Ctrl-a (in Windows) or Apple-a (in Mac OS),
which is shorthand for “select all.”
5. Under Drawing tools, select the Format tab → in the Arrange group click Align →
Align Middle → Align → Align Left.
6. Deselect all the circles by hitting Esc → shift-click to reselect the five smallest circles
→ align their right sides, after which your drawing should resemble Figure 7.
7. Select all the circles (Ctrl-a) and group them (Ctrl-g) into a single object that when
rotated will resemble the hollow cone of a volcano as seen from above.
8. Click the Animations tab → in the Animations group click Custom Animation →
select the volcano (if not already selected) → Add Effect → Emphasis → Spin → next
to the newly created animation event is a down-pointing arrow; click it → Timing… →
for Repeat:, select Until End of Slide → OK.
Structure-From-Motion in the Classroom
Structure-from-motion displays indicate why a friend who has just bought a new truck
insists that you walk up to it and inspect it from every angle, and will not be satisfied if you
glance at it from one perspective. With just one perspective, you cannot get a sense of the truck’s
three-dimensional shape as you could from active exploration, using vision in concert with
motion.
Conclusions
Constructing the three displays described here gives you experience using many of the
tools and keystrokes that are essential to building your own collection of visual demonstrations.
Any displays that you create in PowerPoint will be reliable, as opposed to anything created by
someone else that seems to break at inopportune moments. Besides reliability, other benefits of
Perception Demonstrations in PowerPoint 21
building your own demonstrations include pride of accomplishment, the opportunity to indulge
your creative impulse, and having access to custom-built demonstrations that suit your particular
style of teaching. Most of all, students often appreciate the efforts invested by professors who
have created their own classroom demonstrations. Now when you see a cool illusion or
demonstration, ask yourself, “How can I make a PowerPoint version of that?”
Perception Demonstrations in PowerPoint 22
References
Brown, S. W., Haynes, J. A., & Schmidt, K. E. (2008, April). A comparison of animated versus
static tutorials on student learning. Poster presented at the annual meeting of the
Southwestern Psychological Association, St. Louis, MO.
ChanLin, L.-J. (1998). Animation to teach students of different knowledge levels. Journal of
Instructional Psychology, 25, 166-175.
Gibson, J.J. (1979). The ecological approach to visual perception. Boston: Houghton Mifflin.
Hardin, E. E. (2007). Presentation software in the college classroom: Don’t forget the instructor.
Teaching of Psychology, 34, 53-57.
Kanizsa, G. (1979). Organization in vision. New York: Praeger.
Leffingwell, T. R., Thomas, D. G., & Elliott, W. H. (2007). Microsoft Producer: A software tool
for creating multimedia PowerPoint presentations. Teaching of Psychology, 34, 57-63.
Seckel, A. (2002). More optical illusions. Dubai: Carlton.
Sobel, K. V., & Blake, R. (2003). Subjective contours and binocular rivalry suppression. Vision
Research, 43, 1533-1540.
Tomkins, C. (1996) Duchamp – A biography. New York: Holt.
von der Heydt, R., & Perterhans, E. (1989). Mechanisms of contour perception in monkey visual
cortex. I. Lines of pattern discontinuity. Journal of Neuroscience, 9, 1731-1748.
Wallach, H., & O’Connell, D. N. (1953). The kinetic depth effect. Journal of Experimental
Psychology, 45, 205-217.

Perception Demonstrations in PowerPoint 23
Author’s Note
I am grateful to Elson Bihm and Art Gillaspy for comments on a previous version of this
manuscript.