usingwhole-genomesequence informationtofosterconservation ... · et al., 2006; soland-reckeweg et...
TRANSCRIPT
ORIGINAL RESEARCHpublished: 21 December 2016doi: 10.3389/fevo.2016.00140
Frontiers in Ecology and Evolution | www.frontiersin.org 1 December 2016 | Volume 4 | Article 140
Edited by:
Alberto Orgiazzi,
European Commission-Joint
Research Centre, Italy
Reviewed by:
Atanas Ivanov Atanassov,
Joint Genomic Center, Bulgaria
Fernando José Cebola Lidon,
Faculdade de Ciências e Tecnologia
da Universidade Nova de Lisboa,
Portugal
*Correspondence:
Melanie Parejo
Markus Neuditschko
markus.neuditschko@
agroscope.admin.ch
Specialty section:
This article was submitted to
Agroecology and Land Use Systems,
a section of the journal
Frontiers in Ecology and Evolution
Received: 30 September 2016
Accepted: 05 December 2016
Published: 21 December 2016
Citation:
Parejo M, Wragg D, Gauthier L,
Vignal A, Neumann P and
Neuditschko M (2016) Using
Whole-Genome Sequence Information
to Foster Conservation Efforts for the
European Dark Honey Bee, Apis
mellifera mellifera.
Front. Ecol. Evol. 4:140.
doi: 10.3389/fevo.2016.00140
Using Whole-Genome SequenceInformation to Foster ConservationEfforts for the European Dark HoneyBee, Apis mellifera mellifera
Melanie Parejo 1, 2*, David Wragg 3, 4, Laurent Gauthier 1, Alain Vignal 3, Peter Neumann 1, 2, 5
and Markus Neuditschko 1*
1 Swiss Bee Research Center, Agroscope, Bern, Switzerland, 2 Vetsuisse Faculty, Institute of Bee Health, University of Bern,
Bern, Switzerland, 3GenPhySE, INRA, INPT, INP-ENVT, Université de Toulouse, Castanet Tolosan, France, 4 The Roslin
Institute and Royal (Dick) School of Veterinary Studies, University of Edinburgh, Edinburgh, UK, 5 Bee Protection Laboratory,
Department of Biology, Faculty of Science, Chiang Mai University, Chiang Mai, Thailand
Pollination is a key ecosystem service for agricultural systems and Western honey
bees, Apis mellifera, are the most important managed pollinators. Major losses of
managed honey bee colonies reinforced the need to take advantage of locally adapted
subspecies and ecotypes to buffer populations against various stressors. However,
introductions of non-native honey bees from distant lineages are likely to undermine
respective conservation efforts unless reliable and cost effective tools can be used to
identify hybridization. The purpose of this study is to characterize current population
structure and genetic diversity, and to assess the degree of admixture between
native and introduced honey bees. Moreover, we aim to select a reduced number of
genetic markers to improve conservation management strategies. We take advantage
of recent developments in next-generation sequencing and network-based clustering to
investigate conservation efforts for the native European Dark honey bee, A. m. mellifera,
which is threatened by introgression in most of its range. We collected whole-genome
sequence information from haploid drones of A. m. mellifera, A. m. carnica, and
Buckfast sampled throughout Switzerland (N = 81), as well as from four Swiss
A. m. mellifera conservation areas (N = 39) and from one conservatory in the French
Alps (N = 31). Population structure analyses based upon 3.375 M genome-wide
SNPs discerned samples by subspecies and geographic origin (Switzerland or France).
Ancestry inference indicated admixed individuals in all of the protected areas, calling
for improved management efforts. After testing different subsets of ancestry informative
SNPs using three different selection strategies (FST , PCA-based or at random), as few
as 50 SNPs are found to be sufficient to differentiate native from introduced honey
bees. Therefore, our data suggests that a low-density SNP panel can be a precise and
cost-effective tool to support conservation management efforts for managed pollinators.
Keywords: Apis mellifera mellifera, honey bee, conservation genomics, whole-genome sequencing, network
clustering, admixture, ancestry informative SNPs
Parejo et al. Honey Bee Conservation Genomics
INTRODUCTION
Pollination is a key ecosystem service for agricultural systems(Klein et al., 2007) with the current annual market value ofpollinator-dependent crops estimated to USD $235–$577 billion(IPBES, 2016). Global pollinator declines can have severe impactson crop production and food security and calls for conservationof wild and managed pollinators (Potts et al., 2010; IPBES,2016). The Western honey bee, Apis mellifera, is the mosteconomically valuable pollinator (Klein et al., 2007; Gallai et al.,2009). Major losses of managed honey bee colonies across theNorthern Hemisphere reinforced the need to take advantage oflocally adapted subspecies and ecotypes to buffer populationsagainst various stressors (Neumann and Carreck, 2010). Theprotection of honey bee biodiversity is therefore an imperative(De La Rúa et al., 2009), since current genetic diversity harborsthe evolutionary potential of a species to adapt by naturalselection in the future (Frankham et al., 2002; Allendorf et al.,2013). Once genetic variants are lost, they cannot be recoveredand thus local adaptations to specific environments deserveconservation. In the case of the Western honey bee more than27 subspecies have been reported, characterized by differences inmorphology, physiology and behavior (Ruttner, 1988; Hepburnand Radloff, 1998; Sheppard and Meixner, 2003; Meixner et al.,2013; Chen et al., 2016, amongst others). These subspecies can bedifferentiated into four main evolutionary lineages: M (Westernand Northern Europe), C (Eastern Europe), O (Near East andCentral Asia), and A (Africa) (Ruttner, 1988; Garnery et al.,1992; Franck et al., 2000b; Whitfield et al., 2006; Han et al.,2012), whose geographic distribution encompasses a diversity ofenvironmental conditions. The introduction of exotic subspeciesfrom distant evolutionary lineages, typically by commercialbeekeepers, poses a risk on the genetic integrity of locally adaptedecotypes (De La Rúa et al., 2009; Meixner et al., 2010; Pintoet al., 2014). It is thus essential to conserve the underlying geneticdiversity, which may contribute to the long-term sustainability ofpopulations (Vanengelsdorp and Meixner, 2010).
In Northern and Central Europe, the native dark honey bee,A. m. mellifera, has been widely replaced for beekeeping bysubspecies mainly from the C-lineage such as A. m. carnicaand A. m. ligustica (Ruttner, 1988; Moritz, 1991; Kauhausen-Keller and Keller, 1994; Jensen et al., 2005a), which have beenmore intensively managed for production and display morelikely traits desired by beekeepers, such as high honey yield anddocility (Bouga et al., 2011). The large mating distances of dronesand queens (Ruttner and Ruttner, 1972; Böttcher, 1975; Jensenet al., 2005b), as well as the highly polyandrous mating system(Woyke, 1964; Adams et al., 1977; Neumann et al., 1999b) imposepractical difficulties to conserve honey bee subspecies or tomaintain breeding lines (Neumann et al., 1999a). This is furtherconfounded by the ease at which different subspecies hybridizewith one another (Franck et al., 2000a; Soland-Reckeweg et al.,2009).
In the last decade, there has been an increased awarenessof the importance of preserving local honey bee subspecies(Muñoz and De La Rúa, 2012; Muñoz et al., 2014a,b; Uzunovet al., 2014b; Bertrand et al., 2015). A recent pan-European
experiment testing different subspecies and local hybrids acrossa variety of environments revealed that locally adapted beeswere not only the most long-lived (Büchler et al., 2014), butin many cases also received better scores for docility andproductivity (Uzunov et al., 2014a). Conservation efforts havebeen employed in many countries across Europe (De La Rúaet al., 2009) and typically focus on selective breeding or restrictingthe bees kept by apiculturists to those native to a specifiedarea. Islands or remote mountain valleys in particular offerexcellent opportunities to limit the impact of non-native honeybees. Conservation measures usually include that introducedhoney bees and hybrids are replaced by native bees after beingidentified by discrimination of wing morphology (Ruttner, 1988;Kauhausen-Keller and Keller, 1994) or genetic analyses usingmicrosatellite markers (Neumann et al., 1999a; Scharpenberget al., 2006; Soland-Reckeweg et al., 2009; Oleksa et al., 2011;Péntek-Zakar et al., 2015).
In Switzerland, the native honey bee subspecies are A. m.mellifera, and to a lesser extent in Ticino, South of the Alps, A.m. ligustica (Ruttner, 1988). Since the middle of the last century,foreign honey bee queens have been increasingly imported suchthat nowadays two other subspecies or breeds are commonlyfound, namely A. m. carnica and the Buckfast bee (a highlyselected hybrid breed). The persistence of A. m. ligustica in theregion of Ticino is not clear. Many foreign queens have beenintroduced to this region and there are no ongoing efforts tomaintain this local subspecies. In contrast, considerable effort hasbeen invested to protect A. m. mellifera in Switzerland. To date,four conservation areas for A. m. mellifera have been established;conservatory Glarus (CGL) (∼1000 colonies, 680 km2), ValMustair (CVM) (∼300 colonies, 199 km2), Diemtigtal (CDI)(∼300 colonies, 135 km2) and Melchtal (CME) (∼50 colonies,150 km2). These areas are typically part of a nature reserve,and bee keeping of A. m. mellifera is either legally enforced ormutually agreed upon by the beekeeping community in that area.A national project to maintain and support these conservatorieshas recently been approved by the Swiss ministry of agriculture.However, for the effectiveness and long-term success of theseconservation areas an accurate assessment of the admixture levelsand genetic diversity of the current breeding populations isrequired.
In the French Alps, the center for technical bee keeping studies(CETA)was established in Savoie in 1997 tomanage and select forthe locally-adaptedA.m.mellifera. At CETA de Savoie selection isbased on biometric and morphometric analyses in collaborationwith the French National Center for Scientific Research (CNRS)and Natural History Museum in Paris. The center shares thesame objectives as the dark bee conservatories in Switzerland,and the region has comparable topography and climate. Analysisof bees from the different programs provides some informationon the effectiveness of conservation management in the differentregions.
The release and subsequent upgrade of the honey bee genome(Weinstock et al., 2006; Elsik et al., 2014) and rapid innovationsin high-throughput technologies drastically reduced the costs ofnext-generation sequencing (NGS). Hence, it has now becomeboth technically and economically feasible to assess genome-wide
Frontiers in Ecology and Evolution | www.frontiersin.org 2 December 2016 | Volume 4 | Article 140
Parejo et al. Honey Bee Conservation Genomics
genetic diversity and admixture levels of honey bees (e.g.,Harpur et al., 2014; Pinto et al., 2014; Wallberg et al., 2014).However, despite the reduced costs of NGS it is still not cost-effective to routinely sequence hundreds or thousands of beesto monitor conservation management. Instead, a few but highlyinformative single nucleotide polymorphisms (SNPs), so-calledancestry informative markers (AIMs) can be selected in order toinfer population structure (Shriver et al., 2003; Enoch et al., 2006;Kosoy et al., 2009). The identification of AIMs allows to estimateindividual origin and admixture levels inexpensively and withgreat accuracy. For instance, Muñoz et al. (2015) have selecteddifferent AIM panels out of 1183 genotyped SNPs to examinelevels of admixture between nativeA. m. mellifera and introducedhoney bees in Europe. With such ultra-low density SNP-chips, thousands of individuals can be cost-effectively genotypedfor conservation management or for sustainable bee breedingpurposes. Moreover, SNP chips are potentially more accuratethan the currently employed microsatellites or morphometricanalyses for discriminating honey bees of different origin. Indeed,empirical comparisons for other species have shown SNPs to bemore precise than microsatellites for population assignment andadmixture estimation (Liu et al., 2005; Hauser et al., 2011; Gärkeet al., 2012).
The purpose of this study was (1) to characterize the currentpopulation structure and genetic diversity of the honey beessampled in Switzerland and the French Alps, (2) to assessthe degree of admixture form introduced honey bees in theconservation areas of A. m. mellifera and (3) to select areduced number of informative SNPs to improve conservationmanagement strategies. To this end, we sequenced 151 whole-genomes of haploid drones sampled throughout Switzerland andthe French Alps which included A. m. mellifera samples from fiveconservation areas. Using model- and network-based clusteringapproaches, we detected fine-scale population structure with highgenetic diversity in all sampled subpopulations. Furthermore,we observed admixed A. m. mellifera individuals in all fiveconservation areas. To cost-effectively identify such hybridswithinA. m. mellifera, we selected ancestry informative SNPs andshow that as few as 50 SNPs are accurate to quantify levels ofgenetic admixture and relatedness between honey bees.
MATERIALS AND METHODS
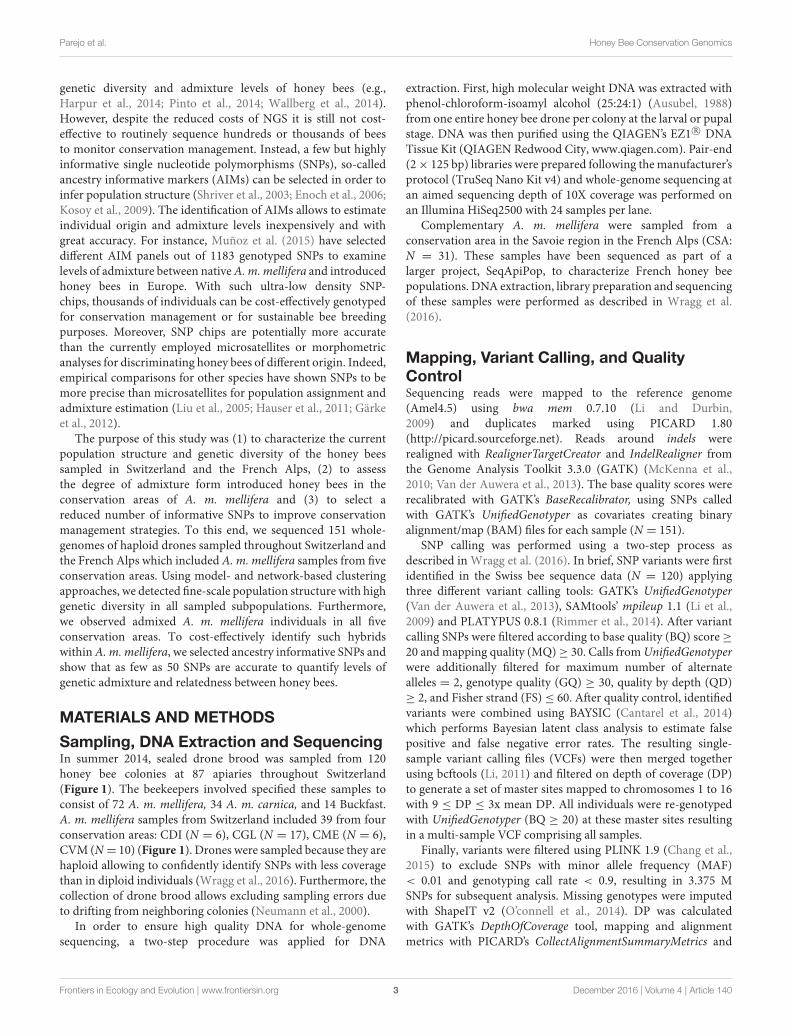
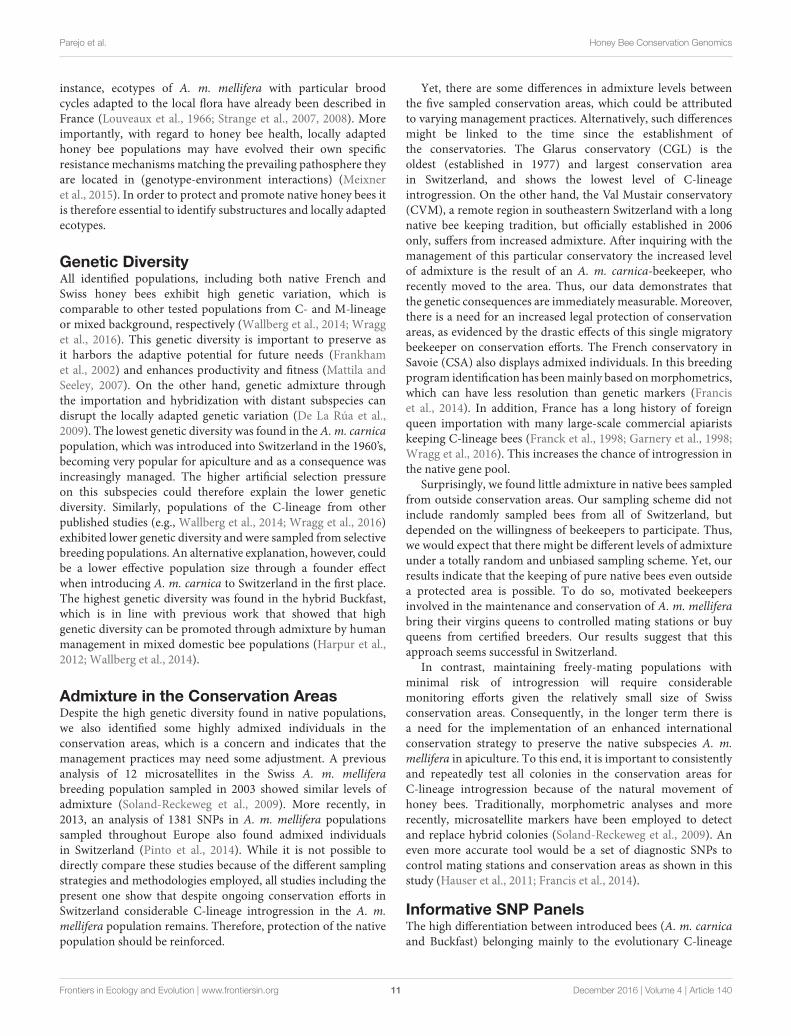
Sampling, DNA Extraction and SequencingIn summer 2014, sealed drone brood was sampled from 120honey bee colonies at 87 apiaries throughout Switzerland(Figure 1). The beekeepers involved specified these samples toconsist of 72 A. m. mellifera, 34 A. m. carnica, and 14 Buckfast.A. m. mellifera samples from Switzerland included 39 from fourconservation areas: CDI (N = 6), CGL (N = 17), CME (N = 6),CVM (N = 10) (Figure 1). Drones were sampled because they arehaploid allowing to confidently identify SNPs with less coveragethan in diploid individuals (Wragg et al., 2016). Furthermore, thecollection of drone brood allows excluding sampling errors dueto drifting from neighboring colonies (Neumann et al., 2000).
In order to ensure high quality DNA for whole-genomesequencing, a two-step procedure was applied for DNA
extraction. First, high molecular weight DNA was extracted withphenol-chloroform-isoamyl alcohol (25:24:1) (Ausubel, 1988)from one entire honey bee drone per colony at the larval or pupalstage. DNA was then purified using the QIAGEN’s EZ1 R© DNATissue Kit (QIAGEN Redwood City, www.qiagen.com). Pair-end(2× 125 bp) libraries were prepared following themanufacturer’sprotocol (TruSeq Nano Kit v4) and whole-genome sequencing atan aimed sequencing depth of 10X coverage was performed onan Illumina HiSeq2500 with 24 samples per lane.
Complementary A. m. mellifera were sampled from aconservation area in the Savoie region in the French Alps (CSA:N = 31). These samples have been sequenced as part of alarger project, SeqApiPop, to characterize French honey beepopulations. DNA extraction, library preparation and sequencingof these samples were performed as described in Wragg et al.(2016).
Mapping, Variant Calling, and QualityControlSequencing reads were mapped to the reference genome(Amel4.5) using bwa mem 0.7.10 (Li and Durbin,2009) and duplicates marked using PICARD 1.80(http://picard.sourceforge.net). Reads around indels wererealigned with RealignerTargetCreator and IndelRealigner fromthe Genome Analysis Toolkit 3.3.0 (GATK) (McKenna et al.,2010; Van der Auwera et al., 2013). The base quality scores wererecalibrated with GATK’s BaseRecalibrator, using SNPs calledwith GATK’s UnifiedGenotyper as covariates creating binaryalignment/map (BAM) files for each sample (N = 151).
SNP calling was performed using a two-step process asdescribed in Wragg et al. (2016). In brief, SNP variants were firstidentified in the Swiss bee sequence data (N = 120) applyingthree different variant calling tools: GATK’s UnifiedGenotyper(Van der Auwera et al., 2013), SAMtools’ mpileup 1.1 (Li et al.,2009) and PLATYPUS 0.8.1 (Rimmer et al., 2014). After variantcalling SNPs were filtered according to base quality (BQ) score≥20 and mapping quality (MQ)≥ 30. Calls fromUnifiedGenotyperwere additionally filtered for maximum number of alternatealleles = 2, genotype quality (GQ) ≥ 30, quality by depth (QD)≥ 2, and Fisher strand (FS)≤ 60. After quality control, identifiedvariants were combined using BAYSIC (Cantarel et al., 2014)which performs Bayesian latent class analysis to estimate falsepositive and false negative error rates. The resulting single-sample variant calling files (VCFs) were then merged togetherusing bcftools (Li, 2011) and filtered on depth of coverage (DP)to generate a set of master sites mapped to chromosomes 1 to 16with 9 ≤ DP ≤ 3x mean DP. All individuals were re-genotypedwith UnifiedGenotyper (BQ ≥ 20) at these master sites resultingin a multi-sample VCF comprising all samples.
Finally, variants were filtered using PLINK 1.9 (Chang et al.,2015) to exclude SNPs with minor allele frequency (MAF)< 0.01 and genotyping call rate < 0.9, resulting in 3.375 MSNPs for subsequent analysis. Missing genotypes were imputedwith ShapeIT v2 (O’connell et al., 2014). DP was calculatedwith GATK’s DepthOfCoverage tool, mapping and alignmentmetrics with PICARD’s CollectAlignmentSummaryMetrics and
Frontiers in Ecology and Evolution | www.frontiersin.org 3 December 2016 | Volume 4 | Article 140
Parejo et al. Honey Bee Conservation Genomics
FIGURE 1 | Sampling sites. Putative subspecies assignment according to the labeling of beekeepers from which the samples were collected: ≪A. m. mellifera≫
(N = 72) from Switzerland, including N = 39 from the Swiss conservatories, ≪A. m. mellifera≫ (N = 31) from the French conservatory in Savoy, ≪A. m. carnica≫
(N = 34) and ≪Buckfast≫ bees (N = 14). The green areas are the five currently established conservatories in that area to protect the native A. m. mellifera: CDI, CME,
CGL, CVM, and CSA.
SAMtools’ flagstat, and variant calling statistics with VCFtoolsvcf-stats (Danecek et al., 2011).
Population Structure AnalysesPrincipal Component Analysis (PCA)We performed principal component analysis (PCA) to assess thepopulation structure of the sampled honey bees. PCA is a classicalnon-parametric linear reduction technique used to revealpopulation structure by arranging all principal components(PCs) according to the explained variance without resortingto a model (Menozzi et al., 1978; Price et al., 2006; Gao andStarmer, 2008). Here, we applied PCA on a genetic relationshipmatrix (n × n) with pairwise identities by state (IBS) betweenall individuals (N = 151) as provided by PLINK 1.9 (Changet al., 2015). To infer the number of significant PCs and todetermine significant differences between subpopulations, weused Horn’s parallel analysis (PA; Horn, 1965; Dinno, 2009)as implemented in the R package paran (Dinno, 2012). Afterinitial assessment of the population structure with PCA, wefurther explored the hierarchical structure using a network-based clustering approach and investigated individual admixtureproportions using a model-based approach.
Hierarchical Population StructureTo determine the uppermost hierarchical population structure,we applied an unsupervised network-based clustering algorithm
called super paramagnetic clustering (SPC, Blatt et al., 1996;Tetko et al., 2005). The input to SPC is a dissimilarity matrix D(n × n) with pairwise genetic distances between all individualscalculated using allele sharing distance (ASD; one minus IBS).Given D, each individual gets associated with a Pott spin variable(q). Once q have been assigned, the clustering is performed alonga range of temperature (1T) limiting the interactions to a givennumber of k nearest neighbors (k-NN).We applied the algorithmusing the following settings: k-NN = 15, q = 20 and (1T) =0.01. For the visualization of hierarchical population structureand cluster solution, we used the R software package phytools(Revell, 2012).
AdmixtureTo estimate the admixture proportion of each individual,we performed model-based cluster analyses as implementedin the program ADMIXTURE (Alexander et al., 2009). Theprogram was run unsupervised with 10,000 iterations and a pre-specified number of clusters K (K = 1–6). Convergence betweenindependent runs at the same Kwas monitored by comparing theresulting log-likelihood scores (LLS) following 10,000 iterations,and was inferred from stabilized LLS with less than 1 LL unit ofvariation between runs. Cross validation (CV) error estimationfor each cluster was performed with ADMIXTURE (Alexanderet al., 2009) and used to determine the optimal number of Kclusters.
Frontiers in Ecology and Evolution | www.frontiersin.org 4 December 2016 | Volume 4 | Article 140

Parejo et al. Honey Bee Conservation Genomics
To investigate the differences in introgression fromintroduced honey bees into the native A. m. mellifera genepool, we compared admixture proportions from individualsoriginating from different sampling locations. For that reason,we calculated median and interquartile range (IQR) of theadmixture proportions calculated at K = 2 from the samplesin each of the conservation areas (CDI, CGL, CME, CVM, andCSA), as well as for the A. m. mellifera samples originatingfrom unprotected regions in Switzerland (MEL). To evaluate thedifferences among these groups, a Kruskal-Wallis (Kruskal andWallis, 1952) and post-hoc pairwise comparisons using Dunn’stest (Dunn, 1964) with Holm correction (Holm, 1979) wereconducted.
High-Resolution Population NetworksModel-based admixture analyses and network-based clusteringwere combined into high-resolution population networksin order to illustrate individual relationships and fine-scale population structure. We investigated high-resolutionpopulation networks using the open graph visualizationplatform Cytoscape (Shannon et al., 2003) and the pluginMultiColoredNodes (Warsow et al., 2010). In the final networkvisualization, the uppermost hierarchical population structureas inferred from SPC is presented in terms of node size, numberof edges between nodes and width of edges. Here, we haveassociated the node size of each honey bee with the number ofk-nearest neighbors (k-NN; number of edges), while the color ofeach honey bee represents the pre-determined level of admixtureat K = 2 and K = 4, respectively. In order to express the strengthof relationship between two individuals, the line width of anedge is proportional to the genetic relatedness between them(IBS). This approach is described in Neuditschko et al. (2012)and a recent implementation of this workflow is now availableas R package (Steinig et al., 2015) posted at https://github.com/esteinig/netview.
In network theory, so-called communities, which are moredensely and strongly connected within a group than outside agroup, can be detected. Based on the high-resolution populationnetwork at K = 4 (see Result section), we selected a subset(communities) of core bees (gray dashed circles in Figure 4B) foreach subpopulation which were clustering together and showedno or low levels of admixture (<0.1; except for Buckfast whichwas a more heterogeneous group). This subset consisted of a totalof 95 core bees representing the four sampled subpopulations;13 Buckfast bees, 26 A. m. carnica, 39 A. m. mellifera fromSwitzerland and 17 A. m. mellifera from France. These were usedin subsequent population genetic analyses. The 56 remainingbees, which clustered outside the four identified communities,were designated to the subsample of test bees (N = 56)(Supplementary Table 1).
Population Differentiation and Genetic DiversityTo investigate average genome-wide divergence between theabove defined subpopulations, we estimated mean pairwisepopulation differentiation FST (Weir and Cockerham, 1984) inwindow sizes of 5 kb and 1 kb overlap using VCFtools (Daneceket al., 2011). We further estimated FST between native honeybees (A. m. mellifera from Switzerland and France) from the
evolutionaryM-lineage and introduced honey bees (A.m. carnicaand Buckfast) with mainly C-lineage ancestry. In addition, weestimated nucleotide diversityπ in each subpopulation as definedby the average pairwise sequence difference per nucleotide site(Nei, 1982). We used VCFtools (Danecek et al., 2011) to calculateπ in window sizes of 5 kb with 1 kb increment and estimatedconfidence intervals of the mean. It was not possible to calculateπ for core bees originating from each of the Swiss conservationareas separately due to the limited sample size (<5) in CME, CDI,and CVM, thus π could only be calculated for CGL (N = 15).
Informative SNP PanelsSNP Thinning and Selection of Informative SNP
PanelsThe systemic homozygosity in haploid sequence data resultsin strong linkage disequilibrium (LD) between SNPs (seeSupplementary Figure 1), and consequently a large number ofuninformative or “redundant” SNPs (Weale et al., 2003; Nicolaset al., 2006; Paschou et al., 2008). To reduce SNP densityand redundancy without adversely affecting LD-associated fine-structure, the dataset was randomly down-sampled to 10,000SNPs using PLINK 1.9 (Chang et al., 2015). To ensure that therewas no loss of information after the stringent thinning step, wecomputed and compared ASD-based distance matrices and PCAresults between the entire (3.375 M SNPs) and thinned (10KSNPs) datasets. First, to verify whether the genetic relationshipsbetween individuals are reflected in the thinned dataset, we testedthe concordance between the ASD distance matrix with all bees(N = 151) inferred from the whole-genome (3.375 M SNPs) andthe pairwise distances inferred from the thinned (10K SNPs)dataset usingMantel R (Mantel, 1967). Mantel R is a permutationtest to estimate the correlation between two matrices and wascalculated using the package vegan in R (Oksanen et al., 2016).Second, to visualize whether the thinned dataset is able to capturethe population structure revealed by all SNPs, we computed PCAfor each dataset and plotted the core bees (N = 95) on the firstand second PCs.
To distinguish introduced from native honey bees forconservation or breeding purposes, ancestry informative SNPsfor subspecies discrimination were identified. Out of the thinneddataset, we generated panels with different number of SNPs(1000, 500, 100, and 50 SNPs) employing three different selectionmethods:
(1) FST (Weir and Cockerham, 1984) between native andintroduced honey bees. FST per site was calculated betweencore bees of A. m. mellifera from Switzerland and France (N= 56) and core bees of A. m. carnica and Buckfast bees (N =
39) using VCFtools (Danecek et al., 2011). Four SNP panelswith the highest FST per SNP were defined as: FST-1000,FST-500, FST-100 and FST-50. In addition, we selected a fifthpanel correcting for any remaining redundancy in the SNPinformativeness by computing a sorted QR-decompositionto effectively remove correlated markers (Paschou et al.,2008). The input for QR-decomposition is a genotype matrixwith dimensions n × m (samples × SNPs), where eachSNP is encoded with either −1 for homozygous referenceor 1 for homozygous alternate allele. Applying this approach
Frontiers in Ecology and Evolution | www.frontiersin.org 5 December 2016 | Volume 4 | Article 140
Parejo et al. Honey Bee Conservation Genomics
with a custom script in GNU octave (Eaton et al., 2014),we extracted the most uncorrelated SNPs out of the FST-100panel resulting in the fifth SNP panel: UncorrFST-50.
(2) PCA-derived, whereby a subset PCA-correlated SNPs wereselected to reproduce the structure found by PCA withoutuse of prior ancestry information (Paschou et al., 2007).This approach measures the correlation between a SNP andthe significant principal components giving each SNP aPCA-score (Paschou et al., 2007). The input is a genotypematrix (samples× SNPs) encoded as above (1,−1) and PCA-scores were calculated using a custom script in R. Finally,we defined four informative SNP panels with the highestPCA-scores: PCA-1000, PCA-500, PCA-100, and PCA-50.Additionally, we generated a fifth panel applying the sameapproach as for the UncorrFST-50 (see above). We thusselected the 50 most uncorrelated out of the PCA-100 SNPsresulting in the panel: UncorrPCA-50.
(3) Randomly chosen SNPs, selected using the sample-functionin R to generate panels with 1000, 500, 100, and 50SNPs, respectively. Since the variation when using randomlyselected SNPs is expected to be high, we run the sample-function five times each to produce a total of 20 SNP panels:5x Random-1000, 5x Random-500, 5x Random-100, and 5xRandom-50.
After generating the SNP panels, we tested their accuracyin estimating admixture proportions and genetic relationshipsbetween individuals by reference the earlier results from thecomplete SNP dataset. The random panel replicates were testedindependently and the averaged statistic and variation arereported.
Performance of Informative SNP PanelsTo compare the performance of the SNP panels on the accuracyto estimate admixture proportions, we ran ADMIXTURE(Alexander et al., 2009) at K = 2 using all bees (N = 151)and each of the selected SNP panels. The admixture proportionsof the test bees (N = 56), which were not used for selectionof the ancestry informative SNPs, were retrieved to test theaccuracy of the SNP panels to predict admixture proportions. Wetherefore estimated the correlation coefficient r (Pearson, 1895)between the admixture proportions calculated based on all 3.375M SNPs and the admixture proportions estimated with each ofthe selected SNP panels. Moreover, mean standard error (SE)of the inferred admixture proportions of all bees was calculatedfor each of the SNP panel, in order to examine whether lowernumbers of SNPs increase SE.
To investigate the precision of the selected panels to predictthe genetic relatedness between individuals, we computedpairwise distances (ASD) between all samples (N = 151) witheach of the selected SNP panels. To estimate the concordancebetween the resulting distance matrices and the ASD matrixinferred from the entire data set (3.375 M SNPs), we performedpairwise Mantel tests (Mantel, 1967).
Finally, in order to visualize the population differentiation, wealso computed PCA with the best performing panel and plottedthe first two PCs. All statistics, if not otherwise stated, werecalculated and plotted in R (R Core Team, 2016).
RESULTS
Mapping and Variant CallingOn average 19,549,894 paired-end reads were generated per beeof which 96.3%mapped in pairs to the reference genome Amel4.5(Elsik et al., 2014). Approximately 2.2% of the mapped readswere marked as duplicates that aligned with the identical startand end positions onto the reference genome. Sequencing depthper sample ranged from 3.3 to 20.7X with mean 9.9X resultingin 97.2% of the genome being covered on average. Individualmapping and alignment statistics are presented in SupplementaryTable 2.
Individual variant calling statistics for each drone genome inthe Swiss dataset, comparing the three different applied variantcalling tools, can be found in Supplementary Table 3. Oncefiltered on depth of coverage, the master variant file identifiedby combining single sample VCF files resulted in 4.986 M rawSNPs, which were used to genotype both the Swiss and Frenchdatasets. Post quality control filtering, 3,374,686 high-qualitygenome-wide SNPs were retained for analysis.
Population Structure AnalysesPrincipal Component Analysis (PCA)The result of PCA shows that the first PC clearly separatesthe samples into two major clusters according to the twoevolutionary lineages M and C, while further substructureswithin these lineages are revealed on the second PC(Supplementary Figure 2). The general diversity pattern isthus characterized by four populations: A. m. carnica and thediverse Buckfast group within the C-lineage cluster and twosubpopulations of A. m. mellifera within the M-lineage clusteroriginating from Switzerland and France, respectively. Horn’sPA resulted in the retention of one significant PC accountingfor 95.1% of the variance. This demonstrates a significantseparation of the samples according to the evolutionary lineages,while the substructures disclosed on the second PC are notsignificant.
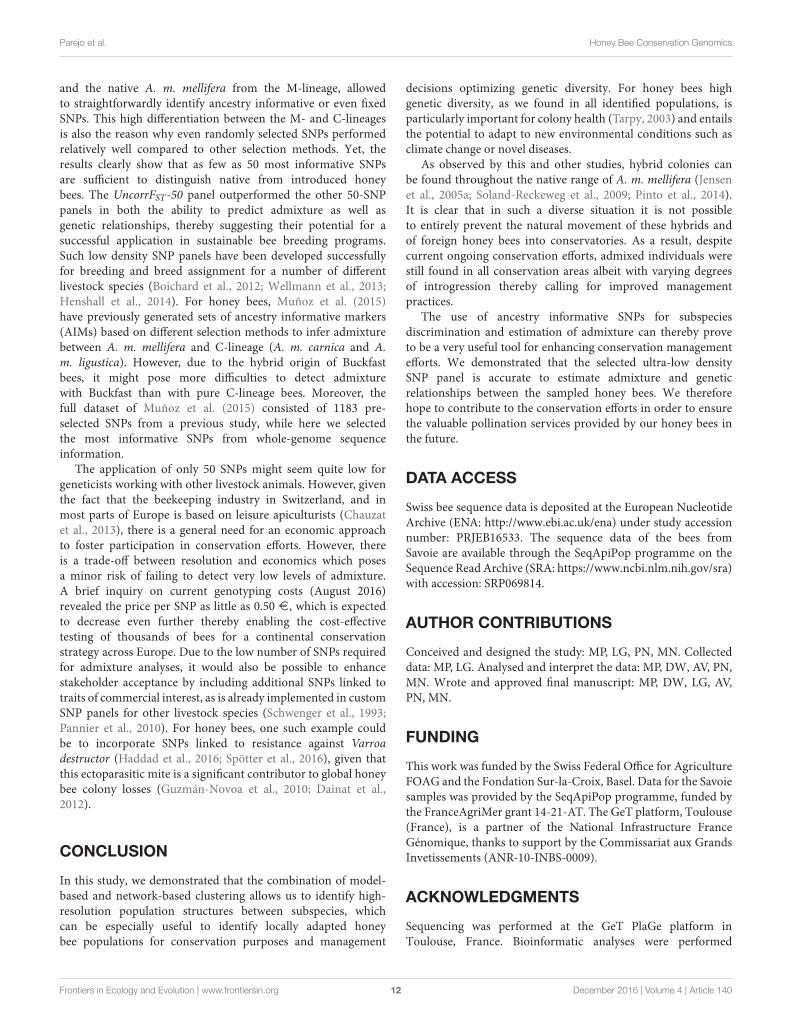
Hierarchical Population StructureThe network-based cluster-tree recapitulates the findings of PCAby dividing the three honey bee subspecies (A. m. mellifera, A.m. carnica, and Buckfast) into two distinct population clusters,while two honey bees were assigned into an additional singlecluster (Figure 2A). Moving up the cluster tree, A. m. carnicaand Buckfast were assigned into respective population clustersand honey bees with mixed genetic origin were separated fromthe main A. m. mellifera population. At the additional levels ofthe tree, A. m. mellifera was further sub-structured, whereas theidentified sub-structures do not reflect the different geographicorigin of samples. On the top level of the tree, especially A. m.mellifera sampled from the four Swiss conservation areas wereclustered together along with two samples from France. The finaltopology of the network-based cluster tree shows that honey beesare characterized by a high level of hierarchical structure.
AdmixtureFollowing the CV error estimation (Supplementary Figure 3),ADMIXTURE (Alexander et al., 2009) suggested an optimalnumber of clusters K = 2. Given K = 2, individuals are
Frontiers in Ecology and Evolution | www.frontiersin.org 6 December 2016 | Volume 4 | Article 140
Parejo et al. Honey Bee Conservation Genomics
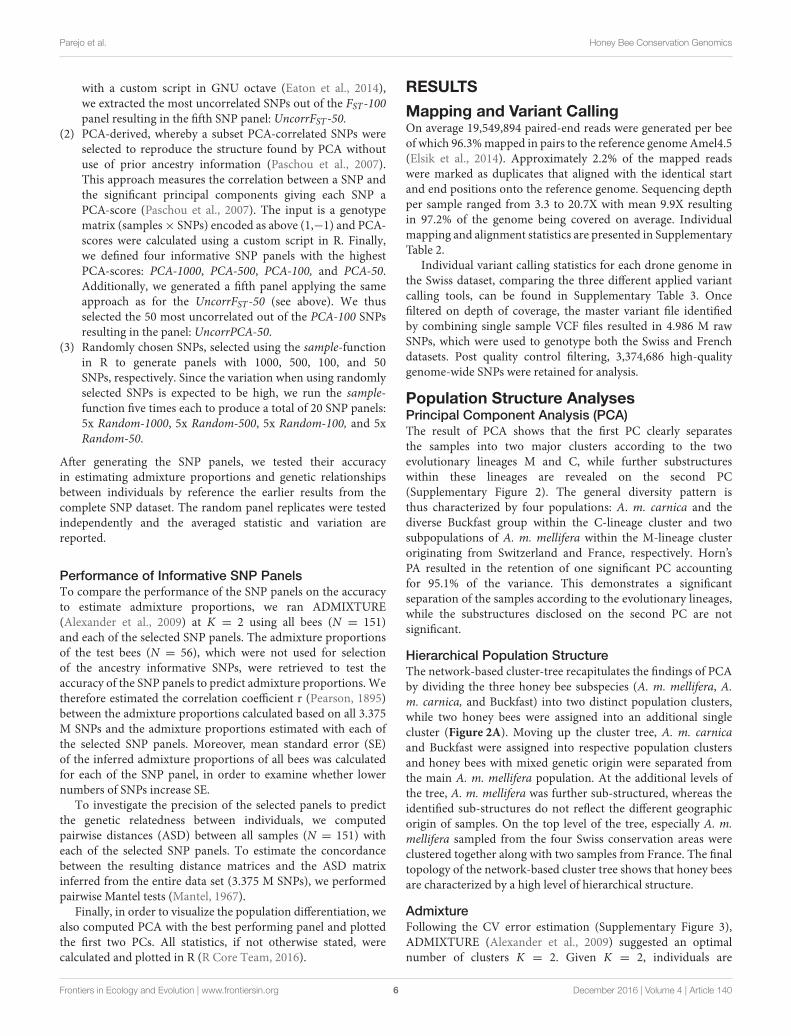
FIGURE 2 | Hierarchical population structure and admixture. (A) Genetic relationships between the 151 drones illustrated by the network-based hierarchical
cluster tree. Samples are colored according to their putative subspecies assignment based on the labeling information of beekeepers: ≪A. m. mellifera≫ (N = 72)
from Switzerland, ≪A. m. mellifera≫ (N = 31) from Savoie (France), ≪A. m. carnica≫ (N = 34) and ≪Buckfast≫ bees (N = 14). Honey bees which clustered
together with members of other subpopulations indicate labeling errors of beekeepers or admixed individuals. (B) Membership proportion calculated with ADMIXTURE
for K = 2 to 4 hypothetical ancestral populations. The program uses a model-based algorithm to infer ancestry. Each individual is represented by a horizontal bar and
samples are sorted according to the hierarchical clustering tree. Each color represents one of K clusters and individuals are colored according to the proportion of the
genome that was derived from each cluster. Optimal number of clusters as inferred by the cross-validation error estimation is K = 2.
separated into two major clusters which correspond to thetwo distant evolutionary lineages M and C (Figure 2B). Thesamples, which are sorted according to the hierarchical clusteringtree, appear arranged in groups depending on their degree ofadmixture (Figure 2B). Hence, the admixture levels at K =
2 identified by ADMIXTURE (Alexander et al., 2009), whichuses a model-based approach, reflect the hierarchical structurefound by the network-based clustering tree (Figure 2A). Atincreasing values of K, further substructures become evidentwhich are in concordance with the sampled subpopulationsor their geographic origin. At K = 3, the M-lineage clusteris separated into A. m. mellifera bees with Swiss and Frenchancestry, respectively. Increasing K to 4, subdivides the C-lineagecluster into honey bees with A. m. carnica ancestry and Buckfastancestry.
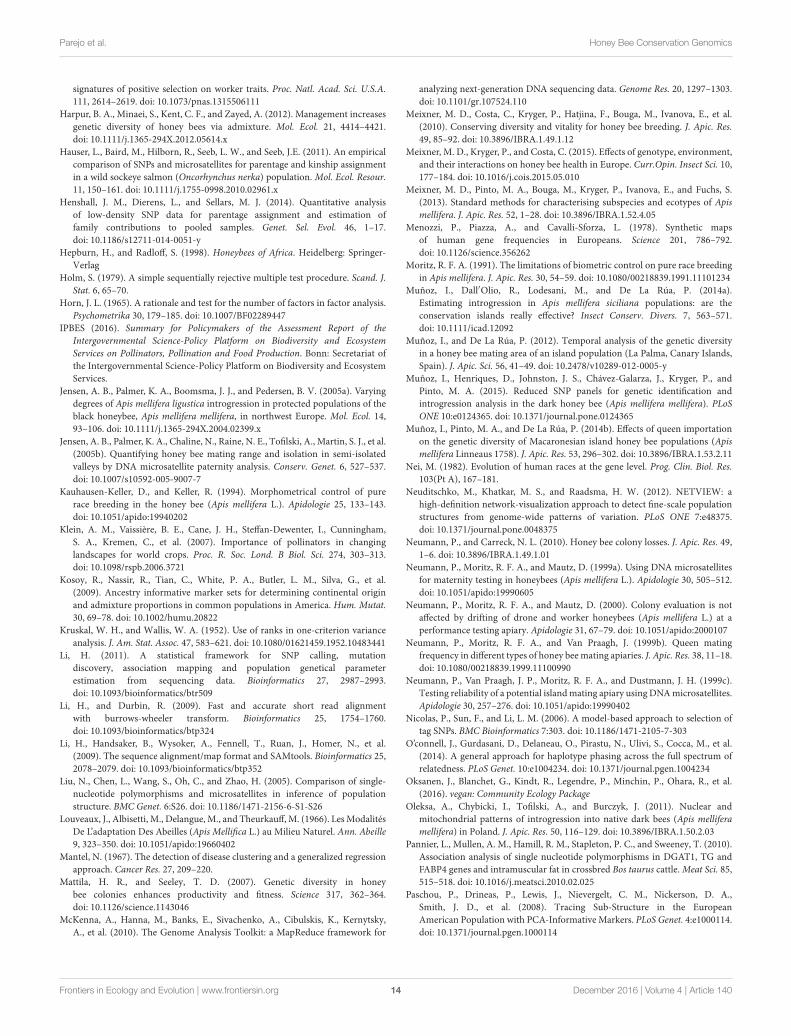
If samples are ordered according to sampling locations,admixed individuals are found in all of the five sampledconservation areas (Supplementary Figure 4). The lowest medianadmixture levels were found in the CGL conservatory (Mdn =
0.000, IQR= 0.000–0.007), followed by CME (Mdn= 0.059, IQR= 0.013–0.077), CVM (Mdn = 0.071, IQR = 0.032–0.314) andthe French conservatory CSA (Mdn= 0.072, IQR= 0.034–0.178)
(Figure 3). The highest median admixture levels were foundin CDI (Mdn = 0.073, IQR = 0.063–0.083). Excepting for afew highly admixed samples, A. m. mellifera originating fromunprotected areas were generally little admixed (Mdn = 0.030,IQR = 0.014–0.091). The mean ranks of admixture proportionsamong these six sampling locations were significantly different(Kruskal-Wallis: H = 22.95, df = 5. P = 0.0003). Follow-up testsindicated a significant difference between CGL andCVM (Dunn’sz = −3.59, p = 0.002), CGL and CSA (Dunn’s z = −4.41, p <
0.001), and CGL and the samples from unprotected areas (MEL)(Dunn’s z =−3.02, p= 0.017) (Figure 3).
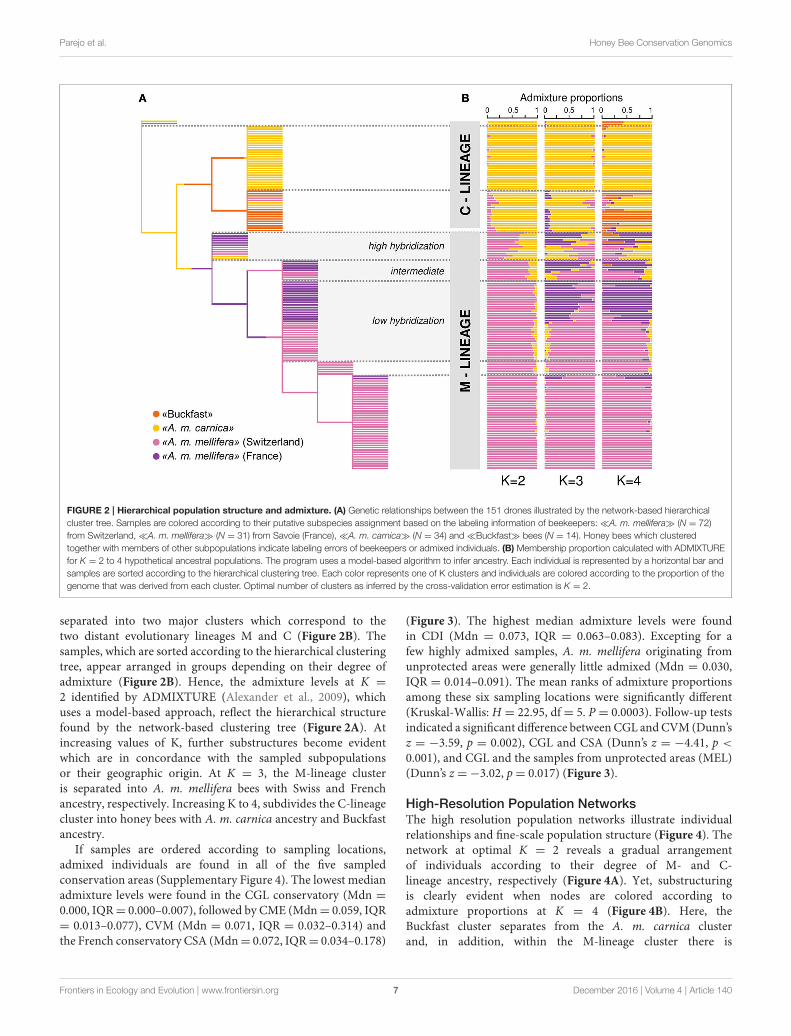
High-Resolution Population NetworksThe high resolution population networks illustrate individualrelationships and fine-scale population structure (Figure 4). Thenetwork at optimal K = 2 reveals a gradual arrangementof individuals according to their degree of M- and C-lineage ancestry, respectively (Figure 4A). Yet, substructuringis clearly evident when nodes are colored according toadmixture proportions at K = 4 (Figure 4B). Here, theBuckfast cluster separates from the A. m. carnica clusterand, in addition, within the M-lineage cluster there is
Frontiers in Ecology and Evolution | www.frontiersin.org 7 December 2016 | Volume 4 | Article 140

Parejo et al. Honey Bee Conservation Genomics
substructuring of theA.m. mellifera bees originating from France(Figure 4B).
The densely packed A. m. mellifera cluster from Switzerland,as well as the A. m. carnica cluster, reveal a high geneticrelatedness of individuals within these populations. This is alsoreflected in the greater edge widths (=pairwise IBS) and node
FIGURE 3 | Admixture proportions of A. m. mellifera sampled outside
(MEL) and within each of the conservation areas (CDI, CGL, CME,
CVM, and CSA). The box denotes the upper and lower quartiles, and the
median is represented by a solid black line within the box. There is a significant
difference between the mean ranks of the admixture proportions among the
different sampling areas (Kruskal-Wallis: H = 22.95, df = 5. P = 0.0003). The
conservation area CGL has significantly lower admixture levels than the CVM
and CSA conservatories, as well as compared to A. m. mellifera sampled
outside conservation areas (MEL) (pairwise multiple comparisons using Dunn’s
test and Holm correction, significance levels marked as: p < 0.05*, p > 0.01**,
p > 0.001***). Numbers below boxplots designate sample size in each group.
sizes (=number of nearest neighbors) within these clusters.Whereas, highly admixed individuals are clustered together basedon their degree of admixture and not because of higher geneticrelationship, as shown by the thinner edges between nodes. Thehigh resolution visualization allows further to identify outliers,one in the Swiss A. m. mellifera cluster and two in the French A.m. mellifera cluster, which are connected to one other individualonly. These honey bees are not closely related to the rest of thecluster and represent rare genetic variation.
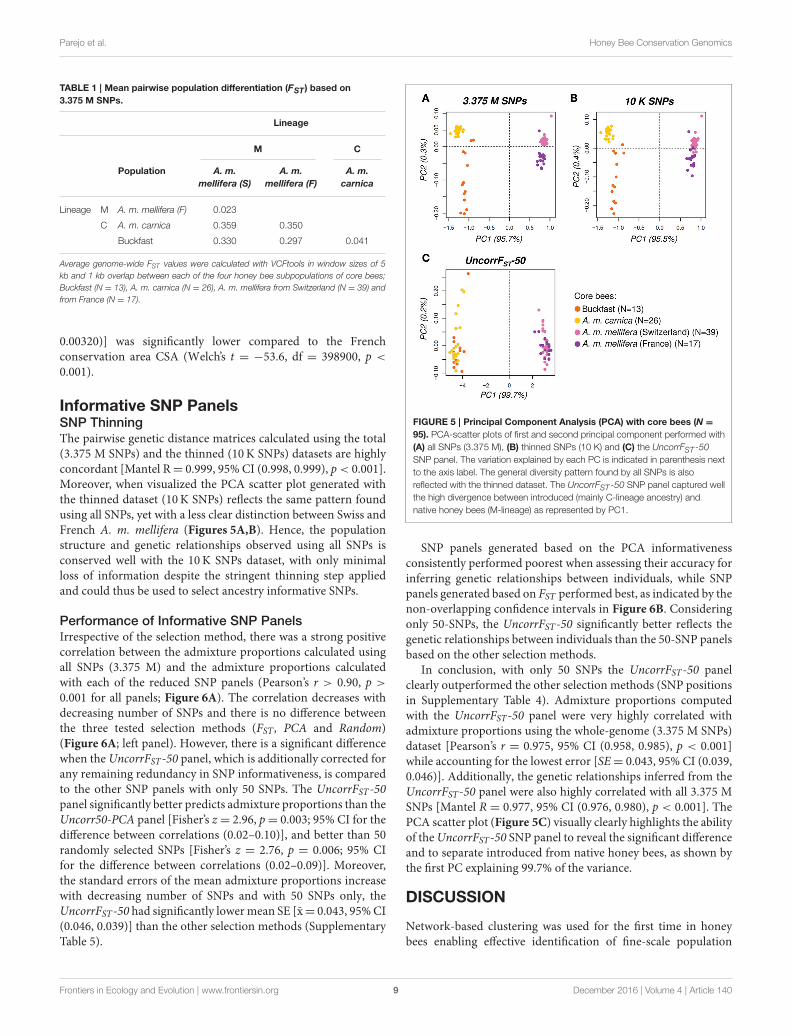
Population Differentiation and Genetic DiversityOverall, average genome-wide population differentiationbetween each of the core bee subpopulations (as defined inMaterial and Methods; Supplementary Table 1) is characterizedby high divergence between and low divergence within theevolutionary lineages M and C. The lowest level of populationdifferentiation was found between the Swiss and French A.m. mellifera (FST = 0.023), while the highest difference wasobserved between the Swiss A. m. mellifera and the A. m.carnica (FST = 0.359) (Table 1). Introduced honey bees (A. m.carnica and Buckfast, mainly from the C-lineage) are stronglydifferentiated from the native A. m. mellifera populations(M-lineage) (FST = 0.317).
Genetic diversity was highest in the Buckfast beepopulation [π = 0.00392, 95% CI (0.00391, 0.00393)],followed by the A. m. mellifera populations from theFrench conservatory [π = 0.00354, 95% CI (0.00353,0.00355)] and Switzerland [π = 0.00331, 95% CI (0.00330,0.00332)]. The lowest level of genetic diversity wasfound in the A. m. carnica population [π = 0.00309,95% CI (0.00308, 0.00310)]. Nucleotide diversity of theSwiss conservatory CGL [π = 0.00319, 95% CI (0.00318,
FIGURE 4 | High-resolution population networks with admixture proportions at K = 2 (A) and K = 4 (B). Each individual is represented by a node and
colored according to its membership proportion inferred by ADMIXTURE. Node size reflects centrality of the individual and is proportional to the number of nearest
neighbors (k-NN). Line width of edges (=connecting lines) is proportional to the genetic relatedness between individuals (IBS). (A) At K = 2 the samples are separated
into C- and M-lineage ancestry with admixed individuals placed in-between depending on the degree of admixture. (B) At K = 4, the honey bees are clustered into
four substructures (A. m. mellifera from Switzerland, A. m. mellifera from France, Buckfast bees and A. m. carnica), while highly admixed individuals fall outside of the
population clusters (test bees). The samples within dashed circles are defined as the subpopulations of the core bees.
Frontiers in Ecology and Evolution | www.frontiersin.org 8 December 2016 | Volume 4 | Article 140
Parejo et al. Honey Bee Conservation Genomics
TABLE 1 | Mean pairwise population differentiation (FST) based on
3.375 M SNPs.
Lineage
M C
Population A. m.
mellifera (S)
A. m.
mellifera (F)
A. m.
carnica
Lineage M A. m. mellifera (F) 0.023
C A. m. carnica 0.359 0.350
Buckfast 0.330 0.297 0.041
Average genome-wide FST values were calculated with VCFtools in window sizes of 5
kb and 1 kb overlap between each of the four honey bee subpopulations of core bees;
Buckfast (N = 13), A. m. carnica (N = 26), A. m. mellifera from Switzerland (N = 39) and
from France (N = 17).
0.00320)] was significantly lower compared to the Frenchconservation area CSA (Welch’s t = −53.6, df = 398900, p <
0.001).
Informative SNP PanelsSNP ThinningThe pairwise genetic distance matrices calculated using the total(3.375 M SNPs) and the thinned (10K SNPs) datasets are highlyconcordant [Mantel R= 0.999, 95% CI (0.998, 0.999), p< 0.001].Moreover, when visualized the PCA scatter plot generated withthe thinned dataset (10K SNPs) reflects the same pattern foundusing all SNPs, yet with a less clear distinction between Swiss andFrench A. m. mellifera (Figures 5A,B). Hence, the populationstructure and genetic relationships observed using all SNPs isconserved well with the 10K SNPs dataset, with only minimalloss of information despite the stringent thinning step appliedand could thus be used to select ancestry informative SNPs.
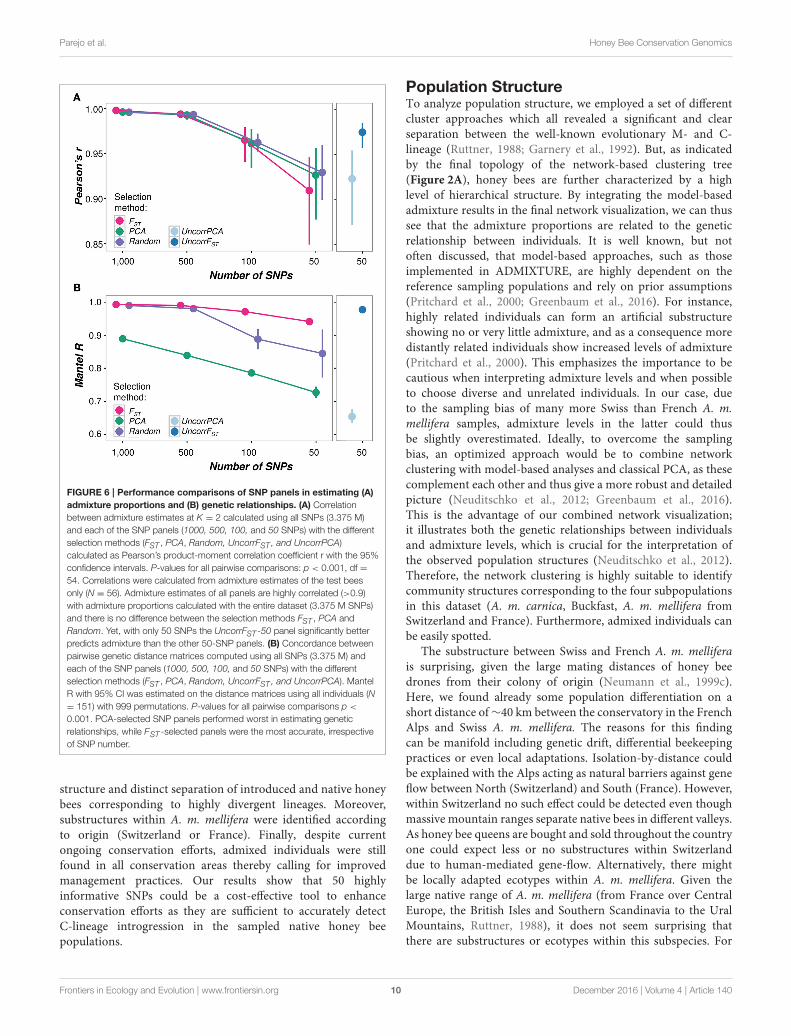
Performance of Informative SNP PanelsIrrespective of the selection method, there was a strong positivecorrelation between the admixture proportions calculated usingall SNPs (3.375 M) and the admixture proportions calculatedwith each of the reduced SNP panels (Pearson’s r > 0.90, p >
0.001 for all panels; Figure 6A). The correlation decreases withdecreasing number of SNPs and there is no difference betweenthe three tested selection methods (FST , PCA and Random)(Figure 6A; left panel). However, there is a significant differencewhen theUncorrFST-50 panel, which is additionally corrected forany remaining redundancy in SNP informativeness, is comparedto the other SNP panels with only 50 SNPs. The UncorrFST-50panel significantly better predicts admixture proportions than theUncorr50-PCA panel [Fisher’s z= 2.96, p= 0.003; 95% CI for thedifference between correlations (0.02–0.10)], and better than 50randomly selected SNPs [Fisher’s z = 2.76, p = 0.006; 95% CIfor the difference between correlations (0.02–0.09)]. Moreover,the standard errors of the mean admixture proportions increasewith decreasing number of SNPs and with 50 SNPs only, theUncorrFST-50 had significantly lowermean SE [x̄= 0.043, 95%CI(0.046, 0.039)] than the other selection methods (SupplementaryTable 5).
FIGURE 5 | Principal Component Analysis (PCA) with core bees (N =
95). PCA-scatter plots of first and second principal component performed with
(A) all SNPs (3.375 M), (B) thinned SNPs (10 K) and (C) the UncorrFST -50
SNP panel. The variation explained by each PC is indicated in parenthesis next
to the axis label. The general diversity pattern found by all SNPs is also
reflected with the thinned dataset. The UncorrFST -50 SNP panel captured well
the high divergence between introduced (mainly C-lineage ancestry) and
native honey bees (M-lineage) as represented by PC1.
SNP panels generated based on the PCA informativenessconsistently performed poorest when assessing their accuracy forinferring genetic relationships between individuals, while SNPpanels generated based on FST performed best, as indicated by thenon-overlapping confidence intervals in Figure 6B. Consideringonly 50-SNPs, the UncorrFST-50 significantly better reflects thegenetic relationships between individuals than the 50-SNP panelsbased on the other selection methods.
In conclusion, with only 50 SNPs the UncorrFST-50 panelclearly outperformed the other selection methods (SNP positionsin Supplementary Table 4). Admixture proportions computedwith the UncorrFST-50 panel were very highly correlated withadmixture proportions using the whole-genome (3.375 M SNPs)dataset [Pearson’s r = 0.975, 95% CI (0.958, 0.985), p < 0.001]while accounting for the lowest error [SE= 0.043, 95% CI (0.039,0.046)]. Additionally, the genetic relationships inferred from theUncorrFST-50 panel were also highly correlated with all 3.375 MSNPs [Mantel R = 0.977, 95% CI (0.976, 0.980), p < 0.001]. ThePCA scatter plot (Figure 5C) visually clearly highlights the abilityof theUncorrFST-50 SNP panel to reveal the significant differenceand to separate introduced from native honey bees, as shown bythe first PC explaining 99.7% of the variance.
DISCUSSION
Network-based clustering was used for the first time in honeybees enabling effective identification of fine-scale population
Frontiers in Ecology and Evolution | www.frontiersin.org 9 December 2016 | Volume 4 | Article 140
Parejo et al. Honey Bee Conservation Genomics
FIGURE 6 | Performance comparisons of SNP panels in estimating (A)
admixture proportions and (B) genetic relationships. (A) Correlation
between admixture estimates at K = 2 calculated using all SNPs (3.375 M)
and each of the SNP panels (1000, 500, 100, and 50 SNPs) with the different
selection methods (FST , PCA, Random, UncorrFST , and UncorrPCA)
calculated as Pearson’s product-moment correlation coefficient r with the 95%
confidence intervals. P-values for all pairwise comparisons: p < 0.001, df =
54. Correlations were calculated from admixture estimates of the test bees
only (N = 56). Admixture estimates of all panels are highly correlated (>0.9)
with admixture proportions calculated with the entire dataset (3.375 M SNPs)
and there is no difference between the selection methods FST , PCA and
Random. Yet, with only 50 SNPs the UncorrFST -50 panel significantly better
predicts admixture than the other 50-SNP panels. (B) Concordance between
pairwise genetic distance matrices computed using all SNPs (3.375 M) and
each of the SNP panels (1000, 500, 100, and 50 SNPs) with the different
selection methods (FST , PCA, Random, UncorrFST , and UncorrPCA). Mantel
R with 95% CI was estimated on the distance matrices using all individuals (N
= 151) with 999 permutations. P-values for all pairwise comparisons p <
0.001. PCA-selected SNP panels performed worst in estimating genetic
relationships, while FST -selected panels were the most accurate, irrespective
of SNP number.
structure and distinct separation of introduced and native honeybees corresponding to highly divergent lineages. Moreover,substructures within A. m. mellifera were identified accordingto origin (Switzerland or France). Finally, despite currentongoing conservation efforts, admixed individuals were stillfound in all conservation areas thereby calling for improvedmanagement practices. Our results show that 50 highlyinformative SNPs could be a cost-effective tool to enhanceconservation efforts as they are sufficient to accurately detectC-lineage introgression in the sampled native honey beepopulations.
Population StructureTo analyze population structure, we employed a set of differentcluster approaches which all revealed a significant and clearseparation between the well-known evolutionary M- and C-lineage (Ruttner, 1988; Garnery et al., 1992). But, as indicatedby the final topology of the network-based clustering tree(Figure 2A), honey bees are further characterized by a highlevel of hierarchical structure. By integrating the model-basedadmixture results in the final network visualization, we can thussee that the admixture proportions are related to the geneticrelationship between individuals. It is well known, but notoften discussed, that model-based approaches, such as thoseimplemented in ADMIXTURE, are highly dependent on thereference sampling populations and rely on prior assumptions(Pritchard et al., 2000; Greenbaum et al., 2016). For instance,highly related individuals can form an artificial substructureshowing no or very little admixture, and as a consequence moredistantly related individuals show increased levels of admixture(Pritchard et al., 2000). This emphasizes the importance to becautious when interpreting admixture levels and when possibleto choose diverse and unrelated individuals. In our case, dueto the sampling bias of many more Swiss than French A. m.mellifera samples, admixture levels in the latter could thusbe slightly overestimated. Ideally, to overcome the samplingbias, an optimized approach would be to combine networkclustering with model-based analyses and classical PCA, as thesecomplement each other and thus give a more robust and detailedpicture (Neuditschko et al., 2012; Greenbaum et al., 2016).This is the advantage of our combined network visualization;it illustrates both the genetic relationships between individualsand admixture levels, which is crucial for the interpretation ofthe observed population structures (Neuditschko et al., 2012).Therefore, the network clustering is highly suitable to identifycommunity structures corresponding to the four subpopulationsin this dataset (A. m. carnica, Buckfast, A. m. mellifera fromSwitzerland and France). Furthermore, admixed individuals canbe easily spotted.
The substructure between Swiss and French A. m. melliferais surprising, given the large mating distances of honey beedrones from their colony of origin (Neumann et al., 1999c).Here, we found already some population differentiation on ashort distance of∼40 km between the conservatory in the FrenchAlps and Swiss A. m. mellifera. The reasons for this findingcan be manifold including genetic drift, differential beekeepingpractices or even local adaptations. Isolation-by-distance couldbe explained with the Alps acting as natural barriers against geneflow between North (Switzerland) and South (France). However,within Switzerland no such effect could be detected even thoughmassive mountain ranges separate native bees in different valleys.As honey bee queens are bought and sold throughout the countryone could expect less or no substructures within Switzerlanddue to human-mediated gene-flow. Alternatively, there mightbe locally adapted ecotypes within A. m. mellifera. Given thelarge native range of A. m. mellifera (from France over CentralEurope, the British Isles and Southern Scandinavia to the UralMountains, Ruttner, 1988), it does not seem surprising thatthere are substructures or ecotypes within this subspecies. For
Frontiers in Ecology and Evolution | www.frontiersin.org 10 December 2016 | Volume 4 | Article 140
Parejo et al. Honey Bee Conservation Genomics
instance, ecotypes of A. m. mellifera with particular broodcycles adapted to the local flora have already been described inFrance (Louveaux et al., 1966; Strange et al., 2007, 2008). Moreimportantly, with regard to honey bee health, locally adaptedhoney bee populations may have evolved their own specificresistance mechanisms matching the prevailing pathosphere theyare located in (genotype-environment interactions) (Meixneret al., 2015). In order to protect and promote native honey bees itis therefore essential to identify substructures and locally adaptedecotypes.
Genetic DiversityAll identified populations, including both native French andSwiss honey bees exhibit high genetic variation, which iscomparable to other tested populations from C- and M-lineageor mixed background, respectively (Wallberg et al., 2014; Wragget al., 2016). This genetic diversity is important to preserve asit harbors the adaptive potential for future needs (Frankhamet al., 2002) and enhances productivity and fitness (Mattila andSeeley, 2007). On the other hand, genetic admixture throughthe importation and hybridization with distant subspecies candisrupt the locally adapted genetic variation (De La Rúa et al.,2009). The lowest genetic diversity was found in theA. m. carnicapopulation, which was introduced into Switzerland in the 1960’s,becoming very popular for apiculture and as a consequence wasincreasingly managed. The higher artificial selection pressureon this subspecies could therefore explain the lower geneticdiversity. Similarly, populations of the C-lineage from otherpublished studies (e.g., Wallberg et al., 2014; Wragg et al., 2016)exhibited lower genetic diversity and were sampled from selectivebreeding populations. An alternative explanation, however, couldbe a lower effective population size through a founder effectwhen introducing A. m. carnica to Switzerland in the first place.The highest genetic diversity was found in the hybrid Buckfast,which is in line with previous work that showed that highgenetic diversity can be promoted through admixture by humanmanagement in mixed domestic bee populations (Harpur et al.,2012; Wallberg et al., 2014).
Admixture in the Conservation AreasDespite the high genetic diversity found in native populations,we also identified some highly admixed individuals in theconservation areas, which is a concern and indicates that themanagement practices may need some adjustment. A previousanalysis of 12 microsatellites in the Swiss A. m. melliferabreeding population sampled in 2003 showed similar levels ofadmixture (Soland-Reckeweg et al., 2009). More recently, in2013, an analysis of 1381 SNPs in A. m. mellifera populationssampled throughout Europe also found admixed individualsin Switzerland (Pinto et al., 2014). While it is not possible todirectly compare these studies because of the different samplingstrategies and methodologies employed, all studies including thepresent one show that despite ongoing conservation efforts inSwitzerland considerable C-lineage introgression in the A. m.mellifera population remains. Therefore, protection of the nativepopulation should be reinforced.
Yet, there are some differences in admixture levels betweenthe five sampled conservation areas, which could be attributedto varying management practices. Alternatively, such differencesmight be linked to the time since the establishment ofthe conservatories. The Glarus conservatory (CGL) is theoldest (established in 1977) and largest conservation areain Switzerland, and shows the lowest level of C-lineageintrogression. On the other hand, the Val Mustair conservatory(CVM), a remote region in southeastern Switzerland with a longnative bee keeping tradition, but officially established in 2006only, suffers from increased admixture. After inquiring with themanagement of this particular conservatory the increased levelof admixture is the result of an A. m. carnica-beekeeper, whorecently moved to the area. Thus, our data demonstrates thatthe genetic consequences are immediately measurable. Moreover,there is a need for an increased legal protection of conservationareas, as evidenced by the drastic effects of this single migratorybeekeeper on conservation efforts. The French conservatory inSavoie (CSA) also displays admixed individuals. In this breedingprogram identification has beenmainly based onmorphometrics,which can have less resolution than genetic markers (Franciset al., 2014). In addition, France has a long history of foreignqueen importation with many large-scale commercial apiaristskeeping C-lineage bees (Franck et al., 1998; Garnery et al., 1998;Wragg et al., 2016). This increases the chance of introgression inthe native gene pool.
Surprisingly, we found little admixture in native bees sampledfrom outside conservation areas. Our sampling scheme did notinclude randomly sampled bees from all of Switzerland, butdepended on the willingness of beekeepers to participate. Thus,we would expect that there might be different levels of admixtureunder a totally random and unbiased sampling scheme. Yet, ourresults indicate that the keeping of pure native bees even outsidea protected area is possible. To do so, motivated beekeepersinvolved in the maintenance and conservation of A. m. melliferabring their virgins queens to controlled mating stations or buyqueens from certified breeders. Our results suggest that thisapproach seems successful in Switzerland.
In contrast, maintaining freely-mating populations withminimal risk of introgression will require considerablemonitoring efforts given the relatively small size of Swissconservation areas. Consequently, in the longer term there isa need for the implementation of an enhanced internationalconservation strategy to preserve the native subspecies A. m.mellifera in apiculture. To this end, it is important to consistentlyand repeatedly test all colonies in the conservation areas forC-lineage introgression because of the natural movement ofhoney bees. Traditionally, morphometric analyses and morerecently, microsatellite markers have been employed to detectand replace hybrid colonies (Soland-Reckeweg et al., 2009). Aneven more accurate tool would be a set of diagnostic SNPs tocontrol mating stations and conservation areas as shown in thisstudy (Hauser et al., 2011; Francis et al., 2014).
Informative SNP PanelsThe high differentiation between introduced bees (A. m. carnicaand Buckfast) belonging mainly to the evolutionary C-lineage
Frontiers in Ecology and Evolution | www.frontiersin.org 11 December 2016 | Volume 4 | Article 140
Parejo et al. Honey Bee Conservation Genomics
and the native A. m. mellifera from the M-lineage, allowedto straightforwardly identify ancestry informative or even fixedSNPs. This high differentiation between the M- and C-lineagesis also the reason why even randomly selected SNPs performedrelatively well compared to other selection methods. Yet, theresults clearly show that as few as 50 most informative SNPsare sufficient to distinguish native from introduced honeybees. The UncorrFST-50 panel outperformed the other 50-SNPpanels in both the ability to predict admixture as well asgenetic relationships, thereby suggesting their potential for asuccessful application in sustainable bee breeding programs.Such low density SNP panels have been developed successfullyfor breeding and breed assignment for a number of differentlivestock species (Boichard et al., 2012; Wellmann et al., 2013;Henshall et al., 2014). For honey bees, Muñoz et al. (2015)have previously generated sets of ancestry informative markers(AIMs) based on different selection methods to infer admixturebetween A. m. mellifera and C-lineage (A. m. carnica and A.m. ligustica). However, due to the hybrid origin of Buckfastbees, it might pose more difficulties to detect admixturewith Buckfast than with pure C-lineage bees. Moreover, thefull dataset of Muñoz et al. (2015) consisted of 1183 pre-selected SNPs from a previous study, while here we selectedthe most informative SNPs from whole-genome sequenceinformation.
The application of only 50 SNPs might seem quite low forgeneticists working with other livestock animals. However, giventhe fact that the beekeeping industry in Switzerland, and inmost parts of Europe is based on leisure apiculturists (Chauzatet al., 2013), there is a general need for an economic approachto foster participation in conservation efforts. However, thereis a trade-off between resolution and economics which posesa minor risk of failing to detect very low levels of admixture.A brief inquiry on current genotyping costs (August 2016)revealed the price per SNP as little as 0.50 €, which is expectedto decrease even further thereby enabling the cost-effectivetesting of thousands of bees for a continental conservationstrategy across Europe. Due to the low number of SNPs requiredfor admixture analyses, it would also be possible to enhancestakeholder acceptance by including additional SNPs linked totraits of commercial interest, as is already implemented in customSNP panels for other livestock species (Schwenger et al., 1993;Pannier et al., 2010). For honey bees, one such example couldbe to incorporate SNPs linked to resistance against Varroadestructor (Haddad et al., 2016; Spötter et al., 2016), given thatthis ectoparasitic mite is a significant contributor to global honeybee colony losses (Guzmán-Novoa et al., 2010; Dainat et al.,2012).
CONCLUSION
In this study, we demonstrated that the combination of model-based and network-based clustering allows us to identify high-resolution population structures between subspecies, whichcan be especially useful to identify locally adapted honeybee populations for conservation purposes and management
decisions optimizing genetic diversity. For honey bees highgenetic diversity, as we found in all identified populations, isparticularly important for colony health (Tarpy, 2003) and entailsthe potential to adapt to new environmental conditions such asclimate change or novel diseases.
As observed by this and other studies, hybrid colonies canbe found throughout the native range of A. m. mellifera (Jensenet al., 2005a; Soland-Reckeweg et al., 2009; Pinto et al., 2014).It is clear that in such a diverse situation it is not possibleto entirely prevent the natural movement of these hybrids andof foreign honey bees into conservatories. As a result, despitecurrent ongoing conservation efforts, admixed individuals werestill found in all conservation areas albeit with varying degreesof introgression thereby calling for improved managementpractices.
The use of ancestry informative SNPs for subspeciesdiscrimination and estimation of admixture can thereby proveto be a very useful tool for enhancing conservation managementefforts. We demonstrated that the selected ultra-low densitySNP panel is accurate to estimate admixture and geneticrelationships between the sampled honey bees. We thereforehope to contribute to the conservation efforts in order to ensurethe valuable pollination services provided by our honey bees inthe future.
DATA ACCESS
Swiss bee sequence data is deposited at the European NucleotideArchive (ENA: http://www.ebi.ac.uk/ena) under study accessionnumber: PRJEB16533. The sequence data of the bees fromSavoie are available through the SeqApiPop programme on theSequence Read Archive (SRA: https://www.ncbi.nlm.nih.gov/sra)with accession: SRP069814.
AUTHOR CONTRIBUTIONS
Conceived and designed the study: MP, LG, PN, MN. Collecteddata: MP, LG. Analysed and interpret the data: MP, DW, AV, PN,MN. Wrote and approved final manuscript: MP, DW, LG, AV,PN, MN.
FUNDING
This work was funded by the Swiss Federal Office for AgricultureFOAG and the Fondation Sur-la-Croix, Basel. Data for the Savoiesamples was provided by the SeqApiPop programme, funded bythe FranceAgriMer grant 14-21-AT. The GeT platform, Toulouse(France), is a partner of the National Infrastructure FranceGénomique, thanks to support by the Commissariat aux GrandsInvetissements (ANR-10-INBS-0009).
ACKNOWLEDGMENTS
Sequencing was performed at the GeT PlaGe platform inToulouse, France. Bioinformatic analyses were performed
Frontiers in Ecology and Evolution | www.frontiersin.org 12 December 2016 | Volume 4 | Article 140

Parejo et al. Honey Bee Conservation Genomics
on UBELIX (http://www.id.unibe.ch/hpc), the HPC clusterat the University of Bern. Switzerland. We thank thebeekeeping associations VSMB, SAR, SCIV, BIVS, VDRB,and CETA de Savoie and all beekeepers for providing thesamples.
SUPPLEMENTARY MATERIAL
The Supplementary Material for this article can be foundonline at: http://journal.frontiersin.org/article/10.3389/fevo.2016.00140/full#supplementary-material
REFERENCES
Adams, J., Rothman, E. D., Kerr, W. E., and Paulino, Z. L. (1977). Estimation of
the number of sex alleles and queen matings from diploid male frequencies in
a population of Apis mellifera. Genetics 86, 583–596.
Alexander, D. H., Novembre, J., and Lange, K. (2009). Fast model-based
estimation of ancestry in unrelated individuals. Genome Res. 19, 1655–1664.
doi: 10.1101/gr.094052.109
Allendorf, F. W., Luikart, G., and Aitken, S. N. (2013). Conservation and the
Genetics of Populations, 2nd Edn. Hoboken, NJ: Wiley-Blackwell.
Ausubel, F. (1988). “Current protocols inmolecular biology,” inUpdatedQuarterly,
eds M. Ausubel, R. Brent, R. E. Kingston, D. D. Moore, J. G. Seidman, J.
A. Smith, and K. Struhl (New York, NY: Greene Pub. Associates; Wiley-
Interscience), 1600. doi: 10.1002/mrd.1080010210
Bertrand, B., Alburaki, M., Legout, H., Moulin, S., Mougel, F., and Garnery,
L. (2015). MtDNA COI-COII marker and drone congregation area: an
efficient method to establish and monitor honeybee (Apis mellifera L.)
conservation centres. Mol. Ecol. Resour. 15, 673–683. doi: 10.1111/1755-0998.
12339
Blatt, M., Wiseman, S., and Domany, E. (1996). Superparamagnetic clustering of
data. Phys. Rev. Lett. 76:3251. doi: 10.1103/PhysRevLett.76.3251
Boichard, D., Chung, H., Dassonneville, R., David, X., Eggen, A., Fritz, S., et al.
(2012). Design of a bovine low-density SNP array optimized for imputation.
PLoS ONE 7:e34130. doi: 10.1371/journal.pone.0034130
Böttcher, F. K. (1975). Beiträge zur Kenntnis des Paarungsfluges der Honigbiene.
Apidologie 6, 233–281. doi: 10.1051/apido:19750304
Bouga, M., Alaux, C., Bienkowska, M., Büchler, R., Carreck, N. L., Cauia,
E., et al. (2011). A review of methods for discrimination of honey bee
populations as applied to European beekeeping. J. Apic. Res. 50, 51–84.
doi: 10.3896/IBRA.1.50.1.06
Büchler, R., Costa, C., Hatjina, F., Andonov, S., Meixner, M. D., Le Conte, Y., et al.
(2014). The influence of genetic origin and its interaction with environmental
effects on the survival of Apis mellifera L. Colonies in Europe. J. Apic. Res. 53,
205–214. doi: 10.3896/IBRA.1.53.2.03
Cantarel, B. L., Weaver, D., McNeill, N., Zhang, J., Mackey, A. J., and Reese,
J. (2014). BAYSIC: a bayesian method for combining sets of genome
variants with improved specificity and sensitivity. BMC Bioinformatics 15:104.
doi: 10.1186/1471-2105-15-104
Chang, C. C., Chow, C. C., Tellier, L. C. A. M., Vattikuti, S., Purcell, S. M., and
Lee, J. J. (2015). Second-generation PLINK: rising to the challenge of larger and
richer datasets. GigaScience 4:7. doi: 10.1186/s13742-015-0047-8
Chauzat, M. P., Cauquil, L., Roy, L., Franco, S., Hendrikx, P., and Ribière-Chabert,
M. (2013). Demographics of the European apicultural industry. PLoS ONE
8:e79018. doi: 10.1371/journal.pone.0079018
Chen, C., Liu, Z., Pan, Q., Chen, X., Wang, H., Guo, H., et al. (2016). Genomic
analyses reveal demographic history and temperate adaptation of the newly
discovered honey bee subspecies Apis mellifera sinisxinyuan n. ssp. Mol. Biol.
Evol. 33, 1337–1348. doi: 10.1093/molbev/msw017
Dainat, B., Evans, J. D., Chen, Y. P., Gauthier, L., and Neumann, P. (2012).
Predictive markers of honey bee colony collapse. PLoS ONE 7:e32151.
doi: 10.1371/journal.pone.0032151
Danecek, P., Auton, A., Abecasis, G., Albers, C. A., Banks, E., DePristo, M. A., et al.
(2011). The variant call format and VCFtools. Bioinformatics 27, 2156–2158.
doi: 10.1093/bioinformatics/btr330
De La Rúa, P., Jaffé, R., Dall’olio, R., Mu-oz, I., and Serrano, J. (2009). Biodiversity,
conservation and current threats to European honeybees. Apidologie 40,
263–284. doi: 10.1051/apido/2009027
Dinno, A. (2009). Exploring the sensitivity of horn’s parallel analysis to the
distributional form of random data. Multivariate Behav. Res. 44, 362–388.
doi: 10.1080/00273170902938969
Dinno, A. (2012). paran: Horn’s Test of Principal Components/Factors.
Dunn, O. J. (1964). Multiple comparisons using rank sums. Technometrics 6,
241–252. doi: 10.1080/00401706.1964.10490181
Eaton, J. W., Bateman, D., Hauberg, S., and Wehbring, R. (2014). GNU Octave
Version 3.8.1 Manual: A High-Level Interactive Language for Numerical
Computations. CreateSpace Independent Publishing Platform. Available online
at: http://www.gnu.org/software/octave/doc/interpreter/
Elsik, C. G., Worley, K. C., Bennett, A. K., Beye, M., Camara, F., Childers, C.
P., et al. (2014). Finding the missing honey bee genes: lessons learned from a
genome upgrade. BMC Genomics 15:86. doi: 10.1186/1471-2164-15-86
Enoch, M. A., Shen, P. H., Xu, K., Hodgkinson, C., and Goldman, D. (2006). Using
ancestry-informative markers to define populations and detect population
stratification. J. Psychopharmacol. 20, 19–26. doi: 10.1177/1359786806066041
Francis, R. M., Kryger, P., Meixner, M., Bouga, M., Ivanova, E., Andonov, S., et al.
(2014). The genetic origin of honey bee colonies used in the coloss genotype-
environment interactions experiment: a comparison of methods. J. Apic. Res.
53, 188–204. doi: 10.3896/IBRA.1.53.2.02
Franck, P., Garnery, L., Celebrano, G., Solignac, M., and Cornuet, J. M. (2000a).
Hybrid origins of honeybees from Italy (Apis mellifera ligustica) and Sicily (A.
m. sicula).Mol. Ecol. 9, 907–921. doi: 10.1046/j.1365-294x.2000.00945.x
Franck, P., Garnery, L., Solignac, M., and Cornuet, J. M. (1998). The
origin of west European subspecies of honeybees (Apis mellifera): new
insights from microsatellite and mitochondrial data. Evolution 52, 1119–1134.
doi: 10.2307/2411242
Franck, P., Garnery, L., Solignac, M., and Cornuet, J. M. (2000b). Molecular
confirmation of a fourth lineage in honeybees from the Near East. Apidologie
31, 167–180. doi: 10.1051/apido:2000114
Frankham, R., Ballou, J. D., and Briscoe, D. A. (2002). Introduction to Conservation
Genetics. Cambridge: Cambridge University Press.
Gallai, N., Salles, J.-M., Settele, J., and Vaissière, B. E. (2009). Economic valuation of
the vulnerability of world agriculture confronted with pollinator decline. Ecol.
Econ. 68, 810–821. doi: 10.1016/j.ecolecon.2008.06.014
Gao, X., and Starmer, J. D. (2008). AWclust: point-and-click software for
non-parametric population structure analysis. BMC Bioinformatics 9:77.
doi: 10.1186/1471-2105-9-77
Gärke, C., Ytournel, F., Bed’hom, B., Gut, I., Lathrop, M., Weigend, S.,
et al. (2012). Comparison of SNPs and microsatellites for assessing
the genetic structure of chicken populations. Anim. Genet. 43, 419–428.
doi: 10.1111/j.1365-2052.2011.02284.x
Garnery, L., Cornuet, J. M., and Solignac, M. (1992). Evolutionary history of the
honey bee Apis mellifera inferred from mitochondrial DNA analysis.Mol. Ecol.
1, 145–154. doi: 10.1111/j.1365-294X.1992.tb00170.x
Garnery, L., Franck, P., Baudry, E., Vautrin, D., Cornuet, J. M., and Solignac,
M. (1998). Genetic diversity of the west European honey bee (Apis mellifera
mellifera and A. m. iberica). II. Microsatellite loci. Genet. Sel. Evol. 30, S49–S74.
doi: 10.1186/1297-9686-30-S1-S49
Greenbaum, G., Templeton, A. R., and Bar-David, S. (2016). Inference and analysis
of population structure using genetic data and network theory. Genetics 202,
1299–1312. doi: 10.1534/genetics.115.182626
Guzmán-Novoa, E., Eccles, L., Calvete, Y., McGowan, J., Kelly, P. G., and Correa-
Benítez, A. (2010). Varroa destructor is the main culprit for the death and
reduced populations of overwintered honey bee (Apis mellifera) colonies in
Ontario, Canada∗ . Apidologie 41, 443–450. doi: 10.1051/apido/2009076
Haddad, N., Mahmud Batainh, A., Suleiman Migdadi, O., Saini, D.,
Krishnamurthy, V., Parameswaran, S., et al. (2016). Next generation sequencing
of Apis mellifera syriaca identifies genes for Varroa resistance and beneficial
bee keeping traits. Insect Sci. 23, 579–590. doi: 10.1111/1744-7917.12205
Han, F., Wallberg, A., and Webster, M. T. (2012). From where did the
Western honeybee (Apis mellifera) originate? Ecol. Evol. 2, 1949–1957.
doi: 10.1002/ece3.312
Harpur, B. A., Kent, C. F., Molodtsova, D., Lebon, J. M., Alqarni, A. S., Owayss,
A. A., et al. (2014). Population genomics of the honey bee reveals strong
Frontiers in Ecology and Evolution | www.frontiersin.org 13 December 2016 | Volume 4 | Article 140
Parejo et al. Honey Bee Conservation Genomics
signatures of positive selection on worker traits. Proc. Natl. Acad. Sci. U.S.A.
111, 2614–2619. doi: 10.1073/pnas.1315506111
Harpur, B. A., Minaei, S., Kent, C. F., and Zayed, A. (2012). Management increases
genetic diversity of honey bees via admixture. Mol. Ecol. 21, 4414–4421.
doi: 10.1111/j.1365-294X.2012.05614.x
Hauser, L., Baird, M., Hilborn, R., Seeb, L. W., and Seeb, J.E. (2011). An empirical
comparison of SNPs and microsatellites for parentage and kinship assignment
in a wild sockeye salmon (Oncorhynchus nerka) population. Mol. Ecol. Resour.
11, 150–161. doi: 10.1111/j.1755-0998.2010.02961.x
Henshall, J. M., Dierens, L., and Sellars, M. J. (2014). Quantitative analysis
of low-density SNP data for parentage assignment and estimation of
family contributions to pooled samples. Genet. Sel. Evol. 46, 1–17.
doi: 10.1186/s12711-014-0051-y
Hepburn, H., and Radloff, S. (1998). Honeybees of Africa. Heidelberg: Springer-
Verlag
Holm, S. (1979). A simple sequentially rejective multiple test procedure. Scand. J.
Stat. 6, 65–70.
Horn, J. L. (1965). A rationale and test for the number of factors in factor analysis.
Psychometrika 30, 179–185. doi: 10.1007/BF02289447
IPBES (2016). Summary for Policymakers of the Assessment Report of the
Intergovernmental Science-Policy Platform on Biodiversity and Ecosystem
Services on Pollinators, Pollination and Food Production. Bonn: Secretariat of
the Intergovernmental Science-Policy Platform on Biodiversity and Ecosystem
Services.
Jensen, A. B., Palmer, K. A., Boomsma, J. J., and Pedersen, B. V. (2005a). Varying
degrees of Apis mellifera ligustica introgression in protected populations of the
black honeybee, Apis mellifera mellifera, in northwest Europe. Mol. Ecol. 14,
93–106. doi: 10.1111/j.1365-294X.2004.02399.x
Jensen, A. B., Palmer, K. A., Chaline, N., Raine, N. E., Tofilski, A., Martin, S. J., et al.
(2005b). Quantifying honey bee mating range and isolation in semi-isolated
valleys by DNA microsatellite paternity analysis. Conserv. Genet. 6, 527–537.
doi: 10.1007/s10592-005-9007-7
Kauhausen-Keller, D., and Keller, R. (1994). Morphometrical control of pure
race breeding in the honey bee (Apis mellifera L.). Apidologie 25, 133–143.
doi: 10.1051/apido:19940202
Klein, A. M., Vaissière, B. E., Cane, J. H., Steffan-Dewenter, I., Cunningham,
S. A., Kremen, C., et al. (2007). Importance of pollinators in changing
landscapes for world crops. Proc. R. Soc. Lond. B Biol. Sci. 274, 303–313.
doi: 10.1098/rspb.2006.3721
Kosoy, R., Nassir, R., Tian, C., White, P. A., Butler, L. M., Silva, G., et al.
(2009). Ancestry informative marker sets for determining continental origin
and admixture proportions in common populations in America. Hum. Mutat.
30, 69–78. doi: 10.1002/humu.20822
Kruskal, W. H., and Wallis, W. A. (1952). Use of ranks in one-criterion variance
analysis. J. Am. Stat. Assoc. 47, 583–621. doi: 10.1080/01621459.1952.10483441
Li, H. (2011). A statistical framework for SNP calling, mutation
discovery, association mapping and population genetical parameter
estimation from sequencing data. Bioinformatics 27, 2987–2993.
doi: 10.1093/bioinformatics/btr509
Li, H., and Durbin, R. (2009). Fast and accurate short read alignment
with burrows-wheeler transform. Bioinformatics 25, 1754–1760.
doi: 10.1093/bioinformatics/btp324
Li, H., Handsaker, B., Wysoker, A., Fennell, T., Ruan, J., Homer, N., et al.
(2009). The sequence alignment/map format and SAMtools. Bioinformatics 25,
2078–2079. doi: 10.1093/bioinformatics/btp352
Liu, N., Chen, L., Wang, S., Oh, C., and Zhao, H. (2005). Comparison of single-
nucleotide polymorphisms and microsatellites in inference of population
structure. BMC Genet. 6:S26. doi: 10.1186/1471-2156-6-S1-S26
Louveaux, J., Albisetti, M., Delangue,M., and Theurkauff,M. (1966). LesModalités
De L’adaptation Des Abeilles (Apis Mellifica L.) au Milieu Naturel. Ann. Abeille
9, 323–350. doi: 10.1051/apido:19660402
Mantel, N. (1967). The detection of disease clustering and a generalized regression
approach. Cancer Res. 27, 209–220.
Mattila, H. R., and Seeley, T. D. (2007). Genetic diversity in honey
bee colonies enhances productivity and fitness. Science 317, 362–364.
doi: 10.1126/science.1143046
McKenna, A., Hanna, M., Banks, E., Sivachenko, A., Cibulskis, K., Kernytsky,
A., et al. (2010). The Genome Analysis Toolkit: a MapReduce framework for
analyzing next-generation DNA sequencing data. Genome Res. 20, 1297–1303.
doi: 10.1101/gr.107524.110
Meixner, M. D., Costa, C., Kryger, P., Hatjina, F., Bouga, M., Ivanova, E., et al.
(2010). Conserving diversity and vitality for honey bee breeding. J. Apic. Res.
49, 85–92. doi: 10.3896/IBRA.1.49.1.12
Meixner, M. D., Kryger, P., and Costa, C. (2015). Effects of genotype, environment,
and their interactions on honey bee health in Europe. Curr.Opin. Insect Sci. 10,
177–184. doi: 10.1016/j.cois.2015.05.010
Meixner, M. D., Pinto, M. A., Bouga, M., Kryger, P., Ivanova, E., and Fuchs, S.
(2013). Standard methods for characterising subspecies and ecotypes of Apis
mellifera. J. Apic. Res. 52, 1–28. doi: 10.3896/IBRA.1.52.4.05
Menozzi, P., Piazza, A., and Cavalli-Sforza, L. (1978). Synthetic maps
of human gene frequencies in Europeans. Science 201, 786–792.
doi: 10.1126/science.356262
Moritz, R. F. A. (1991). The limitations of biometric control on pure race breeding
in Apis mellifera. J. Apic. Res. 30, 54–59. doi: 10.1080/00218839.1991.11101234
Muñoz, I., Dall′Olio, R., Lodesani, M., and De La Rúa, P. (2014a).
Estimating introgression in Apis mellifera siciliana populations: are the
conservation islands really effective? Insect Conserv. Divers. 7, 563–571.
doi: 10.1111/icad.12092
Muñoz, I., and De La Rúa, P. (2012). Temporal analysis of the genetic diversity
in a honey bee mating area of an island population (La Palma, Canary Islands,
Spain). J. Apic. Sci. 56, 41–49. doi: 10.2478/v10289-012-0005-y
Muñoz, I., Henriques, D., Johnston, J. S., Chávez-Galarza, J., Kryger, P., and
Pinto, M. A. (2015). Reduced SNP panels for genetic identification and
introgression analysis in the dark honey bee (Apis mellifera mellifera). PLoS
ONE 10:e0124365. doi: 10.1371/journal.pone.0124365
Muñoz, I., Pinto, M. A., and De La Rúa, P. (2014b). Effects of queen importation
on the genetic diversity of Macaronesian island honey bee populations (Apis
mellifera Linneaus 1758). J. Apic. Res. 53, 296–302. doi: 10.3896/IBRA.1.53.2.11
Nei, M. (1982). Evolution of human races at the gene level. Prog. Clin. Biol. Res.
103(Pt A), 167–181.
Neuditschko, M., Khatkar, M. S., and Raadsma, H. W. (2012). NETVIEW: a
high-definition network-visualization approach to detect fine-scale population
structures from genome-wide patterns of variation. PLoS ONE 7:e48375.
doi: 10.1371/journal.pone.0048375
Neumann, P., and Carreck, N. L. (2010). Honey bee colony losses. J. Apic. Res. 49,
1–6. doi: 10.3896/IBRA.1.49.1.01
Neumann, P., Moritz, R. F. A., and Mautz, D. (1999a). Using DNA microsatellites
for maternity testing in honeybees (Apis mellifera L.). Apidologie 30, 505–512.
doi: 10.1051/apido:19990605
Neumann, P., Moritz, R. F. A., and Mautz, D. (2000). Colony evaluation is not
affected by drifting of drone and worker honeybees (Apis mellifera L.) at a
performance testing apiary. Apidologie 31, 67–79. doi: 10.1051/apido:2000107
Neumann, P., Moritz, R. F. A., and Van Praagh, J. (1999b). Queen mating
frequency in different types of honey beemating apiaries. J. Apic. Res. 38, 11–18.
doi: 10.1080/00218839.1999.11100990
Neumann, P., Van Praagh, J. P., Moritz, R. F. A., and Dustmann, J. H. (1999c).
Testing reliability of a potential islandmating apiary usingDNAmicrosatellites.
Apidologie 30, 257–276. doi: 10.1051/apido:19990402
Nicolas, P., Sun, F., and Li, L. M. (2006). A model-based approach to selection of
tag SNPs. BMC Bioinformatics 7:303. doi: 10.1186/1471-2105-7-303
O’connell, J., Gurdasani, D., Delaneau, O., Pirastu, N., Ulivi, S., Cocca, M., et al.
(2014). A general approach for haplotype phasing across the full spectrum of
relatedness. PLoS Genet. 10:e1004234. doi: 10.1371/journal.pgen.1004234
Oksanen, J., Blanchet, G., Kindt, R., Legendre, P., Minchin, P., Ohara, R., et al.
(2016). vegan: Community Ecology Package
Oleksa, A., Chybicki, I., Tofilski, A., and Burczyk, J. (2011). Nuclear and
mitochondrial patterns of introgression into native dark bees (Apis mellifera
mellifera) in Poland. J. Apic. Res. 50, 116–129. doi: 10.3896/IBRA.1.50.2.03
Pannier, L., Mullen, A. M., Hamill, R. M., Stapleton, P. C., and Sweeney, T. (2010).
Association analysis of single nucleotide polymorphisms in DGAT1, TG and
FABP4 genes and intramuscular fat in crossbred Bos taurus cattle.Meat Sci. 85,
515–518. doi: 10.1016/j.meatsci.2010.02.025
Paschou, P., Drineas, P., Lewis, J., Nievergelt, C. M., Nickerson, D. A.,
Smith, J. D., et al. (2008). Tracing Sub-Structure in the European
American Population with PCA-Informative Markers. PLoS Genet. 4:e1000114.
doi: 10.1371/journal.pgen.1000114
Frontiers in Ecology and Evolution | www.frontiersin.org 14 December 2016 | Volume 4 | Article 140
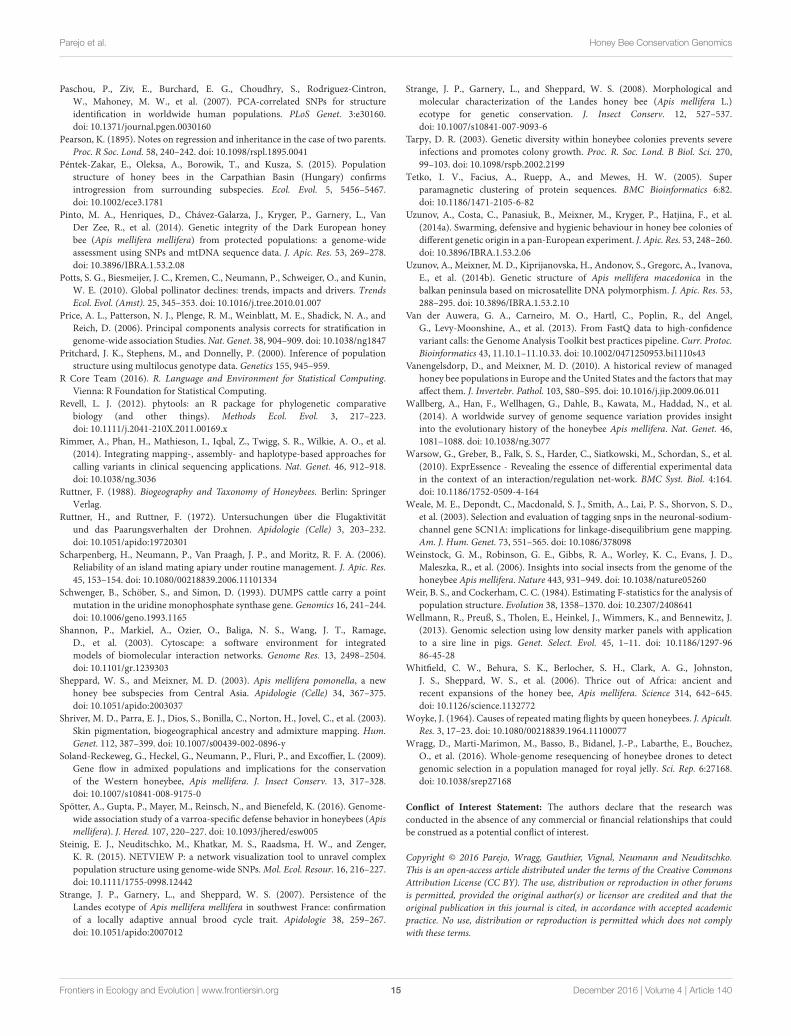
Parejo et al. Honey Bee Conservation Genomics
Paschou, P., Ziv, E., Burchard, E. G., Choudhry, S., Rodriguez-Cintron,
W., Mahoney, M. W., et al. (2007). PCA-correlated SNPs for structure
identification in worldwide human populations. PLoS Genet. 3:e30160.
doi: 10.1371/journal.pgen.0030160
Pearson, K. (1895). Notes on regression and inheritance in the case of two parents.
Proc. R Soc. Lond. 58, 240–242. doi: 10.1098/rspl.1895.0041
Péntek-Zakar, E., Oleksa, A., Borowik, T., and Kusza, S. (2015). Population
structure of honey bees in the Carpathian Basin (Hungary) confirms
introgression from surrounding subspecies. Ecol. Evol. 5, 5456–5467.
doi: 10.1002/ece3.1781
Pinto, M. A., Henriques, D., Chávez-Galarza, J., Kryger, P., Garnery, L., Van
Der Zee, R., et al. (2014). Genetic integrity of the Dark European honey
bee (Apis mellifera mellifera) from protected populations: a genome-wide
assessment using SNPs and mtDNA sequence data. J. Apic. Res. 53, 269–278.
doi: 10.3896/IBRA.1.53.2.08
Potts, S. G., Biesmeijer, J. C., Kremen, C., Neumann, P., Schweiger, O., and Kunin,
W. E. (2010). Global pollinator declines: trends, impacts and drivers. Trends
Ecol. Evol. (Amst). 25, 345–353. doi: 10.1016/j.tree.2010.01.007
Price, A. L., Patterson, N. J., Plenge, R. M., Weinblatt, M. E., Shadick, N. A., and
Reich, D. (2006). Principal components analysis corrects for stratification in
genome-wide association Studies.Nat. Genet. 38, 904–909. doi: 10.1038/ng1847
Pritchard, J. K., Stephens, M., and Donnelly, P. (2000). Inference of population
structure using multilocus genotype data. Genetics 155, 945–959.
R Core Team (2016). R. Language and Environment for Statistical Computing.
Vienna: R Foundation for Statistical Computing.
Revell, L. J. (2012). phytools: an R package for phylogenetic comparative
biology (and other things). Methods Ecol. Evol. 3, 217–223.
doi: 10.1111/j.2041-210X.2011.00169.x
Rimmer, A., Phan, H., Mathieson, I., Iqbal, Z., Twigg, S. R., Wilkie, A. O., et al.
(2014). Integrating mapping-, assembly- and haplotype-based approaches for
calling variants in clinical sequencing applications. Nat. Genet. 46, 912–918.
doi: 10.1038/ng.3036
Ruttner, F. (1988). Biogeography and Taxonomy of Honeybees. Berlin: Springer
Verlag.
Ruttner, H., and Ruttner, F. (1972). Untersuchungen über die Flugaktivität
und das Paarungsverhalten der Drohnen. Apidologie (Celle) 3, 203–232.
doi: 10.1051/apido:19720301
Scharpenberg, H., Neumann, P., Van Praagh, J. P., and Moritz, R. F. A. (2006).
Reliability of an island mating apiary under routine management. J. Apic. Res.
45, 153–154. doi: 10.1080/00218839.2006.11101334
Schwenger, B., Schöber, S., and Simon, D. (1993). DUMPS cattle carry a point
mutation in the uridine monophosphate synthase gene. Genomics 16, 241–244.
doi: 10.1006/geno.1993.1165
Shannon, P., Markiel, A., Ozier, O., Baliga, N. S., Wang, J. T., Ramage,
D., et al. (2003). Cytoscape: a software environment for integrated
models of biomolecular interaction networks. Genome Res. 13, 2498–2504.
doi: 10.1101/gr.1239303
Sheppard, W. S., and Meixner, M. D. (2003). Apis mellifera pomonella, a new
honey bee subspecies from Central Asia. Apidologie (Celle) 34, 367–375.
doi: 10.1051/apido:2003037
Shriver, M. D., Parra, E. J., Dios, S., Bonilla, C., Norton, H., Jovel, C., et al. (2003).
Skin pigmentation, biogeographical ancestry and admixture mapping. Hum.
Genet. 112, 387–399. doi: 10.1007/s00439-002-0896-y
Soland-Reckeweg, G., Heckel, G., Neumann, P., Fluri, P., and Excoffier, L. (2009).
Gene flow in admixed populations and implications for the conservation
of the Western honeybee, Apis mellifera. J. Insect Conserv. 13, 317–328.
doi: 10.1007/s10841-008-9175-0
Spötter, A., Gupta, P., Mayer, M., Reinsch, N., and Bienefeld, K. (2016). Genome-
wide association study of a varroa-specific defense behavior in honeybees (Apis
mellifera). J. Hered. 107, 220–227. doi: 10.1093/jhered/esw005
Steinig, E. J., Neuditschko, M., Khatkar, M. S., Raadsma, H. W., and Zenger,
K. R. (2015). NETVIEW P: a network visualization tool to unravel complex
population structure using genome-wide SNPs.Mol. Ecol. Resour. 16, 216–227.
doi: 10.1111/1755-0998.12442
Strange, J. P., Garnery, L., and Sheppard, W. S. (2007). Persistence of the
Landes ecotype of Apis mellifera mellifera in southwest France: confirmation
of a locally adaptive annual brood cycle trait. Apidologie 38, 259–267.
doi: 10.1051/apido:2007012
Strange, J. P., Garnery, L., and Sheppard, W. S. (2008). Morphological and
molecular characterization of the Landes honey bee (Apis mellifera L.)
ecotype for genetic conservation. J. Insect Conserv. 12, 527–537.
doi: 10.1007/s10841-007-9093-6
Tarpy, D. R. (2003). Genetic diversity within honeybee colonies prevents severe
infections and promotes colony growth. Proc. R. Soc. Lond. B Biol. Sci. 270,
99–103. doi: 10.1098/rspb.2002.2199
Tetko, I. V., Facius, A., Ruepp, A., and Mewes, H. W. (2005). Super
paramagnetic clustering of protein sequences. BMC Bioinformatics 6:82.
doi: 10.1186/1471-2105-6-82
Uzunov, A., Costa, C., Panasiuk, B., Meixner, M., Kryger, P., Hatjina, F., et al.
(2014a). Swarming, defensive and hygienic behaviour in honey bee colonies of
different genetic origin in a pan-European experiment. J. Apic. Res. 53, 248–260.
doi: 10.3896/IBRA.1.53.2.06
Uzunov, A., Meixner, M. D., Kiprijanovska, H., Andonov, S., Gregorc, A., Ivanova,
E., et al. (2014b). Genetic structure of Apis mellifera macedonica in the
balkan peninsula based on microsatellite DNA polymorphism. J. Apic. Res. 53,
288–295. doi: 10.3896/IBRA.1.53.2.10
Van der Auwera, G. A., Carneiro, M. O., Hartl, C., Poplin, R., del Angel,
G., Levy-Moonshine, A., et al. (2013). From FastQ data to high-confidence
variant calls: the Genome Analysis Toolkit best practices pipeline. Curr. Protoc.
Bioinformatics 43, 11.10.1–11.10.33. doi: 10.1002/0471250953.bi1110s43
Vanengelsdorp, D., and Meixner, M. D. (2010). A historical review of managed
honey bee populations in Europe and the United States and the factors that may
affect them. J. Invertebr. Pathol. 103, S80–S95. doi: 10.1016/j.jip.2009.06.011
Wallberg, A., Han, F., Wellhagen, G., Dahle, B., Kawata, M., Haddad, N., et al.
(2014). A worldwide survey of genome sequence variation provides insight
into the evolutionary history of the honeybee Apis mellifera. Nat. Genet. 46,
1081–1088. doi: 10.1038/ng.3077
Warsow, G., Greber, B., Falk, S. S., Harder, C., Siatkowski, M., Schordan, S., et al.
(2010). ExprEssence - Revealing the essence of differential experimental data
in the context of an interaction/regulation net-work. BMC Syst. Biol. 4:164.
doi: 10.1186/1752-0509-4-164
Weale, M. E., Depondt, C., Macdonald, S. J., Smith, A., Lai, P. S., Shorvon, S. D.,
et al. (2003). Selection and evaluation of tagging snps in the neuronal-sodium-
channel gene SCN1A: implications for linkage-disequilibrium gene mapping.
Am. J. Hum. Genet. 73, 551–565. doi: 10.1086/378098
Weinstock, G. M., Robinson, G. E., Gibbs, R. A., Worley, K. C., Evans, J. D.,
Maleszka, R., et al. (2006). Insights into social insects from the genome of the
honeybee Apis mellifera. Nature 443, 931–949. doi: 10.1038/nature05260
Weir, B. S., and Cockerham, C. C. (1984). Estimating F-statistics for the analysis of
population structure. Evolution 38, 1358–1370. doi: 10.2307/2408641
Wellmann, R., Preuß, S., Tholen, E., Heinkel, J., Wimmers, K., and Bennewitz, J.
(2013). Genomic selection using low density marker panels with application
to a sire line in pigs. Genet. Select. Evol. 45, 1–11. doi: 10.1186/1297-96
86-45-28
Whitfield, C. W., Behura, S. K., Berlocher, S. H., Clark, A. G., Johnston,
J. S., Sheppard, W. S., et al. (2006). Thrice out of Africa: ancient and
recent expansions of the honey bee, Apis mellifera. Science 314, 642–645.
doi: 10.1126/science.1132772
Woyke, J. (1964). Causes of repeated mating flights by queen honeybees. J. Apicult.
Res. 3, 17–23. doi: 10.1080/00218839.1964.11100077
Wragg, D., Marti-Marimon, M., Basso, B., Bidanel, J.-P., Labarthe, E., Bouchez,
O., et al. (2016). Whole-genome resequencing of honeybee drones to detect
genomic selection in a population managed for royal jelly. Sci. Rep. 6:27168.
doi: 10.1038/srep27168
Conflict of Interest Statement: The authors declare that the research was
conducted in the absence of any commercial or financial relationships that could
be construed as a potential conflict of interest.
Copyright © 2016 Parejo, Wragg, Gauthier, Vignal, Neumann and Neuditschko.
This is an open-access article distributed under the terms of the Creative Commons
Attribution License (CC BY). The use, distribution or reproduction in other forums
is permitted, provided the original author(s) or licensor are credited and that the
original publication in this journal is cited, in accordance with accepted academic
practice. No use, distribution or reproduction is permitted which does not comply
with these terms.
Frontiers in Ecology and Evolution | www.frontiersin.org 15 December 2016 | Volume 4 | Article 140