u.su suosulsulsuosu su.su.su suosul ulsuosu … · gtm research solar analysts: ... u.s. solar...
TRANSCRIPT

Q1 Q2 Q3 Q4 Q4 Q3 Q2 Q1 Q1 Q2 Q3 Q4
Q4 Q3 Q2 Q1 Q1 Q2 Q3 Q4 Q4 Q3 Q2 Q1
Q4 Q3 Q2 Q1 Q1 Q2 Q3 Q4 Q4 Q3 Q2 Q1
Q1 Q2 Q3 Q4 Q4 Q3 Q2 Q1 Q1 Q2 Q3 Q4
Executive Summary
U.S. Solar Market Insight™
2010 Year in Review

2© Copyright 2010 SEIA/GTM Research
U.S. Solar Market InSIghttM
U.S. Solar Market InsighttM
2010 InstallatIons, top 10 states
photovoltaIcs (MWdc)concentratIng solar poWer (MWac)
California 258.9 -
New Jersey 137.1 -
Nevada 61.4 -
Arizona 54.0 1.5
Colorado 53.6 1.0
Pennsylvania 46.8 -
New Mexico 42.8 -
Florida 35.2 75.0
North Carolina 30.7 -
Texas 22.6 -
Rest of U.S. 135.2 -
Total 878.3 77.5
1 IntrodUctIon
2010 was a banner year for the solar energy market in the United States. In contrast to U.S. GDP growth of 2.8%, the U.S. solar market grew 67% in value in 2010. Not only did the market expand greatly, but it showed substantial diversity across market segments, geography, and technologies. Solar is growing quickly across the U.S. at the residential, commercial, and utility scale levels. It is powering and heating buildings in all fifty states, and using
a variety of technologies to do so. The rapid growth and unique diversity has made the U.S. market a focus of global industry attention for the first time in many years. In 2010, the
U.S. solar market grew to reach $6.0 billion,
up from $3.6 billion in 2009.
Even with spectacular growth, the U.S. market is slowed by the complexities of state-by-state differences in regulations, incentives, utilities, and financing structures. Smart policies at the federal and state level, as well as a solid understanding of market conditions, are needed to continue and accelerate the
growth pattern in the U.S.
Year-in-review: ExECUTIvE SUMMARy
note: The figures to the left can be found in greater detail within the document.

3© Copyright 2010 SEIA/GTM Research
U.S. Solar Market InSIghttM
key FIndIngS:
Overall:
• The total size of the U.S. solar market grew 67% from $3.6 billion in 2009 to $6.0 billion in 2010.
• Solar electric installations in 2010 totaled 956 megawatts (MW) to reach a cumulative installed capacity of 2.6 gigawatts (GW).
Photovoltaics(Pv):
• Grid-connected Pv installations grew 102% in 2010 to reach 878 MW, up from 435 MW in 2009, bringing cumulative installed Pv capacity in the U.S. to 2.1 GW.
• Sixteen states each installed more than 10 MW of Pv in 2010, up from four states in 2007.
• Utility Pv installations more than tripled in 2010 to reach 242 MW, up from 70 MW in 2009.
• 52,600 Pv systems were connected in 2010, bringing the cumulative number of grid-connected Pv systems in the U.S. to 152,516.
• U.S. manufacturing of Pv components increased
substantially year-over-year for wafers (97% growth),
cells (81% growth), and modules (62% growth).
U.S. Solar Market InsighttM is a quarterly publication of
the Solar Energy Industries Association (SEIA®) and
GTM Research. Each quarter, we survey installers,
manufacturers, utilities, and state agencies to collect
granular data on photovoltaic (Pv), concentrating solar
power (CSP), and solar heating and cooling (SHC).
This data provides the backbone of Solar Market
InsightTM, in which we identify and analyze trends in
U.S. solar demand, manufacturing, and pricing by state
and market segment. We also use this analysis to
look forward and forecast demand over the next five
years. As the U.S. solar market expands, we hope
that Solar Market InsightTM will provide an invaluable
decision-making tool for installers, suppliers, investors,
policymakers and advocates alike.
See the back cover of this report for more information
ConcentratingSolarPower(CSP):
•The 75 MWac Martin Next Generation Solar Energy Center was completed in 2010; it is the largest U.S. CSP plant to come online in nearly 20 years.
•Cumulative CSP capacity from all 17 operating plants reached 507 MWac in 2010.
•Six U.S. states currently have operating CSP projects.
SolarHeatingandCooling(SHC):
•29,500 solar pool heating systems and 35,500 solar water heating systems were installed in 2010 alone, providing heat to a total of more than 65,000 homes, businesses and pools.
•California maintained its position as the leading installer of solar water heating systems in 2010 as the national market grew 5% to 2,426 thousand square feet (tsf), compared to 2,309 tsf in 2009.
•Solar pool heating rebounded from a five-year low in 2009 and grew 13% in 2010 to 10,096 tsf.
SeIa Policy and research division:
tom kimbis, Director of Policy & Research Justin Baca, Manager, Policy & ResearchSamantha Jacoby, Policy & Research Analyst
gtM research Solar analysts:
Shayle kann, Managing DirectorShyam Mehta, Senior AnalystBrett Prior, Senior AnalystMJ Shiao, Solar Analystandrew krulewitz, Research Associate

4© Copyright 2010 SEIA/GTM Research
U.S. Solar Market InSIghttM
2 PhotovoltaIcS
Photovoltaics (Pv), which convert sunlight directly to electricity, continue to be the backbone
of solar growth and markets in the U.S. 2010 was a record year for Pv in the U.S., with
the grid-connected market more than doubling to 878 MW installed. Prior to 2010, the
U.S. Pv market had grown at an average annual rate of 69% over the previous ten years,
rising from just 3.9 megawatts (MW) in 2000 to 435 MW in 2009. Despite this trend,
the U.S. constituted only 6.5% of global Pv demand in 2009. However, thanks to an
excellent photovoltaic resource, ample rooftop and land availability, and unrivaled electricity
consumption, the U.S. is considered among the most valuable Pv growth markets.
2.1 InStallatIonS
The U.S. saw remarkable expansion across all major market segments, growing at
a rate faster than in any recent year. Despite the U.S. emerging slowly from the
depths of recession, grid-connected Pv installations more than doubled in 2010
to 878 MW, representing 102% growth over 2009. Sixteen states each installed
more than 10 MW of Pv in 2010, up from four states in 2007, showing the growing
diversity of the U.S. market.
U.S. demand growth was, however, outpaced by a global market boom driven primarily
by the German and Italian markets. Over 17 GW were installed globally in 2010, more
than 130% growth over 2009. As a result, despite U.S. demand expansion, the U.S.
market share of global installations fell from 6.5% in 2009 to 5% in 2010. As Figure
2-1 displays, the U.S. has maintained a relatively steady share of global installations
since 2005, ranging between 5% and 6% each year. In 2011, the U.S. has the
opportunity to expand its share substantially with another doubling of installations
while the global market slows down.

5© Copyright 2010 SEIA/GTM Research
U.S. Solar Market InSIghttM
Full report contains annual and quarterly analysis of market trends
2.1.1MarketSegments
Most major national Pv markets are focused on a particular market segment. In
Japan, the residential market dominates. In Spain and Italy, large-scale Pv systems
drive the majority of demand. In Germany, residential and small commercial systems
reign. Historically in the U.S., non-residential installations (which include commercial,
public sector, and non-profit projects) drove the market, comprising more than 45% of
total installations alone. In 2010, however, both the residential and utility1 markets
expanded rapidly such that each of the three market segments contributed over 25%
of total installations. This diversity of market segmentation is ultimately one of the
greatest values of the U.S. market, as it reduces the market’s reliance on individual
segments and business models.
Figure 2-1: U.S. Pv Installations and Global Market Share, 2005-2010
1 Note: We define utility Pv as projects over 100 kW on the utility side of the meter with a utility or wholesale power purchaser.

6© Copyright 2010 SEIA/GTM Research
U.S. Solar Market InSIghttM
Full report contains market segmentation by state and quarter
Figure 2-2: Annual Installed Pv Capacity by Market Segment, 2005-2010
Figure 2-3: U.S. Pv Demand by Market Segment, 2005-2010

7© Copyright 2010 SEIA/GTM Research
U.S. Solar Market InSIghttM
• non-reSIdentIal installations were slow to recover from the financial crisis and remained
somewhat tepid through the first half of 2010. But as new incentives came online and
conditions for project finance improved, so did the non-residential sector. In the fourth
quarter, non-residential installations reached 127 MW, a near doubling over the first quarter
pace. These late-year projects were the beneficiaries of global module price declines in the
first half of the year, whereas the earlier projects were more often utilizing higher-priced
modules from late-2009 bids. For 2011, the outlook for non-residential installations is
mixed. Substantial growth potential remains in emerging markets (particularly in Northeast
states), but the end of Recovery Act funding for public sector projects will create a gap
where there was once a strong demand pull.
• reSIdentIal installations showed the most inter-quarter stability of any market segment
in 2010, growing from 62 MW in the first quarter to 74 MW in the fourth. This stability,
however, masks a large degree of volatility within many states because residential demand
is largely beholden to incentive funding availability. The residential market remains highly
disaggregated but consolidation is beginning to take place. In particular, residential
third-party ownership is becoming a vital offering for residential installers to have in
their toolbox, and the leading providers of this service have been expanding rapidly. The
2011 outlook for residential installations is strong and we anticipate substantial growth,
particularly in the second half of the year.
• UtIlIty installations were a breakout story in 2010. Prior to 2010, there was 113 MW of utility
Pv capacity operating in the U.S.; in 2010 the U.S. installed more than double that amount
(242 MW in total). This includes the largest project to date, Copper Mountain Solar, which
totals 55 MWdc (48 MWac). In 2011, the market will hit an even more pivotal point. There are
over 700 MW of utility Pv already contracted with expected 2011 completion dates. Utilities,
suppliers and financiers are watching these projects to determine the maturity and strength of
the sector. If the majority of these projects are successfully completed, the near-term growth
potential of utility Pv demand in the U.S. is virtually boundless. However, major roadblocks
including low contract prices and financing bottlenecks threaten to delay this growth. Finally,
some of the larger utility Pv projects will rely on the DOE Loan Guarantee program in order to
achieve project financing. If funding for this program is removed, the near-term outlook for the
largest projects will be decidedly more negative.

8© Copyright 2010 SEIA/GTM Research
U.S. Solar Market InSIghttM
Full report contains rolling 5-year demand forecast by state and by market segment
Full dataset contained within the Full report
Figure 2-4: U.S. Pv Demand by Market Segment, Q1 Through Q4 2010
Figure 2-5: 2010 U.S. Pv Installations by State and Market Segment

9© Copyright 2010 SEIA/GTM Research
U.S. Solar Market InSIghttM
2.1.2StateTrends
2010 was also a year of significant state market diversification. In 2007, only four U.S.
states installed over 10 MW of Pv each: California, New Jersey, Colorado and Nevada. By
2010, 16 states accomplished that feat. Even more notably, five states (Arizona, California,
Colorado, Nevada and New Jersey) installed over 50 MW each. Finally, New Jersey became
the second state to install over 100 MW in a single year. The impact of this trend would be
hard to overstate. In 2004-2005, California comprised around 80% of the U.S. Pv market,
but by 2010 California’s market share fell to less than 30%. As the California Solar Initiative
nears its sunset, the growth of secondary state markets becomes more crucial to overall
market growth. The fractured nature of the U.S. Pv market presents difficulties in achieving
efficiency through economies of scale. However, the U.S. market benefits from a variety of
incentives and market structures such that it is unlikely to experience a national boom/
bust cycle like those witnessed in European feed-in tariff markets. The more that secondary
markets can prove their worth, the more stable the national market will become.
Figure 2-6 displays Pv installations in the top ten states in 2010. Of these, four
states are new entrants to the list: Nevada, Pennsylvania, New Mexico and Texas.
On the whole, market share of the top 10 states fell from 92% in 2009 to 85% in
2010, another indicator of growing market diversity.
Figure 2-6: Installed Pv Capacity in Top 10 States, 2009-2010
State-by-state market analysis contained within the Full report

10© Copyright 2010 SEIA/GTM Research
U.S. Solar Market InSIghttM
2.2 InStalled PrIce
National weighted-average system prices fell by 20.5% over the course of 2010, from
$6.45/W to $5.13/W. Much of this decline was due to a shift toward larger systems,
particularly utility systems, in the fourth quarter.
The U.S. Pv market remains highly disaggregated, resulting in a wide range of installed
prices even within a given state, market segment, and quarter. Figure 2-7 displays the
range of installed system prices in the fourth quarter of 2010. Residential systems
were installed in certain locations (particularly Colorado and Arizona) at prices below
$5.00/W, but other locations saw residential system prices over $8.00/W. Non-residential
installations ranged from $4.11/W to $7.31/W. Utility installations show the most
variability, largely due to the choice between low- and high-efficiency modules and between
fixed and tracking mounting structures. Over time, it is possible that maturation of the
U.S. market will bring more consistency to system prices both within and across states.
Full report contains pricing by state and component pricing for polysilicon, wafers, cells, modules and inverters
Figure 2-7: National Weighted Average System Prices, 2010

11© Copyright 2010 SEIA/GTM Research
U.S. Solar Market InSIghttM
2.3 ManUFactUrIng ProdUctIon
2010 emerged as a banner year for domestic manufacturing of upstream Pv components,
as production increased substantially year-over-year for wafers (97% growth), cells (81%
growth), and modules (62% growth). In total, the U.S. produced 42,561 metric tons (MT)
of polysilicon, 624 MW of wafers, 1,058 MW of cells, and 1,205 MW of modules in 2010.
The strong growth in domestic manufacturing can be attributed to the following factors:
• Strong growth in global demand, from 7.1 GW in 2009 to over 17 GW in 2010 (a significant
percentage of U.S. component production is exported to markets such as Germany)
• doubling of domestic demand, from 435 MW in 2009, to 878 MW, which also played a large role
in stimulating domestic production
• Increases in manufacturing capacity in all manufacturing segments, both due to new plant
construction and the expansion of existing plants in 2010;
• U.S. wafer capacity increased by 82% to reach 1,018 MW
• U.S. cell capacity increased by 32% to reach 1,657 MW
• U.S. module capacity increased by 20% to reach 1,684 MW
• Production ramp-up from recently constructed facilities, particularly in thin film manufacturing
The highly impressive top-line results, however, mask continuing turbulence in the field
of domestic Pv manufacturing. Manufacturing is a global industry, and competition from
producers in low-cost regions such as China and Taiwan has introduced significant challenges
for manufacturers in the U.S., Europe, and Japan over the past eighteen months. As a
consequence, 2010 saw closure announcements at no fewer than three domestic Pv
manufacturing facilities: BP Solar’s wafer-cell plant in Maryland, Spectrawatt’s just-opened
cell plant in New york, and Evergreen Solar’s integrated 160 MW wafer-cell-module plant
in Massachusetts. Cost pressure on domestic plants is expected to continue to be an
issue through 2011, meaning that additional plant closures will not come as a surprise.
At the same time, however, 2011 should also see new plants being built, notably Wacker
Chemie AG’s polysilicon plant in Tennessee, Flextronics’ crystalline silicon module plant
in California, and Stion’s CIGS (Copper Indium Gallium Selenide) facility in Mississippi.

12© Copyright 2010 SEIA/GTM Research
U.S. Solar Market InSIghttM
Full report contains quarterly production by component
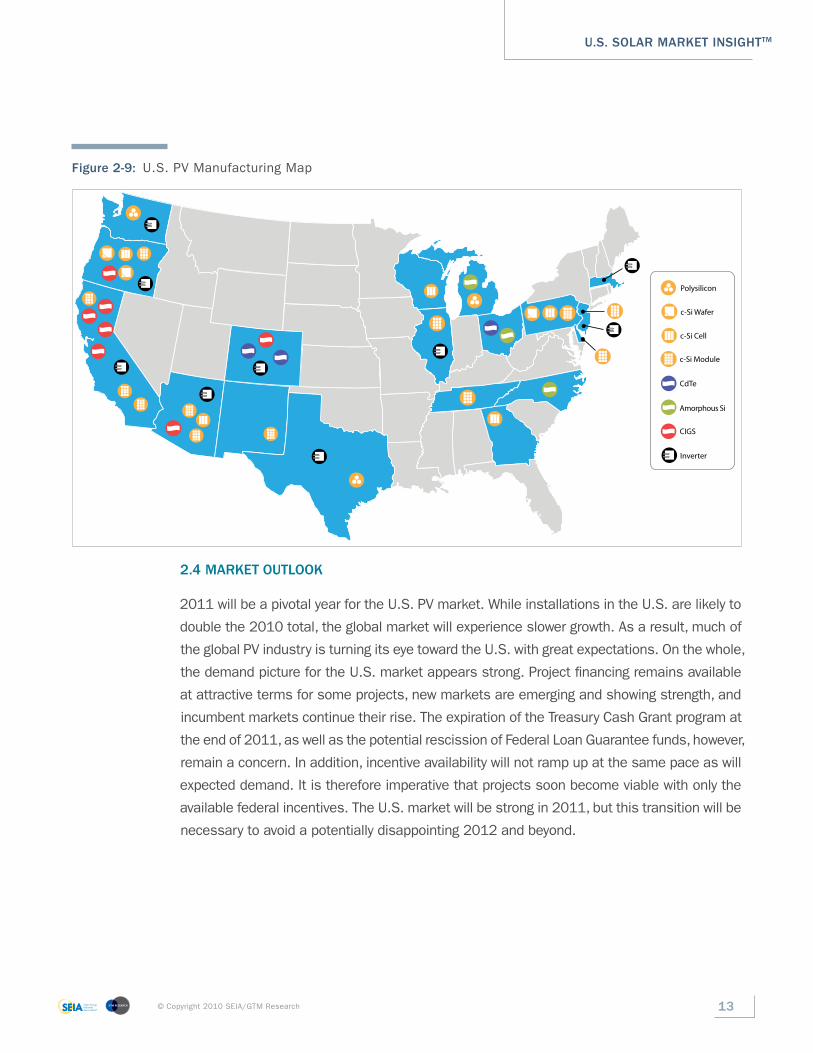
Figure 2-9 indicates the location of active domestic Pv manufacturing facilities. Of
the more than 2,000 companies in the U.S. solar value chain, there are at least 39
active facilities manufacturing Pv components (polysilicon, wafers, cells, modules,
inverters) spread across 17 states in the U.S. As can be seen, a great many of these
are located in California due to its leadership position as an end-market, as well
as the adjacent states of Oregon and Arizona, which offer skilled labor and strong
policy support for Pv manufacturers. While the Midwest has historically been dormant
on the Pv manufacturing front, recent plant announcements in Wisconsin, Indiana,
and Illinois suggest that this is changing quickly. The geographic shift towards the
Midwest seems to be taking place at the expense of states on the Eastern seaboard
such as Massachusetts, Maryland, New york, and New Jersey, which have seen a
total of five plant closures since mid-2009.
Figure 2-8: U.S. Pv Manufacturing Production, 2007-2010
13© Copyright 2010 SEIA/GTM Research
U.S. Solar Market InSIghttM
2.4 Market oUtlook
2011 will be a pivotal year for the U.S. Pv market. While installations in the U.S. are likely to
double the 2010 total, the global market will experience slower growth. As a result, much of
the global Pv industry is turning its eye toward the U.S. with great expectations. On the whole,
the demand picture for the U.S. market appears strong. Project financing remains available
at attractive terms for some projects, new markets are emerging and showing strength, and
incumbent markets continue their rise. The expiration of the Treasury Cash Grant program at
the end of 2011, as well as the potential rescission of Federal Loan Guarantee funds, however,
remain a concern. In addition, incentive availability will not ramp up at the same pace as will
expected demand. It is therefore imperative that projects soon become viable with only the
available federal incentives. The U.S. market will be strong in 2011, but this transition will be
necessary to avoid a potentially disappointing 2012 and beyond.
Figure 2-9: U.S. Pv Manufacturing Map
c-Si Wafer
Amorphous Si
c-Si Module
c-Si Cell
CdTe
CIGS
Polysilicon
Inverter

14© Copyright 2010 SEIA/GTM Research
U.S. Solar Market InSIghttM
3 concentratIng Solar Power (cSP)
There are four main types of CSP technologies: dish-engine, tower, Compact Linear Fresnel
Reflector (CLFR), and trough. In the U.S., concentrating solar power (CSP) experienced a
burst of project activity in California in the 1980s and then went quiet for two decades.
In the last several years, Spain’s feed-in tariff has allowed it to take the reins as the CSP
leader with over 580 MWac currently operating. But the U.S. is poised to regain leadership
with a CSP project pipeline of 41 projects for a combined 9 GWac under development in the
Southwest. 2010 was a big year for utility-scale solar projects on the permitting front, as
the Bureau of Land Management (BLM) granted approval for eight major solar projects,
including two Pv plants (Lucerne, Silver State), and six CSP plants (Ivanpah, Blythe,
Genesis, Amargosa, Imperial, and Calico). Two of these CSP projects, Imperial & Calico,
were later sold by Tessera/Stirling to Pv developers. But even as the dish-engine leader
was scaling back operations, other CSP developers were moving forward on plants that
will be the largest solar projects ever built. More specifically, in Q4 BrightSource closed
financing and broke ground on its 392 MWac Ivanpah tower plant, while Abengoa broke
ground on its 280 MWac Solana trough project.
Figure 3-1: CSP Annual Installed Capacity, 1982-2010

15© Copyright 2010 SEIA/GTM Research
U.S. Solar Market InSIghttM
3.1 InStallatIonS
In 2010, three CSP projects came online in the U.S. In Q1, the 1.5 MWac Tessera/Stirling
Maricopa Dish-Engine project was completed in Arizona. In Q2, the 1 MWac Abengoa Solar
Cameo Hybrid plant (also known as the Colorado Integrated Solar Project) came online in
Colorado. In Q4, FPL’s 75 MWac Martin Next Generation Solar Energy Center (MNGSEC)
entered commercial operation. The total installed capacity in 2010 was 77.5 MWac.
As shown in Figure 3-1, the CSP industry in the U.S. was effectively dormant from 1992
to 2006. In 2007, there was one project of scale: a 64 MWac trough plant in Nevada.
The last three years have seen the construction of several small demonstration plants
for various technologies: a 5 MWac CLFR plant in California in 2008, a 5 MWac tower
plant in California in 2009, and a 1 MWac micro-CSP plant in Hawaii in 2009. The
75 MWac FP&L Martin Solar plant in Indiantown, Florida came online in the fourth
quarter of 2010. The Martin plant is a hybrid plant, as it will connect to an existing
combined-cycle natural gas power plant at the site.
3.2 oUtlook
2011 is likely to be a light year for CSP with few projects expected to see completion
within the year. However, there are over 6.4 GWac of CSP projects with signed utility
power purchase agreements (PPAs) with expected completion between 2011 and 2017.
The first major growth year for CSP is expected in 2013 with at least eight projects
slated to be commissioned then. In subsequent years, increasing uncertainty regarding
financing, permitting, environmental converns and approvals surrounds the pipeline.
4 Solar heatIng and coolIng
The solar heating & cooling (SHC) category is composed of two distinct markets:
Solar Water & Space Heating (SWH) and Solar Pool Heating (SPH). The domestic SWH
market has grown on an annual basis since 2004. In 2010, the market was strong in
the first half of the year, faltered significantly in Q3, but recovered in Q4 to ultimately
increase rate of installations by approximately 5% over 2009. In total, 35,464 SWH
systems were installed in the U.S. in 2010.

16© Copyright 2010 SEIA/GTM Research
U.S. Solar Market InSIghttM
The SPH market hit a peak in 2006, and while it shrank significantly from 2007-2009, in
2010 it made a slight recovery with indications that this upward trend will continue in the
near term. 29,540 SPH systems were installed in the U.S. in 2010.
4.1 Solar water & SPace heatIng (Swh)
4.1.1 Swh Installations
Since 2004, installed capacity for solar water and space heating has increased each year.
In 2010, it is estimated that over 2,400 thousand square feet (tsf) of SWH capacity was
installed in the U.S., which equates to 158 MWth.2 While the growth rate of installations
slowed in 2010 compared to the previous year, the market has showed resilience even
during the economic downturn. In addition to the economy, the slowed growth of installed
capacity is also a result of low costs associated with conventional home heating methods,
particularly natural gas. After hitting a peak of over $20/thousand cubic feet (Mcf),
residential retail natural gas prices have hovered between $10-$15/thousand cubic feet
(Mcf) in the past year (source: EIA, Residential Natural Gas Prices). Thus, the payback
period for a SWH heating system is not as attractive as it was in previous years. Finally,
with a multitude of Pv incentives and low-interest financing available, many consumers
simply looking to install a solar system have been steered away from SWH systems as a
result of aggressive marketing campaigns enacted by large residential installers.
Full report contains annual and quarterly analysis of market trends
The top ten states for SWH installations in 2010 were, in order: California, Hawaii, Florida,
Arizona, Puerto Rico, Massachusetts, Colorado, North Carolina, Wisconsin, and New york.
Figure 4-1: SWH: Annual Installed Capacity by Market Segment, 2000-2010
2 MWth stands for megawatt-thermal and is a unit of thermal power produced. This is different from MW, which stands for megawatt-electric and is a unit of electric power produced.

17© Copyright 2010 SEIA/GTM Research
U.S. Solar Market InSIghttM
4.1.2 Installed Price
Installed prices for SWH vary greatly from quarter to quarter, state to state, and even
installation to installation. In states with warmer climates and better solar insolation, a
smaller SWH system will produce the same amount of energy as a larger system in a
more northerly state. Thus, less square footage of collectors is needed in places such as
Arizona, southern California and Puerto Rico. On the whole, these systems are generally
less expensive than systems installed in states such as Massachusetts or Wisconsin, but
the price per square foot is actually higher due to less overall collector capacity. A price jump
in Q4 can be attributed to the rate of installation slowing in northern states in accordance
with the onset of the winter months, while installations continued in states where weather
has little to no bearing on the market, thus driving up the average installed cost per sq ft.
4.1.3 outlook
We expect the domestic SWH market to continue to grow, but the actual growth rate is largely
dependent on the costs of conventional heating methods. Should the price of natural gas
and heating oil rise, we expect to see an accelerated growth in the SWH market. However, if
natural gas and oil prices remain the same or even drop below current levels, the growth rate
will be much lower. Recently, third-party ownership has been gaining hold in the non-residential
market. Similar to a PPA for a Pv system, installers charge the end customer for the energy
saved at a rate that is calculated from the prevailing utility rate minus a healthy discount. In
this model, no matter which direction utility rates move, the end customer always saves
money. This has yet to be scaled down for the residential market, but with over 20% of non-
residential systems installed in 2010 under third party ownership, we expect this percentage
to grow in the coming years especially if the installed system price of natural gas rises.
4.2 Solar Pool heatIng (SPh)
4.2.1 SPh Installations
After peaking in 2006, the U.S. SPH market experienced a drastic decline in demand from
2007 to 2009. This can be largely attributed to weak housing markets in regions where
pools and four-season swimming are prevalent: the South and the Southwest. In 2009 the
decline in installed capacity from years prior was particularly bad, primarily as a result of the
poor economy. 2010 breaks this trend, however. Recovery in both the economy and housing
markets has led to an increase in system installations, and in particular, non-residential

18© Copyright 2010 SEIA/GTM Research
U.S. Solar Market InSIghttM
systems have seen massive growth. We estimate that over 10,000 tsf of capacity was
installed in 2010; this represents a growth of 13% over 2009. Non-residential capacity
grew the most, by over 60%, as some states added incentives for these types of systems.
The top ten states for solar pool heating installations in 2010 were, in order: Florida,
California, Arizona, Oregon, Illinois, New york, Pennsylvania, Ohio, New Jersey and Nevada.
4.2.2 Installed Price
Like SWH, installed costs for SPH systems vary from quarter-to-quarter and state-to-
state. While the average cost per square foot increased by 7% between Q3 and Q4, over
the course of the year the average installation cost per square foot decreased by 12%.
4.2.3 outlook
The drought in SPH installations in recent years is most directly associated with the overall
health of the economy, especially in 2009. While SPH adds little cost relative to the cost
of a pool, SPH demand is closely related to demand for new pools at homes, community
centers, schools, hotels and sports clubs. As the economy and housing markets recover,
especially the rate of new home sales in market-leading states like California, Florida and
Arizona, we expect the SPH market to recover as well. Moreover, as consumers look for
ways to curb energy consumption, we also expect the number of retrofits to increase as well.
*All figures sourced from GTM Research. Data collection assistance for small utilities and “Other
States” provided by Larry Sherwood, IREC. For more detail on methodology and sources,
visit www.gtmresearch.com/solarinsight
Figure 4-2: Installed SPH Capacity by Market Segment, 2000-2010

SeIa® and gtM research deliver the Most comprehensive U.S. Solar Market analysis and Industry data available today
U.S. Solar Market Insight™ is a collaboration between the Solar Energy Industries Association® (SEIA®) and GTM Research that brings high-quality, solar-specific analysis and forecasts to solar industry professionals in the form of quarterly and annual reports.
These reports present market conditions, opportunities and outlooks for the photovoltaics (Pv), concentrating solar power (CSP) solar hot water and space heating (SWH) and solar pool heating (SPH) markets in the U.S. Primary data for the reports is collected directly from installers, manufacturers, state agencies and utilities. That data is analyzed to provide comprehensive upstream and downstream analysis on installations, costs, manufacturing, and market projections.
U.S. Solar Market Insight™ is offered in two versions– Executive Summary and Full Report. The Executive Summary is free, and the Full Report is available individually each quarter or as part of an annual subscription. Please find a description of each publication below with a more detailed content and pricing matrix on the reverse side of this page.
2010 year-In-revIew: key FIndIngS
Pv: Grid-connected Pv installations grew 102% to reach 878 MW in 2010
Pv: 16 individual states installed more than 10 MW of Pv in 2010
Pv: Utility Pv installations more than tripled to reach 242 MW in 2010
Pv: U.S. manufacturing surges year-over-year for wafers, cells, and modules
cSP: First commercial-scale plant since Nevada Solar One enters operation
Shc: Overall SHC market grows 5% in 2010
› National aggregate capacity additions and number of installations
› National weighted average installed price
› National aggregate manufacturing production (modules & collectors)
execUtIve SUMMary FUll rePort
› Installations (number and capacity) by market segment in the top 20 states
› Installed cost by market segment for each state and national installed cost by system size
› National component pricing (polysilicon, wafer, cell, module, inverter, thermal collectors, thermal BOS)
› Manufacturing capacity and production by component by state
› Installed capacity by ownership model type
› Demand projections by technology, market segment, and state to 2015
2000 2001 2002 2003 2004 2005 2006 2007 2008 2009 1H
2010
Annual Installations 4 11 23 45 58 79 105 160 290 435 339
Cumulative Installations 12 23 45 91 148 227 332 492 782 1,217 1,555
0
200
400
600
800
1000
1200
1400
1600
1800
Ann
ual I
nsta
lled
Cap
acity
(MW
dc)
Grid-Connected U.S. PV Installed Capacity, 2000-1H 2010
Free
Q1 Q2 Q3 Q4 Q4 Q3 Q2 Q1 Q1 Q2 Q3 Q4
Q4 Q3 Q2 Q1 Q1 Q2 Q3 Q4 Q4 Q3 Q2 Q1
U.S. Solar Market Insight™
Q4 Q3 Q2 Q1 Q1 Q2 Q3 Q4 Q4 Q3 Q2 Q1
Q1 Q2 Q3 Q4 Q4 Q3 Q2 Q1 Q1 Q2 Q3 Q4
natIonal FocUS + deePer data and coMPonent data
For more information on U.S. Solar Market InsighttM, visit www.gtmresearch.com/solarinsight or www.seia.org/cs/research/solarinsight
For information on SeIa membership, visit www.seia.org/cs/membership

Capa
city
Add
ition
s
CSP
# of
Inst
alla
tions
Avg.
inst
alle
d pr
ice
Dem
and
proj
ectio
ns
Full Report
Executive Summary
N/A
NATIONAL
STATE*
executive Summary Full report - hard copy
Single Quarterly Report Annual Subscription (4 Reports)
SEIA® Members $1295 $3995
Non-SEIA® Members $2495 $7995
Full report - PdF enterprise license
Single Quarterly Report Annual Subscription (4 Reports)
SEIA® Members $1995 $5995
Non-SEIA® Members $3995 $9995
by M
arke
t Seg
men
t
Capa
city
Add
ition
s
Phot
ovol
taic
s
Dire
ct O
wner
ship
vs.
PPA
/Lea
se
# of
Inst
alla
tions
by M
arke
t Seg
men
t
Avg.
inst
alle
d pr
ice
by M
arke
t Seg
men
t
Syst
em s
ize
Avg.
com
pone
nt p
rice
Polysi
licon
Waf
ers
Cells
Mod
ule
Inve
rter
s
Dem
and
proj
ectio
ns
Polysi
licon
Waf
ers
Cells
Mod
ule
Inve
rter
s
Polysi
licon
Waf
ers
Cells
Mod
ule
Inve
rter
s
Man
ufac
turin
g pr
oduc
tion
by M
arke
t Seg
men
t
Man
ufac
turin
g pr
oduc
tion
Full Report Executive Summary N/A
NATIONAL
STATE*
PhotovoltaIcS
concentratIng Solar Power
rePort PrIcIng
Solar heatIng & coolIng
by M
arke
t Seg
men
t
Capa
city
Add
ition
s
Sola
r Hea
ting
& Co
olin
g
# of
Inst
alla
tions
by M
arke
t Seg
men
t
Avg.
inst
alle
d pr
ice
by M
arke
t Seg
men
t
Avg.
com
pone
nt p
rice
Colle
ctor
sBO
S Co
mp.
Dem
and
proj
ectio
ns
Colle
ctor
s
Man
ufac
turin
g pr
oduc
tion
by M
arke
t Seg
men
t
Full Report Executive Summary N/A
Man
ufac
turin
g ca
paci
ty
Colle
ctor
s
NATIONAL
STATE*
technology content tables by report type
* Indicates state-level analysis and granularity for top 20 state markets by technology.
Free
For more information on U.S. Solar Market InsighttM, visit www.gtmresearch.com/solarinsight or www.seia.org/cs/research/solarinsight
Q1 Q2 Q3 Q4 Q4 Q3 Q2 Q1 Q1 Q2 Q3 Q4
Q4 Q3 Q2 Q1 Q1 Q2 Q3 Q4 Q4 Q3 Q2 Q1
U.S. Solar Market Insight™
Q4 Q3 Q2 Q1 Q1 Q2 Q3 Q4 Q4 Q3 Q2 Q1
Q1 Q2 Q3 Q4 Q4 Q3 Q2 Q1 Q1 Q2 Q3 Q4