utilization of advanced clutter suppression algorithms for ... · utilization of advanced clutter...
TRANSCRIPT
Utilization of advanced clutter suppression algorithms for improved
standoff detection and identification of radionuclide threats Bogdan R. Cosofret
*a, Kirill Shokhirev
a, Phil Mulhall
a, David Payne
b, Bernard Harris
b
aPhysical Sciences Inc., 20 New England Business Center, Andover, MA USA 01810-1077;
bRaytheon Integrated Defense Systems, Tewksbury, MA, USA, 01876
ABSTRACT
Technology development efforts seek to increase the capability of detection systems in low Signal-to-Noise regimes
encountered in both portal and urban detection applications. We have recently demonstrated significant performance
enhancement in existing Advanced Spectroscopic Portals (ASP), Standoff Radiation Detection Systems (SORDS) and
handheld isotope identifiers through the use of new advanced detection and identification algorithms.
The Poisson Clutter Split (PCS) algorithm is a novel approach for radiological background estimation that improves the
detection and discrimination capability of medium resolution detectors. The algorithm processes energy spectra and
performs clutter suppression, yielding de-noised gamma-ray spectra that enable significant enhancements in detection
and identification of low activity threats with spectral target recognition algorithms. The performance is achievable at the
short integration times (0.5 – 1 second) necessary for operation in a high throughput and dynamic environment. PCS has
been integrated with ASP, SORDS and RIID units and evaluated in field trials. We present a quantitative analysis of
algorithm performance against data collected by a range of systems in several cluttered environments (urban and
containerized) with embedded check sources. We show that the algorithm achieves a high probability of
detection/identification with low false alarm rates under low SNR regimes. For example, utilizing only 4 out of 12 NaI
detectors currently available within an ASP unit, PCS processing demonstrated Pd,ID > 90% at a CFAR (Constant False
Alarm Rate) of 1 in 1000 occupancies against weak activity (7 - 8µCi) and shielded sources traveling through the portal
at 30 mph. This vehicle speed is a factor of 6 higher than was previously possible and results in significant increase in
system throughput and overall performance.
Keywords: radionuclide, identification algorithms, standoff detection, clutter suppression
1. ALGORITHM OVERVIEW AND IMPLEMENTATION
a. Overview of the Poisson Clutter Split Algorithm
The Poisson-Clutter Split (PCS) algorithm was developed for the detection and identification of radioactive sources
embedded in diverse radiological backgrounds and has been described in more detail elsewhere.1-3
The key innovation of
PCS lies in: 1) the use of a novel, nonlinear probabilistic representation of radiological backgrounds, 2) accurate
modeling of gamma counts based on Poisson statistics, and 3) the use of the Generalized Likelihood Ratio Test (GLRT)4
to simultaneously perform isotope detection and identification.
The variability among radiological background spectra collected at different locations over time can be attributed to two
mechanisms:
• Background clutter, i.e. changes in the energy-dependent count rate due to variations in isotopic composition at
different locales, weather conditions, etc.
• The random process of radioactive decay, described by Poisson statistics
The relative contribution of each mechanism depends on multiple factors, including detector sensitivity, integration time
and the isotopic diversity of the sampled environment. The variability of spectra collected by small detectors, e.g.
handheld Radio-Isotope Identifier Devices (RIID) such as Smiths’ RadSeeker,5 operating at high acquisition rates are
dominated by Poisson noise. Background clutter can be readily seen in gamma spectra produced by large systems, such
*[email protected]; phone 1 978 689-0003; fax 1 978 689-3232; psicorp.com
as the Standoff Radiation Detection System (SORDS)6 that incorporates more sensitive detectors. The PCS algorithm
was developed to accurately mitigate both sources of randomness in the radiological spectra by combining an accurate
model of the Poisson processes and an efficient representation of background clutter within a single probabilistic
framework. The resulting background estimation (model) is then used to assess the presence of a threat signature in any
acquired medium resolution spectrum, while at the same time performing isotope identification via correlation against a
known set of isotope library spectra. This approach utilizes the GLRT methodology to assign likelihood values to an
incoming gamma spectrum under two hypotheses:
H0: The spectrum originated from background only
H1: The spectrum originated from a combination of background and a source isotope
Detection against the isotope is reported if the ratio of likelihood under H1 to likelihood under H0 exceeds a pre-defined
threshold. The threshold is set based on an empirically determined value that corresponds to an operationally acceptable
Constant False Alarm Rate (CFAR).
Using an exact treatment of Poisson variability, the PCS formalism allows the calculation of likelihood values for a
particular background rate spectrum associated with the observed count spectrum. The PCS algorithm eliminates the
Poisson noise while preserving the rate variability (i.e. clutter) induced by the movement of the detector through a
cluttered environment. At the core of the PCS algorithm is the model of the background clutter. The model is generated
based on the analysis of representative set of spectra collected within a single or multiple environments. From the
background set, the PCS algorithm calculates the mean rate as a function of energy as well as the dominant and
nonlinear modes of spectral variations. As a result, the underlying rate, br
, of any background spectrum in the sampled
environments can be accurately parameterized with a limited number of coefficients, ( )Kwww ,..,1=r
. The coefficients
determine the spectral shape and amplitude of the rate, ( )wbbrrr
= . The PCS background clutter model, which
encompasses the mean rate spectrum, the modes of spectral variations, and the distribution of the coefficients allows
estimation of not only the underlying rate of any new short integration time (nominally 0.5 -1 sec) spectrum, but also the
probability of encountering such a rate within the environment,
( ) ( ) )()( wfwbpbprrrr
≡= (1)
where ( )wfr
is the probability distribution of the clutter parameters inferred from the background set.
In the presence of a radioactive source, the background rate, br
, is elevated by an energy-dependent contribution from
the source. The rate due to source alone is a product of an amplitude coefficient, α, and an isotope-specific “signature”,
i.e. a normalized spectral profile, sr
. The combined rate can then be expressed as,
),()( αλααλ wswbsbrrrrrrrr
=⋅+=⋅+= (2)
The amplitude of the source signal primarily depends on the distance between the source and the detector, the source
activity and the orientation of the detector relative to the source location. The clutter coefficients, wr
, and the source
amplitude α fully define the rate underlying any measured spectrum.
The PCS algorithm has been extensively tested and validated as part of several state-of-the-art radiation detection
systems operating in complex environments. In this paper, we present a synopsis of some of these measurements and
results. Furthermore, recent evaluation of PCS against the “Objects and Radiation Signatures Spanning Nuclear Threats”
supplied by Lawrence Livermore National Laboratory has demonstrated that the algorithm retains its performance
capability even under shielded and masked threat scenarios.7
b. Implementation of the PCS algorithm and its integration with several detector systems
The PCS algorithm is currently implemented in C ++ as a native executable code for real-time processing. It has been
compiled for both Windows OS and Linux. The code makes use of multicore architectures and parallel processing using
the Intel-based MKL 8.0.1 library. Benchmarking of the computational efficiency of the algorithm has demonstrated that
PCS processes a given spectrum in ~ 20 msec against a library of 16 isotopes on an Intel Core i7 2.80GHz, 4GB RAM
(Win7) processing station. Current efforts are directed at the PCS implementation on a dual core ARM Cortex A-9
architecture. This capability will allow PCS-based isotope detection and identification on small hand-held devices with
long battery life. Our initial tests on the Xilinx evaluation hardware indicate that the PCS execution time will be
between 500 and 800 milliseconds per processed spectrum.
The level of PCS integration with SORDS (Raytheon’s Trimodal Imager6), ASP and RIID (RadSeeker) varied
depending on the application. In the case of RadSeeker, PCS was installed on a laptop computer connected to the
instrument via a USB interface. The PCS application monitored a local directory for incoming 0.5 second integration
time spectra acquired and deposited by RadSeeker, followed by direct ingestion and real-time processing. A PCS
enabled RadSeeker was demonstrated to provide isotope detection and identification at a rate of 1 Hz. A higher level of
integration was achieved for both ASP and SORDS. For example, PCS interfaced directly with the ASP database server
which resides on an Ethernet backbone along with the ASP sensor computers. The PCS application computer was
connected to this same backbone. To enable access into the ASP data system, an Application Programming Interface
(API) in the form of a 32-bit Windows DLL was developed. The API permits calls across the Ethernet backbone into
the database server to pull individual spectra from the database. In addition to the approach for allowing requests for
spectra, the API provided a method which allowed the PCS application to query the Packet Sequence Number (PSN) of
the most recent spectrum stored in the database or previous spectra in the form of playback. Once an initial PSN was
obtained, the PCS application made requests of the database in groups of 5 PSNs each time. The returned group
consisting of 1/10 of a second integration time spectra were then accumulated to produce 0.5 second integration time
spectral data for PCS processing. For RadSeeker and ASP, PCS results were provided to the user in near real time with
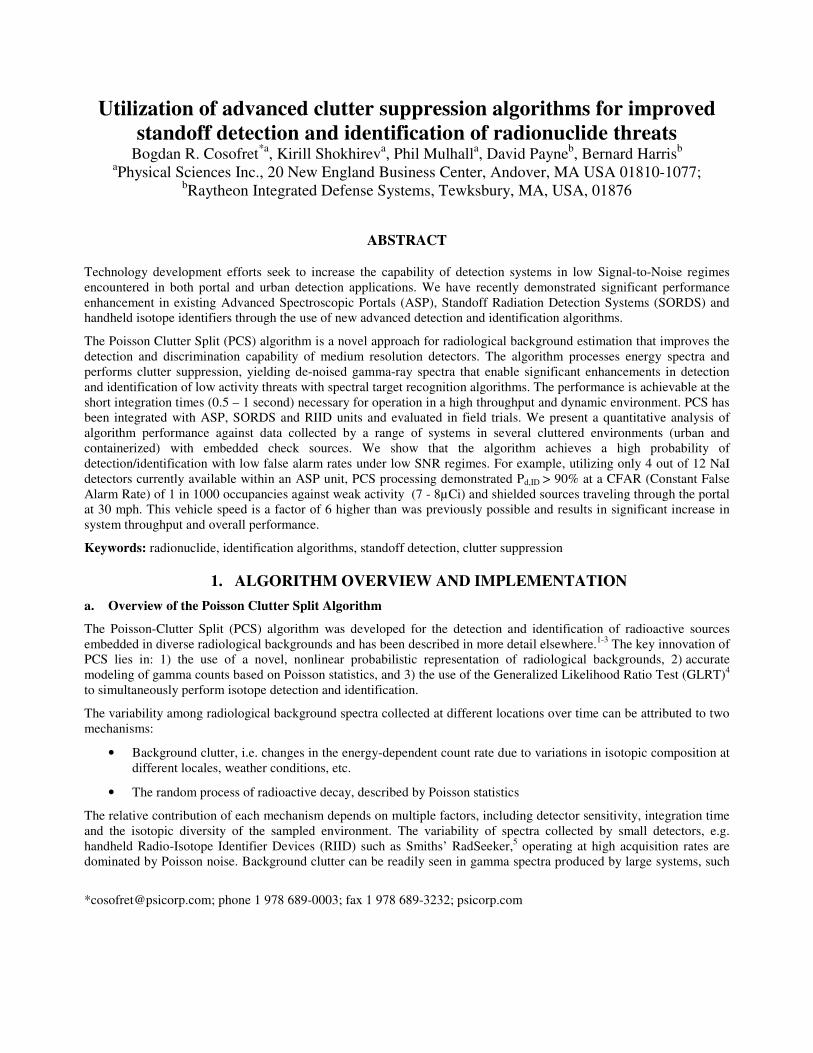
isotope detection and identification alarms displayed within the Graphical User Interface (GUI) of the PCS application.
Figure 1a shows a typical display of an isotope specific PCS signal exceeding the CFAR threshold along with the
associated alarm indicating the presence of 137
Cs (color coded for each isotope). In the case of SORDS, PCS isotope
specific alarms and confidence levels were integrated directly with the primary system GUI (see Figure 1b) and
displayed on the laptop computer mounted in front of the truck’s passenger seat. The PCS-enabled systems were
extensively characterized as a function of key performance parameters: environment, source activity, range, etc. Section
2 is a summary of our key findings.
Figure 1. Graphical User Interface for a) ASP and RadSeeker and b) SORDS.
2. FIELD MEASUREMENTS AND RESULTS
a. PCS Performance evaluation: SORDS
The PCS algorithm performance was previously validated against field data acquired by the ground-based SORDS
system developed by Raytheon and referred to as the Trimodal Imager (TMI). TMI has been described in detail
elsewhere.6 Briefly, the core of the TMI design employs two detector arrays. The front array is a coded aperture mask
with active NaI detectors in the blocked areas of the mask. The back array is made up of vertical NaI rectangular rods
with photomultiplier tubes (PMTs) on each end. The horizontal positional information comes from whichever rod is
active and the vertical information comes from the pulse height difference between the two PMTs. TMI was designed as
a passive imaging system, but for the PCS application, it was used as a combined (front + back arrays), large area NaI
detector.
The initial PCS performance assessment was generated as part of off-line processing using data collected by the system
and was reported in detail elsewhere.1 Utilizing the NaI back and front arrays, a total of 35,000 two second live time
spectra were generated from radiological background measurements collected over a 20 hour period while in transit from
DC, through Philadelphia, to Boston. A subset of 6,000 spectra were used to estimate a PCS background model, while
the remaining spectra were used to determine isotope specific thresholds for a Constant False Alarm Rate (CFAR) of 1
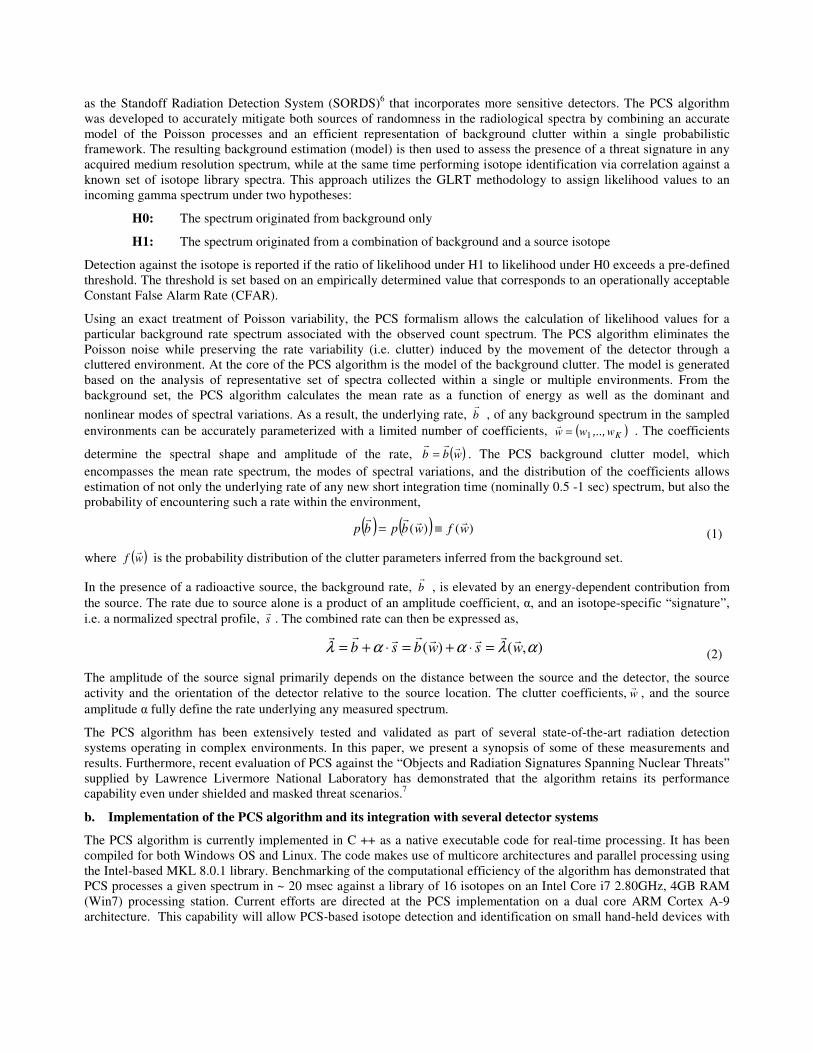
in 8 hours. The background model was then used for processing spectra collected at Savannah River where several 131
I
sources were inserted in the environment. The TMI vehicle approached the sources at ~ 25 – 30 mph, with the closest
approach being ~ 25 m. Figure 2 shows the PCS responses across several approaches by a 180 µCi 131
I source. The
results were generated with spectra acquired at 2 second integration time. It can be observed that the responses exceed
the 1 in 8 hour CFAR threshold for all 10 runs from ranges as far as 45 meters. Similarly, PCS successfully
demonstrated the ability to detect and identify a 90 µCi 131
I source from a range of ~ 30 meters in 5 out 5 runs at the
same CFAR settings using spectra acquired with 2 second integration time. Furthermore, no alarms against other
isotopes in the spectral library were obtained, thus affording a high level of isotope discrimination performance.1 PCS
demonstrated a significant increase in detection sensitivity at lower operational false alarms than the standard methods
available on the TMI system. As a result, a new effort was initiated to integrate PCS with the TMI system and
demonstrate improved capability while providing detection and identification alarms in real time. Below, we report on
results associated with recent field measurements collected with an integrated PCS-TMI capability.
Figure 2. PCS responses observed in post-processing of data collected during several TMI runs by a 180 µCi 131I source.
(Top) TMI motion vector (range to source) is plotted as a function of time with starred points indicating 131I positive
detections. (Bottom) PCS responses as a function of time with values exceeding 1 in 8 hour CFAR threshold corresponding
to instances when the TMI platform approached the 131I source.
PCS integrated with SORDS uses the following key operational parameters:
• An accurate background model that is specific to the current TMI configuration of 65 combined NaI detectors
integrated with the back and front arrays. The responses from all detectors are combined to provide spectra at
2 second integration time. The background model is based on the data collected during the DC-Boston
environmental sampling described above. It is important to note that all results presented below were collected
with only 57 out of 65 active NaI detectors installed in the TMI arrays.
• An isotope spectral library that contains the energy signatures of key isotopes along with their determined 1 in
8 hour CFAR thresholds. The current library contains the following 28 GADRAS8-derived signatures:
241Am,
133Ba,
109Cd,
57Co,
60Co,
137Cs, DU,
67Ga,
68Ge,
131I,
40K, LEU,
54Mn,
22Na,
237Np,
239Pu,
240Pu,
226Ra,
113Sn,
90Sr,
99mTc,
228Th,
232Th,
201Tl,
233U,
235U,
238U,
88Y. The CFAR thresholds (see Table I) were calculated based on the
analysis of the DC-Boston measurements in combination with GADRAS derived synthetic threat signals. The
PCS C-based code integrated on the TMI server processes an incoming 2 second gamma spectrum against the
28-isotope library in an average of 100 msec.
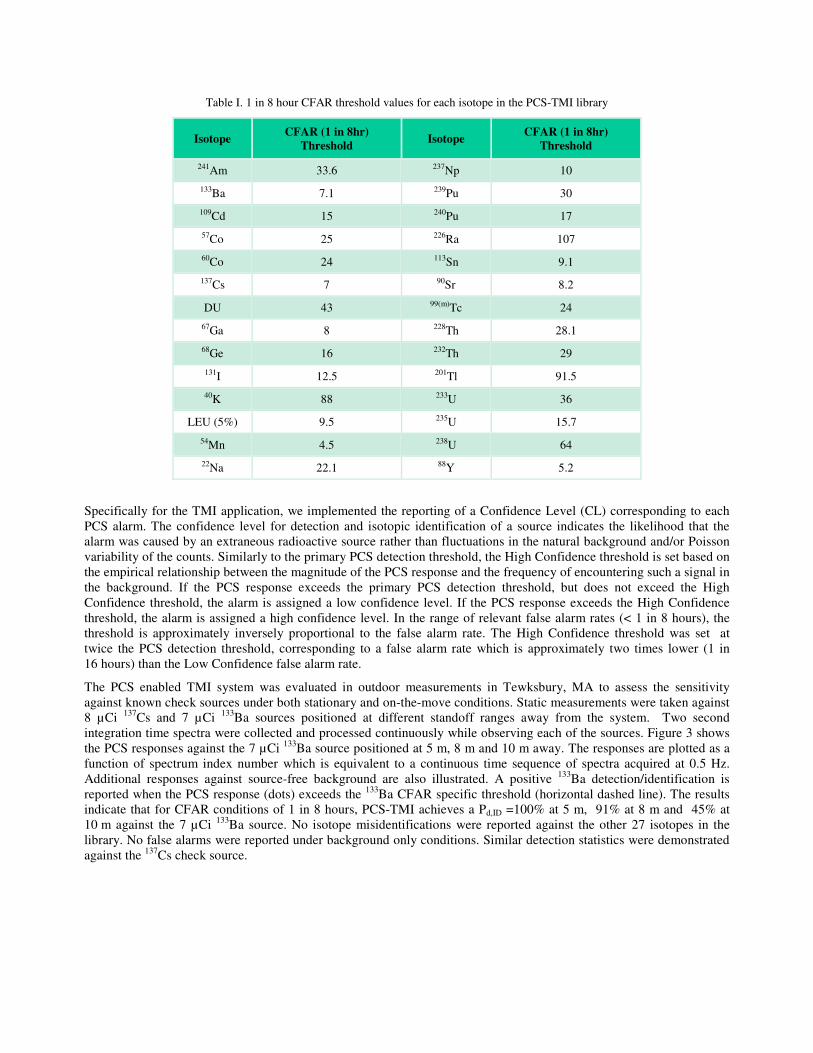
Table I. 1 in 8 hour CFAR threshold values for each isotope in the PCS-TMI library
Isotope CFAR (1 in 8hr)
Threshold Isotope
CFAR (1 in 8hr)
Threshold
241Am 33.6 237Np 10
133Ba 7.1 239Pu 30
109Cd 15 240Pu 17
57Co 25 226Ra 107
60Co 24 113Sn 9.1
137Cs 7 90Sr 8.2
DU 43 99(m)Tc 24
67Ga 8 228Th 28.1
68Ge 16 232Th 29
131I 12.5 201Tl 91.5
40K 88 233U 36
LEU (5%) 9.5 235U 15.7
54Mn 4.5 238U 64
22Na 22.1 88Y 5.2
Specifically for the TMI application, we implemented the reporting of a Confidence Level (CL) corresponding to each
PCS alarm. The confidence level for detection and isotopic identification of a source indicates the likelihood that the
alarm was caused by an extraneous radioactive source rather than fluctuations in the natural background and/or Poisson
variability of the counts. Similarly to the primary PCS detection threshold, the High Confidence threshold is set based on
the empirical relationship between the magnitude of the PCS response and the frequency of encountering such a signal in
the background. If the PCS response exceeds the primary PCS detection threshold, but does not exceed the High
Confidence threshold, the alarm is assigned a low confidence level. If the PCS response exceeds the High Confidence
threshold, the alarm is assigned a high confidence level. In the range of relevant false alarm rates (< 1 in 8 hours), the
threshold is approximately inversely proportional to the false alarm rate. The High Confidence threshold was set at
twice the PCS detection threshold, corresponding to a false alarm rate which is approximately two times lower (1 in
16 hours) than the Low Confidence false alarm rate.
The PCS enabled TMI system was evaluated in outdoor measurements in Tewksbury, MA to assess the sensitivity
against known check sources under both stationary and on-the-move conditions. Static measurements were taken against
8 µCi 137
Cs and 7 µCi 133
Ba sources positioned at different standoff ranges away from the system. Two second
integration time spectra were collected and processed continuously while observing each of the sources. Figure 3 shows
the PCS responses against the 7 µCi 133
Ba source positioned at 5 m, 8 m and 10 m away. The responses are plotted as a
function of spectrum index number which is equivalent to a continuous time sequence of spectra acquired at 0.5 Hz.
Additional responses against source-free background are also illustrated. A positive 133
Ba detection/identification is
reported when the PCS response (dots) exceeds the 133
Ba CFAR specific threshold (horizontal dashed line). The results
indicate that for CFAR conditions of 1 in 8 hours, PCS-TMI achieves a Pd,ID =100% at 5 m, 91% at 8 m and 45% at
10 m against the 7 µCi 133
Ba source. No isotope misidentifications were reported against the other 27 isotopes in the
library. No false alarms were reported under background only conditions. Similar detection statistics were demonstrated
against the 137
Cs check source.
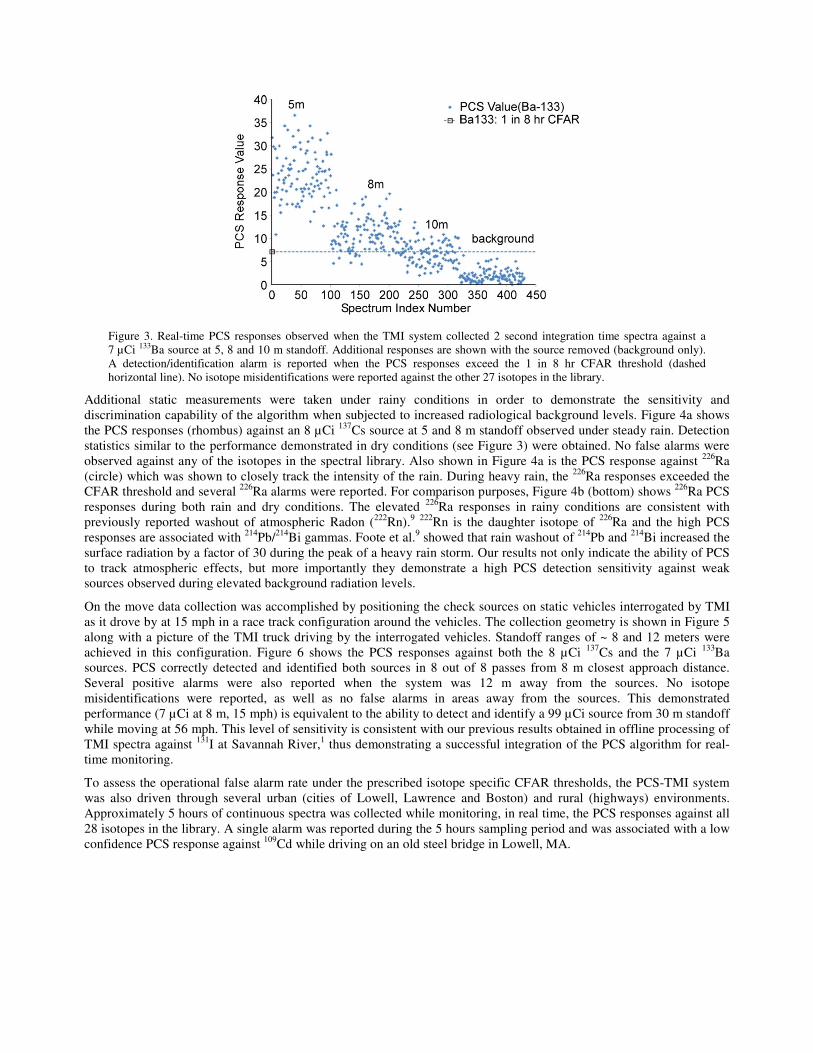
Figure 3. Real-time PCS responses observed when the TMI system collected 2 second integration time spectra against a
7 µCi 133Ba source at 5, 8 and 10 m standoff. Additional responses are shown with the source removed (background only).
A detection/identification alarm is reported when the PCS responses exceed the 1 in 8 hr CFAR threshold (dashed
horizontal line). No isotope misidentifications were reported against the other 27 isotopes in the library.
Additional static measurements were taken under rainy conditions in order to demonstrate the sensitivity and
discrimination capability of the algorithm when subjected to increased radiological background levels. Figure 4a shows
the PCS responses (rhombus) against an 8 µCi 137
Cs source at 5 and 8 m standoff observed under steady rain. Detection
statistics similar to the performance demonstrated in dry conditions (see Figure 3) were obtained. No false alarms were
observed against any of the isotopes in the spectral library. Also shown in Figure 4a is the PCS response against 226
Ra
(circle) which was shown to closely track the intensity of the rain. During heavy rain, the 226
Ra responses exceeded the
CFAR threshold and several 226
Ra alarms were reported. For comparison purposes, Figure 4b (bottom) shows 226
Ra PCS
responses during both rain and dry conditions. The elevated 226
Ra responses in rainy conditions are consistent with
previously reported washout of atmospheric Radon (222
Rn).9
222Rn is the daughter isotope of
226Ra and the high PCS
responses are associated with 214
Pb/214
Bi gammas. Foote et al.9 showed that rain washout of
214Pb and
214Bi increased the
surface radiation by a factor of 30 during the peak of a heavy rain storm. Our results not only indicate the ability of PCS
to track atmospheric effects, but more importantly they demonstrate a high PCS detection sensitivity against weak
sources observed during elevated background radiation levels.
On the move data collection was accomplished by positioning the check sources on static vehicles interrogated by TMI
as it drove by at 15 mph in a race track configuration around the vehicles. The collection geometry is shown in Figure 5
along with a picture of the TMI truck driving by the interrogated vehicles. Standoff ranges of ~ 8 and 12 meters were
achieved in this configuration. Figure 6 shows the PCS responses against both the 8 µCi 137
Cs and the 7 µCi 133
Ba
sources. PCS correctly detected and identified both sources in 8 out of 8 passes from 8 m closest approach distance.
Several positive alarms were also reported when the system was 12 m away from the sources. No isotope
misidentifications were reported, as well as no false alarms in areas away from the sources. This demonstrated
performance (7 µCi at 8 m, 15 mph) is equivalent to the ability to detect and identify a 99 µCi source from 30 m standoff
while moving at 56 mph. This level of sensitivity is consistent with our previous results obtained in offline processing of
TMI spectra against 131
I at Savannah River,1 thus demonstrating a successful integration of the PCS algorithm for real-
time monitoring.
To assess the operational false alarm rate under the prescribed isotope specific CFAR thresholds, the PCS-TMI system
was also driven through several urban (cities of Lowell, Lawrence and Boston) and rural (highways) environments.
Approximately 5 hours of continuous spectra was collected while monitoring, in real time, the PCS responses against all
28 isotopes in the library. A single alarm was reported during the 5 hours sampling period and was associated with a low
confidence PCS response against 109
Cd while driving on an old steel bridge in Lowell, MA.
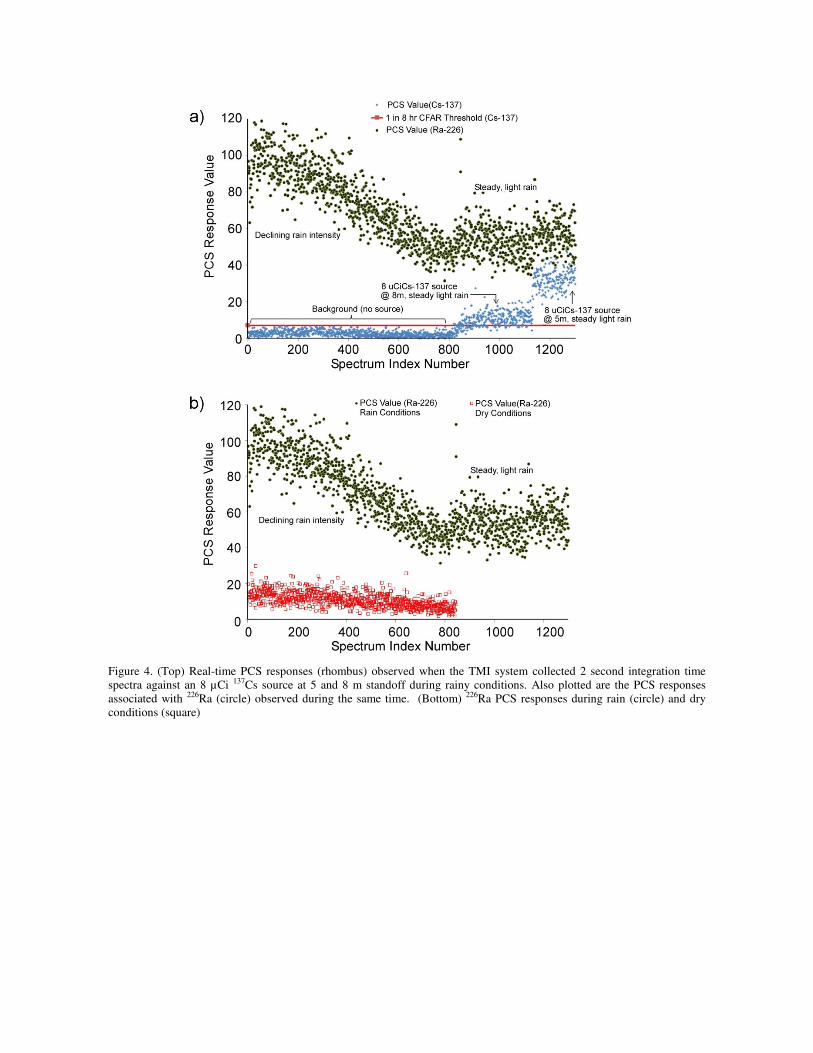
Figure 4. (Top) Real-time PCS responses (rhombus) observed when the TMI system collected 2 second integration time
spectra against an 8 µCi 137Cs source at 5 and 8 m standoff during rainy conditions. Also plotted are the PCS responses
associated with 226Ra (circle) observed during the same time. (Bottom) 226Ra PCS responses during rain (circle) and dry
conditions (square)
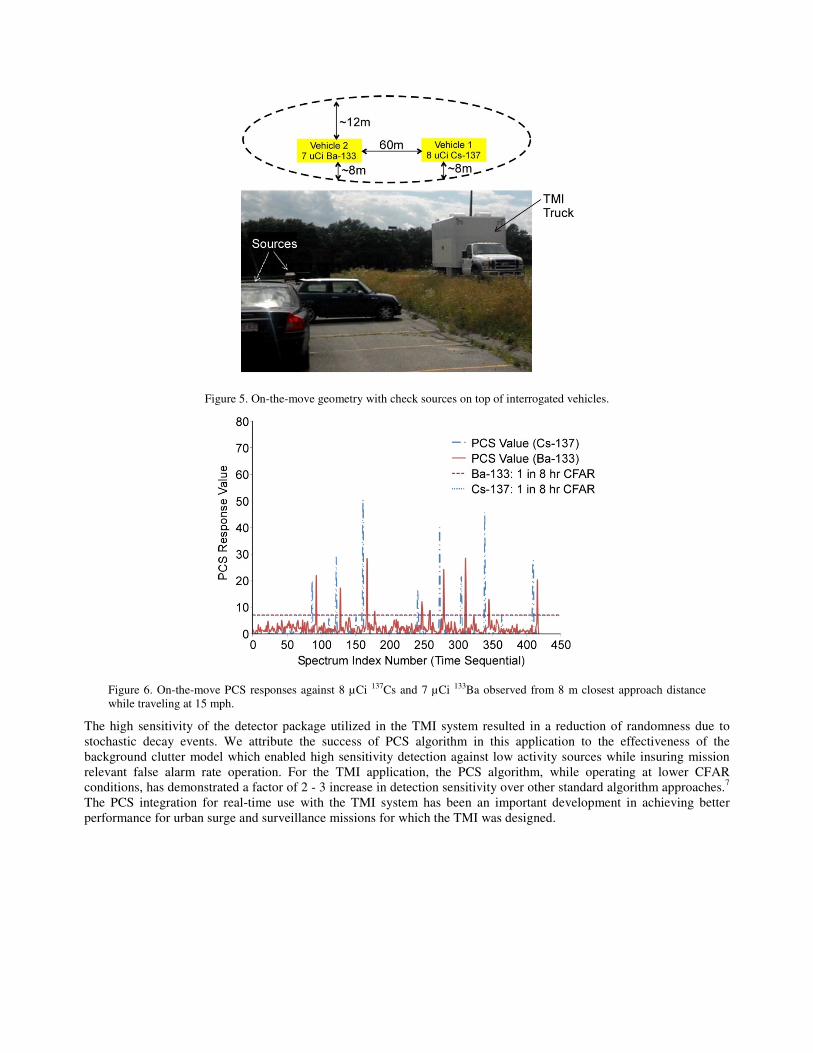
Figure 5. On-the-move geometry with check sources on top of interrogated vehicles.
Figure 6. On-the-move PCS responses against 8 µCi 137Cs and 7 µCi 133Ba observed from 8 m closest approach distance
while traveling at 15 mph.
The high sensitivity of the detector package utilized in the TMI system resulted in a reduction of randomness due to
stochastic decay events. We attribute the success of PCS algorithm in this application to the effectiveness of the
background clutter model which enabled high sensitivity detection against low activity sources while insuring mission
relevant false alarm rate operation. For the TMI application, the PCS algorithm, while operating at lower CFAR
conditions, has demonstrated a factor of 2 - 3 increase in detection sensitivity over other standard algorithm approaches.7
The PCS integration for real-time use with the TMI system has been an important development in achieving better
performance for urban surge and surveillance missions for which the TMI was designed.
b. PCS Performance evaluation: Advanced Spectroscopic Portal (ASP)
The sensitivity advantage afforded by PCS was recently demonstrated by integrating and testing the algorithm with the
Advanced Spectroscopic Portal (ASP). The current ASP systems are limited by how fast traffic can move through the
portals. This limitation (~ 5 mph) results in unacceptable disruptions to the flow of commerce. In addition, high
operational false alarms resulting from radiological clutter continue to impact the utility of such systems.
The integration of the PCS algorithm with ASP addressed these limitations by:
• Generating real-time source detection and identification through processing of gamma spectra acquired at
0.5 second integration time. Given the ASP hardware configuration which uses multiple 2”x4”x16” NaI
detectors, this operational approach allows for detection and identification of sources moving at speeds of
30 mph without any impact from spectral/spatial blurring.
• Utilization of only 4 out of 12 NaI detectors in order to demonstrate the achievement of key performance
parameters with a significant reduction in cost as an additional benefit associated with the utilization of the PCS
algorithm.
A detailed analysis of the PCS-ASP results was reported in Reference 3. In this section, we briefly summarize our
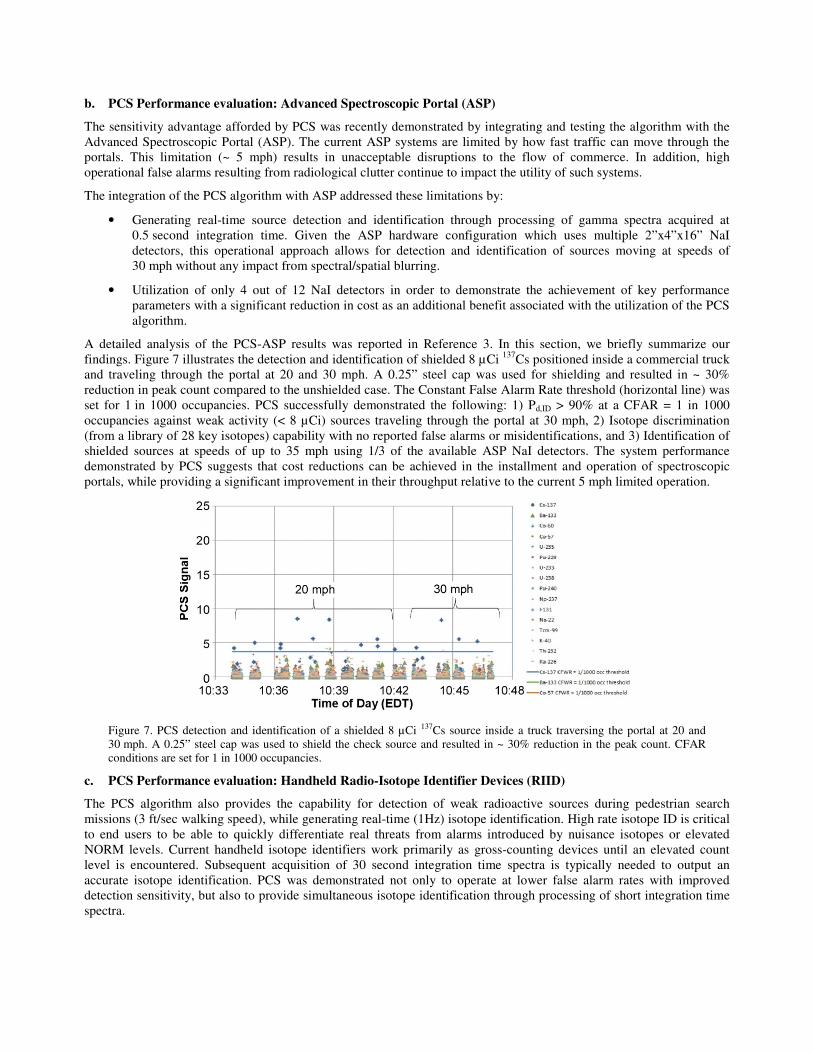
findings. Figure 7 illustrates the detection and identification of shielded 8 µCi 137
Cs positioned inside a commercial truck
and traveling through the portal at 20 and 30 mph. A 0.25” steel cap was used for shielding and resulted in ~ 30%
reduction in peak count compared to the unshielded case. The Constant False Alarm Rate threshold (horizontal line) was
set for 1 in 1000 occupancies. PCS successfully demonstrated the following: 1) Pd,ID > 90% at a CFAR = 1 in 1000
occupancies against weak activity (< 8 µCi) sources traveling through the portal at 30 mph, 2) Isotope discrimination
(from a library of 28 key isotopes) capability with no reported false alarms or misidentifications, and 3) Identification of
shielded sources at speeds of up to 35 mph using 1/3 of the available ASP NaI detectors. The system performance
demonstrated by PCS suggests that cost reductions can be achieved in the installment and operation of spectroscopic
portals, while providing a significant improvement in their throughput relative to the current 5 mph limited operation.
Figure 7. PCS detection and identification of a shielded 8 µCi 137Cs source inside a truck traversing the portal at 20 and
30 mph. A 0.25” steel cap was used to shield the check source and resulted in ~ 30% reduction in the peak count. CFAR
conditions are set for 1 in 1000 occupancies.
c. PCS Performance evaluation: Handheld Radio-Isotope Identifier Devices (RIID)
The PCS algorithm also provides the capability for detection of weak radioactive sources during pedestrian search
missions (3 ft/sec walking speed), while generating real-time (1Hz) isotope identification. High rate isotope ID is critical
to end users to be able to quickly differentiate real threats from alarms introduced by nuisance isotopes or elevated
NORM levels. Current handheld isotope identifiers work primarily as gross-counting devices until an elevated count
level is encountered. Subsequent acquisition of 30 second integration time spectra is typically needed to output an
accurate isotope identification. PCS was demonstrated not only to operate at lower false alarm rates with improved
detection sensitivity, but also to provide simultaneous isotope identification through processing of short integration time
spectra.
The performance of the PCS algorithm for handheld isotope identifiers was assessed using data sets collected with a
RadSeeker medium resolution detector (1.5” x 1.5” LaBr3) developed by Smiths Detection.5 The integration times for
background and test spectral acquisition were set at 0.5 second to avoid spatial blur during search, thus enabling fast
detection and identification against threat sources. Natural backgrounds were collected at several locations, including a
residential area in Warren, NJ, a shopping mall (Bridgewater Mall, NJ), a warehouse, and an urban area (Town center,
Morristown, NJ). A random subset of the background spectra was used to generate the PCS clutter model associated
with 1 second integration time spectra. The isotope-specific thresholds corresponding to 1 in 4 hours constant false
warning rate (CFWR) were calculated by processing the remaining background spectra. During pedestrian search with a
handheld RIID, the warning would trigger a confirmation based on spectra acquired over a longer dwell time before an
alarm is issued. The background model and the CFWR thresholds were fixed and used across other test environments.
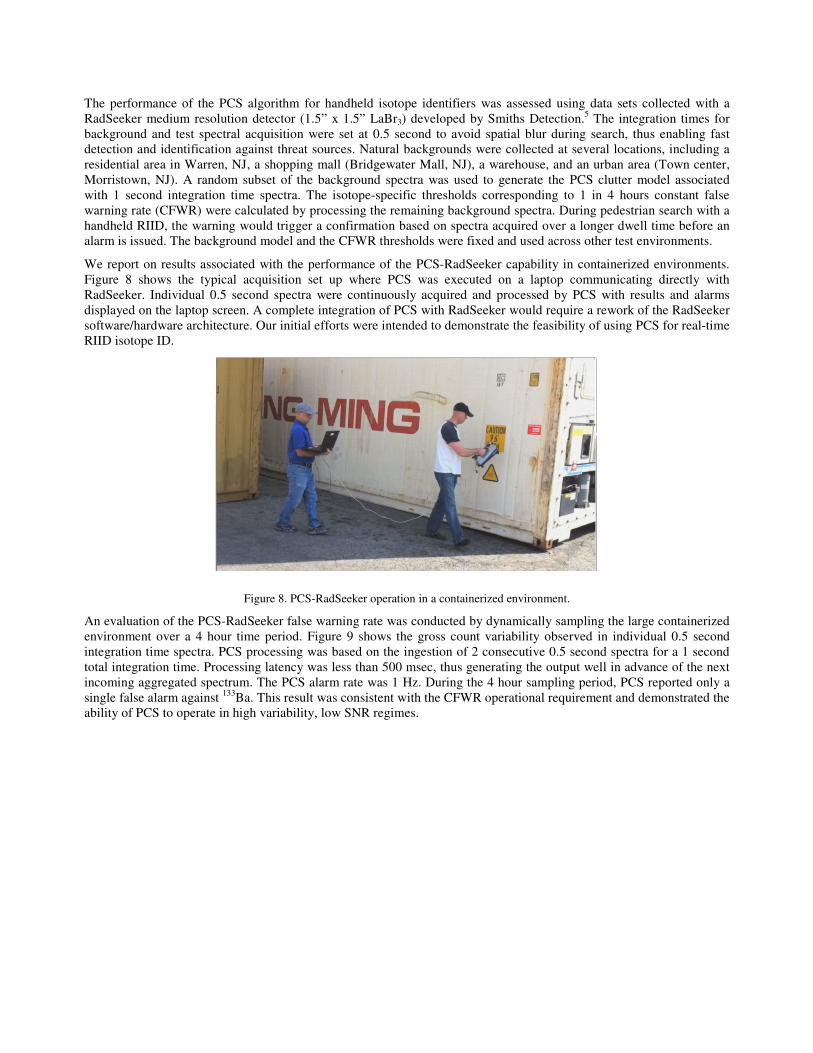
We report on results associated with the performance of the PCS-RadSeeker capability in containerized environments.
Figure 8 shows the typical acquisition set up where PCS was executed on a laptop communicating directly with
RadSeeker. Individual 0.5 second spectra were continuously acquired and processed by PCS with results and alarms
displayed on the laptop screen. A complete integration of PCS with RadSeeker would require a rework of the RadSeeker
software/hardware architecture. Our initial efforts were intended to demonstrate the feasibility of using PCS for real-time
RIID isotope ID.
Figure 8. PCS-RadSeeker operation in a containerized environment.
An evaluation of the PCS-RadSeeker false warning rate was conducted by dynamically sampling the large containerized
environment over a 4 hour time period. Figure 9 shows the gross count variability observed in individual 0.5 second
integration time spectra. PCS processing was based on the ingestion of 2 consecutive 0.5 second spectra for a 1 second
total integration time. Processing latency was less than 500 msec, thus generating the output well in advance of the next
incoming aggregated spectrum. The PCS alarm rate was 1 Hz. During the 4 hour sampling period, PCS reported only a
single false alarm against 133
Ba. This result was consistent with the CFWR operational requirement and demonstrated the
ability of PCS to operate in high variability, low SNR regimes.
Figure 9. Gross count variability in individual 0.5 second integration time spectra acquired by RadSeeker while sampling a
containerized environment.
The PCS-RadSeeker sensitivity was assessed by observing check sources as a function of range. At a fixed CFWR of
1 in 4 hours, Figure 10 shows the probability of detection and identification of an 8.8 µCi 133
Ba source at various
standoff ranges in the containerized environment. For comparison purposes, the Pd,ID against the same source in a more
benign indoor environment is also plotted. Detection statistics were generated based on processing of 1 second
integration time spectra. We note that the elevated and cluttered radiological background encountered in the
containerized environment reduced the detection sensitivity of the system when compared to its operation in the indoor
area. With 1 second integration time, a Pd,ID ~ 90% against the 8.8 µCi 133
Ba was demonstrated from 1 m standoff
distance in a cluttered and complex environment. Figure 11 shows how the processing of longer integration time spectra
extended the sensitivity of the PCS-RadSeeker system to longer standoff ranges. Using 10 sec integration time spectra,
PCS achieved a Pd,ID ~ 82% against a 7.8 µCi 57
Co source from 2 meters standoff.
Figure 10. PCS-RadSeeker Pd,ID as a function of standoff range away from an 8.8 µCi 133Ba source in a cluttered
containerized and indoor benign environments. Isotope detection and identification is generated based on processing of
1 second integration time spectra. The operational false warning rate was 1 in 4 hours.
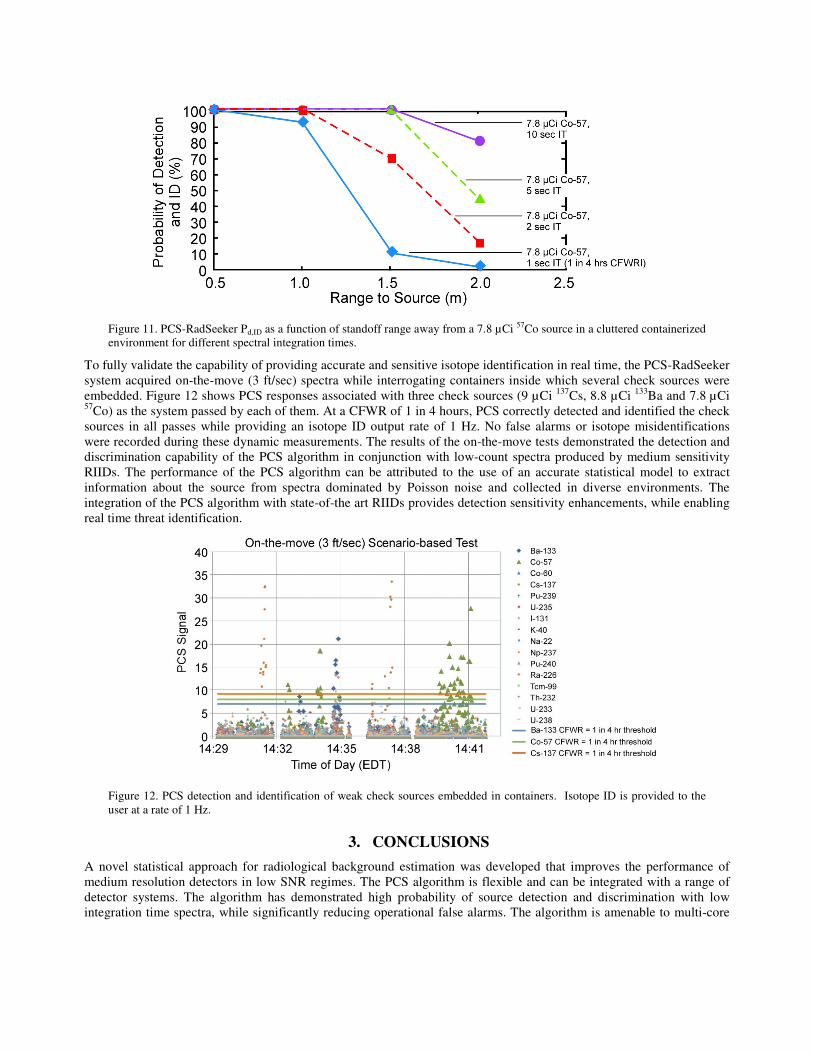
Figure 11. PCS-RadSeeker Pd,ID as a function of standoff range away from a 7.8 µCi 57Co source in a cluttered containerized
environment for different spectral integration times.
To fully validate the capability of providing accurate and sensitive isotope identification in real time, the PCS-RadSeeker
system acquired on-the-move (3 ft/sec) spectra while interrogating containers inside which several check sources were
embedded. Figure 12 shows PCS responses associated with three check sources (9 µCi 137
Cs, 8.8 µCi 133
Ba and 7.8 µCi 57
Co) as the system passed by each of them. At a CFWR of 1 in 4 hours, PCS correctly detected and identified the check
sources in all passes while providing an isotope ID output rate of 1 Hz. No false alarms or isotope misidentifications
were recorded during these dynamic measurements. The results of the on-the-move tests demonstrated the detection and
discrimination capability of the PCS algorithm in conjunction with low-count spectra produced by medium sensitivity
RIIDs. The performance of the PCS algorithm can be attributed to the use of an accurate statistical model to extract
information about the source from spectra dominated by Poisson noise and collected in diverse environments. The
integration of the PCS algorithm with state-of-the art RIIDs provides detection sensitivity enhancements, while enabling
real time threat identification.
Figure 12. PCS detection and identification of weak check sources embedded in containers. Isotope ID is provided to the
user at a rate of 1 Hz.
3. CONCLUSIONS
A novel statistical approach for radiological background estimation was developed that improves the performance of
medium resolution detectors in low SNR regimes. The PCS algorithm is flexible and can be integrated with a range of
detector systems. The algorithm has demonstrated high probability of source detection and discrimination with low
integration time spectra, while significantly reducing operational false alarms. The algorithm is amenable to multi-core
processing, thus enabling operation in near-real time with threat characterization results generated with a latency of less
than 100 msec.
For the SORDS surge and surveillance mission, PCS demonstrated the ability to achieve a significant increase in
detection sensitivity over standard methods currently employed on such systems, while operating in cluttered
environments at mission relevant 1 in 8 hours false alarm rates. On-going DNDO sponsored efforts are focusing on using
environmental information provided by orthogonal sensing technologies to dynamically adjust the background models
utilized by the PCS framework. Such an approach has already demonstrated a factor of ~ 2 improvement in sensitivity
over the PCS baseline approach evaluated in this paper.
For portal applications, PCS demonstrated the ability to achieve high sensitivity with a reduced number of detectors and
at relevant constant false alarm operating conditions, while allowing for vehicle traffic moving through the portal at
speeds as high as 35 mph. This performance represents a significant improvement in ASP throughput relative to the
current ~5 mph limited operation. The integration of the PCS algorithm with existing ASP units has the potential to
enhance operational capability, while directly addressing some of the current technical gaps.
Real-time (1Hz) isotope identification capability for handheld devices is of important need to end users who require a
fast assessment of alarms due to real threats or nuisance isotopes. PCS demonstrated such capability. We are currently
integrating PCS with small, low power processors such as those found on smartphone devices to allow for a flexible,
high performance platform that can interface directly with RIID instruments.
ACKNOWLEDGEMENTS
This work has been supported by the US Department of Homeland Security, Domestic Nuclear Detection Office, under
competitively awarded contract/IAA HSHQDC-10-C-00171 and HSHQDC-11-C-00117. This support does not
constitute an express or implied endorsement on the part of the Government.
REFERENCES
[1] Shokhirev, K.N., Cosofret, B.R., King, M., Harris, B., Zhang, C., and Masi, D., “Enhanced Detection and
Identification of Radiological Threats in Cluttered Environments,” HST 2012, IEEE Technologies for Homeland
Security 2012, Boston, MA, 13-15 November 2012.
[2] Cosofret, B.R., Shokhirev, K. “Enhanced Detection and Identification of Radionuclide Threats in Cluttered
Environments,” 5th Annual Academic Research Initiative Conf., Leesburg VA, 2012.
[3] Cosofret, B.R., Shokhirev, K.N., Mulhall, P.A., Payne, D., Harris, B., Arsenault, E., and Moro, R., “Utilization of
advanced clutter suppression algorithms for improved spectroscopic portal capability against radionuclide threats,”
HST 2013, IEEE International Conference of Technologies for Homeland Security, Waltham, MA, 12–14
November 2013.
[4] Kelly, E. J., “An adaptive detection algorithm,” IEEE Trans. Aerosp. Electron. Syst. 22, 115–127, March 1986.
[5] RadSeeker Handheld Isotope Identifier, http://www.smithsdetection.com/en/products-solutions/radiation-
detection/56-radiation-detection/radseeker.html#.Uw9Yg4XN4j4
[6] Wakeford, D., Andrews, H. R., Clifford, E. T. H., Hynes, M. V., Toolin, M., Harris, B. and McElroy, J., “The
SORDS trimodal imager detector arrays,” Proc. of SPIE Vol. 7310 (2009).
[7] Cosofret, B. R., Shokhirev, K. and Mulhall, P, “Enhanced Detection and Identification of Radionuclide Threats in
Urban Environments (E-DIRTUE),” Phase V Final Report prepared for Department of Homeland Security under
Contract No. HSHQDC-10-C-00171, PSI-1729/TR-2895, April 2013.
[8] Mitchell, D. J. and Waymire, D. R., “GADRAS User Manual,” Sandia National Laboratory, November (2009).
[9] Foote, R. S. and Frick, N. E., “Time Variations of Natural Gamma Radiation,” Environmental Geosciences 8(2),
130-139 (2001).