utilization of iot for soil moisture and temperature
TRANSCRIPT
Available online at www.ijournalse.org
Emerging Science Journal
Vol. 4, Special Issue "IoT, IoV, and Blockchain", (2020, 2021)
Page | 102
Utilization of IoT for Soil Moisture and Temperature Monitoring
System for Onion Growth
Izak Habel Wayangkau 1, Yosehi Mekiuw 2, Rachmat Rachmat 1,
Suwarjono Suwarjono 1, Hariyanto Hariyanto 1*
a Faculty of Engineering, Universitas Musamus, Merauke 99600, Papua, Indonesia
b Faculty of Agricultural, Universitas Musamus, Merauke 99600, Papua, Indonesia
Abstract
The use of IoT in precision agriculture is very important in the process of increasing crop production.
The local supply of onions in Merauke Regency have not fulfilled the demand, thus the high price in the market. Most of the demand for onion are still fulfilled from outside the region, as the production
of local farmers has not been optimal. The weather has been identified as one of the factors that affect
the quality of onion production. This study aims to create an automatic monitoring system based on an Arduino microcontroller to measure soil moisture and temperature in onion patches. The method used
is to design an automatic monitoring device to determine soil moisture and temperature so that it can
provide information about the growth and maintenance of onion patches. The Arduino microcontroller is connected to a reading sensor that is integrated with component devices to maintain a stable
temperature and soil moisture. All devices and components are designed to operate in a custom-made
environment in the form of a greenhouse prototype. The results of this study indicate that the tool and system are capable of capturing the soil moisture and temperature, as well as maintaining the soil
moisture and temperature within certain parameters, in cloudy, wet and hot weather conditions.
Keywords:
Internet of Things (IoT);
Monitoring System;
Agriculture;
Microcontroller;
Android.
Article History:
Received: 19 June 2021
Revised: 23 September 2021
Accepted: 02 October 2021
Published: 19 October 2021
1- Introduction
Merauke Regency is located between 137'-141' East and 5'-9' South, geographically located at the southern part of
the easternmost part of Indonesia, with an area of 46,791.63 km2 [1]. Merauke Regency is known as the largest regency
in Papua Province, and is also a leader in the production of three important food crops, with a total production of around
91.47% [2, 3]. The area's low-lying topography and land elevation are highly suitable for the development of agriculture
and plantations. The huge agricultural potential gave rise to the idea of making Merauke Regency one of the world's
food barns, known as the Merauke Integrated Food and Energy Estate (MIFEE) concept [4-6]. The total area of available
agricultural land reaches 1.2 million ha, with 800,000 ha that has the potential for food crop development, and currently,
only about 13% is managed using modern methods. The annual production of food crop commodities that have been
successfully developed includes 327,877 tons of rice; 8,556 tons of corn; 4,627 tons of cassava; 592 tons of peanuts and
90 tons of green beans. However, one type of food crop commodity has not been fully developed, namely onions [7],
where the amount of production is very low. The demand for onions in Merauke Regency is still fulfilled by other
regions, the largest onion suppliers for the Papua region being the provinces of East Java, West Sumatra, and West Nusa
Tenggara. The lengthy supply chains are at risk of delays in delivery and constraints in terms of transportation and other
obstacles, such as weather and natural conditions that do not allow delivery, causing a lack of availability of onions. The
high demand for onions, limited availability, and high prices require a breakthrough and innovation in the development
of onion crops through optimal cultivation techniques.
* CONTACT: [email protected]
DOI: http://dx.doi.org/10.28991/esj-2021-SP1-07
© 2020 by the authors. Licensee ESJ, Italy. This is an open access article under the terms and conditions of the Creative Commons Attribution (CC-BY) license (https://creativecommons.org/licenses/by/4.0/).
Emerging Science Journal | Vol. 4, Special Issue "IoT, IoV, and Blockchain", (2020, 2021)
Page | 103
In 2018 Kelyum et al. [8] has conducted research on the development of onion cultivation in Merauke Regency,
finding that several factors that cause very low production yields are planting media, weather, and maintenance.
Meanwhile, the results of direct interviews that we conducted in July-August 2020, with several onion farmers in
Merauke Regency also showed that there were five problems faced by onion farmers including: 1. lack of knowledge
about cultivation techniques; 2. poor soil conditions for planting onions; 3. changes in the weather in the field; 4.
appropriate volume of water for onion plants; 5. maintaining stable temperature and humidity in the onion cultivation
areas.
The onion is a horticultural plant with the Latin name of Allium ascalonicum L., usually used as a main condiment,
and can also be used as a basic ingredient for medicines that are highly beneficial for the body [9, 10]. The development
and growth of onion plants are strongly influenced by the availability and sufficiency of water, application of fertilizer,
and the right weather [11-14]. To provide solutions to overcome these challenges, the Internet of Things (IoT) systems
are becoming more relevant, where many researchers in the world [15-17] have utilized IoT to optimize plant growth
and production. Various sensors can be used and connected to build a soil moisture and temperature monitoring system
in the rainy and hot seasons so that plants continue to get nutrients to grow and develop [18, 19]. In 2019 Rahmat et al.
[20] have conducted research to monitor the growth of onions using the hydroponic method, but the resulting system
can only display data on agricultural land area and is not connected to the Android application on mobile phones.
Kaburuan et al. [21] has also conducted research by building a greenhouse design to monitor the growth of crops. The
results of his research also show data such as soil, water, and air conditions that can be seen in detail. However, in this
study, the system that has been built cannot be controlled remotely. The latest research in 2021, conducted by Khan et
al. [22], made a new prototype, namely the Smart Farming Monitoring System (SFMS) to reduce bolting on onion crops
in the Khyber Pakhtunkhwa district of Pakistan, however in this study only one climatic and weather conditions were
presented due to demographic factors. Demographic factors greatly affect the effectiveness of the system that is built
and developed. Meanwhile, Indonesia has a tropical climate, and in Merauke Regency, there are 3 seasons, namely
cloudy, rainy, and hot.
Therefore, innovative actions are needed that can solve the problems of farmers in an effort to cultivate onion plants
by utilizing IoT that can be controlled remotely. This study aims to create an automatic monitoring system based on an
Arduino microcontroller to measure soil moisture and temperature in onion plants. The method used is the design of an
automatic monitoring device to determine soil moisture and temperature so that it can provide information about the
growth and maintenance of onion plants. The Arduino microcontroller is connected to a reading sensor which is
integrated with the Android operating system to be implemented in a greenhouse. This method adopts an artificial
intelligence design by utilizing the advantages of the Nodemcu ESP 8266 microcontroller, as the input and output media
of the research process to be achieved and Android as a medium for information on changes in conditions in the onion
planting media in real-time. Then test the monitoring system and sensor readings on 3 weather conditions, namely when
it is cloudy, rainy, and hot, system testing is carried out to measure the effectiveness of the system that has been made.
This research is expected to contribute greatly to science, namely by providing information about the use of IoT
technology in precision agriculture, especially the growth of onion plants. The results of this study have a great impact
on local farmers, namely being able to understand the composition of the best climate for the growth of onions and
educating farmers to be able to use technology in agriculture. The structure of this article begins with an introduction,
research motivation, and problems found in section 1. Then section 2 contains an explanation of the materials and
methods. This subsection will explain the maintenance and monitoring of onion growth, the manufacture of greenhouses,
then the components needed to build a monitoring system for soil moisture and temperature. This system design was
developed using the waterfall method, Use case Diagrams, Sequence Diagrams, and block diagrams are integrated based
on Android. Furthermore, in section 3 the results of the discussion present the design view of the monitoring system that
has been made, then graphs and tables show the effectiveness of the system. The last section concludes the results found
and the future development of the application.
2- Materials and Method
2-1- Onion Plant Maintenance and Monitoring
In monitoring, data are collected, collated, processed and analyzed to obtain information about the implementation
of a program or prototype, to easily find out whether the program is running well or not. Maintenance is an important
element in the cycle of plant cultivation. Well-planned and well-maintained treatment will give optimal results [23]. In
essence, maintenance is an effort to help plants grow and protect them from pests and diseases. Onion maintenance
include the following main activities:
Watering: onion plants need just enough water for growth. Lack of water in the vegetative growth phase causes
the onion plants to grow stunted, on the other hand, excess water during tuber formation can cause tubers to rot,
or crop failure due to the plant becoming damaged and rotten. Therefore, the provision of water must be sufficient
for vegetative growth (young plants), soil conditions must be kept moist, so that watering is carried out

Emerging Science Journal | Vol. 4, Special Issue "IoT, IoV, and Blockchain", (2020, 2021)
Page | 104
continuously. For example, the plant must be watered twice a day, especially in the dry season. The critical time
for the onion plant is rapid vegetative growth and the formation of leaves and bulbs. Research results showed that
the amount of water needed for watering is 200 ml every 2 days during the vegetative growth period. Onion plants
need an air temperature of 31-32℃, relative humidity of 50-60%, and a minimum of 70% sunlight.
Weeding: Weeds that grow next to onion plants will compete for space, light, and nutrients, and can even become
OPT hosts, especially caterpillars. When weeds are cleaned up, onion caterpillar eggs are removed as well, and
this activity is often done on the 2nd weeding. Generally weeding is done 1-2 times before the second application
of fertilizer, at around 1 month. The critical period of onion plants due to competition with weeds occurs at the age
of 30-60 days after planting. Weeding can be done manually, conventionally, and chemically, or a combination of
the three.
Fertilization: onion plants need to be fertilized in order to meet the needs of sufficient and appropriate nutrients
for their growth to produce onion bulbs optimally. Nutrients are optimally available in the soil and can be utilized
by onion plants through the use of fertilizers. Inorganic fertilizers are used, for example urea, TSP, KCL, or NPK,
aiming to provide optimal nutrients in the soil needed by onion plants. The following example shows the fertilizing
pattern in a monoculture system without plastic mulch as follows:
o The type and dose of artificial fertilizer given consists of urea 100 kg – 150 kg + ZA 30 kg – 400 kg +
TSP 100 kg – 150 kg + KCL 150 kg – 200 kg per hectare.
o The timing and proportion of fertilizer application is set in stages as follows:
a) The first fertilization is given before planting onion seeds. The type of fertilizer used is NPK pellets
(16:16:16) 500 kg, SP36 as much as 50-100 kg, and KCI 30-60 kg for a hectare.
b) Urea, ZA, and KCl fertilizers were applied as supplementary fertilizers at 3, 6, and 9 weeks after
planting the onions, each one-third the dose. This is intended for the growth of the bulbs because at
the age of 15-30 days after planting, the nutrient reserves of the bulbs run out quickly, so S and N are
needed for the manufacture of leaves and bulbs.
c) The second supplementary fertilizer is given to plants aged 30-35 DAP with 180 kg/ha urea fertilizer.
At that age, the plant begins to enter the phase of bulb formation, so it requires carbohydrates from
photosynthesis as a bulb forming material.
d) Fertilization of onion plants does not need to be equal in each area, depending on the fertility of the
soil. For this reason, information is needed that can help farmers to determine a balanced composition
of fertilizers in the onion farming process.
2-2- Greenhouse
Onions grow in the lowlands to an altitude of about 100 meters above sea level. Optimal production results are
achieved in the lowlands with a temperature of 25-32℃, 75% irradiation, and air humidity in the range of 50-70% with
the provision of loose, fertile soil and lots of organic matter content. Such a condition can be maintained in a greenhouse.
A greenhouse’s size depends on how many plants are in it [24, 25]. In principle, the greenhouse functions to reduce the
rapid flow of heat out of the building by blocking the heat that has been absorbed through convection. The construction
material for these greenhouses is usually plastic/glass so that sunlight can pass through. It is important to allow sunlight
to keep the greenhouse warm, because sunlight can heat the soil inside the greenhouse, which in turn warms the air in
the greenhouse and then the plants in the greenhouse. This means that in a greenhouse, sunlight easily enters the building,
but heat is retained inside the building.
Figure 1. (a) Installation of Design Monitoring System; (b) Greenhouse display before sending to android.
(a) (b)
Emerging Science Journal | Vol. 4, Special Issue "IoT, IoV, and Blockchain", (2020, 2021)
Page | 105
Figure 10(a) shows the results of the prototype design for the onion monitoring system and Figure 10(b) shows the
appearance of soil moisture and temperature monitor during the rainy and hot seasons.
2-3- Android
The Android is a Linux-based mobile phone operating system, used on a tablet, computer or smartphone. Android is
also an open source program so developers can create apps usable on multiple smart devices. The Android application
on the plant monitoring system is considered very effective and efficient [26, 27] to assist users in maintaining
ornamental plants remotely. The user can perform monitoring functions such as displaying information to the user about
the growing conditions of the plant.
2-4- Arduino Software (IDE)
Programs written using Arduino Software (IDE) are called sketches. The sketch is written in a text editor and saved
in a file with the extension .ino. The text editor on the Arduino Software has features such as cutting/pasting and
searching/replace, making it easier to write program code [28]. In the Arduino IDE Software, there is a kind of black
message box that serves to display status, such as error messages, compile, and upload programs. The bottom right of
the Arduino IDE Software shows the board configured along with the COM Port in use.
2-5- Unified Modeling Language (UML)
UML is the first modeling language used to analyze, define and design software systems as an object-oriented
programming language that is beginning to be used in the software industry, as the name implies. Unified modeling
language (UML) describe the activities that occur in the system, from start to finish. Unified Modeling Language (UML)
can show the steps in the work process of the system that we will build.
2-6- Sensor Monitoring
Capacitive soil moisture sensor v2.0: Capacitive soil moisture sensor v2.0 is a sensor that can read the intensity of
the water content in the soil (moisture). This sensor uses two conductors to pass current through the ground, then
reads the resistance value to obtain a reading of the humidity level. Using this wireless sensor, farmers can remotely
measure soil moisture because the data from the soil moisture sensor V2 SEN0114 will be sent wirelessly by the
nRF24L01+ transceiver module to the LCD at the base station location. The sensor’s specifications are as follows:
1. Working current 35 mA; 2. Input voltage 3.3 or 5V and output voltage is 0~4.2V; 3. Value range 0-300 (dry
soil), 300-700 (moist soil), and 700-950 (wet soil).
DHT 11 Sensor: The DHT 11 sensor is a single chip humidity and temperature sensor whose output is digitally
calibrated. The inside of this sensor contains a polymer element to measure relative humidity and a stretch band
used to measure temperature. The outputs of the two sensors are combined with a 14 bit ADC.
NodeMCU ESP8266: NodeMCU is an open source IoT platform. NodeMCU firmware runs on the ESP8266 WiFi
SoC designed by Espressif Systems which is based on the ESP 12 Module. The term NodeMCU by default refers
to the DevKit firmware. The firmware uses the Lua scripting language and can be used in several projects such as
luacjson, and spiff.
2-7- Waterfall Methods
The method used for the development of the system is the waterfall method because the stages that are passed must
wait for the completion of the previous stages and run sequentially [29]. Presman, R. S. divides this model into 6 stages,
namely:
Information Systems and Engineering: At this stage, the authors look for the needs of the entire system that will
be applied to the software. These needs are obtained from the process of observation, interviews, and through the
process of literature study.
Software Requirements Analysis: After carrying out the first stage and then analyzing it, the next stage will be
intensified and focused on software development and then interface designing.
Design: At this stage, the needs that have been analyzed are converted into representations in the form of a blueprint
for the system to be built with the design stages starting from Activity Diagrams, Use Cases, Flowcharts, and
Sequence Diagrams.
Coding: This is the stage of writing programming language code to produce a script that is run on a computer
machine. The coding here is built with two different programming language stages, namely Android Studio to
build a system interface, and Arduino IDE as a means to enter code into the Arduino Uno prototype board to run
a series of devices that have been built.
Emerging Science Journal | Vol. 4, Special Issue "IoT, IoV, and Blockchain", (2020, 2021)
Page | 106
Testing/Verification: Performing functional testing and logical correctness of the system built with the aim of
finding out whether there are errors or not, knowing whether the system made is in accordance with the initial
design or not, and knowing the shortcomings of the system that has been designed/made.
Maintenance: This stage is carried out by maintaining software and hardware that has changed because the software
created and sent to users does not rule out changes. This change may occur due to an error that appeared and was
not detected during testing.
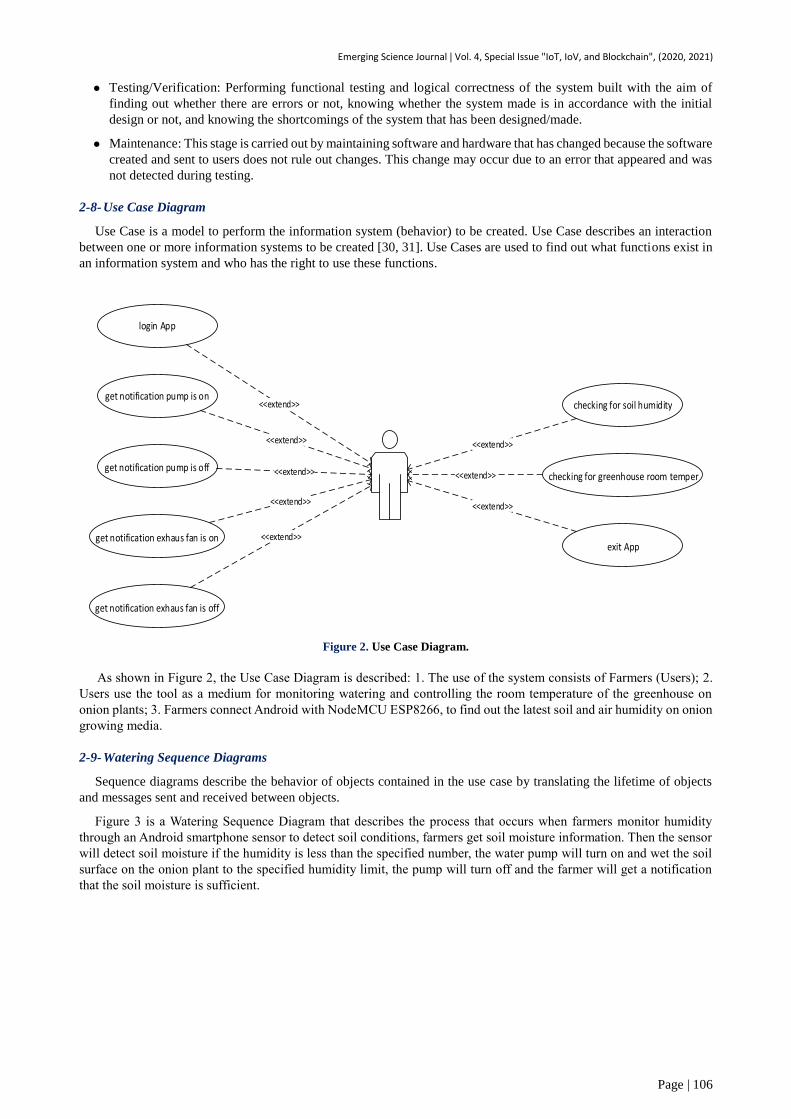
2-8- Use Case Diagram
Use Case is a model to perform the information system (behavior) to be created. Use Case describes an interaction
between one or more information systems to be created [30, 31]. Use Cases are used to find out what functions exist in
an information system and who has the right to use these functions.
get notification exhaus fan is on
get notification exhaus fan is off
login App
get notification pump is on
get notification pump is offchecking for greenhouse room temper
checking for soil humidity
exit App
<<extend>>
<<extend>>
<<extend>>
<<extend>>
<<extend>>
<<extend>>
<<extend>>
<<extend>>
Figure 2. Use Case Diagram.
As shown in Figure 2, the Use Case Diagram is described: 1. The use of the system consists of Farmers (Users); 2.
Users use the tool as a medium for monitoring watering and controlling the room temperature of the greenhouse on
onion plants; 3. Farmers connect Android with NodeMCU ESP8266, to find out the latest soil and air humidity on onion
growing media.
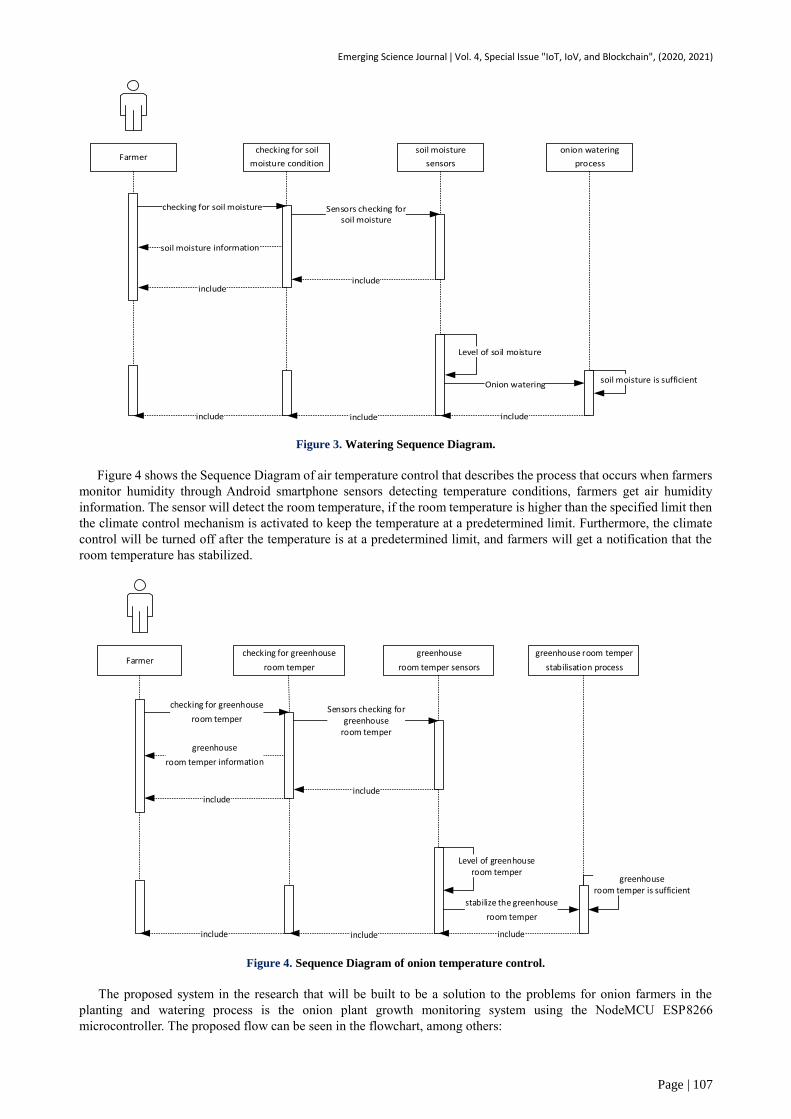
2-9- Watering Sequence Diagrams
Sequence diagrams describe the behavior of objects contained in the use case by translating the lifetime of objects
and messages sent and received between objects.
Figure 3 is a Watering Sequence Diagram that describes the process that occurs when farmers monitor humidity
through an Android smartphone sensor to detect soil conditions, farmers get soil moisture information. Then the sensor
will detect soil moisture if the humidity is less than the specified number, the water pump will turn on and wet the soil
surface on the onion plant to the specified humidity limit, the pump will turn off and the farmer will get a notification
that the soil moisture is sufficient.
Emerging Science Journal | Vol. 4, Special Issue "IoT, IoV, and Blockchain", (2020, 2021)
Page | 107
Farmerchecking for soil
moisture condition
soil moisture
sensors
onion watering
process
checking for soil moisture Sensors checking forsoil moisture
includeinclude
Level of soil moisture
soil moisture is sufficient
include
Onion watering
Figure 3. Watering Sequence Diagram.
Figure 4 shows the Sequence Diagram of air temperature control that describes the process that occurs when farmers
monitor humidity through Android smartphone sensors detecting temperature conditions, farmers get air humidity
information. The sensor will detect the room temperature, if the room temperature is higher than the specified limit then
the climate control mechanism is activated to keep the temperature at a predetermined limit. Furthermore, the climate
control will be turned off after the temperature is at a predetermined limit, and farmers will get a notification that the
room temperature has stabilized.
Farmerchecking for greenhouse
room temper
greenhouse
room temper sensors
greenhouse room temper
stabilisation process
checking for greenhouse
room temper
includeinclude
Level of greenhouseroom temper
greenhouseroom temper is sufficient
include
stabilize the greenhouse
room temper
Figure 4. Sequence Diagram of onion temperature control.
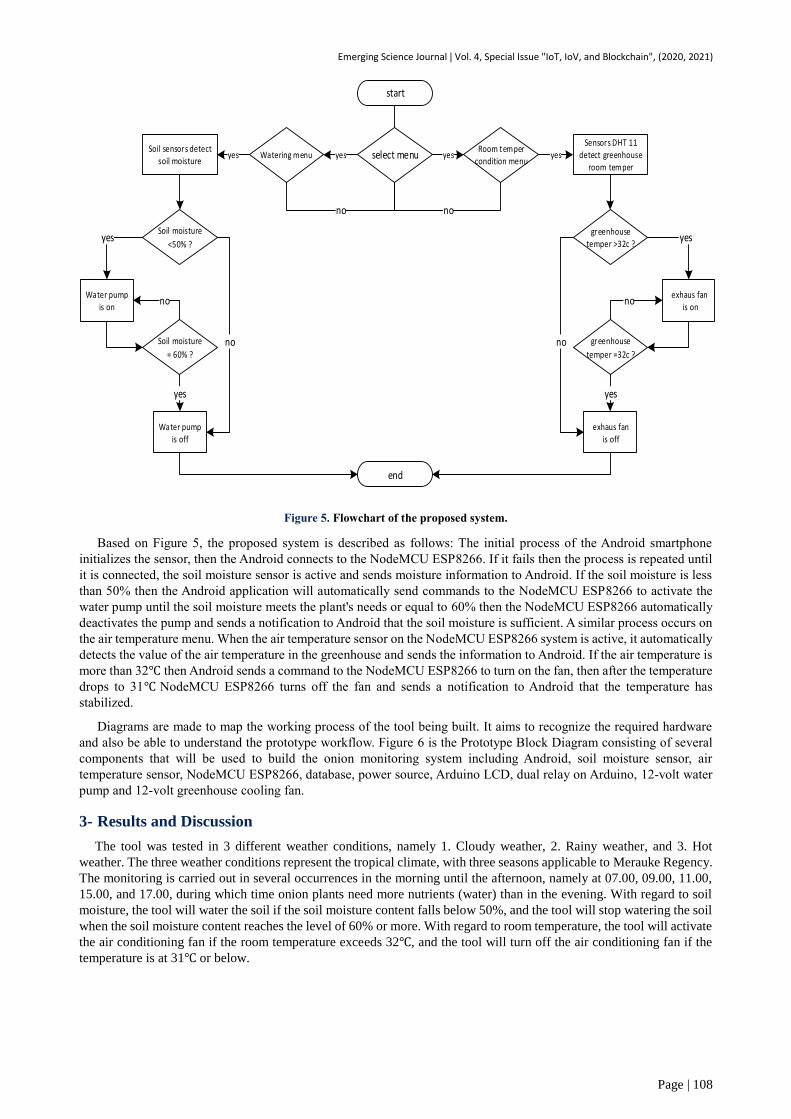
The proposed system in the research that will be built to be a solution to the problems for onion farmers in the
planting and watering process is the onion plant growth monitoring system using the NodeMCU ESP8266
microcontroller. The proposed flow can be seen in the flowchart, among others:
Emerging Science Journal | Vol. 4, Special Issue "IoT, IoV, and Blockchain", (2020, 2021)
Page | 108
Watering menu select menuRoom temper
condition menu
Soil sensors detect soil moisture
Sensors DHT 11 detect greenhouse
room temper
Soil moisture
<50% ?
Water pumpis off
start
greenhouse temper >32c ?
greenhouse
temper =32c ?
exhaus fanis off
Soil moisture
= 60% ?
Water pump is on
exhaus fan is on
yes yesyes yes
no
yes yes
yesyes
no
end
no
no
nono
Figure 5. Flowchart of the proposed system.
Based on Figure 5, the proposed system is described as follows: The initial process of the Android smartphone
initializes the sensor, then the Android connects to the NodeMCU ESP8266. If it fails then the process is repeated until
it is connected, the soil moisture sensor is active and sends moisture information to Android. If the soil moisture is less
than 50% then the Android application will automatically send commands to the NodeMCU ESP8266 to activate the
water pump until the soil moisture meets the plant's needs or equal to 60% then the NodeMCU ESP8266 automatically
deactivates the pump and sends a notification to Android that the soil moisture is sufficient. A similar process occurs on
the air temperature menu. When the air temperature sensor on the NodeMCU ESP8266 system is active, it automatically
detects the value of the air temperature in the greenhouse and sends the information to Android. If the air temperature is
more than 32℃ then Android sends a command to the NodeMCU ESP8266 to turn on the fan, then after the temperature
drops to 31℃ NodeMCU ESP8266 turns off the fan and sends a notification to Android that the temperature has
stabilized.
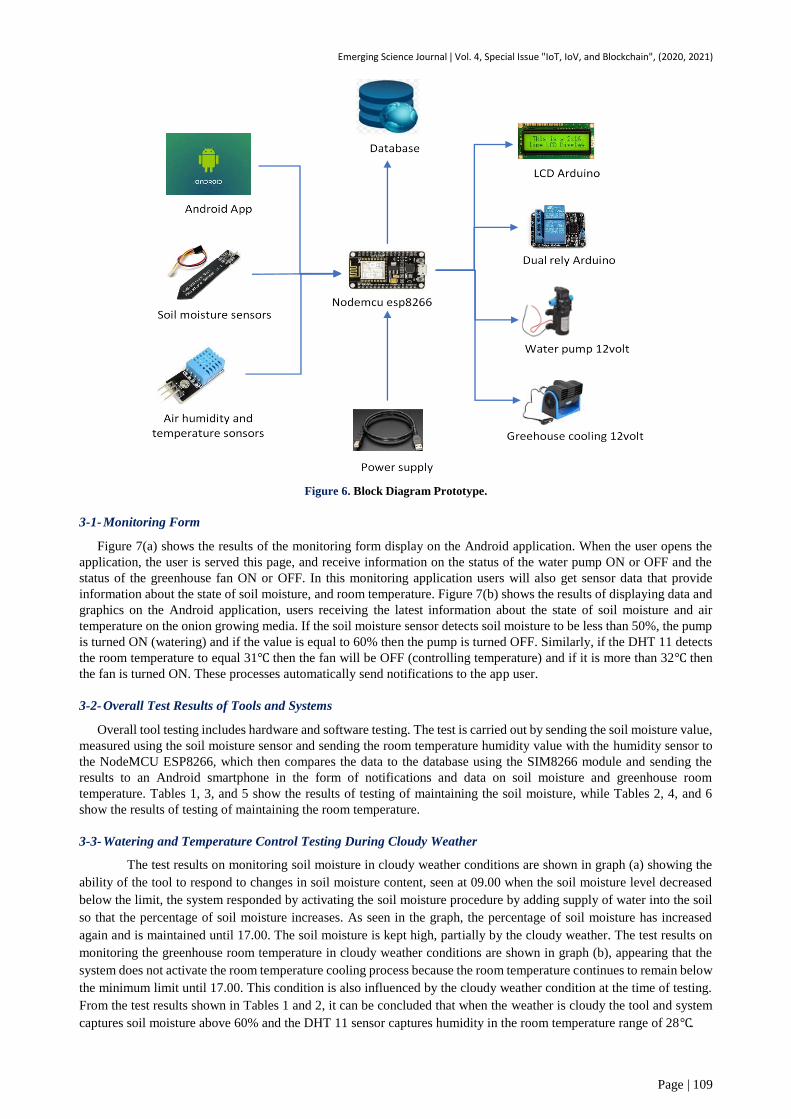
Diagrams are made to map the working process of the tool being built. It aims to recognize the required hardware
and also be able to understand the prototype workflow. Figure 6 is the Prototype Block Diagram consisting of several
components that will be used to build the onion monitoring system including Android, soil moisture sensor, air
temperature sensor, NodeMCU ESP8266, database, power source, Arduino LCD, dual relay on Arduino, 12-volt water
pump and 12-volt greenhouse cooling fan.
3- Results and Discussion
The tool was tested in 3 different weather conditions, namely 1. Cloudy weather, 2. Rainy weather, and 3. Hot
weather. The three weather conditions represent the tropical climate, with three seasons applicable to Merauke Regency.
The monitoring is carried out in several occurrences in the morning until the afternoon, namely at 07.00, 09.00, 11.00,
15.00, and 17.00, during which time onion plants need more nutrients (water) than in the evening. With regard to soil
moisture, the tool will water the soil if the soil moisture content falls below 50%, and the tool will stop watering the soil
when the soil moisture content reaches the level of 60% or more. With regard to room temperature, the tool will activate
the air conditioning fan if the room temperature exceeds 32℃, and the tool will turn off the air conditioning fan if the
temperature is at 31℃ or below.
Emerging Science Journal | Vol. 4, Special Issue "IoT, IoV, and Blockchain", (2020, 2021)
Page | 109
Figure 6. Block Diagram Prototype.
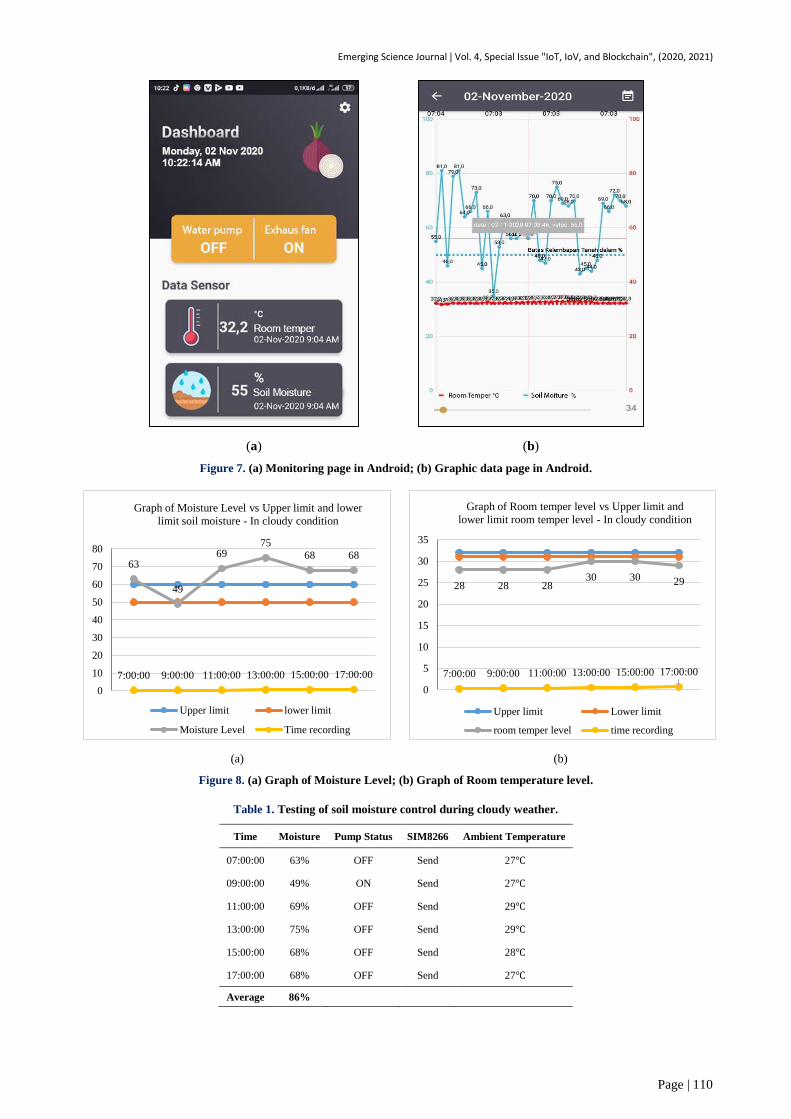
3-1- Monitoring Form
Figure 7(a) shows the results of the monitoring form display on the Android application. When the user opens the
application, the user is served this page, and receive information on the status of the water pump ON or OFF and the
status of the greenhouse fan ON or OFF. In this monitoring application users will also get sensor data that provide
information about the state of soil moisture, and room temperature. Figure 7(b) shows the results of displaying data and
graphics on the Android application, users receiving the latest information about the state of soil moisture and air
temperature on the onion growing media. If the soil moisture sensor detects soil moisture to be less than 50%, the pump
is turned ON (watering) and if the value is equal to 60% then the pump is turned OFF. Similarly, if the DHT 11 detects
the room temperature to equal 31℃ then the fan will be OFF (controlling temperature) and if it is more than 32℃ then
the fan is turned ON. These processes automatically send notifications to the app user.
3-2- Overall Test Results of Tools and Systems
Overall tool testing includes hardware and software testing. The test is carried out by sending the soil moisture value,
measured using the soil moisture sensor and sending the room temperature humidity value with the humidity sensor to
the NodeMCU ESP8266, which then compares the data to the database using the SIM8266 module and sending the
results to an Android smartphone in the form of notifications and data on soil moisture and greenhouse room
temperature. Tables 1, 3, and 5 show the results of testing of maintaining the soil moisture, while Tables 2, 4, and 6
show the results of testing of maintaining the room temperature.
3-3- Watering and Temperature Control Testing During Cloudy Weather
The test results on monitoring soil moisture in cloudy weather conditions are shown in graph (a) showing the
ability of the tool to respond to changes in soil moisture content, seen at 09.00 when the soil moisture level decreased
below the limit, the system responded by activating the soil moisture procedure by adding supply of water into the soil
so that the percentage of soil moisture increases. As seen in the graph, the percentage of soil moisture has increased
again and is maintained until 17.00. The soil moisture is kept high, partially by the cloudy weather. The test results on
monitoring the greenhouse room temperature in cloudy weather conditions are shown in graph (b), appearing that the
system does not activate the room temperature cooling process because the room temperature continues to remain below
the minimum limit until 17.00. This condition is also influenced by the cloudy weather condition at the time of testing.
From the test results shown in Tables 1 and 2, it can be concluded that when the weather is cloudy the tool and system
captures soil moisture above 60% and the DHT 11 sensor captures humidity in the room temperature range of 28℃.
Emerging Science Journal | Vol. 4, Special Issue "IoT, IoV, and Blockchain", (2020, 2021)
Page | 110
(a) (b)
Figure 7. (a) Monitoring page in Android; (b) Graphic data page in Android.
(a) (b)
Figure 8. (a) Graph of Moisture Level; (b) Graph of Room temperature level.
Table 1. Testing of soil moisture control during cloudy weather.
Time Moisture Pump Status SIM8266 Ambient Temperature
07:00:00 63% OFF Send 27℃
09:00:00 49% ON Send 27℃
11:00:00 69% OFF Send 29℃
13:00:00 75% OFF Send 29℃
15:00:00 68% OFF Send 28℃
17:00:00 68% OFF Send 27℃
Average 86%
63
49
6975
68 68
7:00:00 9:00:00 11:00:00 13:00:00 15:00:00 17:00:00
0
10
20
30
40
50
60
70
80
Graph of Moisture Level vs Upper limit and lower
limit soil moisture - In cloudy condition
Upper limit lower limit
Moisture Level Time recording
28 28 2830 30 29
7:00:00 9:00:00 11:00:00 13:00:00 15:00:00 17:00:00
0
5
10
15
20
25
30
35
Graph of Room temper level vs Upper limit and
lower limit room temper level - In cloudy condition
Upper limit Lower limit
room temper level time recording
Emerging Science Journal | Vol. 4, Special Issue "IoT, IoV, and Blockchain", (2020, 2021)
Page | 111
Table 2. Testing of room temperature control in cloudy weather.
Time Temperature room Fan Status SIM8266 Ambient Temperature
07:00:00 28℃ OFF Send 27℃
09:00:00 28℃ OFF Send 27℃
11:00:00 28℃ OFF Send 29℃
13:00:00 30℃ OFF Send 29℃
15:00:00 30℃ OFF Send 28℃
17:00:00 29℃ OFF Send 27℃
Average 28℃
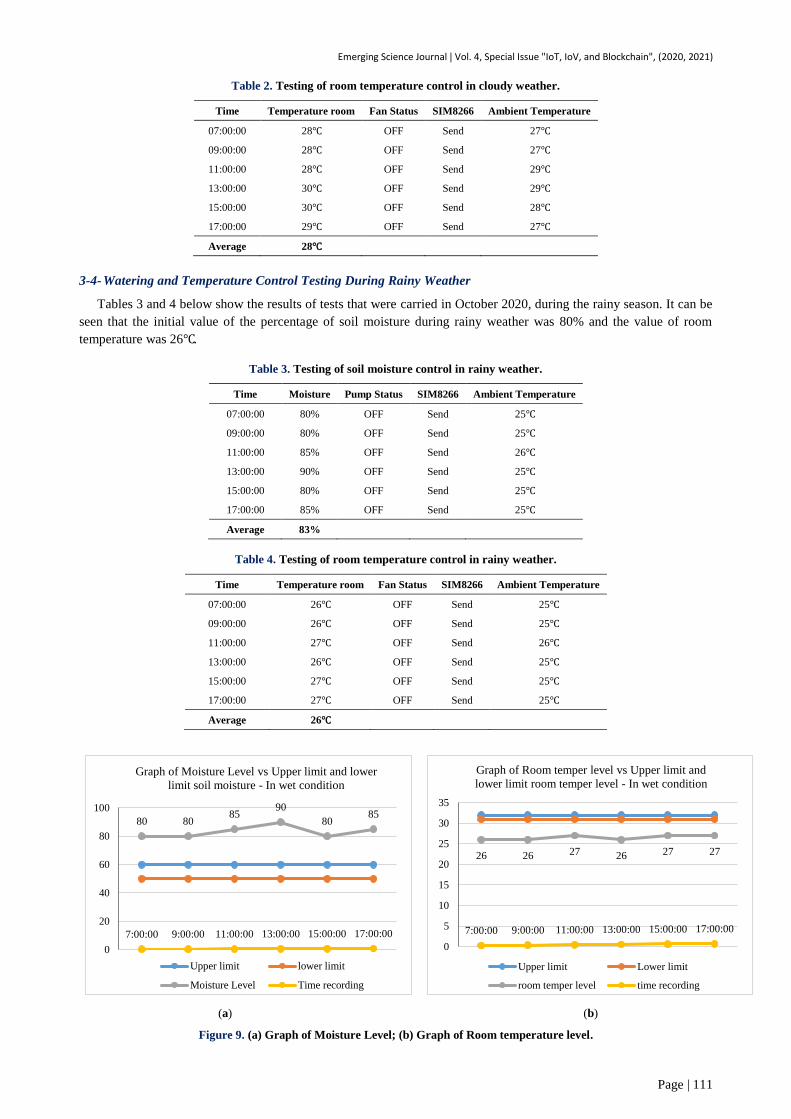
3-4- Watering and Temperature Control Testing During Rainy Weather
Tables 3 and 4 below show the results of tests that were carried in October 2020, during the rainy season. It can be
seen that the initial value of the percentage of soil moisture during rainy weather was 80% and the value of room
temperature was 26℃.
Table 3. Testing of soil moisture control in rainy weather.
Time Moisture Pump Status SIM8266 Ambient Temperature
07:00:00 80% OFF Send 25℃
09:00:00 80% OFF Send 25℃
11:00:00 85% OFF Send 26℃
13:00:00 90% OFF Send 25℃
15:00:00 80% OFF Send 25℃
17:00:00 85% OFF Send 25℃
Average 83%
Table 4. Testing of room temperature control in rainy weather.
Time Temperature room Fan Status SIM8266 Ambient Temperature
07:00:00 26℃ OFF Send 25℃
09:00:00 26℃ OFF Send 25℃
11:00:00 27℃ OFF Send 26℃
13:00:00 26℃ OFF Send 25℃
15:00:00 27℃ OFF Send 25℃
17:00:00 27℃ OFF Send 25℃
Average 26℃
(a) (b)
Figure 9. (a) Graph of Moisture Level; (b) Graph of Room temperature level.
80 8085
90
8085
7:00:00 9:00:00 11:00:00 13:00:00 15:00:00 17:00:00
0
20
40
60
80
100
Graph of Moisture Level vs Upper limit and lower
limit soil moisture - In wet condition
Upper limit lower limit
Moisture Level Time recording
26 26 27 26 27 27
7:00:00 9:00:00 11:00:00 13:00:00 15:00:00 17:00:00
0
5
10
15
20
25
30
35
Graph of Room temper level vs Upper limit and
lower limit room temper level - In wet condition
Upper limit Lower limit
room temper level time recording
Emerging Science Journal | Vol. 4, Special Issue "IoT, IoV, and Blockchain", (2020, 2021)
Page | 112
The test results on monitoring soil moisture in rainy weather conditions are shown in Figure 9. (a). It shows the
system does not activate irrigation procedures to increase soil moisture because the system detects soil moisture which
is still above the maximum limit of ideal soil moisture. The same results were also obtained from the greenhouse room
temperature monitoring test as shown in Figure 9.(b) where the system also did not activate the temperature reduction
procedure because the temperature system monitored was still below the minimum ideal temperature for onion plants.
From the results of the tests that have been carried out, it can be concluded that during rainy weather the tools and
systems capture soil moisture above 80% the DHT 11 sensor captures an average value of 26 ℃.
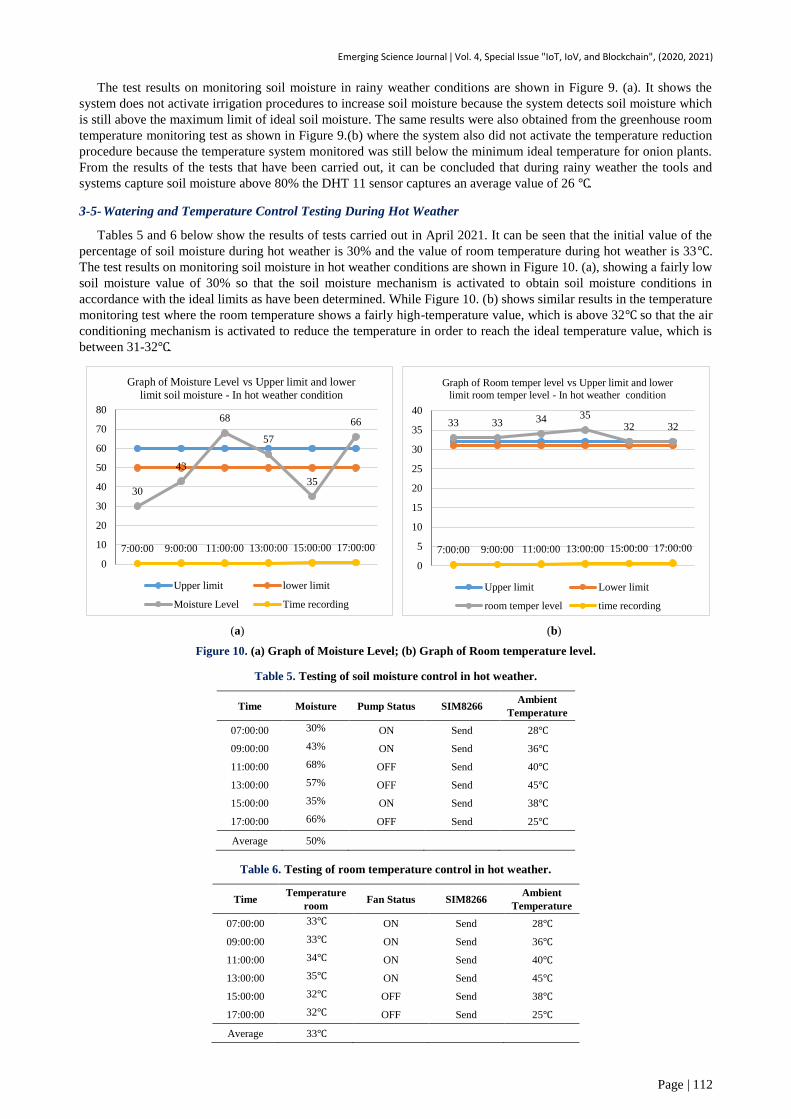
3-5- Watering and Temperature Control Testing During Hot Weather
Tables 5 and 6 below show the results of tests carried out in April 2021. It can be seen that the initial value of the
percentage of soil moisture during hot weather is 30% and the value of room temperature during hot weather is 33℃.
The test results on monitoring soil moisture in hot weather conditions are shown in Figure 10. (a), showing a fairly low
soil moisture value of 30% so that the soil moisture mechanism is activated to obtain soil moisture conditions in
accordance with the ideal limits as have been determined. While Figure 10. (b) shows similar results in the temperature
monitoring test where the room temperature shows a fairly high-temperature value, which is above 32℃ so that the air
conditioning mechanism is activated to reduce the temperature in order to reach the ideal temperature value, which is
between 31-32℃.
(a) (b)
Figure 10. (a) Graph of Moisture Level; (b) Graph of Room temperature level.
Table 5. Testing of soil moisture control in hot weather.
Time Moisture Pump Status SIM8266 Ambient
Temperature
07:00:00 30% ON Send 28℃
09:00:00 43% ON Send 36℃
11:00:00 68% OFF Send 40℃
13:00:00 57% OFF Send 45℃
15:00:00 35% ON Send 38℃
17:00:00 66% OFF Send 25℃
Average 50%
Table 6. Testing of room temperature control in hot weather.
Time Temperature
room Fan Status SIM8266
Ambient
Temperature
07:00:00 33℃ ON Send 28℃
09:00:00 33℃ ON Send 36℃
11:00:00 34℃ ON Send 40℃
13:00:00 35℃ ON Send 45℃
15:00:00 32℃ OFF Send 38℃
17:00:00 32℃ OFF Send 25℃
Average 33℃
30
43
68
57
35
66
7:00:00 9:00:00 11:00:00 13:00:00 15:00:00 17:00:00
0
10
20
30
40
50
60
70
80
Graph of Moisture Level vs Upper limit and lower
limit soil moisture - In hot weather condition
Upper limit lower limit
Moisture Level Time recording
33 33 34 3532 32
7:00:00 9:00:00 11:00:00 13:00:00 15:00:00 17:00:00
0
5
10
15
20
25
30
35
40
Graph of Room temper level vs Upper limit and lower
limit room temper level - In hot weather condition
Upper limit Lower limit
room temper level time recording
Emerging Science Journal | Vol. 4, Special Issue "IoT, IoV, and Blockchain", (2020, 2021)
Page | 113
Tests that have been carried out show that the process of reading the soil moisture on the planting soil by the sensor
works well in any weather condition, and the process of sending data from Arduino to the database successfully functions
and works according to the system and process of reading the DHT 11 sensor at a temperature the planting room, whether
cloudy, rainy or hot, can run well. Similarly, the process of sending data from the Arduino to the database successfully
functions and works according to the system. In soil moisture testing, it is known that there is a significant influence of
weather conditions on the soil moisture conditions even as tested in the greenhouse, whereas the soil moisture in the
greenhouse tends to follow the surrounding weather. If the test is carried out when the weather is hot, the soil moisture
conditions in the greenhouse will be lower, conversely, tests during cloudy or rainy weather conditions show a high
level of soil moisture. Similar conditions also occur in the measurements in the greenhouse room temperature monitoring
tests [20, 21]. Tests carried out during the hot weather show higher temperature values, whereas during rainy and cloudy
weathers, the greenhouse's room temperature conditions are lower than the lowest limit of the ideal temperature for
planting onions.
The findings related to the influence of weather applicable to our test indicate that the prototype greenhouse has a
low level of isolation from the outside environment, so that the weather conditions in the surrounding environment still
greatly affect the soil moisture and the greenhouse room temperature conditions. Thus the monitoring system that has
been built has not been able to measure every detail of the impact of changes that occur in plants, due to the influence
of weather factors external to the greenhouse. Based on these findings, it is necessary to study the design of the prototype
greenhouse in order to increase the ability of the greenhouse to isolate its interior from weather influences from the
surrounding environment. In addition, it is necessary to apply additional procedures in the form of a mechanism for
reducing soil moisture or increasing the temperature of the greenhouse to overcome the condition of the greenhouse
temperature being too low or the moisture being too high, especially during the rainy season. However, the system
created has been able to work in accordance with the needs analysis in monitoring the growth of onion plants.
4- Conclusion
Based on the research and testing objectives that have been produced, it can be concluded that the prototype for
monitoring the growth of onion plants using the NodeMCU ESP8266 is able to work well in controlling and responding
to changes in soil moisture and air temperature in the prototype greenhouse that has been made based on the analysis of
the growing needs of onion plants. The data results indicate that during cloudy weather, the tool and system record a soil
moisture level above 60% and an average temperature of 28℃, during rainy weather, a soil moisture level above 80%
and an average temperature is of 26℃, while in hot weather, a soil moisture level below 50% and an average temperature
of 33 ℃ . This research needs to be developed in a much larger application of different growing media for onion
cultivation. Testing the prototype carried out in three different environmental conditions, namely cloudy, rainy and hot,
to represent the tropical climates, resulted in the finding that the test environment has a significant influence on the
environmental engineering of the greenhouse. This indicates the need for a design analysis on the prototype greenhouse,
which should minimize the intervention of the external environment on the development of the onion growth
environment. The use of drying/heating engineering also needs to be considered to be applied to the future prototype
greenhouse design to anticipate conditions of low temperatures and excessively high soil moisture that might negatively
affect onion cultivation. The results of this study have a great impact on local farmers, namely being able to understand
the composition of the best climate for the growth of onions and educating farmers to be able to use technology in
agriculture.
5- Declarations
5-1- Author Contributions
Conceptualization, I.H.W., Y.M. and R.R.; methodology, I.H.W., Y.M., R.R. and S.S.; software, I.H.W., S.S. and
R.R.; validation, R.R. and S.S.; formal analysis, I.H.W., Y.M. and R.R.; investigation, S.S. and R.R.; resources, S.S.
and R.R; data curation, H.H., S.S. and R.R.; writing—original draft preparation, H.H. S.S. and R.R.; writing—review
and editing, H.H. and R.R.; supervision, H.H.; funding acquisition, H.H., R.R. and S.S. All authors have read and agreed
to the published version of the manuscript.
5-2- Data Availability Statement
The data presented in this study are available in article.
5-3- Funding
The authors received no financial support for the research, authorship, and/or publication of this article.
5-4- Acknowledgements
The authors would like to thank the Agro-Engineering team who have completed this research, and also to Selamet
Iriyanto, a final year student of Informatics Engineering, Musamus University, Merauke, Indonesia who has assisted in
the creation and testing of the system of this research..
Emerging Science Journal | Vol. 4, Special Issue "IoT, IoV, and Blockchain", (2020, 2021)
Page | 114
5-5- Conflicts of Interest
The authors declare that there is no conflict of interests regarding the publication of this manuscript. In addition, the
ethical issues, including plagiarism, informed consent, misconduct, data fabrication and/or falsification, double
publication and/or submission, and redundancies have been completely observed by the authors.
6- References
[1] Doloksaribu, A., H. Ismanto, and D. S. Susanti, “Webgis Model of Agricultural Land Management Using a Remote Sensing
Technique in Merauke Regency of Papua.” International Journal of Innovative Science, Engineering & Technology 04, no. 10
(October 2017): 39-45.
[2] Ismanto, Heru, Abner Doloksaribu, Diana Sri Susanti, and Dina Fitri Septarini. “The Accuracy of Remote Sensing Image
Interprepation On Changes In Land Use Suitability In Merauke Regency Papua.” International Journal of Engineering Trends and
Technology 68, no. 10 (October 25, 2020): 42–47. doi:10.14445/22315381/ijett-v68i10p207.
[3] Letsoin, S. M. A., D. Herak, F. Rahmawan, and R. C. Purwestri, “Land cover changes from 1990 to 2019 in Papua, Indonesia:
Results of the remote sensing imagery.” Sustainability 12, no. 16 (August 2020): 01-18. doi:1010.3390/su12166623.
[4] Obidzinski, K., I Takahashi, A. Dermawan, H. Komarudin, and A. Andrianto, “Can large scale land acquisition for agro-
development in Indonesia be managed sustainably?.” Land Use Policy 30, no. 01 (January 2013): 952-956.
doi:10.1016/j.landusepol.2012.06.018.
[5] Ito, T., N. F. Rachman and L. A. Savitri, “Power to make land dispossession acceptable: a policy discourse analysis of the Merauke
Integrated Food and Energy Estate (MIFEE), Papua, Indonesia.” The Journal of Peasant Studies 41, no. 01 (30 January 2014):
29-50. doi: 10.1080/03066150.2013.873029.
[6] McDonnell, John E. “The Merauke Integrated Food and Energy Estate (MIFEE): An Ecologically Induced Genocide of the Malind
Anim.” Journal of Genocide Research 23, no. 2 (July 31, 2020): 257–278. doi:10.1080/14623528.2020.1799593.
[7] Statistics of Merauke, “Merauke Regency in Figures.” (February 26, 2021). Available online:
https://meraukekab.bps.go.id/publication/2021/02/26/97ca4325f867c3604c247b8c/kabupaten-merauke-dalam-angka2021.html.
(accessed on May 2021).
[8] Kelyaum, Laurentius Kelvin Setiawan, David Oscar Simatupang, and Maria Maghdalena Diana Widiastuti. “Kelayakan Usahatani
Bawang Merah Di Distrik Tanah Miring.” Musamus Journal of Agribusiness 1, no. 1 (October 25, 2018): 16–22.
doi:10.35724/mujagri.v1i1.1299.
[9] Wahyuni, S, J Hestina, I A Setiajie, and E Suryani. “Enhancing Red Onion Agribusiness Development: e-Planting Calendar and
Production Allocation.” IOP Conference Series: Earth and Environmental Science 653, no. 1 (February 1, 2021): 012006.
doi:10.1088/1755-1315/653/1/012006.
[10] Wang, Chin‐Kun. “Health Benefits of Onion Bioactives on Hypercholesterolemia, Cardiovascular Diseases, and Bone
Mineral Density.” Food Frontiers 1, no. 2 (April 29, 2020): 107–108. doi:10.1002/fft2.18.
[11] Sravani, V, SN Saravaiya, BN Patel, HN Chhatrola, Himani B Patel, and JM Vashi. “Response of Plant Bioregulators on Growth
Parameters and Plant Growth Analysis of Onion (Allium Cepa L.).” International Journal of Chemical Studies 8, no. 3 (May 1,
2020): 1312–1316. doi:10.22271/chemi.2020.v8.i3r.9380.
[12] Sriwantoko, S., E. Syam’un, F. Ulfa, “Growth of red onion plant (Allium ascalonicum L.) In an application by phosphate
solubilizing microbes and goat dung compost.” Advances in Environmental Biology 14, no. 07 (July 2020): 23-20.
doi:10.22587/aeb.2020.14.7.4.
[13] Alfiani, A, F Haring, and E Syam’un. “Growth and Production of Red Onion (Allium Ascalonicum L.) with the Application of
Monosodium Glutamate and Endophytic Fungi.” Journal of Physics: Conference Series 1899, no. 1 (May 1, 2021): 012001.
doi:10.1088/1742-6596/1899/1/012001.
[14] Gupta, S., W. A. Stirk, L. Plackova, M. G. Kulkarni, K. Dolezal and J. V. Staden, “Interactive effects of plant growth-promoting
rhizobacteria and a seaweed extract on the growth and physiology of Allium cepa L. (onion).” Journal of Plant Physiology 262,
no. 153437 (July 2021): 01-11. doi:10.1016/j.jplph.2021.153437.
[15] Podder, A. K., A. A. Bukhari, S. Islam, S. Mia, M. A. Mohammed, N. M. Kumar, K. Cengiz, and K. H.Abdulkareem, “IoT based
smart agrotech system for verification of Urban farming parameters.” Microprocessors and Microsystems 82, no. 104025 (April
2021): 01-10. doi:10.1016/j.micpro.2021.104025.
[16] Ezirim, O. N., Okpoechi, C.U. “Community-driven Development Strategy for Sustainable Infrastructure” Journal of Human,
Earth, and Future 01, no 2 (June 2020): 48-59. doi:10.28991/HEF-2020-01-02-01.
[17] Shamshiri, R. R., I. Bojic, E. V. Henten, S. K. Balasundram, V. Dworak, M. Sultan and C. Weltzien, “Model-based evaluation
of greenhouse microclimate using IoT-Sensor data fusion for energy efficient crop production.” Journal of Cleaner Production
263, no. 121303 (August 2020): 01-17. doi:10.1016/j.jclepro.2020.121303.
Emerging Science Journal | Vol. 4, Special Issue "IoT, IoV, and Blockchain", (2020, 2021)
Page | 115
[18] Khoa, T. A., M. M. Man, T. Y. Nguyen, V. D. Nguyen, and N. H. Nam, “Smart agriculture using IoT multi-sensors: A novel
watering management system.” Journal of Sensor and Actuator Networks 08, no. 45 (August 2019): 01-22,
doi:10.3390/jsan8030045.
[19] Sekaran, K., M. N. Meqdad, P. Kumar, S. rajan, and S. Kadry, “Smart agriculture management system using internet of things”
TELKOMNIKA (Telecommunication Computing Electronics and Control) 18, no. 03 (June 2020): 1275-1284.
doi:10.12928/TELKOMNIKA.v18i3.14029.
[20] Rahmat, R F, S Adnan, R Anugrahwaty, E P S Alami, and B Siregar. “Red Onion Growth Monitoring System in Hydroponics
Environment.” Journal of Physics: Conference Series 1235 (June 2019): 012117. doi:10.1088/1742-6596/1235/1/012117.
[21] Kaburuan, E. R., R. Jayadi, and Harisno, “A design of IoT-based monitoring system for intelligence indoor micro-climate
horticulture farming in Indonesia” 4th International Conference on Computer Science and Computational Intelligence 2019
(ICCSCI) (September 2019). doi;10.1016/j.procs.2019.09.001.
[22] Khan, Zahid, Muhammad Zahid Khan, Sikandar Ali, Irshad Ahmed Abbasi, Haseeb Ur Rahman, Umar Zeb, Hizbullah Khattak,
and Jiwei Huang. “Internet of Things-Based Smart Farming Monitoring System for Bolting Reduction in Onion Farms.” Edited
by Imran Sarwar Bajwa. Scientific Programming 2021 (July 23, 2021): 1–15. doi:10.1155/2021/7101983.
[23] Kapoulas, N., A. Koukounaras, and Z. S. Ilic, “Nutritional quality of lettuce and onion as companion plants from organic and
conventional production in north Greece.” Scientia Horticulturae 219, no. 01 (May 2017): 310-318.
doi:10.1016/j.scienta.2017.03.027.
[24] Guirado-Clavijo, R., J. A. Sanchez-Molina, H. Wang, and F. Bienvenido, “Conceptual Data Model for IoT in a Chain-Integrated
Greenhouse Production: Case of the Tomato Production in Almeria (Spain).” IFAC-PapersOnline 51, no. 17 (2018): 102-107.
doi:10.1016/j.ifacol.2018.08.069.
[25] Kumar, A., V. Singh, S. Kumar, S. P. Jaiswal, and V. S. Bhadoria, “IoT enabled system to monitor and control greenhouse.”
Materialstoday: Proceedings (December 2020): 01-05. doi:10.1016/j.matpr.2020.11.040.
[26] Azhar, F. C., B. Irawan, and R. E. Saputra, “Controlling and monitoring ornamental plants care remotely using android
application.” 2017 IEEE Asia Pacific Conference on Wireless and Mobile (APWiMob) (November 2017).
doi:10.1109/APWiMob.2017.8283993.
[27] Santiago Jr, C. S., J. A. V. Murray, L. Z. D. Pieza, and S. Dizon, “Plant Monitoring System for Vegetable Growers.” International
Journal of Recent Technology and Engineering (IJRTE) 08, no. 06 (March 2020): 3097–3100. doi:10.35940/ijrte.f8393.038620.
[28] Arduino.cc, “Arduino official Store.” (2021). Available online https://www.arduino.cc/en/Guide/Introduction (accessed on July
29, 2021).
[29] Hariono, T., and M. C. Putra, “Data Acquisition for Monitoring IoT-Based Hydroponic Automation System Using ESP8266.”
NEWTON: Networking and Information Technology 01, no. 01 (June 2021): 01-07.
[30] Ahmed, I. A. O., and M. E. E. Daleel. “Automated Use Case Diagram Generation with Non-functional Requirements using
Neural Network.” International Journal of Applied Information Systems (IJAIS) 12, no. 34 (October 2020): 1-4.
[31] Arifin, Mohammad Nazir, and Daniel Siahaan. “Structural and Semantic Similarity Measurement of UML Use Case Diagram.”
Lontar Komputer : Jurnal Ilmiah Teknologi Informasi 11, no. 2 (July 13, 2020): 88. doi:10.24843/lkjiti.2020.v11.i02.p03.