utilizing local data to catalyze coalitions, address ... · utilizing local data to catalyze...
TRANSCRIPT

Utilizing Local Data to Catalyze Coalitions, Address Disparities,
and Improve HealthMelissa Jordan, MS
Florida Department of Health
Eva Wong, PhDPublic Health Seatt le-King County
Vickie Boothe, MPHCenters for Disease Control and Prevention
Association for Community Health Improvement ConferenceMarch , 2016
Department of Health and Human ServicesCenters for Disease Control and Prevention

Learning Object ives
Utilize public health resources to meet CHNA requirements:
Local measures of population health & determinants Identify “hot spots” of health disparities; Understand underlying social determinants driving disparities Catalyze collective actions Raise awareness on the role of place-based factors in creating health
Select & evaluate interventions Strongest evidence Higher impact Cost effective

Final 2014 IRS CHNA Regulat ions The hospital must “solicit” and “take into account” input from a state or local
health department and members of medically underserved (disparately impacted), low-income, and minority populations.
The hospital may use any criteria to prioritize the significant health needs it identifies including: burden, scope, severity, or urgency of the health need; the estimated feasibility and effectiveness of possible interventions; the health disparities associated with the need; or importance the community places on addressing the need.
Health needs may include “financial and other barriers to accessing care, preventing illness, ensuring adequate nutrition, or social, behavior and environmental factors that influence health in the community.”
2016 CHNAs must include an impact evaluation of the actions in the previous CHNA.

State Public Health Resourcesfor
Community Health Needs Assessments

N E I G H B O R H O O D - L E V E L M E A S U R E S O F P O P U L A T I O N H E A L T H A N D S O C I A L D E T E R M I N A N T S I N F L O R I D A
M E L I S S A M . J O R D A N , M S
C O L L A B O R A T O R S : K R I S T I N A K I N T Z I G E R , P H D
C H R I S D U C L O S , M S , G I S P
A S S O C I A T I O N F O R C O M M U N I T Y H E A L T H I M P R O V E M E N T2 0 1 6 N A T I O N A L C O N F E R E N C E
M A R C H 2 , 2 0 1 6
5
Sustainable Population Health Improvement: Tools for the Journey
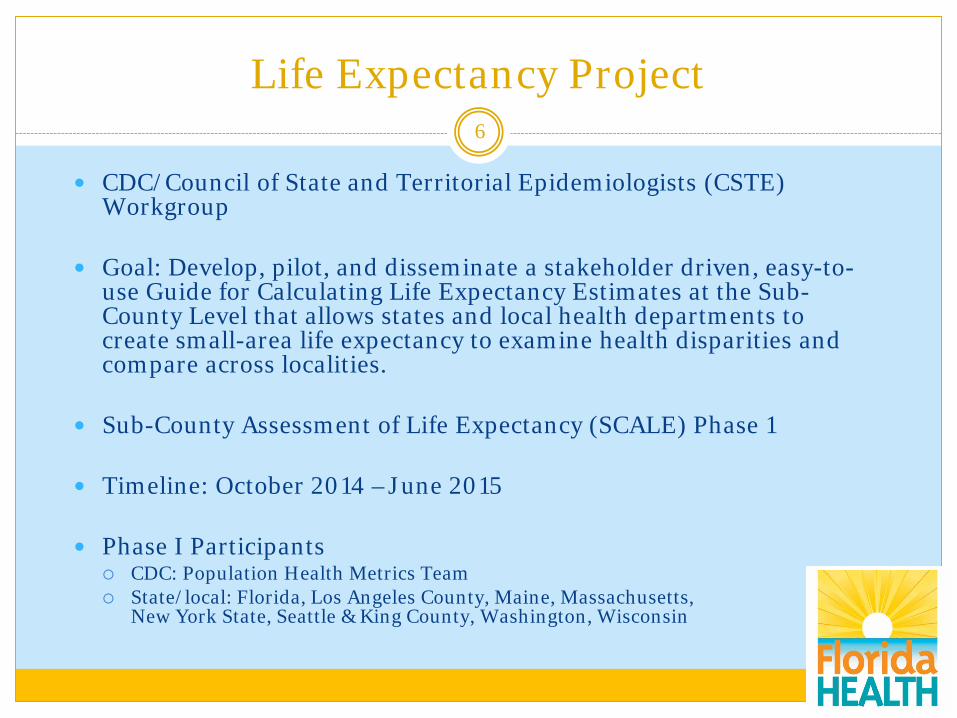
Life Expectancy Project
CDC/Council of State and Territorial Epidemiologists (CSTE) Workgroup
Goal: Develop, pilot, and disseminate a stakeholder driven, easy-to-use Guide for Calculating Life Expectancy Estimates at the Sub-County Level that allows states and local health departments to create small-area life expectancy to examine health disparities and compare across localities.
Sub-County Assessment of Life Expectancy (SCALE) Phase 1
Timeline: October 2014 –June 2015
Phase I Participants CDC: Population Health Metrics Team State/local: Florida, Los Angeles County, Maine, Massachusetts,
New York State, Seattle & King County, Washington, Wisconsin
6

Life Expectancy – Part II
SCALE Phase II
Goals Recruit states/locals to test the tool and Guide Expand coverage for areas without sufficient populations Engage subject matter experts on best practices for life
expectancy visualization (mapping) and messaging
Timeline: August 2015 –June 2016
Approximately 25 state and local health departments participating
7

Why Life Expectancy?8
Life expectancy at birth Number of years a newborn can expect to live if current age
specific mortality rates in that population remained the same over time
Allows us to look at disparities by place Identify areas where underlying health behaviors,
social determinants, and other community factors may be targeted for public health intervention

9

10

Example: Leon CountyZIP Codes = 10, Population = 276,000
11
Gender County-Level Estimate (years)
Both 79.39
Males 76.97
Females 81.62
Gender Min/Max
ZIP Code
ZIP Code-Level Estimate (years)
Both Min 32310 74.16
Max 32312 81.72
Males Min 32310 70.42
Max 32312 80.36
Females Min 32310 78.13
Max 32309 84.18
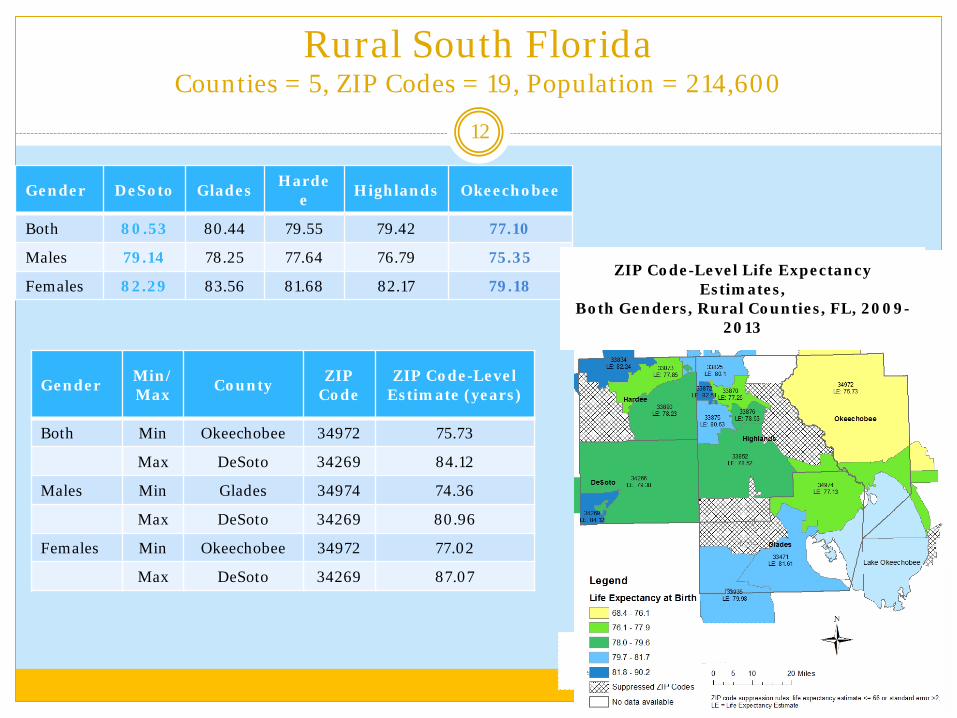
Rural South FloridaCounties = 5, ZIP Codes = 19, Population = 214,600
12
Gender DeSoto Glades Hardee Highlands Okeechobee
Both 80.53 80.44 79.55 79.42 77.10
Males 79.14 78.25 77.64 76.79 75.35
Females 82.29 83.56 81.68 82.17 79.18
Gender Min/Max County ZIP
CodeZIP Code-Level
Estimate (years)
Both Min Okeechobee 34972 75.73
Max DeSoto 34269 84.12
Males Min Glades 34974 74.36
Max DeSoto 34269 80.96
Females Min Okeechobee 34972 77.02
Max DeSoto 34269 87.07
ZIP Code-Level Life Expectancy Estimates,
Both Genders, Rural Counties, FL, 2009-2013

13

Life Expectancy: Limitations14
Suppression based on low numbers of deaths and/or population Geographic aggregation Mapping special facilities or populations (e.g., universities,
prisons, assisted living facilities)
ZIP Code to ZCTA (ZIP Code Tabulation Area) linkage
Changing ZIP Code boundaries

Incorporating Social Determinants of Health (SDoH)
SDoH variables are factors in the social and/or built environment that may improve or diminish the health of individuals and communities.
These factors have repeatedly been found to be associated with heart disease and stroke in the U.S.
Such area-level factors have been used to match prevention programs and policies to the needs of communities.

Example: SDoH & Acute MI Morbidity
To characterize the relationship between neighborhood-level characteristics and rate of acute MI Florida residents Years 2008-2012 ZIP Code level Using emergency department (ED) and inpatient hospitalizations
Examine variables individually and combined for the outcomes of interest
Understand both the global and local relationship of these variables with chronic disease morbidity/ mortality

• Male (%)• Race/ethnicity (%): African American,
Hispanic, minority• Age 65 years and older (%)• Married (%)
Demographic
• Median household income ($)• Below poverty level (%)• Unemployed (%)• Education (%): less than high school, high
school, college• Rural (%)
Socioeconomic
• Median household value ($)• Owner-occupied housing units (%)
Housing/Built Environment
• Number of MI-related ED and hospital visits• Crude rate per 100,000• Age-adjusted rate per 100,000
Acute Myocardial Infarction
Soci
al D
eter
min
ants
of H
ealt
h

Rural areas in central and north Florida and the
Panhandle
Where is the greatest impact of acute MI in FL?

Bivariate OLS Associations Between SDoH Variables and MI RatesVariable Coefficient Std Error p-value Robust p-value% Male 46.5899 6.1996 <0.0001 0.0205% African American 7.4856 1.7879 <0.0001 0.0017% Hispanic 1.4084 1.5336 0.3587 0.3710% Minority 8.0421 1.6418 <0.0001 0.0160% Aged 65 Years and Older -7.5539 2.6205 0.0040 0.0056% Married -14.3978 2.3866 <0.0001 0.0010Median Household Income ($) -0.0172 0.0013 <0.0001 <0.0001% Below Poverty Level 32.7632 2.9563 <0.0001 <0.0001% Unemployed 14.1161 10.9829 0.1990 0.5201% Less than High School Diploma 44.4410 2.6415 <0.0001 0.0002% High School Diploma -44.4410 2.6415 <0.0001 0.0002% College Degree -27.0983 1.9233 <0.0001 <0.0001% Rural 6.3550 0.8169 <0.0001 <0.0001Median Household Value ($) -0.0027 0.0002 <0.0001 <0.0001% Owner-Occupied Housing -2.4367 1.9230 0.2054 0.1546

Local Statistics

Environmental Public Health Tracking Network

Example: Sub-County Data Tools

Customized Community Profiles – by Topic

End User Aggregation

Future Work
Incorporate life expectancy and SDoH measures into existing community profile reports and data visualization tools Collaboration with other public health programs (e.g., chronic disease,
lead) and local health departments Combine data on environmental hazards, health outcomes, and social
vulnerability
Support more local activities Community health assessments Community health improvement plans Health impact assessments
Continue discussions on limitations and concerns with sub-county data and solutions

www.FloridaHealth.gov
Melissa JordanSenior Environmental Epidemiologist
(850) [email protected]
To protect, promote, & improve the health of all people in Florida through integrated state, county, & community efforts.
Florida Department of HealthDivision of Community Health Promotion
Public Health Research Unit

Local Public Health Resourcesfor
Community Health Needs Assessments
Eva Wong, PhDPublic Health-Seattle & King County

Impact on Population Health

Institute for Health Metrics and Evaluation
Life expectancy, by county, compared to the world’s 10 best countries

Life Expectancy in King County by Census Tract
30
• Difference of 30 years! (Low of 66; High of 96)
• King County Average: 81.6
• Tracts with the lowest life expectancy are more than 40 years behind the longest lived countries

Lack of Physical Activity Diabetes
Life Expectancy Tobacco Use Frequent Mental Distress Adverse Childhood Experiences
Preventable HospitalizationObesity
31

Communities of Opportunity
32
Health, social and economic measures by census tractMeasures Lowest decile Highest decile
Life expectancy 74 years 87 years
Health, broadly defined
Adverse childhood experiences
20% 9%
Frequent mental distress
14% 4%
Smoking 20% 5%
Obesity 33% 14%
Diabetes 13% 5%
Preventable hospitalizations
1.0% 0.4%
Housing
Poor housing condition
8% 0%
Economic opportunity
Low-income, below 200% poverty
54% 6%
Unemployment 13% 3%
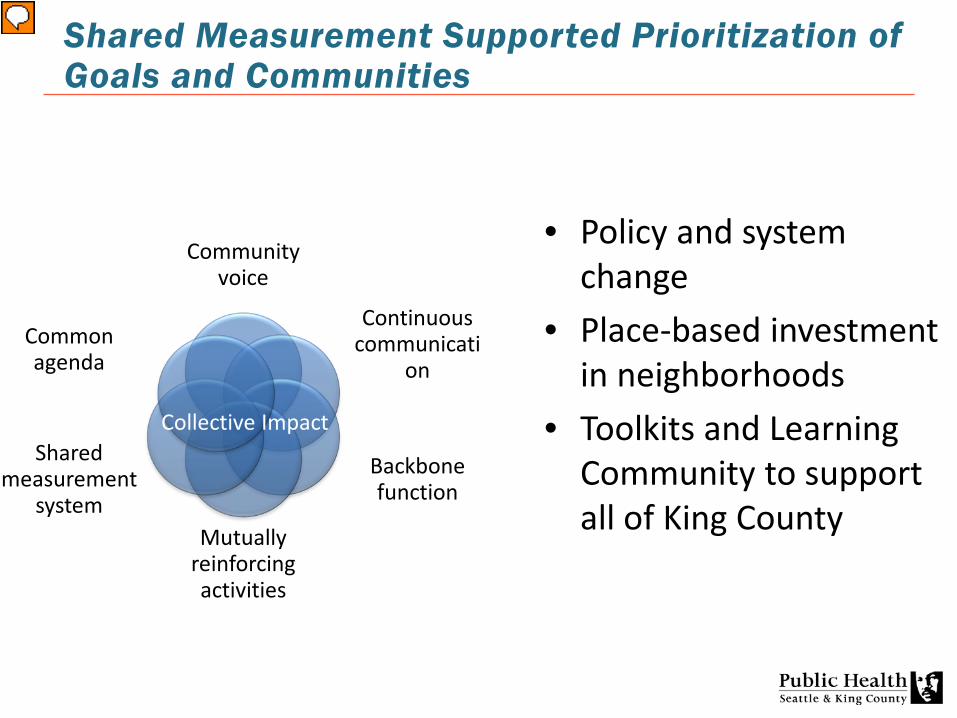
Shared Measurement Supported Prioritization of Goals and Communities
• Policy and system change
• Place-based investment in neighborhoods
• Toolkits and Learning Community to support all of King County
Community voice
Continuous communicati
on
Backbone function
Mutually reinforcing activities
Shared measurement
system
Common agenda
Collective Impact
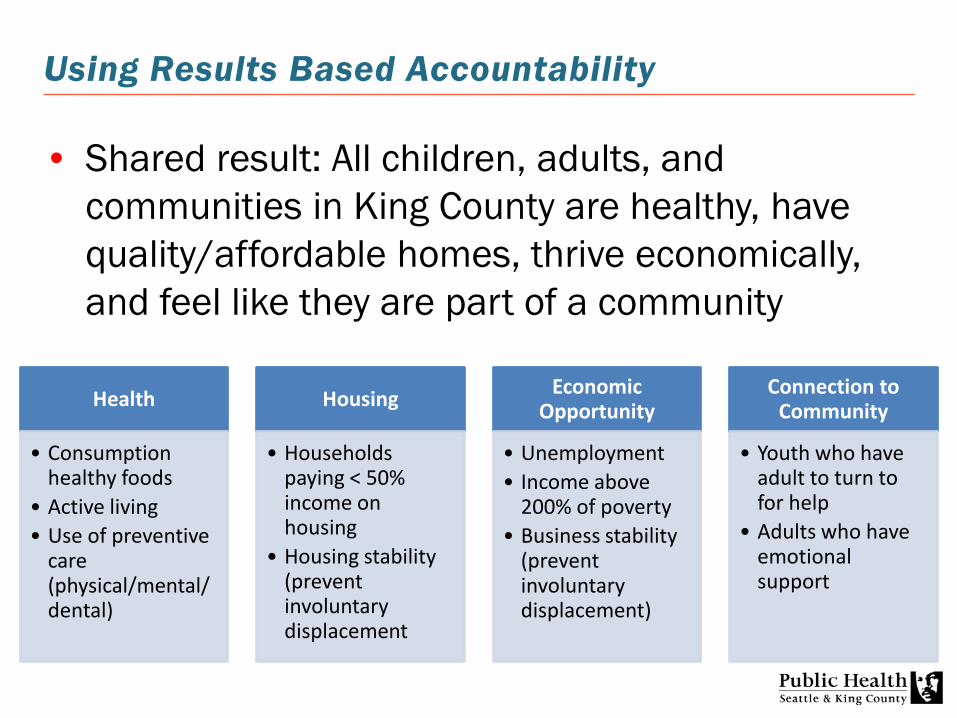
Using Results Based Accountability
• Shared result: All children, adults, and communities in King County are healthy, have quality/affordable homes, thrive economically, and feel like they are part of a community
Health
• Consumption healthy foods
• Active living• Use of preventive
care (physical/mental/ dental)
Housing
• Households paying < 50% income on housing
• Housing stability (prevent involuntary displacement
Economic Opportunity
• Unemployment• Income above
200% of poverty• Business stability
(prevent involuntary displacement)
Connection to Community
• Youth who have adult to turn to for help
• Adults who have emotional support

A Process Framework
RBA is a framework that offers a disciplined way of thinking and taking action that:• Communities can use to improve the conditions of well being for children, youth, families and the whole community, and • Leaders can use to improve the quality and effectiveness of programs, policies, agencies and service systems.
Why RBA?

Economic Opportunity: Baseline
36

37
What’s the Story Behind the Curve?

Communities Contributing Data
38
• Sites are supplementing the COO baseline data report with community data– Community survey/program data– Qualitative data
• Data for indicators that cut across the sites:– Housing affordability and quality– Employment– Wages– Business ownership and stability– Education

Next Questions
• Partners come to the table• Develop the shared measurement system• Determine what works to turn the curve• Propose actions• Evaluate performance measures:
– What did we do?– How well did we do it?– Is anyone better off?

How Do You Measure Change?
40
Policy change•Written laws, regulations, programs, procedures or budget
commitments, as adopted by a formal governing body• Smoke-free multi-unit housing , parks, and other settings• Swimming pool scholarship program
Infrastructure change
• Sustainable changes in practices & protocols withininstitutions
•Routinely training cafeteria staff on whole food cooking• Increase f/v purchasing by 20% per year
System change •New, ongoing interactions across sectors
• Farm to schools/childcare/senior centers•City planning and public health departments
Environment and social
change
•Physical, economic and social surroundings•Hydration stations•Placement of items in school cafeterias•Promoting foods using superhero themes
Behavior change
•Current smoker, 2nd hand smoke•Obesity, overweight•Physical activity•Healthy eating
REACH

Beware of Data Issues for Small Areas
• BRFSS data concerns– Standard reporting guidelines would result in data
suppression for some indicators at certain sites– 5-year rolling averages limits ability to make
conclusions about change over time– Which indicators of use of preventive care are most
relevant?– Missing information on some residents (given in
English and Spanish only)• Need relationships with school districts for
permission to release school district-level data
41
Federal Public Health Resourcesfor
Community Health Needs AssessmentsOverview
Vickie Boothe, MPHActing Senior Evaluator
Division of Community HealthCenters for Disease Control and Prevention

Sub-County Assessment of Life Expectancy (SCALE) Project
Three Year Project CDC, Council for State and Territorial Epidemiologists, 8 Health Departments
Goal Develop and disseminate a stakeholder driven, easy to use Guide for
Calculating and Visualizing Life Expectancy Estimates at the Census Tract Level
Status: Draft Guide & Software Pilots 25 State & Local Health Departments Completion June ‘16
Pract ice & Research Applicat ions Identify and monitor community hot spots of health disparities Investigate associated behavioral, social and environmental factors Catalyze multi-sector actions on place based SDOH

Area-based Socioeconomic MeasuresHealth Disparities by Census Tract Poverty

Harvard Geocoding Projects I & II
MA and RI 1990 Data 5 Leading Causes of Death and
Cancer Sites, HIV, Homicide
Different area sizes and SES measures
Census Tract (CT) Poverty Detected Disparit ies Missed by other measures
> Disparities by race/ethnicity
Within race/ethnic groups
Source: Harvard Geocoding Projects I & II (Nancy Krieger)1998 – 2005

CSTE Disparit ies Pilot Project
11 States and localities
Multiple health outcomes
CT > 20% in poverty
Consistently associated with greatest disparities
Reflect confluence of neighborhood risk factors including unemployment, deteriorated housing, violent crime, material resource access, behavioral factors, access to care, and pollution.*
*Krieger N, Chen JT, Waterman PD, Soobader MJ, Subramanian SV, Carson R. Geocoding and monitoring of US socioeconomic inequalities in mortality and cancer incidence: does the choice of area-based measure and geographic level matter?: The Public Health Disparities Geocoding Project. Am J Epidemiol 2002; 156:471-482.
CSTE Pilot : Harvard Geocoding Project

Age-adjusted Mortality Rate by % in census tract who live
below poverty, NYC, 2000
0
2
4
6
8
10
12
<5% 5-9% 10-19% 20-29% 30-39% 40+%
Dea
th R
ate
per 1
000
Percent below poverty in census tractSource: Hadler J. Analysis of Public Health Data Using Census Tract-level Poverty
CSTE Pilot : New York City Example

Age-adjusted Mortality Rate by % in census tract who live
below poverty by race/ethnicity, NYC, 2000
02468
101214
White (non-H) Black (non-H) Hispanic Asian
<5% 5-9% 10-19% 20-29% 30-39% 40+%
Dea
th R
ate
per 1
000
Percent below poverty in census tract
CSTE Pilot : New York City Example

Balt imore Poverty vs Life Expectancy
Joint Center for Political and Economic Studies. Place Matters for Health in Baltimore: Ensuring Opportunities for Good Health for All. Sept. 2012

NEW SCIENTIFIC RESOURCES FOR SELECTING AND EVALUATING INTERVENTIONS

3 Buckets of Prevent ion
Source: Auerbach, J. (2015). "The 3 Buckets of Prevention." J Public Health Manag Pract.

Bucket 3 List : Methods
Highest evidence level rat ing: University of Wisconsin County Health
Rankings & Roadmaps What Works for Health
Secondary source (QA/QC) The Guide to Community Preventive Services
Excluded all clinical interventions Bucket 1: Traditional Clinical Bucket 2: Innovative Clinical
• 6/18 Initiative
Results: 150 Potent ial Intervent ions One or more systematic reviews

Bucket 3 List : Methods Intervent ion Inclusion Criteria 5 Year Timeframe
• Measurable outcomes, or • Surrogate measures
o Causally linked to outcomeso Readily available
Costs data• Cost savings or neutral
Lack of saturation • Implemented < 50% of States
CDC Program Review Additional interventions considered

Bucket 3 List : Results 26 Intervent ions met all criteria
Total population Subpopulations
• behavioral risk factors (e.g., smoking)• low income
Social determinants of health
Organized by life stage Before birth & infancy Early childhood School Age Young Adults Adults Older Adults All Life Stages/SDOH

Bucket 3 List : Results Before Birth & Infancy
Breastfeeding (Baby Friendly Hospitals) Pregnancy Peer Support Programs
(Centering Pregnancy) Early Childhood Home Visitation Programs
Early Childhood Head Start Center-Based Early Childhood Education Pre-kindergarten
Early Adult & Adult Worksite obesity prevention Universal Motorcycle Helmet Laws Alcohol Unit Price for Increase Tobacco Unit Price Increase Comprehensive statewide tobacco program Mass-Reach Health Communication
Interventions for Tobacco Syringe Exchange Program
School Age Multi-component obesity prevention Safe Routes to School Family Group Program (Family and
Schools Together) Multidimensional Foster Care Treatment School Based Violence Prevention
Programs
Older Adult Activity Programs for Older Adults (includes
Multi-component fall prevention)

Bucket 3 List : Results Social Determinants of Health
Public Transportation: System Introduction or Expansion Clean Diesel Technology Fleet Transition Smoke-free policies: Indoor areas Housing Choice Voucher Program House Rehabilitation Loan and Grant Programs State/Local Earned Income Tax Credits (EITC) Prer-kindergarten (Univeral or Targeted) Head Start
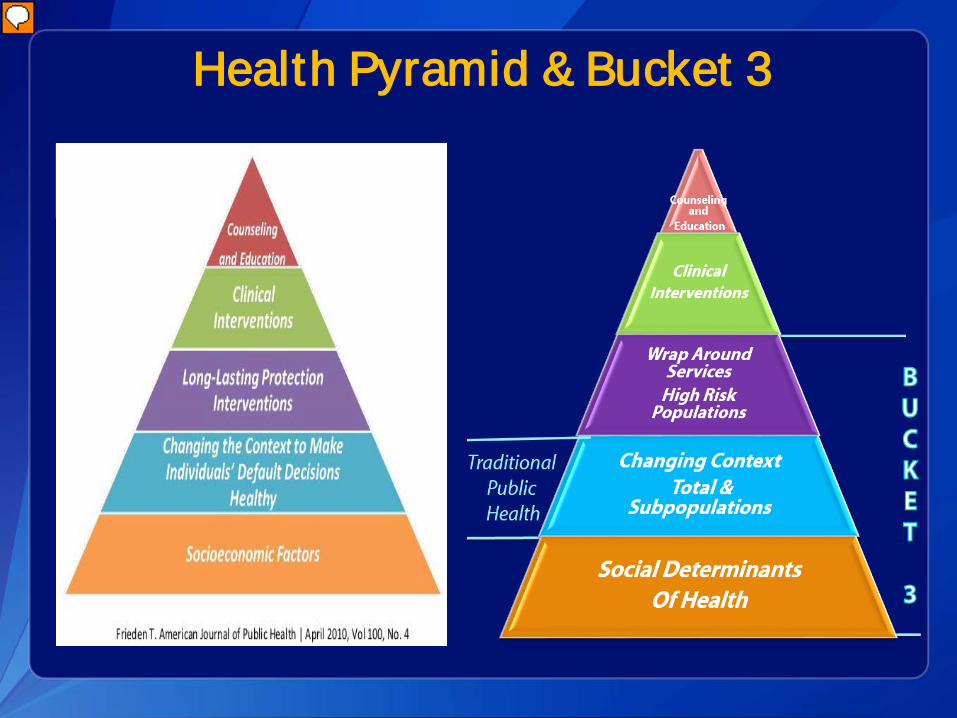
Health Pyramid & Bucket 3

CDCFUNDED COMMUNITY HEALTH PROGRAMS: BUCKET 3 EXAMPLE
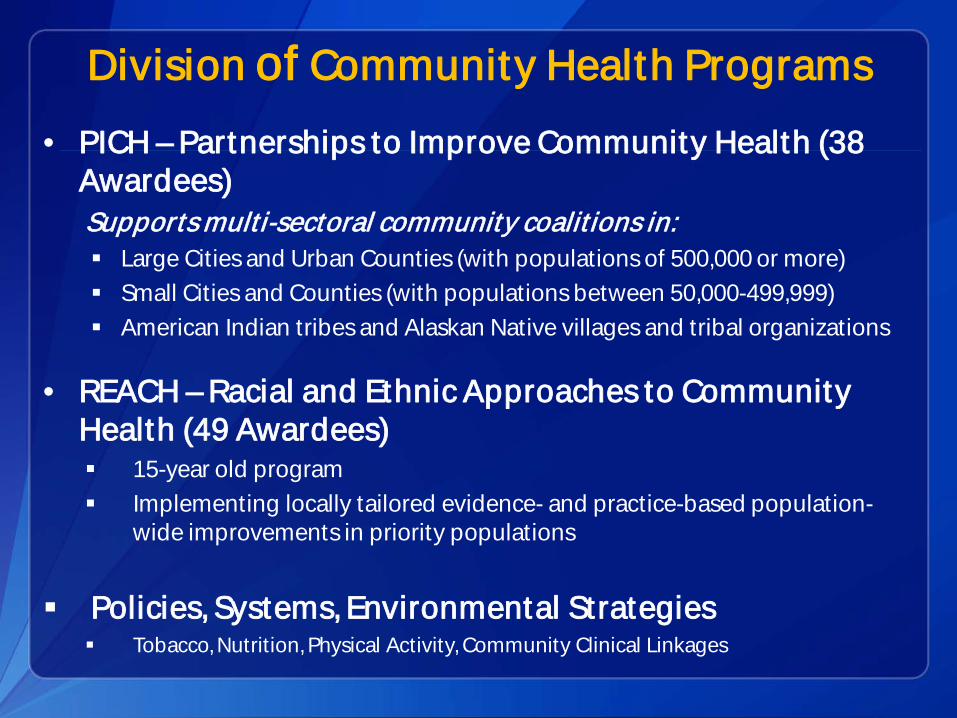
• PICH – Partnerships to Improve Community Health (38 Awardees) Supports mult i-sectoral community coalit ions in: Large Cities and Urban Counties (with populations of 500,000 or more) Small Cities and Counties (with populations between 50,000-499,999) American Indian tribes and Alaskan Native villages and tribal organizations
• REACH – Racial and Ethnic Approaches to Community Health (49 Awardees) 15-year old program Implementing locally tailored evidence- and practice-based population-
wide improvements in priority populations
Policies, Systems, Environmental Strategies Tobacco, Nutrition, Physical Activity, Community Clinical Linkages
Division of Community Health Programs

PICH & REACH Bucket 3 Example: Smoke Free Mult i-unit Housing
Issue: No safe level of exposure to second-hand smoke (SHS) Each year, among non-smokers* SHS exposure
• ~ 34,000 heart disease-related deaths• > 8,000 deaths from stroke• > 7,300 lung cancer deaths
MUH SHS spread from units, common areas, decks• Air vents, hallways, electrical outlets, cracks in ceilings & walls
U.S. residents of mult i-unit housing (MUH)**• ~ 70 of 80 million in MUH without smoke-free policies• ~ 45% higher cotinine levels among children living in MUH
Public Housing**• 88% MUH• 52% are older adults or disabled residents; 43% are children
* HHS 2014 **King et al. 2013

Smoke Free Policies: Indoor Air
Evidence-based, Cost Effect ive Intervent ion
Community Guide Systematic Review* 82 studies Strong evidence of effectiveness Across varied populations and settings
Short-term Health Benefits 50% reduction people exposed to SHS 3.8 percentage point increase smoking cessation 5.1% reduction CVD hospital admissions 20.1% reduction asthma-related hospital admissions
Economic Analysis Health care savings $700 - $1,297 per person $18M annual cost savings for MUH in CA Cleaning; Repairs; Maintenance
*Community Guide 2012

PICH & REACH Smoke Free Mult i-unit Housing: Est imated Impact
Year 1 Actual & Year 2 Projected Reach = 470,286 88,786 Low Income Residents 38,178 children 46,169 older or disabled adults
381,500 Private/Market Rate Residents 152,600 children
Public Health Impact 9,898 fewer smokers* 32 fewer CVD hospitalizations 115 fewer asthma hospitalizations
Annual Cost Savings $48.7M SHS-related healthcare $1.14M renovations $3.79M fire loss
* Cessation impacts & cost savings not included
Methods from King et al. 2013

Take Away Messages Available sub-county data Identify minority, low income, & disparately impacted
populations Target upstream determinants for action Catalyze multi-sector partnerships
Exist ing frameworks (Collect ive Impact, Results Based Accountability) Establish shared vision Coordinate multisector actions Focus on quality of life/well being Monitor results focused indicators
Evidence-based intervent ion resource Impactful, measurable & cost effective Total populations and subpopulations Upstream determinants, contextual changes, high risk
population services
Collective Impact
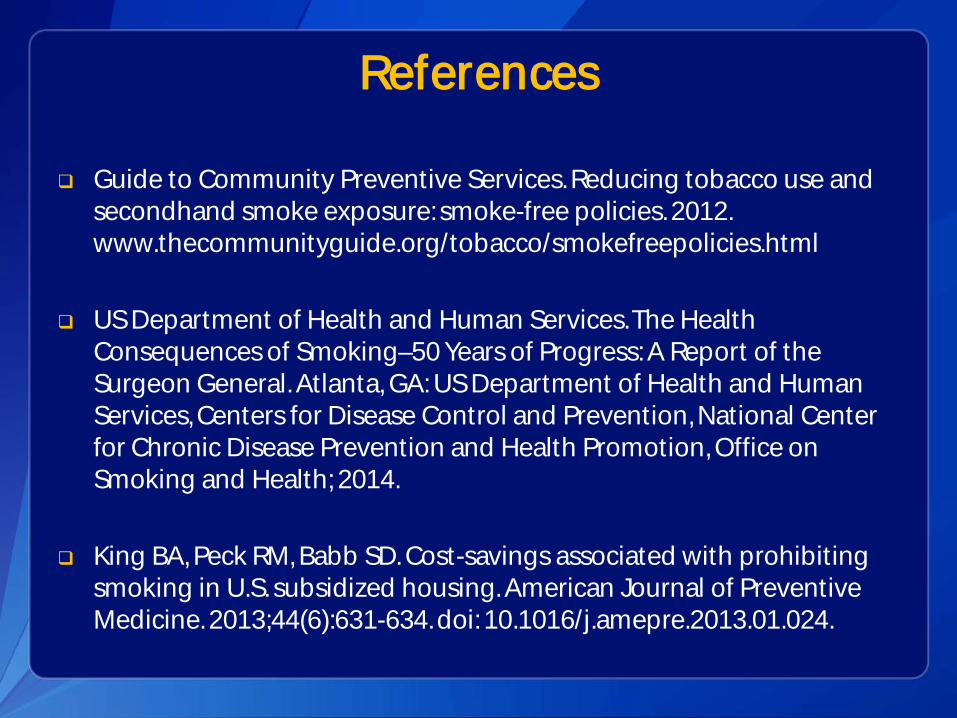
References
Guide to Community Preventive Services. Reducing tobacco use and secondhand smoke exposure: smoke-free policies. 2012. www.thecommunityguide.org/tobacco/smokefreepolicies.html
US Department of Health and Human Services. The Health Consequences of Smoking–50 Years of Progress: A Report of the Surgeon General. Atlanta, GA: US Department of Health and Human Services, Centers for Disease Control and Prevention, National Center for Chronic Disease Prevention and Health Promotion, Office on Smoking and Health; 2014.
King BA, Peck RM, Babb SD. Cost-savings associated with prohibiting smoking in U.S. subsidized housing. American Journal of Preventive Medicine. 2013;44(6):631-634. doi: 10.1016/j.amepre.2013.01.024.

For more information please contact Centers for Disease Control and Prevention
1600 Clifton Road NE, Atlanta, GA 30333Telephone, 1-800-CDC-INFO (232-4636)/TTY: 1-888-232-6348E-mail: [email protected] Web: www.cdc.gov
The findings and conclusions in this report are those of the authors and do not necessarily represent the official position of the Centers for Disease Control and Prevention.
Quest ions?
Vickie [email protected]
Divison of Community HealthNational Center for Chronic Disease Prevention and Health Promotion