utrecht university - stichting trésor – beschermt … _a...carbon stocks in the tropical...
TRANSCRIPT


1
UTRECHT UNIVERSITY
Impacts of selective logging
on tree aboveground biomass and carbon stocks
in tropical forests, French Guiana
Edited by Alexandra Mitsiou, MSc student
Supervised by
Dr. Pita Verweij & Drs. ing. Vijko Lukkien,
Utrecht University
Partnership:
Utrecht University & Copernicus Institute
WWF-France
Trésor Foundation & Association Trésor
French agricultural research centre for development, in French “Centre de coopération Internationale
en Recherche Agronomique pour le Développement” (CIRAD)
French national forests office, in French “Office National des Forêts” (ONF)
Funding Institutions:
Van Eeden-fonds Foundation
KF Hein Foundation
Miquel Foundation
Alberta Mennega Foundation
Cover design and photo © 2011 Alexandra Mitsiou
Utrecht University, December 2011

2
CONTACT LIST
Alexandra Mitsiou (Editor)
MSc student in Environmental Biology, track Ecology & Natural Resource Management,
Utrecht University
Telephone: +31.6.25.21.87.41
Email: [email protected]
Dr. Pita Verweij (Supervisor)
Research Coordinator at Copernicus Institute, Utrecht University
Telephone: +31.30.25.37.605
Email: [email protected]
Dr. Vijko Lukkien (Supervisor)
Research Coordinator & Project Manager Trésor Foundation
Department of Biology/ Trésor Foundation, Utrecht University
Telephone: +31.30.25.37.436
Email: [email protected]
Trésor Foundation website: www.tresorrainforest.org

3
PREFACE
This report is based on an MSc research project on Kaw Mountains in French Guiana conducted by
the author, Alexandra Mitsiou together with my fellow colleague Ariane Laport-Bisquit. The project
included 4 months field work (February-May 2011) and tree measurements in Trésor reserve and
forest sites under the management of the French national forests office (ONF). This study is a follow
up project, initiated in summer 2010 by two masters‟ students in Utrecht University, Anna Duden and
Ineke Roeling (Duden & Roeling, 2011). Certain data produced from the study of Duden & Roeling
(2011) were incorporated to be used as replicates in the data analysis for the present study. The aim
of the study is to investigate the impacts of selective logging on tree aboveground biomass and
carbon stocks in the tropical rainforest as well as investigate if there is any variation in tree
aboveground biomass among primary forest sites in French Guiana and what are the factors that
could explain this variation. This research project is connected to the voluntary carbon market
implementation under the REDD (Reduced Emissions from Deforestation and forest Degradation)
mechanism in French Guiana and contributes to carbon stock databases and forest inventories that
will set the foundations for the implementation of an REDD mechanism in French Guiana. In addition,
this study promotes the conservational importance of the French Guyanese region. Towards the same
direction are several research institutes in French Guiana that gave support for the accomplishment of
this project. Thus, an MOU agreement was signed among: WWF France (WWF-FR), the French
research institute for agricultural research for development (CIRAD), the French national forests
office (ONF), Utrecht University and in particular the Department of Environmental Biology, group
Ecology & Biodiversity and the Copernicus Institute, Trésor Natural Reserve Association (Association
Réserve Naturelle Régionale Trésor) and Trésor Foundation, the Netherlands. This agreement
solidified the cooperation and data exchange among participants for the coming four years 2010-2014
and opens opportunities for collaboration in the long term. This cooperation will contribute towards the
establishment of a research plan on carbon stocks for the Guianas region together with WWF-FR and
Utrecht University.

4

5
ACKNOWLEDGEMENTS
This research project could not have been possible without the help and cooperation among different
people from organisations and institutes in French Guiana and the Netherlands. That is why I would
like to express my gratitude to a number of people who contributed in this research project
French Guiana
1. Trésor Association
I own a big thank to all people from Trésor Association, especially the conservator of Trésor
Association Hélène Guillen, for her help with practical matters and her hospitality and the two forest
guards, Benoît Villete and Jean-François Szpigel for all the enjoyable time they devoted to this project
and for all their help during field work. They shared their passion for nature and their knowledge which
added more to the educational part of this project but most important to the experience of the French
Guyanese rainforest. Moreover, I would like to thank the president of Trésor Association, Olivier
Tostain for his advice and support.
2. WWF-FR
I would like to thank WWF France (WWF-FR) and especially the Director of WWF-FR, Laurent Kelle
and his colleague Romain Taravella for the support and cooperation in the carbon research in the
French Guyanese rainforest. Moreover, I would like to thank them for their indirect contribution to this
project by financing the two forest guards of Trésor reserve; Benoît Villete and Jean-François Szpigel
who were indispensable during field work.
3. CIRAD and ECOFOG
The people from CIRAD and ECOFOG contributed substantially in the scientific part of this project by
providing help and advice with the methodology of data collection and data analysis. In particular, I
would like to express my gratitude to both Lilian Blanc and Christopher Baraloto for their constant
guidance during the project in French Guiana as well as for their data sharing. Moreover, I am very
grateful to the PhD student, Quentin Molto for his indispensable help with the data analysis and his
kind patience to share his knowledge on statistics and R program. Moreover, I would like to express
my gratitude to the two botanists Pascal Petronelli and Petrus Naisso for the time they spend with us
in the field and their valuable help with the taxonomic identification.
4. French national forests office (ONF)
The ONF office offered valuable information on the geology and topography of the Kaw Mountains
and contributed in one of the most important parts of the research which was the determination of
forest sampling sites. I would like to thank the responsible in the research and development
department of ONF in French Guiana, Stephan Guitet for his help and information sharing; and
Bernard Perrin for his time and help with the sampling sites determination.

6
The Netherlands
1. Financial Support
This project could not have been feasible without the substantial financial support provided by different
funding organisations based in the Netherlands. In particular, I would like to acknowledge Van Eeden-
fonds Foundation, K.F.Hein Foundation, Alberta Mennega Foundation and Miquel Foundation for their
generous financial support that was enough to cover the travel expenses, equipment and subsistence
costs for the research in French Guiana.
2. Supervision
I would like to express my appreciation to my two supervisors from Utrecht University, Dr. Pita Verweij
and Drs.ing. Vijko Lukkien for all their support and guidance during this research project while in
French Guiana and in the Netherlands.
3. Support
Lastly, I owe a big thank you to the two graduate masters‟ students of Utrecht University, Anna Duden
and Ineke Roeling for all their help, data sharing and cooperation throughout the preparation and
realisation of this research project. Moreover, their advice on practical issues concerning the life in the
tropical forest as well as on methodology and data analysis was very important. Additionally, I would
like to thank Dr. Heinjo During from the Department of Plant Ecology in Utrecht University, for his help
and advice with the interpretation of the principal component analysis results.
Last but not least, I would like to express a big thank you to my family and all my friends for their
substantial support and patience. Moreover, I would like to thank my fellow colleague and friend
Ariane Laport-Bisquit for the excellent cooperation throughout this research project and for the great
time we had in the tropical forest of French Guiana.
7
LIST OF CONTENTS
Preface 3
Acknowledgements 5
Acronyms 9
Summary 11
1. INTRODUCTION 13
1.1. Climate change and Kyoto protocol 13
1.2. From Kyoto protocol to REDD 13
1.3. REDD in Guiana Shield 14
1.4. REDD implementation 14
1.5. Sustainable forest management 15
1.6. Research topic 16
1.7. Study area 16
2. METHODOLOGY 21
2.1. Sampling sites selection 21
2.2. Sampling design 21
2.3. Tree allometry 23
2.4. Forest stand and climatic variables 23
2.5. Data analysis 24
2.6. Tree aboveground biomass recovery 26
2.7. Financial analysis 26
3. RESULTS 27
3.1. Overview of aboveground biomass 27
3.2. Regional variation in big tree aboveground biomass 28
3.3. Variables explaining tree aboveground biomass variation 31
3.4. Impact of selective logging 34
3.5. Forest recovery estimation 5 years after selective logging 38
3.6. Forest carbon finance vs. timber market 39
4. DISCUSSION 42
4.1. Regional variation in primary forest sites 42
4.2. Impact of selective logging on carbon stocks 42
4.3. Forest recovery estimation 43
4.4. Financial approach 43
4.5. Limitations-suggestions for improvement 44
4.6. Suggestions for future study 44
4.7. Conclusion 45
REFERENCES 46
APPENDICES 51
Appendix 1: Study area 51
Appendix 2: Details on sampling methods 53
Appendix 3: Formulas for tree aboveground biomass calculation 54
Appendix 4: Statistical analysis tables 55

8

9
ACRONYMS
AAU Assigned amount units, referring to carbon emissions
AGB Aboveground biomass of living woody plants
ARNT Association réserve naturelle Trésor (Trésor natural reserve association)
BA Basal area
CER Certified emissions reduction
CIA Central intelligence agency
CIRAD Centre de coopération Internationale en recherche agronomique pour le
développement (French research institute for agricultural research for development)
CO2 Carbon dioxide
CO2e Carbon dioxide equivalent of emissions
DAGB Dead aboveground biomass, referring to the dead fallen trees biomass
DBH Diameter at breast height, referring to the diameter of each individual measured at
1.30m above the base of trunk.
DOM Département d‟Outre Mer (Overseas department)
DSI Dry season index
ECOFOG Ecologie des forêts de Guyane (Joint research unit ecology of Guiana forests)
EU European Union
FAO Food and agriculture organisation
FCU Forest carbon units
FSC Forest stewardship council
GHG Greenhouse gas
GOFC-GOLD Global observation of forest and land cover dynamics
ha hectare (1 ha=104 m
2)
IPCC Intergovernmental panel on climate change
ITTO International Tropical Timber Organisation
Mg Megagram aka metric ton (t) (1 Mg=106 g)
MRV Monitoring, reporting, verifying, referring to deforestation and forest degradation
monitoring
ONF Office national des forêts (French national forests office)
PCA Principle component analysis
PEFC Programme for the endorsement of forest certification
REDD Reduced emissions from deforestation and forest degradation mechanism
RIL Reduced-impact logging
RNF Réserves naturelles de France (Natural reserves of France)
RNR Réserve naturelle régionale (Regional natural reserve)
SFM Sustainable forest management
SD Stem density, referring to the number of stems/trees per hectare
ST Stump
UNEP United Nations environment programme
UNESCO United Nations educational, scientific and cultural organisation
UNFCCC United Nations framework convention on climate change
UTM Universal transverse Mercator
WCMC World conservation monitoring centre
WSG Wood specific gravity
WWF World wide fund for nature

10

11
SUMMARY
Under the current pressure of climate change due to CO2 emissions that are highly probable to be
caused by human activity, different mechanisms and policies have been proposed in order to mitigate
this problem. One of these mechanisms is REDD (Reduced Emissions from Deforestation and forest
Degradation) that aims to the mitigation of CO2 emissions provoked by deforestation and forest
degradation mainly observed in the tropics. However, basic precondition for the application of this
mechanism is the existence of forest carbon inventories and monitoring processes of forest cover.
The broader aim of this study was to contribute to the database on carbon stocks from primary
forest sites and investigate the possibilities of an REDD mechanism application in French Guiana that
would be based on a non regulated carbon market as long as the regulated market is not applicable to
French Guiana (Annex I country). More specifically, this study aims at assessing the regional variation
in tree aboveground biomass and carbon stocks across primary terra firme forest sites in French
Guiana. Additionally, the study aims at assessing the impact of selective logging activity on tree
aboveground biomass and carbon stocks in recently selectively logged terra firme forest with a mean
logging intensity of 2-6 trees/ha. Moreover, an estimation of forest regeneration was done based on
the minimum timber volume extracted from the forest due to selective logging and regeneration rates
found in literature. Finally, an estimation of the financial benefits generated from timber market and the
REDD carbon market was realised.
The study was conducted on Kaw Mountains that are located at the coastal region of French
Guiana. More specifically, primary terra firme forest was sampled in Trésor reserve whereas for the
study of selective logging impact, ONF terra firme forest that had been selectively logged 5 years
before and ONF primary terra firme forest (control) were sampled. Moreover, data from Trinité
reserve, Nouragues reserve, Laussat conservation area and Regina primary terra firme forest sites in
French Guiana were used for the regional variation study (data acquired from Baraloto, C. & Blanc, L.,
2011). The sampling of forest sites was done using a modified Gentry plot of 0.5ha named “transect”
where diameter at breast height (DBH) and height measurements were taken of small (2.5 ≤ DBH <
10 cm) and big trees (DBH ≥ 10 cm) (Baraloto et al., 2010; 2011). Moreover, taxonomic identification
was done by experienced botanists assigned by CIRAD-EcoFog in order to use the wood specific
gravity of trees for tree aboveground biomass calculations (Zanne et al., 2009).
The main findings of this study can be summarised under three main points. There was no
significant regional variation in tree aboveground biomass (AGB) among the five primary terra firme
forest sites in French Guiana (Kaw Mountains, Trinité reserve, Nouragues reserve, Laussat
conservation area and Regina), even though there was high local variation in tree AGB in all forest
sites. Selective logging activity influenced tree AGB and carbon stocks, mainly of big trees (DBH ≥ 10
cm). In particular, the AGB of big trees in the selectively logged forest was 54 Mg/ha lower than in the
primary forest site. The forest structure analysis showed that the percentage of carbon present in the
class (DBH ≥ 70cm) was reduced by 5% as compared to the primary forest. On the other hand, the
carbon percentage within medium DBH classes of (40-70 cm) was found higher in the selectively
logged forest maybe due to regeneration (Blanc et al., 2009). However this increase could not
compensate for the AGB and carbon losses due to the removal of big trees. Estimates on forest
recovery showed that the tree AGB loss of 36.3 Mg and 13.6 Mg would recover by 14% and 38%
respectively within a period of 5 years after selective logging, indicating that forest recovery highly
depends on logging intensity. The lack of significance in all results apart from the forest structure
analysis showed that more replicates are needed to support the conclusions. Moreover, the results on

12
forest regeneration represented only an estimate and no final conclusions could be drawn.
Additionally, more research on the environmental variables that affect tree AGB is needed.
From the forest carbon perspective, the mean tree aboveground carbon stock in the sampled
sites was 212.35 Mg/ha in Trésor reserve and 206.74 Mg/ha in the ONF primary forest site. On the
contrary, in the ONF forest site that had been selectively logged 5 years before the mean tree
aboveground carbon content was 181.03 Mg/ha. In terms of financial value when applying the REDD
finance, the primary terra firme forest in Trésor reserve would be worth €3179.63/ha ($4286.26/ha)
and the same forest type in ONF forest site would be worth €3095.66/ha ($4173.07/ha). On the
contrary, the ONF forest that had been selectively logged 5 years before would have a lower value of
€2710.67/ha ($3654.09/ha). Thus the preservation of these primary forest sites is important not only
for sustainable financial profits but also for biodiversity and habitat conservation. On the other hand,
timber market was estimated to be more profitable than the application of an REDD finance scheme
for the standing forest. In more detail, it was estimated that the 108.33 m3 standing timber extracted
from the ONF forest due to selective logging activity had generated an economic benefit of €1841.61
($1366.18) and €5416.5 ($4018.18) in the local timber market in French Guiana and open timber
market, respectively (CCIG, 2008; personal comm. Guitet, S., 2011). This profit can be generated
once every 65 years according to the cutting cycle currently applied in French Guiana (Blanc et al.,
2009; ONF, 2010). Alternatively, if this tree aboveground biomass was retained as standing forest
would have generated the financial profit of €524.61 ($707.19) assuming that the REDD carbon
finance would have been applied for 65 years (Watson, 2009; Diaz et al., 2011). However, taking into
consideration the co-benefits from forest conservation and the inevitable forest degradation due to
selective logging activities in the long term, it is concluded that measures over sustainable logging
practices would be an option to be soon taken into account in French Guiana in order to achieve both
habitat conservation and financial benefits from the primary forest sites when applying the REDD
carbon finance.

13
1. INTRODUCTION
1.1 Climate change and Kyoto protocol
Climate change is one of the most pressing environmental concerns of the 21st century. It is widely
accepted that the release of greenhouse gases (GHG) (United Nations framework convention on
climate change [UNFCCC], 1998) into the atmosphere over the last decades due to human activity it
is highly probable to be the main driver to this phenomenon (Lashof & Ahuja, 1990; Schroeder, 1992;
Lasco & Cardinoza, 2005; Intergovernmental panel on climate change [IPCC], 2007). In order to set a
limit to the GHG emissions and mitigate climate change, the Kyoto protocol was introduced in 1998
(UNFCCC, 1998). This protocol set the financial incentives for the limitation of carbon dioxide (CO2)
emissions (Kyoto Protocol, Article 3) as it is considered the most responsible GHG for climate change
(Lashof & Ahuja, 1990; UNFCCC, 2010).
The Kyoto protocol proposes that the developed Annex I Parties1 (Developed nations and
nations with economies in transition i.e. Australia, Germany, France) will reward through carbon
credits, the Annex II Parties2 (Developing countries i.e. Brazil, Cameroon, Costa Rica) for the
reduction of GHG emissions (UNFCCC, 1998; World Bank, 2008; World Bank, 2011a). These carbon
credits (aka Kyoto Units) represent an emission reduction equal to one metric tonne of CO2 (or 1Mg
CO2) (UNFCCC, 1998). In particular, Kyoto protocol allows Annex I Parties to trade carbon credits
with other Parties in order to add or subtract emissions amounts from their initial assigned emissions
amount (assigned amount units [AAUs]), thus raise or lower the level of their allowed emissions over a
commitment period (UNFCCC, 2008). Overall, the Kyoto protocol in 1998 set the basis of a carbon
trade for the mitigation of climate change due to fossil fuel related carbon emissions (CO2 emissions
due to industry etc.). However, it does not take into account the carbon emissions resulting from other
anthropogenic activities, such as deforestation and forest degradation (Fearnside, 2001).
1.2. From Kyoto protocol to REDD
Forests play an important role in climate change mitigation (Food and agriculture organisation [FAO],
2010). They absorb carbon dioxide (CO2) and store in their biomass large amounts of carbon (FAO,
2010). Thus, when a forest is cut down on the one hand carbon is released back into the atmosphere
(i.e. trough decomposition or burning of the wood) and on the other hand CO2 absorption capacity is
decreased, resulting in a total CO2 emission due to deforestation and forest degradation (Verweij et
al., 2009). The most important terrestrial carbon sinks are tropical forests, which cover almost the 17%
of the earth‟s land surface (Olson et al., 1983; Buchmann, 1997; IPCC, 2007), representing a
considerable terrestrial carbon sink. For example, the Brazilian rainforest alone accounts for almost
the 15% of all terrestrial carbon (Keller et al., 1997; Houghton et al., 2001; Verweij et al., 2009). Thus,
deforestation and forest degradation in the tropics have been estimated to account for approximately
20% of total global carbon emissions annually and therefore represent one of the major human
activities responsible for contributing to climate change (Fearnside, 2000; Malhi & Grace, 2000; Rudel,
2001; DeFries et al., 2002; Fearnside & Laurance, 2003, 2004; Asner et al., 2005; Houghton, 2005;
Gibbs et al., 2007; Holmgren et al., 2007; Angelsen, 2008; Olander et al., 2008).
1 The complete list of Annex I Parties can be consulted on UNFCCC website:
http://unfccc.int/parties_and_observers/parties/annex_i/items/2774.php
2 The complete list of Annex II Parties can be consulted on UNFCCC website:
http://unfccc.int/parties_and_observers/parties/non_annex_i/items/2833.php
14
Consequently, the United Nations framework convention on climate change (UNFCCC) in
2005, initiated international discussions to introduce financial incentives for the reduction of carbon
emissions due to deforestation and forest degradation (REDD) (DeFries et al., 2002; Buchmann,
1997; UNFCCC, 2011a). The REDD mechanism is focusing mostly on Annex II Parties as they own
the largest part of the tropical forests globally (tropical forest countries). The high poverty levels in
these countries and the non-sustainable land use practices (uncontrollable logging, mining, etc.) are
posing a great risk to the forest (Guiana Shield Initiative, 2011). In fact, the REDD mechanism initiates
a different type of carbon market based on forest carbon units (FCUs) where the developing countries
(Annex II Parties) can exchange their (FCUs) to receive financial benefits and invest on human
development, improvement of living standards and development towards more sustainable economies
(UNFCCC, 1998; Gibbs et al., 2007; Angelsen, 2008; Verweij et al., 2009; United Nations environment
programme [UNEP], 2010; World Bank, 2011b). In turn, the Annex I Parties (developed countries) will
need these credits to compensate for their carbon emissions that cannot be reduced in their country
(Verweij et al., 2009). On the whole, a REDD mechanism apart from contributing to human
development and poverty alleviation, would enable the preservation of tropical forest carbon sinks as
well as the diversity of tropical fauna and flora related to these forests (Verweij et al., 2009; UNEP,
2010).
1.3. REDD in Guiana Shield
The Annex I countries cannot be credited for the future regulated REDD carbon market described
above. Such an example is French Guiana, an overseas department of France (Annex I country)
where the present study was conducted. Alternatively, these counties can take part in a voluntary
REDD carbon market. Public and private organisations, companies or industries etc. provide financial
support for the voluntary market in order to mitigate their CO2 emissions (Verweij et al., 2009; Peters-
Stanley et al., 2011; World Bank, 2011c). Moreover, possibilities for the development of a REDD type
of mechanism within the European Union that will be applicable to the overseas departments of EU
countries is currently being under discussion (personal comm. Verweij, P. & Lukkien, V., 2011). This
creates another opportunity for the application of an REDD type mechanism in French Guiana. The
application of an REDD voluntary carbon market or an EU REDD mechanism in French Guiana as
well as in the Guiana Shield could contribute towards the mitigation of logging activity and the
development of more sustainable logging practices that have the minimum effect on carbon stocks
(Mazzei et al., 2010). In addition, this mechanism is expected to provide the incentives for biodiversity
conservation in tropical rainforest (Verweij et al., 2009).
1.4. REDD implementation
The implementation of such a mechanism requires scientific knowledge and decisions based on
carbon inventories of the tropical forest countries. Forest carbon inventories will serve as a reference
to monitor the forest cover changes in the future (Intergovernmental panel on climate change [IPCC],
2003, 2006; Wertz-Kanounnikoff et al., 2008; Global observation of forest and land cover dynamics
[GOFC-GOLD], 2009). According to IPCC (2003) figures on five carbon pools are needed to estimate
the emissions from deforestation and forest degradation. These are the aboveground biomass (AGB),
below ground biomass, dead wood or dead aboveground biomass (DAGB), litter and soil organic
carbon (Wertz-Kanounnikoff et al., 2008). Although logging can result in significant emissions from
litter or dead wood, the most practical way to assess carbon emissions due to deforestation and forest
degradation is the monitoring of the aboveground biomass changes (IPCC, 2003; Wertz-Kanounnikoff

15
et al., 2008). However, this results in a minimum estimation of the carbon stocks in a forest area
(“conservative” estimate).
Monitoring, reporting and verifying (MRV) deforestation and forest degradation requires a
combination of field based carbon stock measurements (forest carbon inventories) and remote
sensing data (DeFries et al., 2006, 2007; IPCC, 2006; Gibbs et al., 2007; Olander et al., 2008; Wertz-
Kanounnikoff et al., 2008; Pluggle et al., 2010; UNFCCC, 2011b). The methodology to create forest
carbon inventories is classified in Tiers which are levels of increasing accuracy from Tier 1to Tier 3.
The classification is done according to the accuracy of tools (i.e. equations, parameter values, remote
sensing maps etc.) and the level of analytical complexity used for the creation of the inventory (IPCC,
2003, 2006; Penman et al., 2003; Wertz-Kanounnikoff et al., 2008; GOFC-GOLD, 2009). The more
accurate the forest inventory is (i.e. Tier 3), the more likely to be credited for the REDD. This
classification underlines the importance of a high quality and detailed forest carbon inventories that
meet the requirements for forest carbon reporting at a global scale (Holmgren et al., 2007; Olander et
al., 2008).
1.5. Sustainable forest management
The deforestation intensity may vary from clear-cut deforestation (i.e. Brazilian Amazon and
Indonesia) to controlled deforestation through sustainable logging practices that can be described as
forest degradation. The sustainable forest management (SFM) is the use of forests in a way and
intensity that preserves their biodiversity, productivity, regeneration capacity and vitality in the long
term (FAO, 2000). In other words, the SFM aims at the balance between the increasing demand for
forest products and the preservation of forests integrity and biodiversity. As a result, SFM is important
for the carbon stocks preservation and thus critical for the application of the REDD mechanism.
It has been shown that the conventional logging practices are unfavourable for carbon
retention in the forest after logging (Putz, 1993, 2008; Healey et al., 2000). Thus, reduced-impact
logging (RIL) techniques have been developed in order to preserve the forest, soil and wildlife
whereas at the same time serve the demand for tropical timber (Tropical Forest Foundation, 2009).
Reduced-impact logging is a tool for sustainable forest management and includes a set of carefully
planned timber harvesting operations to mitigate the environmental impact such as minimise collateral
damage to non-harvest trees, protection of streams, soil and wildlife (Tropical Forest Foundation,
2009; International tropical timber organisation [ITTO], 2011). Some of the management activities that
should be applied to ensure a reduced-impact logging practice are the following (ITTO, 2011): (1) Pre-
harvest inventory and mapping of individual crop trees, (2) Pre-harvesting planning of roads and trails
to minimize soil disturbance (Putz & Pinard, 1993), (3) Establishment of stream buffer zones and
watershed protection areas to prevent water ways pollution, (4) Pre-harvest vine cutting if heavy vines
connect tree crowns (Vidal et al., 1997), (5) Use of appropriate felling techniques (i.e. directional
felling, cutting stumps low to the ground) to reduce waste (Putz & Pinard, 1993; Feldpausch et al.,
2005), (6) Use of improved technologies to reduce soil and nearby vegetation damage caused by the
log extraction, (7) Conduct post-harvest assessment and evaluate the degree to which the RIL
guidelines were successfully applied.
The impact of logging on forest aboveground biomass and regeneration rate after logging
varies and depends on the forest management scheme applied as well as the extent to which these
RIL rules are being applied successfully. According to Boltz et al. (2001) when the timber volume of
19.74 m3/ha was extracted from the Brazilian Amazon forest through RIL and applying all the
necessary management practices above mentioned, the post-logging growth rate would vary between
0.01 cm/year for the first year after logging and 1.39 cm/year as shown by the dynamic model the

16
researchers developed. A more recent study by Sist and Ferreira (2007) showed that the RIL
practices in the Eastern Amazon were not sustainable. In details, the logging intensity of 6 trees/ha
accounting for 21 m3/ha of timber combined with the post-logging growth rate of 0.05 cm/year and the
cutting cycle of only 30 years were not compatible to sustainable forest management. Under this
felling regime, only silvicultural treatment, growth rate of 0.04-0.05 cm/year and felling cycle of 40
years could ensure a logging intensity of 3-4 trees/ha (10-13 m3/ha of timber) 40 years after logging
(Sist & Ferreira, 2007). Thus, it is clear that attention should be given when referring to reduced-
impact logging practices and extensive post-logging study should be done in order to prove whether a
forest management scheme can be sustainable in the long term.
1.6. Research topic
Objective
The broader aim of this study was to contribute to the database on carbon stocks from primary forest
sites and investigate the possibilities of a REDD mechanism application in French Guiana that would
be based on a non regulated carbon market as long as the regulated market is not applicable to
French Guiana (Annex I country). More specifically, this study aims at assessing the regional variation
in tree aboveground biomass and carbon stocks across primary terra firme forest sites in French
Guiana. Moreover, this study aims at assessing the effect of low-impact logging activity on tree
aboveground biomass and carbon stocks in recently logged terra firme forest.
Research Questions
1. Is there any regional variation in tree aboveground biomass when comparing primary terra firme
forest in French Guiana?
2. What is the effect of low-impact logging practices on forest structure and carbon stocks in terra
firme forest that had been recently logged?
Hypotheses
1. Previous studies done by Baraloto et al. (2010, 2011) have shown that there is no significant
variation in tree aboveground biomass (AGB) and carbon content among terra firme forest from
different geographic regions. Thus it is expected that there will be no significant variation in tree AGB
when comparing primary terra firme forest sites in French Guiana.
2. It is assumed that the selectively logged forest will contain less carbon and more small trees (2.5 ≤
DBH <10 cm) than the primary forest site. Thus, it is supposed that 5 years are not enough for the
recovery of carbon stocks in the forest. Even though, more small trees will grow in the forest after low-
impact logging, they cannot compensate for the carbon lost from the big trees (DBH > 10 cm) removal
according to previous studies (Mazzei et al., 2010; Rutishauser et al., 2010).
1.7. Study area
To investigate the above questions, study was conducted in French Guiana and the sampling areas
included terra firme forest sites in Trésor reserve and the French national forests office (ONF) forest
both located on Kaw Mountain in the north-east of French Guiana (Appendix1).
French Guiana
French Guiana (French: Guyane française or officially: Guyane) is an overseas department of France
(French: Département d‟Outre Mer or DOM) located at the northern Atlantic coast of South America at

17
geographical coordinates 4.00N and 53.00W (Central intelligence agency [CIA], 2011). French Guiana
borders with Brazil at the East and Suriname at the West with two natural boarders (Oyapock River
and Maroni River, respectively). At the South, the county is covered with dense forest that can only be
accessed by rivers and streams from south to north. French Guiana is part of the Guiana Shield, one
of the three cratons of the South America plate (Goodwin, 1996). The geological term “shield” implies
a large area of exposed old Precambian rock basement (2.1 billion years old) that is not subject to
large extent changes due to modern geological activity (tectonic or volcanic) (Press & Siever, 1982;
Gibbs & Barron, 1993; Goodwin, 1996; Hammond, 2005). This profile describes the geology of Kaw
Mountains that has an important role in forest structure and forest dynamics on the Mountains.
Tropical forest in French Guiana
Due to this geological background, Guiana Shield and thus French Guiana, is characterised by poor
soils (Ter Steege, 2000; Olson et al., 2001; Hammond, 2005). However, it supports a vast surface of
continuous primary tropical forest in the world with particularly high biodiversity (Guiana Shield
Initiative, 2011). French Guiana is first on the list for its forest cover per land area, with its tropical
forest accounting for the 98% of the total land area, according to the Global Forest Resources
Assessment main report of 2010 (FAO, 2010). The most interesting is that its tropical forest is mostly
undisturbed. The primary forest in French Guiana covers a vast area of 7.690 million hectares that
represents the 95% of the total forest cover in the country (8.082 million hectares), according to the
same report (FAO, 2010). Unfortunately, the high poverty levels of a large part of the population are
leading to uncontrollable and non-sustainable activities such as illegal logging and gold mining that
threaten the ecosystem with degradation (Guiana Shield Initiative, 2011). Thus, forest monitoring and
sustainable forest management plan are crucial for the tropical forest conservation in the region.
Kaw Mountains
Kaw Mountains are located at the coastal region of French Guiana, south east of the capital of
Cayenne (Appendix 1) between the communities of Roura and Kaw (Trésor Foundation, 2011). Its
total length is 121 km and its altitude ranges from 2 m (“Marais de Kaw”) to 390 m (“Camp Caiman”)
covering 19,860 hectares of mixed tropical forest and a variety of bio-habitats (ONF, 1994).
Geology and soils
Kaw Mountains are characterised for their lateritic geological profile and poor soils (ONF, 1994). The
90% of the Mountains surface is laterite that can reach 20 m depth (ONF, 1994). Especially, on the
top of the Kaw Mountains regosols are found (Ek et al., 2000). Regosols are soils of unconsolidated
parent material on which not significant soil forming processes have been taken place due to dry or
cold climatic conditions (FAO-UNESCO, 1981). Due to this thin soil profile, during the rainy season the
soil is getting quickly inundated, whereas during the dry season it dries due to its low water capacity.
In addition, the low depth of this type of soil prevents trees over 60 cm of diameter at breast height
(DBH) to develop an adequate rooting system.
Climate
Kaw Mountains are situated in one of the most humid regions in French Guiana (Appendix 1). The
mean annual precipitation on Kaw Mountains is estimated to be around 4000 mm yr -1
(Météo-France
& CIRAD, 2010), whereas in other regions in French Guiana (i.e. Laussat Conservation Area) the
mean annual precipitation is almost the half (~ 2400 mm yr -1
) (Météo-France & CIRAD, 2010). The
combination of thin soils (inadequate rooting system for big trees) and high precipitation values results

18
in a lot of fallen trees and thus canopy gaps (French: “chablies”) after the rain season (ONF, 1994).
This phenomenon influences the forest structure on the Mountains.
Biodiversity
Kaw Mountains exhibit variation in biotopes from terra firme forest on the top of the Mountains, to
swamp forest at the “Marais de Kaw” (ONF, 1994). The terra firme forest is characterised by an almost
continuous canopy that is composed by high trees of all diameter classes (ONF, 1994). Overall, the
particular geological profile makes Kaw Mountains interesting not only for floristics (i.e. high diversity
in plant species) but also for the diversity of animal species (i.e. the bird Rupicola rupicola or common
name: Cock of the rock) (ONF, 1994). In addition, Kaw Mountains holds a great variety of endemic
species from amphibians and reptiles to birds and mammals as well as insects. Thus, it is considered
as a high priority area for nature conservation (ONF, 1994).
Anthropogenic impacts on Kaw Mountains
The greatest area of Kaw Mountains is covered by primary forest; however certain parts of the forest
have been submitted to exploitation. In the past, gold mining activities affected with deforestation an
extended forest area where today is located the Camp Caiman for ecotourism. In addition, the
construction of Kaw road (Departmental n° 6 road, D6) destructed an extended area of primary forest.
The road is located on the top of Kaw Mountains, covering the distance from Roura to “Marais de
Kaw”. The construction of Kaw road created an easy access to the forest not only for ecotourism but
also for exploitation. Nowadays, the most important threats for the tropical forest on the Mountains
are: illegal logging activity in certain areas, illegal gold mining and hunting. In addition, the French
national forests office (ONF) is responsible for the low-impact legal logging activity in specific forest
sites on the Mountains. Almost all timber extracted is directed to the sawmill industry and use within
the French Guianese borders (CCIG, 2008). Timber exportation to Europe and Antilles is limited due
to the competition with the Brazilian timber and the lack of infrastructure.
Trésor Regional Natural Reserve (RNR Trésor)
Trésor reserve is located on the North side slope of Kaw Mountains, occupying a 2640 hectares area
of tropical forest (Trésor Foundation, 2011). It is bordered by Kaw road at the Northeast and Oparu
River at the Southwest (Trésor Foundation, 2006). Terra firme forest covers a large surface of the
slopes in the reserve, whereas at the plain that is flooded during the rainy season, there are wet
savannas and swamp forest (Trésor Foundation, 2006). The reserve contains a large variety of
habitats with high biological diversity of tropical fauna and flora. In particular, the reserve is divided in
7 different biotopes that are basically all in primary state, a fact that classifies the reserve in a high
priority for conservation. The variety in biotopes creates a diverse environment favourable to host a
great variety of animals. In numbers, the Trésor reserve represents only a small area of the total land
surface of French Guiana. However, 22% of plants, 45% of amphibians, 37% of reptiles, 45% of birds,
60% of mammals and 59% of bat species in French Guiana can be found in this area (Figure 1). The
ownership, management and preservation of the reserve are controlled by the Trésor Foundation,
founded in 1995. In 2010, Trésor reserve was classified as a nature reserve of France and it was
given the status of “Réserve Naturelle Régionale Trésor” (RNR Trésor or RNR124) (Trésor
Foundation, 2010; RNF, 2011). The new status made official the nature preservation in the particular
tropical forest area and activities such as logging, mining and hunting were banned from the region
(Trésor Foundation, 2010).

19
Figure 1. Location map of Trésor reserve and its biodiversity © 2010 Trésor Foundation (Trésor
Foundation, 2011).
ONF forest
The French national forests office (ONF) is responsible for the forest management in French Guiana
(Journal officielle de la gouvernement française, 1967). On Kaw Mountains, the forest area that is
managed by the ONF accounts for 19.860 ha and is divided into 44 parcels (KAW1-KAW44) (Figure
2). Even though the forest on Kaw Mountains is situated close to the main infrastructure axes of the
country and to principal population centres with agricultural, industrial and urban activities, the largest
part of the ONF forest is protected for its ecological value and remains unexploited (ONF primary
forest) (ONF, 2011a). The protection series include parcel KAW6, 23, 24, 27, 30, 37-44 accounting for
the 55% of the total ONF forest area on Kaw Mountains. Thought there are some parts of the forest
that either were exploited 30 years before or data are not clear on whether there had been exploitation
(i.e. parcel KAW5) and thus they are also considered as primary forest by the ONF. The rest forest
parcels that compose the production series are submitted to low-impact logging activity. According to
the year of exploitation the parcels can be distinguished in parcels where selective logging activity
occurred 5 years before (i.e. parcel KAW2), 10 years before etc. The certification schemes that have
been adopted by the ONF for these activities are ISO 9001 and ISO 14001, although ONF aims to
achieve the PEFC certification standards in the future (ONF, 2007).
ONF forest under exploitation
The management of the ONF forest under exploitation is concentrated on the monitoring of the main
and secondary roads that lead to the forest, control of the users and set of barriers to the forest.
Moreover, ONF takes into account the importance of detailed inventories for the forest resources
mapping (ONF, 1994; Guitet, 2005; Guitet et al., 2007). Additionally, ONF applies the practice of
“undesirable” tree species removal to promote the growth of commercial species, although this
forestry method can seriously affect carbon stocks and biodiversity. The forest sites under exploitation
are divided into parcels and forest inventories indicating the availability of commercial tree species in
each parcel, are available. The division of forest area into parcels facilitates the control of timber
volumes extracted from the forest under exploitation (ONF, 1994). Before 1995, data on the exact
timber volumes extracted from the forest as well as the geographical position of the felled trees are
inadequate. However, since 1995 considerable attention has been given on keeping track of the
amount of timber extracted from each of the parcels. The period 1986-1994, forest parcels KAW1-

20
KAW39 (totalling 13.400 ha of forest) were being exploited by the ZWAHLEN industry (permit no
1/ROURA, 28 August 1986) and for the period 1995-1998 only the forest within the zone of parcels
KAW4, 5, 7 and 17, 20 and 21 was being exploited under the “Convention of management and
exploitation” whose beneficiary was again the ZWAHLEN industry (ONF, 1994). Since 1998, the
logging activity depends on the customer‟s demand for particular tree species and quantity and thus
timber is sold in a form of private sale or supply contracts (ONF, 1994). Moreover, considerable
attention has been given on the application of reduced-impact logging methods for timber extraction.
In details, ONF has recognised the importance of appropriate felling techniques such as directional
logging, the necessity of pre-harvesting planning of roads and trails to minimize the disturbance of the
delicate poor soils in the Guianese region and the use of GPS to monitor the position of felled trees as
well as of the trails in the forest (Guitet, 2005). Additionally, ONF underlined that the collaboration of
all stakeholders involved in the exploitation procedure was very important as well as the post-harvest
monitoring of the forest cover via remote sensing technology is crucial for the estimation of
environmental impact of the logging methods applied (Guitet, 2005; Guitet et al., 2007).
The annual timber extraction volume since 2007 has been 25 m3/ha, although the average
timber extraction volume over the last 10 years has been 13-14 m3/ha (Guitet, 2005; ONF, 2010). The
majority of timber extracted (60%) is comprised by Dicorynia guianensis (aka Angelique) and Qualea
rosea (aka Gonfolo) (ONF, 1994). Once a parcel is selectively logged then the forest should be remain
untouched for 65 years (Blanc et al., 2009; ONF, 2010). Thus in the production series a part of the
parcels is being exploited and another part contains forest parcels that have been left untouched to
recover. The exploitation criterion is the tree diameter that should be over 55 cm rendering the trees
with DBH > 70 cm the most attractive target for selective logging practices (ONF, 1994; Guitet, 2005).
Figure 2. Map of the Kaw Mountains where the forest parcels KAW1-KAW44 are located. These parcels have been set by the French national forests office (ONF) with the scope to facilitate and make more efficient the forest management in the region (© 2011 ONF). Source: ONF, 2011b

21
2. METHODOLOGY
2.1. Sampling sites selection
The criteria used for the sampling sites selection were: 1. Lateritic geological profile. 2. Similar forest
density. 3. Similar forest structure (i.e. number of lianas, small trees etc.). 4. Same forest type (terra
firme forest). 5. No steep slopes. This was done to produce comparable results among forest sites.
The tools used for this selection were: geological information maps, aerial photos, satellite images of
the three forest sites (ONF database 2011) as well as in situ identification of the sampling sites. The
slope was estimated using Garmin GPSMAP® 60CSx (© Garmin technologies). Moreover, a minimum
distance of at least 300 m between replicates was selected.
2.2. Sampling design
The sampling was done between March and April 2011. Terra firme forest was sampled from three
forest sites: Trésor reserve, ONF primary forest and ONF forest selectively logged 5 years before
(ONF logged). The sampling unit used was a modified Gentry plot of 0.5 ha (Baraloto et al., 2010)
called “transect” (Appendix 2). In Trésor reserve, transect T6 was settled as a replicate to T1 and T2
(Duden & Roeling, 2011) (Table 1). In ONF primary forest transects T10 and T11 were settled as
replicates to transect T5 (Duden & Roeling, 2011) (Table 1). In this study and the one of Duden &
Roeling (2011), similar methodology for the aboveground biomass inventories in French Guiana was
used, proposed by Baraloto C. and Blanc L. (Baraloto et al., 2010, 2011). For the regional variation
study, data from terra firme primary forest sites in Laussat conservation area in the northwest, Trinité
reserve in the southwest, Nouragues reserve in the southeast and Regina in the northeast of French
Guiana (Appendix 1) were used (data acquired from Baraloto, C. & Blanc, L., 2011) (Table 2).
For the study of low-impact logging effects on tree aboveground biomass (AGB) and carbon
stocks, the sampling was done in the ONF parcel 2 (KAW2) where selective logging had occurred 5
years before. According to the ONF management report, this parcel had been selectively logged in
2006 when 4 m3/ha of timber (2.4 Mg/ha tree AGB) was removed from the forest as well as in 2007
when 3.8 m3/ha of timber (2.28 Mg/ha tree AGB) was removed from the forest, totalling 7.8 m
3/ha of
timber (4.68 Mg/ha tree AGB) for both years. It is important to note that the majority of timber included
big trees of DBH > 60 cm (ONF, 2011b). Comparing this volume with the mean volume of timber
extracted from the 15 parcels the period 1995-2009, which was 7.5 m3/ha of timber, parcel 2 had been
submitted to a considerable logging intensity. Since then, the forest has been left undisturbed for the
rest 65 years in order to recover (Blanc et al., 2009). For the sampling of this forest site, transects T7,
T8 and T9 were settled (Table 1). The replicates were separated by at least 300m between any two
transects. The UTM points of each transect were acquired using Garmin GPSMAP® 60CSx (©
Garmin technologies) and maps showing the place of transects were created (Figure 3).

22
Figure 3. Location of transects in Trésor reserve and ONF forest site on Kaw Mountains (© 2011 ONF). Blue line: transects in Trésor reserve, red line: transects in ONF forest that had been selectively logged 5 years before and purple line: transects in ONF primary forest.
Table 1. Sampling sites overview. Trésor reserve (n=3), ONF primary forest (n=3) and ONF forest that had been selectively logged 5 years before (n=3). Trésor reserve and ONF primary forest sites represented the Kaw Mountains region in the regional variation study whereas the ONF logged site together with ONF primary forest (control) were used for the impact study of selective logging.
Kaw Mountains
Transect Location Reference
T1 Trésor reserve Duden & Roeling, 2011; Mitsiou & Laporte-Bisquit, 2011
T2 Trésor reserve Duden & Roeling, 2011
T6 Trésor reserve Mitsiou & Laporte-Bisquit, 2011
T5 ONF primary forest Duden & Roeling, 2011
T10 ONF primary forest Mitsiou & Laporte-Bisquit, 2011
T11 ONF primary forest Mitsiou & Laporte-Bisquit, 2011
T7 ONF selectively logged 5 years before Mitsiou & Laporte-Bisquit, 2011
T8 ONF selectively logged 5 years before Mitsiou & Laporte-Bisquit, 2011
T9 ONF selectively logged 5 years before Mitsiou & Laporte-Bisquit, 2011

23
Table 2. Overview of data collection used for the regional variation study. For the location of these forest sites refer to Appendix 1.
French Guiana
Size of sample (n) Location Reference
6 Kaw Duden & Roeling, 2011; Mitsiou & Laporte-Bisquit, 2011
6 Regina Baraloto et al. 2011
7 Laussat Baraloto et al. 2011
7 Nouragues Baraloto et al. 2011
6 Trinité Baraloto et al. 2011
2.3. Tree allometry
Within each subplot the stems were mapped taking coordinates information and the diameter was
measured at 1.30 m height from the ground (diameter at breast height [DBH]) (Hughes et al., 2000;
Baraloto et al., 2011). For stems with irregularities, buttressed roots or prop roots, the stem diameter
was measured at a higher point above irregularities (Hughes et al., 2000; Baraloto et al., 2011) and
the point of measurement was marked with paint. If it was impossible to reach a point above
irregularities, the diameter was estimated by two trained persons.
For the aboveground biomass (AGB) study of big trees, all individuals with stem diameter at
breast height (DBH) ≥ 10 cm (Hughes et al., 2000) and rooted within 10 10x50 m subplots, totalling a
surface of 0.5ha forest area, were included (Baraloto et al., 2010; Baraloto et al., 2011). The
individuals were considered inside the subplot if the centre of their trunk base lay within the
boundaries of the subplot (Boyle, 1996). Trees having more than one stems, were considered as the
same individual, however, the diameter and height of each stem were measured separately. Tree
height was measured using a laser hypsometer. All trees of DBH ≥10 cm were given a code and
labelled using Simplex Blanche ® labels (© Signe Nature). The code was a triple name containing
information on transect, subplot and tree number (i.e.T6A11: transect T6, subplot A, tree number 11).
For the AGB study of small trees, all individuals of 2.5 ≤ DBH <10 cm encountered within 1m
on either side of the middle-line of the subplot, totalling a 10 2x50 m subplots of 0.1ha forest area,
were included (Baraloto et al., 2010; Baraloto et al., 2011). For the lianas biomass study, the DBH
measurement was also done at 1.30 cm, although the height was not measured. For the dead
aboveground biomass (DAGB) study, all dead fallen (DF) and dead standing (DS) trees of stem
diameter at breast height (DBH) ≥ 10cm found within 10 10x50 m subplots, were included. The height
of the dead standing or alternatively the length of the dead fallen trees was also measured.
Additionally, the number of stumps (ST) found within the 10 10x50 m subplots of transects in the
selectively logged forest sites was calculated for an estimation of the logging intensity.
2.4. Forest stand and climatic variables
The forest stand variables involve tree size (DBH and height), wood specific gravity (WSG), basal
area (BA) and stem density (Baraloto et al., 2011). The basal area was calculated per hectare for all
trees (small and big) using the common equation BA=pi * DBH2/4. The stem density was calculated as
the count of trees per hectare. Mean annual rainfall and dry season index (DSI) (Baraloto et al., 2011)
values for the five primary forest sites in French Guiana were used in order to examine the correlation
of these climatic variables with the aboveground tree biomass variation in the primary forest sites
(Table 3). The mean annual rainfall represents a calendar year average of precipitation and the DSI a
mean value of the dry season length (Baraloto at al., 2011). The dry season length is the maximum

24
number of successive days that receive less than 10 mm of precipitation (Baraloto et al., 2011). The
climatic data for all sites were acquired from CIRAD and in particular the data for Kaw Mountains
originate from Camp-Caiman meteorological station located on Kaw Mountains (Météo-France &
CIRAD, 2010).
Table 3. Mean annual rainfall and mean dry season length in the five primary forest locations studied in French Guiana. Data by: Baraloto, 2011; Météo-France & CIRAD, 2010
Location Rainfall (mm/year) DSI (days/year)
Kaw 4075 25.70
Regina 4421 23.90
Laussat 2471 36.80
Nouragues 3472 25.45
Trinité 2584 23.70
2.5. Data analysis
The largest part of data analysis was done in the R environment for statistical computing, version
2.13.0 (R Core Development Team, 2011, Vienna), using FactoMineR package for multivariate
analysis (Le et al., 2008), vegan 1.17-10 for statistics in Ecology and multcomp packages.
Additionally, SPSS® Statistics 18 and Microsoft Excel 2007 for Windows were used.
Aboveground biomass calculation
Aboveground biomass of living trees
The living tree aboveground biomass (AGB) was calculated using the equation for living trees
proposed by Baraloto et al. (2010). This equation is based on Chave et al. (2005) equation that
includes Diameter at Breast Height (DBH) in centimetres (cm), height in meters (m) and wood specific
gravity (WSG) in g/cm3 per binomial (see Wood Density): AGB = 0.0509 * (WSG) * (DBH)
2 * (height)
The AGB values from this equation are calculated in kg/0.5ha and then converted to Mg/ha. This is
the formula and parameters used for the final results and conclusions of this study. However, AGB
was also calculated using the same formula as a basis and changing parameters such as height and
wood density to check for differences in the final result (Appendix 3).
Wood density
The tree individuals identified at a species level were assigned with their wood specific gravity (WSG)
value (Chave et al., 2009) derived from the Global Wood Density Database (Zanne et al., 2009). For
the unknown individuals, the mean wood density of the WSG values in the database was assigned
(mean wood density = 0.66 g/cm3). The tree species identification was done in situ by experienced
botanists appointed by the French research institute for agricultural research for development
(CIRAD). Herbarium vouchers were collected for the unknown species encountered and the species
determination is still underway. It is important to note that the actual identified trees account for less
than 40% of the total individuals.
Aboveground biomass of lianas
The aboveground biomass for lianas was calculated in Mg/ha using the equation for lianas proposed
by Schnitzer et al. (2006): AGB = exp * [-1.484 + 2.657 * ln (DBH)]

25
Aboveground biomass of dead trees (DAGB)
The aboveground biomass of dead trees was calculated using the equation for dead trees proposed
by Baker et al., 2005: DAGB = [0.0509 * (0.4 * (DBH) 2 * (height)] * 0.5
The factor of 0.5 is the percentage of dead wood that it is estimated to remain after decomposition 5
years after logging had occurred (Baker et al., 2005).
Carbon content
The carbon content was calculated in Mg/ha, using the fraction of tree aboveground biomass for
tropical and subtropical forests proposed by IPCC Guidelines for National Greenhouse Gas
Inventories (2006). For big trees (DBH ≥ 10 cm) the fraction 0.49 was used (Hughes et al., 2000)
whereas for small trees (2.5 ≤ DBH <10 cm) the fraction 0.46 was used (Hughes et al., 2000).
Statistical analysis
The normality of data distribution was checked in both SPSS and R environment for statistics (R Core
Development Team, 2009). The Kolmogorov-Smirnov and Shapiro-Wilk tests were conducted in
SPSS to check if the data were distributed normally. The tests showed that the data were not
distributed normally. However, this is the limitation with large data sets where small deviations from
normality can lead to significant results concerning the difference of data sample from a normal
distribution. That is why in this case plotting of the data was important. Boxplots were created in the R
environment, to illustrate the distribution of the data in the samples from Kaw Mountains‟ sampling
sites: ONF primary, ONF selectively logged forest and Trésor reserve. Additionally, the distribution
was checked in the data set for the regional variation study that contained the primary terra firme
forest sites data from Kaw Mountains, Laussat conservation area, Trinité reserve, Nouragues reserve
and Regina (Baraloto et al., 2011). As long as the data distribution in the boxplots was normal,
analysis of variance ANOVA was conducted in the R environment to compare the mean tree
aboveground biomass (AGB) values from ONF primary and ONF selectively logged forest. The same
test was used to compare the mean tree AGB values among primary forest sites in French Guiana. In
addition “Tukey” post hoc test was conducted to compare pairwise all the different combinations of
sampling sites for both the regional variation study and the impact study of selective logging activity on
tree above ground biomass and carbon stocks.
For the forest structure analysis, independent Pearson‟s chi-square tests were conducted in
SPSS to check the degree of relationship between the two variables: DBH classification and selective
logging activity. In detail, the percentage of trees per DBH classes (DBH classification) in ONF
selectively logged forest and ONF primary forest was compared with respect to selective logging
activity. Moreover, Phi and Cramer‟s V test was used to check the strength of association between the
two categorical variables of DBH classification and selective logging activity. The Phi test is more
suitable for 2x2 contingency tables. Thus, in this study most suitable was the Cramer‟s V test as long
as the categorical variable of DBH classification has more than two categories. Additionally,
Goodman-Kruskal‟s lambda was used to test the proportional reduction in error achieved when one
membership of a category of one variable is used to predict the membership of a category of the other
variable. Due to the weakness of lambda test of getting a value of 0 when two variables cannot predict
each other, the Goodman-Krauskal Tau test was used to produce a more robust result.
Finally, principal component analysis (PCA) was executed in the R environment to test the
correlation between forest stand variables, climate variables and aboveground biomass (AGB) of
small (2.5 ≤ DBH < 10 cm) and big trees (DBH ≥ 10 cm) in the five primary forest sites (Kaw
Mountains, Laussat conservation area, Trinité reserve, Nouragues reserve and Regina) in French

26
Guiana. The PCA was chosen as the variables that describe the individual-trees are quantitative (Le
et al., 2008). Moreover, the PCA could provide an overview of the correlation of the different primary
forest sites in French Guiana in terms of the tree AGB values reported in each forest site.
2.6. Tree aboveground biomass recovery
The tree aboveground biomass (AGB) recovery study in the selectively logged sites was based on
field data and regeneration rates found in literature. According to Mazzei et al. (2010) in a tropical
forest that had been submitted to reduced impact logging with logging intensity of 6 trees/ha, the tree
AGB accumulation rate will be equal to 2.6 Mg ha-1
yr-1
, the second until the fifth year after logging.
This rate was used to calculate the tree AGB that has been accumulated in the forest 5 years after
logging. The first year after logging was not taken into account in the calculations because during this
year the net AGB accumulation is negative mainly due to the high death rate (Mazzei et al., 2010).
Moreover, the tree AGB that had been removed due to selective logging activity from the selectively
logged ONF forest sites was calculated using the diameter of stumps found in the sampling site and
an approximation of height of the felled trees based on a relation of diameter and height of the
standing trees in the forest site. The outcome of tree AGB accumulation 5 years after selective logging
was then compared to the tree AGB removed from the forest due to selective logging to give an
estimation of the tree AGB and carbon stocks recovery in the logged forest 5 years after selective
logging. It is important to underline that no death rate after logging was included in the calculations for
tree AGB recovery and no AGB losses due to collateral damage during selective logging were taken
into account.
2.7. Financial analysis
Forest carbon finance
The carbon content in Mg/ha in all forest sites was converted to CO2 equivalent (CO2e) of emissions
by multiplying the forest carbon values by the factor 3.67 which represents the ration of the molecular
weight of CO2 to the atomic weight of carbon (44/12) (Watson, 2009). In order to calculate the profits
when applying the REDD finance, the CO2 equivalent price in 2010 (Diaz et al., 2010) was used which
is equal to $5.5 per Mg CO2e and thus €4.08 per Mg CO2e according to the exchange rate of $ =
€0.74184 in November 2011.
Timber market
The estimation of the financial profits generated from the sale of timber that was removed from the
ONF selectively logged forest 5 years before, was based on the prices for standing timber for both the
local market in French Guiana (€17/m3 standing timber) and the open market (€50/m
3 standing timber)
(CCIG, 2008; personal comm. Guitet, S., 2011). For the conversion of the tree aboveground biomass
into timber volume the equation p=m/V was used where p=mean wood density=0.66 g/cm3
and
m=tree AGB that had been removed from the forest due to selective logging.

27
3. RESULTS
3.1. Overview of aboveground biomass
Preliminary analysis was done to investigate the aboveground biomass contribution of the three
growth forms: lianas, small trees (2.5 ≤ DBH < 10 cm) and big trees (DBH ≥ 10 cm) in the three forest
sites sampled (Figure 4). The analysis showed that big trees have the largest contribution to the total
biomass (93%) in all forest sites whereas small trees and lianas contribute the minimum to the total
aboveground biomass in the terra firme forest sites studied, a fact that has been also supported by
previous studies (Baraloto et al., 2011; Duden & Roeling, 2011). In particular, small trees contributed
only 2% in the primary forest sites (Trésor reserve and ONF primary forest) and 2.5% in the ONF
selectively logged forest site. On the other hand, lianas contributed less than 1% to the total AGB in
the primary forest sites and less than 0.5% in the ONF selectively logged forest. However, the
standard error (SE) of the mean values of big tree aboveground biomass showed that there is high
variability especially in Trésor reserve primary forest site as well as ONF selectively logged forest
(Table 4). On the contrary, the SE for the mean values of aboveground biomass of small trees and
lianas was lower indicating that there is lower variability in AGB for these growth forms in each forest
site. The aboveground biomass of dead trees (DAGB) was calculated as well, expecting larger DAGB
in the selectively logged forest comparing to the primary forest, although such a pattern was not
observed. Based on the results of this preliminary analysis, the AGB of small and especially big trees
was used for the regional variation study as well as for the impact study of selective logging on the
aboveground biomass and carbon stocks in terra firme forest.

28
Figure 4. Mean aboveground biomass (AGB) in Mg/ha of the three growth forms studied (lianas, small trees and big trees) and mean aboveground biomass of dead trees (DAGB) in Tresor primary forest (Transects: T1, T2 and T6; n=3), ONF primary (Transects: T5, T10 and T11; n=3) and ONF selectively logged forest (Transects: T7, T8 and T9; n=3). DBH 2.5-10: small trees of diameter at breast height (DBH): 2.5 ≤ DBH <10 cm; DBH ≥ 10 cm: big trees of DBH ≥ 10 cm. Data by Duden & Roeling (2011) and Mitsiou & Laporte-Bisquit (2011). Table 4. Mean aboveground biomass values of big trees, small trees and lianas as well as aboveground biomass of dead trees (DAGB) in Trésor reserve, ONF primary forest and ONF selectively logged forest site. SE: standard error of the mean values.
Mean AGB (±SE)
Location Big trees
(DBH ≥ 10 cm) Small trees
(2.5 ≤ DBH < 10 cm) Lianas DAGB
Trésor reserve (n=3)
424.41 ± 52.13 9.55 ± 0.38 3.13 ± 2.81 16.71 ± 4.27
ONF primary forest (n=3)
414.43 ± 11.52 7.95 ± 4.29 3.34 ± 2.49 17.28 ± 6.08
ONF logged forest (n=3)
360.19 ± 33.08 9.87 ± 1.65 1.76 ± 0.05 16.24 ± 3.71
3.2. Regional variation in big tree aboveground biomass
For the regional variation study in big tree (DBH ≥ 10 cm) aboveground biomass (AGB), primary terra
firme forest in Trésor reserve and ONF primary forest sites were sampled on Kaw Mountains (Duden
& Roeling, 2011; Mitsiou & Laporte-Bisquit, 2011). Preliminary analysis showed that there was no
significant variation in big tree (DBH ≥ 10 cm) AGB between Trésor reserve and ONF primary forest
sites. This outcome permitted the incorporation of the two datasets, in order to represent the same
forest site (Kaw) in the regional variation study. Then, the data from Kaw were analysed together with
data from five primary terra firme forest sites in French Guiana (Baraloto et al., 2011). The five primary
terra firme forest sites included: Laussat conservation area, Trinité reserve, Nouragues reserve and
Regina (Appendix 1). The small tree (2.5 ≤ DBH < 10 cm) AGB was not included in the regional
variation study as small tree AGB represented a minor percentage (2%) of the total AGB (Figure 4)
and thus could not affect strongly the variation in the total AGB.
Big tree aboveground biomass on Kaw Mountains
The big tree (DBH ≥ 10 cm) aboveground biomass (AGB) study in both primary terra firme forest sites
in ONF forest and Trésor reserve showed big tree AGB values close to the mean AGB for the eastern
Amazon equals to 410 Mg/ha (Mazzei et al., 2010). However, the median big tree aboveground
biomass in Trésor reserve was higher (440.73 Mg/ha) than the median big tree AGB value in ONF
primary forest (406.1 Mg/ha) (Table 5). Although the median big tree AGB in Trésor reserve was
higher, it was interesting to observe the large variation in big tree AGB in Trésor reserve forest as
illustrated in Figure 5. In particular, in transect 6 (T6) was observed big tree AGB equal to 327 Mg/ha,
that was almost equal to big tree AGB values observed in selectively logged forest sites. On the
contrary, big tree AGB values in the ONF primary forest were grouped within a range of 400 Mg/ha to
437 Mg/ha exhibiting less variability in the sample which was also confirmed from the relatively low
standard error of the mean (Table 5). The analysis of variance ANOVA between the two primary forest
sites on Kaw Mountains showed no significant results, F (1, 4) = .03, p = .86 (n=6) (Appendix 4). On
the one hand, the sample size was not sufficient. On the other hand, the close distance between
these forest sites might have be responsible for the non significant variation, taking into account that
the same forest type was sampled in both sites. Considering this outcome, the data from ONF primary
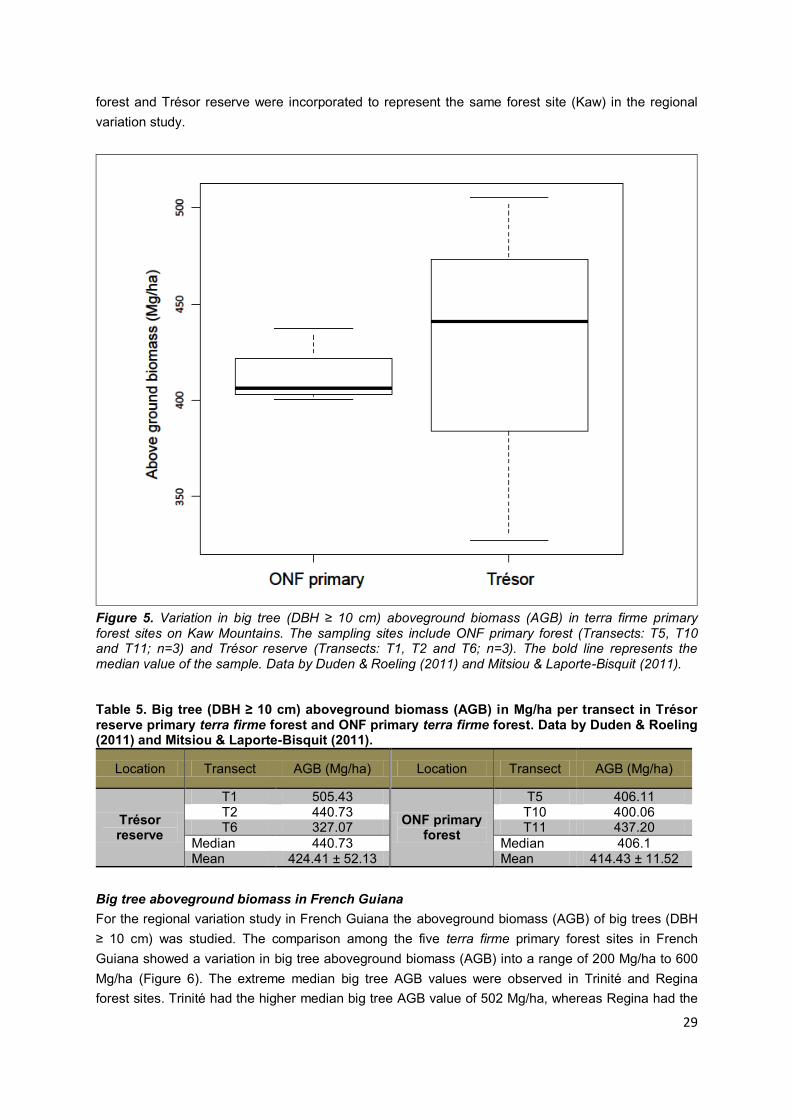
29
forest and Trésor reserve were incorporated to represent the same forest site (Kaw) in the regional
variation study.
Figure 5. Variation in big tree (DBH ≥ 10 cm) aboveground biomass (AGB) in terra firme primary forest sites on Kaw Mountains. The sampling sites include ONF primary forest (Transects: T5, T10 and T11; n=3) and Trésor reserve (Transects: T1, T2 and T6; n=3). The bold line represents the median value of the sample. Data by Duden & Roeling (2011) and Mitsiou & Laporte-Bisquit (2011). Table 5. Big tree (DBH ≥ 10 cm) aboveground biomass (AGB) in Mg/ha per transect in Trésor reserve primary terra firme forest and ONF primary terra firme forest. Data by Duden & Roeling (2011) and Mitsiou & Laporte-Bisquit (2011).
Location Transect AGB (Mg/ha) Location Transect AGB (Mg/ha)
Trésor reserve
T1 505.43
ONF primary forest
T5 406.11 T2 440.73 T10 400.06 T6 327.07 T11 437.20
Median 440.73 Median 406.1 Mean 424.41 ± 52.13 Mean 414.43 ± 11.52
Big tree aboveground biomass in French Guiana
For the regional variation study in French Guiana the aboveground biomass (AGB) of big trees (DBH
≥ 10 cm) was studied. The comparison among the five terra firme primary forest sites in French
Guiana showed a variation in big tree aboveground biomass (AGB) into a range of 200 Mg/ha to 600
Mg/ha (Figure 6). The extreme median big tree AGB values were observed in Trinité and Regina
forest sites. Trinité had the higher median big tree AGB value of 502 Mg/ha, whereas Regina had the

30
lower median big tree AGB value of 355 Mg/ha (Table 6). However, Laussat and Nouragues forest
sites had almost the same median of 398 Mg/ha and 397 Mg/ha, respectively. The variance in big tree
AGB values among transects was high in Nouragues, Regina and Trinité whereas Laussat and Kaw
demonstrated less variance across transects. It is particularly interesting the case of Kaw Mountains
where big tree AGB values were distributed normally and close to the median, although big tree AGB
values from two transects were outliers. The outlier at the lower extreme was transect T6 (327 Mg/ha)
and the outlier at the higher extreme was transect T1 (505 Mg/ha), both transects located in Trésor
reserve. However, the ANOVA test was not significant, F (4, 27) = .94, p = .45, showing that the
variance in the total sampling size was not sufficient to explain significant differences in big tree
aboveground biomass among terra firme primary forest sites in French Guiana (Appendix 4).
Additionally, t-tests that were conducted for the pairwise comparison of sampling sites showed that
none of the sites was significantly different (p > .05) (Appendix 4). In details, the results showed that
big tree AGB content in Regina and Laussat was different by 66 Mg/ha, though this difference was not
significant (p = 1). On the contrary, big tree AGB content in Trinité and Nouragues differed the most
(AGB difference of 99.14 Mg/ha), although the t-test was not significant (p = .36) (Appendix 4).
Figure 6. Regional variation in big trees (DBH ≥ 10 cm) aboveground biomass (AGB) across five terra firme primary forest sites in French Guiana; Laussat: n=7, Nouragues: n=7, Regina: n=6, Trinité: n=6 and Kaw: n=6. The Kaw Mountains forest sites include ONF primary forest (Transects: T5, T10 and T11; n=3) and Trésor reserve (Transects: T1, T2 and T6; n=3). The bold line represents the median value of the sample. Data by Duden & Roeling (2011); Mitsiou & Laporte-Bisquit (2011) (Kaw Mountains) and Baraloto et al. (2011) (Laussat, Nouragues, Regina and Trinité).

31
Table 6. Overview of the mean aboveground biomass (AGB) of big trees in Mg/ha per transect in the five primary forest sites in French Guiana. SE: standard error of the mean value. Data by Duden & Roeling (2011); Mitsiou & Laporte-Bisquit (2011) (Kaw Mountains) and Baraloto et al. (2011) (Laussat, Nouragues, Regina and Trinité).
Location Laussat
(n=7) Nouragues
(n=7) Regina (n=6)
Trinité (n=6)
Kaw (n=6)
AGB (Mg/ha)
364.70 397.64 374.41 390.02 505.43 345.35 505.46 529.05 548.67 400.06 398.42 420.04 487.17 604.87 437.20 474.24 484.10 302.43 495.17 440.73 407.09 246.19 336.88 509.55 406.11 486.53 208.12 325.46 244.27 327.07 335.55 302.47 - - -
Median 398.42 397.64 355.65 502.36 421.65 Mean ± SE 458.70 ± 22.58 366.29 ± 43.82 392.56 ± 38.14 465.43 ± 52.85 419.43 ± 23.98
3.3. Variables explaining tree aboveground biomass variation
The correlation study between forest stand variables (tree size, wood specific gravity, basal area and
stem density), climatic variables (rainfall and dry season index) and tree above ground biomass (AGB)
was done using the principal component analysis. The above ground biomass dataset included small
trees (2.5 ≤ DBH < 10 cm) and big trees (DBH ≥ 10 cm) AGB from Kaw Mountains (Duden & Roeling,
2011; Mitsiou & Laporte-Bisquit, 2011), Laussat conservation area, Trinité reserve, Nouragues
reserve and Regina (Baraloto et al., 2011) primary terra firme forest sites.
The principal component analysis (PCA) showed that the large variation in the dataset was
explained mainly by two groups of factors, relatively independent from each other (Figure 7). The first
group included: basal area (BA), density of big trees (Stems DBH ≥ 30), total tree AGB (AGB total)
and big tree AGB (AGB DBH ≥ 30). This group of variables were positively and highly correlated with
Axes1 (Dim1) explaining the 43.55% of variance (Figure 7). In particular, big tree AGB was correlated
by 0.938 to the first dimension (Dim1) explaining the most of the variance in the sample together with
total tree AGB (correlation: 0.937), density of big trees (correlation: 0.85) and basal area (correlation:
0.82) (Appendix 4). The second group contained: small tree AGB (AGB DBH 2.5-10) and density of
small trees (Stems DBH 2.5-10) and it is strongly correlated with Axes 2 (Dim2), explaining the
25.41% of variance (Figure 7). In details, the degree of correlation of these variables with the second
dimension (Dim2) was 0.90 for small tree AGB and 0.83 for the density of small trees (Appendix 4).
On the whole, the graph showed that the sample consisted of mixed forest communities because the
arrows of the two groups were not opposite but mostly perpendicular to each other. Moreover, it was
concluded that small trees variation was independent of the variation in big trees. However, the total
tree AGB was strongly related to big tree AGB and this pattern was observed in all regions.
Diameter at breast height (DBH) and height variables were well explained in the PCA
ordination diagram (Figure 7). In particular, DBH and height both compromised to the first group of
variables and showed a small positive relation. Generally, these two variables tended to have positive
relationship with dimension 1 (Dim1) and negative with dimension 2 (Dim2). More specifically, the
degree of correlation for DBH with Dim1 and Dim2 was 0.62 and -0.65, respectively (Appendix 4).
Similarly, the degree of correlation for height with Dim1 and Dim2 was 0.71 and -0.40, respectively.
Outcome which was expected as DBH and height were highly responsible for tree AGB values and
thus were the ones to explain a large percentage of tree AGB variation in the sample. It is interesting
to mention that the variable of height showed a stronger relationship with Dim1 than DBH which
underlines the importance of including the variable of height in the formulas for tree AGB calculation.
Accordingly, wood specific gravity (WSG) was shown to correlate more with dimension 1 (Dim1) and

32
less with dimension 2 (Dim2), meaning that big trees tend to have higher WSG whereas small trees
tend to have less WSG. Moreover, the positive correlation of wood specific gravity with Dim1
(correlation: 0.49) indicated that this variable influences tree AGB and thus WSG should be taken into
consideration for tree AGB calculation. On the other hand, the climatic factors included in the analysis,
rainfall and dry season index (DSI), did not exhibit correlation with any of the dimensions of the graph
(Figure 7). More specifically, the variable of rainfall exhibited negative correlation with both dimensions
meaning that more rainfall results in less tree aboveground biomass. Similarly, the dry season index
showed negative correlation with dimension 2 (Dim2), whereas its correlation with dimension 1 (Dim1)
was positive but low and equal to 0.08. This gives an indication that climatic factors such as
precipitation in the tropics might not have an important role in the tree AGB accumulation, although
the length of dry season (DSI) might be more important in tree AGB accumulation than precipitation.
Figure 7. Principal component analysis (PCA) ordination diagram illustrating the correlation cycle of forest stand (green) and climatic variables (red) with tree aboveground biomass (AGB) in five primary terra firme forest sites, French Guiana; Laussat: n=7, Nouragues: n=7, Regina: n=6, Trinité: n=6 and Kaw: n=6. Stems DBH (10-30): density of trees at DBH 10-30 cm; AGB DBH (2.5-10): small tree AGB; Stems DBH (2.5-10): density of small trees; BA: basal area; Stems DBH ≥ 30 cm: density of big trees; AGB total: AGB of small and big trees; AGB DBH ≥ 30: big tree AGB; wsg: wood specific gravity; DBH: diameter at breast height. Data by Duden & Roeling (2011); Mitsiou & Laporte-Bisquit (2011) (Kaw Mountains) and Baraloto et al. (2011) (Laussat, Nouragues, Regina and Trinité).

33
Figure 8. Principal component analysis (PCA) ordination diagram illustrating the coordinates of transects from the five primary terra firme forest sites in French Guiana; Laussat (Lau.): n=7; Nouragues (Nour.): n=7; Regina (Reg.): n=6; Trinité (Tri): n=6 and Kaw: n=6. The square sign represents the mean tree AGB value in the specific forest site. Data by Duden & Roeling (2011); Mitsiou & Laporte-Bisquit (2011) (Kaw Mountains) and Baraloto et al. (2011) (Laussat, Nouragues, Regina and Trinité).
Examining the regional variation in tree aboveground biomass (AGB) of both small and big
trees among the different primary forest sites, there was not strong evidence that the regions differ
(Figure 8). The tree AGB distribution per forest site did not follow any particular pattern, although it
exhibited a pretty dispersed and mixed distribution. Taking into consideration the mean tree AGB
values of each forest site, relative higher mean tree AGB content was observed in Trinité reserve,
whereas in Nouragues lower mean tree AGB value was found. Regina and Laussat seemed to be
clustered together with Kaw around similar mean tree AGB values. It is interesting to note that
transect 6 (T6) that was set in Trésor reserve on Kaw Mountains and exhibited the lowest tree AGB
value for the primary forest sites, was the only transect from Kaw that was correlated with dimension 1
(Dim1) at a degree of 6.5 when the other transects on Kaw correlated with dimension 1 (Dim1) at a
degree less than 0.9. It was observed that transects on Kaw Mountains correlated mainly with
dimension 2 (Dim2), whereas transects that correlated with dimension 1 (Dim1) at a degree of 10 to
13 are two transects in Nouragues and one transect in Trinité reserve. In Trinité reserve the variation
in tree AGB could be explained by both dimension 1 (Dim1) and dimension 2 (Dim2), although this
was not the case for Nouragues. On the opposite, Kaw Mountains were oriented towards the centre of
the distribution meaning that the variation in tree AGB in the region could not be explained by any of
the two principal dimensions. In the case of Kaw Mountains, different dimensions or variables (i.e.

34
geological data) might explain the variance in aboveground biomass. Concerning the amount of small
and big trees in each forest site some differences among sites were observed, although the most
interesting pattern was observed in Trinité reserve where there seemed to be an equal amount of
small and big trees.
3.4. Impact of selective logging
Impact of selective logging on tree aboveground biomass and forest structure
Taking into consideration that big trees had the largest contribution (Figure 4) in the total AGB values
in the forest, the study of selective logging impact was focused on big tree (DBH ≥ 10 cm)
aboveground biomass (AGB). Initially, a boxplot analysis was conducted to explore the variation in big
tree aboveground biomass (AGB) in ONF primary forest and ONF forest that had been selectively
logged 5 years before (Figure 9). The ONF primary forest exhibited higher median aboveground
biomass value of big trees than the ONF selectively logged forest. In the ONF primary forest, the
mean AGB values of big trees in the three transects were grouped in the upper quartile (25% of
scores) meaning that big tree AGB values in the majority of transects were superior to the median
(406 Mg/ha). On the other hand, in the ONF selectively logged forest big tree AGB values
demonstrated a normal distribution across the three transects that could probably be attributed to the
different logging intensity observed in each transect. This variation is also reflected by the high
standard error of the mean AGB value of big trees in the selectively logged forest site (Table 7).
However, the analysis of variance ANOVA was not significant, F (2, 6) = .91, p = .45 meaning that
either selective logging could not explain big tree AGB variation between selectively logged and
primary forest or the replicates were not enough to support the results (Appendix 4).
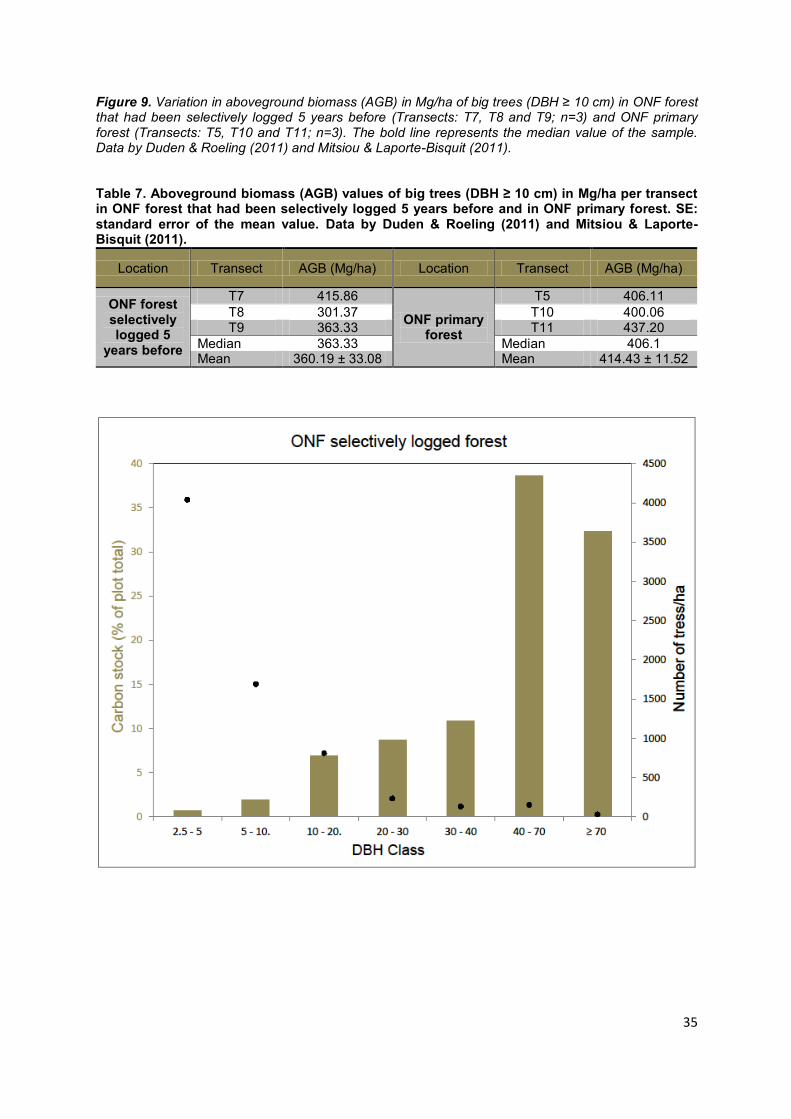
35
Figure 9. Variation in aboveground biomass (AGB) in Mg/ha of big trees (DBH ≥ 10 cm) in ONF forest that had been selectively logged 5 years before (Transects: T7, T8 and T9; n=3) and ONF primary forest (Transects: T5, T10 and T11; n=3). The bold line represents the median value of the sample. Data by Duden & Roeling (2011) and Mitsiou & Laporte-Bisquit (2011). Table 7. Aboveground biomass (AGB) values of big trees (DBH ≥ 10 cm) in Mg/ha per transect in ONF forest that had been selectively logged 5 years before and in ONF primary forest. SE: standard error of the mean value. Data by Duden & Roeling (2011) and Mitsiou & Laporte-Bisquit (2011).
Location Transect AGB (Mg/ha) Location Transect AGB (Mg/ha)
ONF forest selectively logged 5
years before
T7 415.86
ONF primary forest
T5 406.11
T8 301.37 T10 400.06 T9 363.33 T11 437.20
Median 363.33 Median 406.1 Mean 360.19 ± 33.08 Mean 414.43 ± 11.52

36
Figure 10. Impacts of selective logging activity on forest structure comparing ONF forest that had been selectively logged 5 years before (Transects: T7, T8 and T9; n=3) and ONF primary forest (Transects: T5, T10 and T11; n=3). The carbon values were calculated as the aboveground biomass (AGB) fraction of 0.46 for small trees (2.5 ≤ DBH < 10 cm) and 0.49 for big trees (DBH ≥ 10 cm) (Hughes et al., 2000). Data by Duden & Roeling (2011) and Mitsiou & Laporte-Bisquit (2011).
Table 8. Percentage of carbon and tree counts in each DBH class in ONF selectively logged forest 5 years before (Transects: T7, T8 and T9; n=3) and ONF primary forest (Transects: T5, T10 and T11; n=3). Data by Duden & Roeling (2011) and Mitsiou & Laporte-Bisquit (2011).
Location DBH
classes Tree
counts/ha %
Carbon Location
DBH classes
Tree counts/ha
% Carbon
ONF selectively
logged forest 5 years before
2.5 - 5 4040 0.73
ONF primary forest
2.5 - 5 2170 0.38
5 - 10 1690 1.92 5 - 10 1130 1.36
10-20 812 6.90 10-20 1036 8.82
20-30 232 8.67 20-30 228 9.27
30-40 130 10.83 30-40 128 10.03
40-70 152 38.60 40-70 160 33.92
≥ 70 30 32.33 ≥ 70 54 36.21
Moreover, chi-square tests were conducted to test the association of selective logging activity
with the distribution of small and big trees in DBH classes. Then, the counts of trees per DBH class
with the percentages of carbon content per DBH class (Table 8) were incorporated in graphs to
illustrate the impact of selective logging on forest structure (Figure 10). The carbon content of trees
was calculated as the aboveground biomass (AGB) fraction of 0.46 for small trees (2.5 ≤ DBH < 10
cm) and 0.49 for big trees (DBH ≥ 10 cm) (Hughes et al., 2000). The chi-square tests showed that
there was significant association between selective logging activity and the distribution of trees in DBH

37
classes χ2 (6) = 84.46, p < .001 (n=6) (Appendix 4). This result provided important statistical power to
the observation of forest structure change due to selective logging. In details, in the selectively logged
forest there was a decline in the number of big trees (DBH ≥ 10 cm) by 250 trees/ha comparing to the
primary forest (1606 trees/ha) probably due to selective logging activity. It is important to notice that
there was a significant decline in the number of trees especially in the larger DBH class (DBH ≥ 70
cm). In details, 54 trees of DBH ≥ 70 cm where found in the primary forest site whereas only 30 trees
of DBH ≥ 70 cm were found in the selectively logged forest site. The removal of big trees at DBH > 60
cm due to selective logging activity might be the main reason for this result.
On the contrary, the number of small trees (2.5 ≤ DBH <10 cm) in the selectively logged forest
was higher (5730 trees/ha) in comparison to the primary forest site where 3300 small trees/ha were
observed. The significance of this result was strengthened by the standardised residuals for the
smallest DBH class (DBH 2.5-5 cm) in both forest sites which were significant at p < .001 (n=6). For
the DBH class 10-20 cm the number of trees was reduced from 1036 trees in the primary forest to 812
trees in the selectively logged forest. The standardised residuals for this DBH class in both forest sites
were significant at p < .001 (n=6) which stated the strong effect of this class on the total result.
Although the high significance of the Pearson‟s chi-test indicated that there was a relationship
between selective logging and forest structure, the relatively low Cramer‟s statistic value (Cramer‟s V=
.19, p < .001) indicated that this relationship was not very strong (Appendix 4).
Concerning the carbon distribution in DBH classes, it was concluded that the largest
percentage of carbon was stored in big trees in both forest sites. In particular, the big trees stored the
98% and 97% of the total carbon in the primary forest and the selectively logged forest, respectively
(Table 8). However, a significant fall in carbon stock occured in the DBH class (≥ 70 cm) from 36% in
the primary forest to 32% in the selectively logged forest, probably due to the removal of the largest
trees due to selective logging. However in the selectively logged forest, it was observed an increase of
5% in carbon stocks in the DBH class (40-70 cm). It is interesting to mention that between the classes
DBH (40-70 cm) and DBH (≥ 70cm) a redistribution of carbon was observed when comparing the
forest before and after selective logging. In details, the DBH class (≥ 70cm) contained 38% of the total
carbon in the forest before selective logging when DBH class (40-70 cm) contained 33% of the total
carbon. After selective logging, 38% of carbon was contained in class DBH (40-70 cm) whereas in
DBH class (≥ 70cm) the carbon percentage was reduced to 32%. Moreover, in the smaller DBH
classes of (2.5-10 cm) it was observed a slight increase in carbon by 1%. This finding indicates that
the increase in the number of small trees after logging did not influence much the carbon storage and
thus illustrates again the low contribution of small trees to the carbon stocks in the forest.
Impact of selective logging on carbon stocks
The analysis of carbon stocks showed lower carbon content in the ONF terra firme forest that had
been selectively logged 5 years before (181.03 Mg/ha; n=3) comparing to the ONF terra firme primary
forest (206.74 Mg/ha; n=3) (Figure 11). This difference of 25.71 Mg/ha of carbon between the two
forest sites possibly resulted from the selective felling of big trees (DBH ≥ 10 cm). In particular, big
trees mean carbon content in the primary forest and in the forest 5 years after selective logging was
203.08 Mg/ha and 176.49 Mg/ha, respectively (Table 9). On the contrary, the mean carbon content of
small trees (2.5 ≤ DBH <10 cm) was slightly increased in the selectively logged forest (Table 9).
However, this small increase in carbon could not recompensate for the carbon losses due to the
removal of large trees, especially the individuals of DBH > 110 cm (Mazzei et al., 2010).

38
Figure 11. Mean carbon stock in Mg/ha in ONF primary forest (Transects: T5, T10 and T11; n=3) and ONF forest that had been selectively logged 5 years before (Transects: T7, T8 and T9; n=3). The mean carbon values were calculated as the mean aboveground biomass (AGB) fraction of 0.46 for small trees and 0.49 for big trees (Hughes et al., 2000). DBH 2.5-10: small trees of Diameter at Breast Height (DBH) 2.5 ≤ DBH < 10 cm; DBH ≥ 10 cm: big trees of DBH ≥ 10 cm. Data by Duden & Roeling (2011) and Mitsiou & Laporte-Bisquit (2011).
Table 9. Mean carbon stock in Mg/ha in Trésor reserve (n=3) and ONF primary forest sites (n=3) as well as in the ONF forest that had been selectively logged 5 years before (n=3). SE: standard error of the mean values. Data by Duden & Roeling (2011) and Mitsiou & Laporte-Bisquit (2011).
Mean carbon stock ± SE (Mg/ha)
Location Big trees
(DBH ≥ 10 cm) Small trees
(2.5 ≤ DBH < 10 cm) Total
Trésor reserve 207.96 ± 25.54 4.39 ± 0.17 212.35 ONF primary forest 203.08 ± 5.64 3.66 ± 1.97 206.74 ONF logged forest 176.49 ± 16.21 4.54 ± 0.76 181.03
3.5. Forest recovery estimation 5 years after selective logging
The calculation of the aboveground biomass (AGB) as well as carbon content contained in the trees
that had been removed from the ONF selectively logged forest areas gave an impression of the
minimum AGB and carbon that can be considered lost due to selective logging (Table 10). These
values were the minimum because it was not possible to estimate the extra AGB losses due to
collateral damage while selective logging activity.

39
Table 10. Minimum aboveground biomass (AGB) and carbon values in Mg/0.5ha removed from the ONF selectively logged forest site 5 years before. The calculations were based on the diameter of stumps found in transects (T7, T8 and T9) and on estimation of the felled tree height. Carbon values were calculated as the AGB fraction of 0.49 (Hughes et al., 2000). Data by Mitsiou & Laporte-Bisquit (2011).
Min Aboveground Biomass & carbon removed
Transect (0.5 ha)
DBH (cm) Estim. Height (m) AGB
(Mg/0.5ha) C
(Mg/0.5ha)
T7 Stump 1 103.5 30 21.6 10.6
T7 21.6 10.6
T8 Stump 1 75 25 9.4 4.6
T8 Stump 2 50 25 4.2 2.1
T8 13.6 6.7
T9 Stump 1 33.7 25 1.9 0.9
T9 Stump 2 70 25 8.2 4
T9 Stump 3 114 30 26.2 12.8
T9 36.3 17.8
Taking into account that the net AGB accumulation rate was equal to 2.6 Mg ha-1
yr-1
(± 4.6)
for the second until the fifth year after selective logging (Mazzei et al., 2010), the total AGB amount
that would have been accumulated in the selectively logged forest 5 years after logging would be
equal to 10.4 Mg/ha (5.2 Mg/0.5ha). Comparing this number with the tree AGB amount that had been
removed from the ONF forest due to selective logging, it was observed that tree AGB would not
recover in any of the forest sites within 5 years after selective logging. More specifically, tree AGB in
transect 7 (T7) was expected to recover by 24%, in T8 by 38%, whereas in T9 only the 14% of the
tree AGB removed was expected to recover within 5 years after selective logging. It is interesting to
highlight that in T7 only one tree had been felled in 0.5ha, whereas in T8 and T9 two and three trees,
respectively. This observation underlines the fact that tree dimensions and not only the number of
felled trees are important factors to affect the post-logging AGB recovery in the forest. Moreover, it is
worth mentioning that the felled tree in T7 had been a Manilkara bidentata (common name: Balata
franc) which is one of the most exploited tree species in French Guiana (ONF, 1994).
3.6. Forest carbon finance vs. timber market
The tree aboveground biomass and carbon data were used to create an estimation of the financial
value that could be assigned to the primary forest sites when applying the REDD finance.
Additionally, the amount of carbon that had been removed from the forest due to selective logging was
used to create an estimation of the financial loss due to selective logging activity. For these
estimations, the amount of carbon in Mg was multiplied by 3.67 to be transformed into CO2 equivalent
(Watson, 2009) and this equivalent was multiplied by the CO2e price in 2010 which is $5.5/Mg CO2e
(€4.08/Mg CO2e in November 2011) (Diaz et al., 2010). The numbers in table 11, indicate the financial
losses owing to logging activity when comparing primary forest sites and the selectively logged forest.
In details, the primary terra firme forest sites in Trésor reserve and ONF primary forest were attributed
a financial value within the range of €3000-3180/ha ($4170-4290). On the contrary, the tree
aboveground biomass and thus carbon removal due to selective logging, resulted in a lower financial
value of €2710/ha ($3654/ha) for the ONF selectively logged forest.

40
Table 11. Financial analysis based on mean carbon in Mg/ha in Trésor reserve and ONF primary forest sites as well as in the ONF forest that has been selectively logged 5 years before. CO2e price in 2010: $5.5/Mg CO2e (Diaz et al., 2010) (€4.08/Mg CO2e in November 2011). Data by Duden & Roeling (2011) and Mitsiou & Laporte-Bisquit (2011).
Location Mean carbon
(Mg/ha) CO2 equivalent
(Mg/ha) €/ha $/ha
Trésor reserve 212.35 779.32 3179.63 4286.26
ONF primary forest 206.74 758.74 3095.66 4173.07 ONF logged forest 181.03 664.38 2710.67 3654.09
Moreover, a comparison was done between the financial profits produced from timber sale
and the ones that could be produced by keeping the forest standing and applying the REDD finance.
For this comparison it was considered that the REDD finance will be applied for a period of 65 years
which is the rotation cycle in French Guiana so that onetime benefits would be generated from both
timber market and REDD finance within this time period. The tree aboveground biomass (AGB)
estimated to have been removed from the ONF selectively logged forest site equal to 71.5 Mg was
used (see Table 10). This tree AGB value accounts for the standing timber volume of 108.33 m3
(p=0.66 g/cm3). In French Guiana, almost the 80% of the produced timber is directed towards the local
market and it is used mainly as building material and for woodworks (CCIG, 2008). Thus, a two way
approach was realised in order to estimate the profits produced by the local timber market and by the
open market for standing timber (Figure 12). Taking into consideration that €17/m3 is the price for
standing timber in the local market in French Guiana and €50/m3 is the price for standing timber in the
open market (CCIG, 2008; personal comm. Guitet, S., 2011), the profits from selling the standing
timber had been €1841.61 ($1366.18) and €5416.5 ($4018.18) in the local and open market,
respectively (Figure 12). Alternatively, if this tree AGB had been retained in the forest, the avoided
CO2 emissions would have accounted for 128.58 Mg. Thus, the financial benefit when applying the
REDD finance would have been €524.61 ($707.19) for the period of 65 years (Figure 13).
Figure 12. Financial profits produced by selling the tree aboveground biomass (AGB) removed from the ONF forest due to selective logging 5 years before, as standing timber in the local market in French Guiana and the open market (CCIG, 2008; personal comm. Guitet, S., 2011). 0.66 g/cm
3:
wood specific gravity. Currency exchange rate of $= €0.74184, in November 2011

41
Figure 13. Financial profits produced when applying the REDD finance on the tree aboveground biomass (AGB) removed from the ONF forest due to selective logging 5 years before. 0.49: carbon fraction of AGB (Hughes et al., 2000); 3.67 factor for the conversion of carbon to CO2 equivalent (CO2e) (Watson, 2009); $5.5/Mg the price of CO2e in 2010 (Diaz et al., 2010); €4.08/Mg CO2e according to the currency exchange rate of $= €0.74184, in November 2011

42
4. DISCUSSION
4.1. Regional variation in primary forest sites
The regional variation study showed that there was no significant variation in tree aboveground
biomass (AGB) among primary terra firme forest sites across different regions in French Guiana,
although considerable local variation was observed among transects within a specific forest site. This
is an interesting result as it confirms once again that in the tropics, large variation may be observed
within a particular forest area, although this variation cannot be observed when examining forest
regions at a larger scale such as French Guiana (Baraloto et al., 2010; 2011). Moreover climatic
factors such as precipitation and length of dry season were not likely to shape differences of tree AGB
among primary forest sites in the tropics. Concerning the forest structure and specifically the
composition of small and big trees some differences were observed among forest sites, although the
climatic factors studied could not explain this variation. Alternatively, other variables or a combination
of other variables might be responsible for the variation observed (i.e. geological profile of forest sites,
etc.). For example, the precipitation patterns on Kaw Mountains in combination with the special
geological profile (poor soils and lateritic geological profile) might be the cause of the observed
differences in forest structure in Trésor reserve. These differences result from the high frequency of
forest gaps on Kaw Mountains due to the shallow soil profile that makes big trees unstable. However
this study could not provide evidence that this special geological profile was responsible for the
differences in forest structure.
However, when referring to primary forest sites, cases of relatively undisturbed forest that it is
considered as primary forest should be taken into account. In the case of relatively undisturbed forest,
differences in tree AGB might not be the result of environmental factors influence but rather the
outcome of human disturbance. In the present study, such cases were Trésor reserve and probably
Nouragues forest site. Trésor reserve in the 1950s had been an important spot for gold mining and
had suffered from illegal logging especially in the area close to where today is located the “Botanical
path” and relatively close to the site where transect 6 (T6) was set. This fact could lead to the
conclusion that the low tree AGB value observed in T6 might be the result of past human disturbance
and not an indication of environmental impact on tree aboveground biomass. This history might also
explain the great variation in tree AGB that was observed in Trésor reserve, even though the mean
tree AGB value for the reserve was high. Likewise, Nouragues forest site might not be accessible
through infrastructure, although a research centre is present in the primary forest site and its impact to
the surrounding forest is unclear. Thus, attention should be given when referring to primary forest sites
especially when there is no detailed forest management record which was the case in French Guiana.
4.2. Impact of selective logging on carbon stocks
This study revealed an important impact of selective logging activity on tree aboveground biomass
(AGB) and carbon stocks mainly due to the removal of big trees (DBH ≥ 10 cm). On the contrary, the
mean carbon content of small trees (2.5 ≤ DBH <10 cm) was slightly higher in the selectively logged
forest probably due to regeneration and recruitment of young trees in the resently logged forest that
was enhanced by the openings created due to the felling of big trees (Blanc et al., 2009). However, on
the one hand this increase in AGB of small trees could not compensate for the AGB loss due to the
removal of big trees and on the other hand it might be temporal and occurring only during the first
years after selective logging. Though, it is encouraging the fact that in French Guiana the logging
intensity is relatively low according to field observation (1-3 felled trees/0.5ha) and the mean timber
volume of 7.8 m3/ha that was reported to had been extracted 5 years before from parcel KAW2 where

43
the sampling was conducted (ONF, 2011b). To provide a comparison, in the Brazilian Amazon have
been reported cases of logging practices where almost 20 m3/ha of timber was being removed from
the forest due to logging (Boltz et al., 2001; Sist & Ferreira, 2007). However, progress is still needed
towards a sustainable logging practice regime in French Guiana that will aim to the mitigation of
collateral losses of AGB. First of all, reduced-impact logging (RIL) felling methods should be soon
applied in French Guiana and timber certification schemes are required for both carbon stocks and
biodiversity conservation. The current certification schemes and the PEFC certification that ONF
targets to apply in the future are market orientated without ensuring that the methods for timber
extraction are sustainable. Thus, it is proposed that a better certification scheme for the Guianas
would be the FSC instead of PEFC as the former is less trade orientated and includes principles that
ensure biodiversity and ecosystem conservation (Credible Forest Certification, 2006).
4.3. Forest recovery estimation
The regeneration analysis in the forest that had been selectively logged 5 years before indicated that
the size of felled trees (m3 of timber) might be more important for the estimation of tree aboveground
biomass (AGB) losses due to selective logging than the actual number of trees that had been cut.
However, final conclusions could not be reached because the mortality rate and the recruitment
patterns in the selectively logged forest were not taken into consideration in this study. Additionally,
the tree AGB accumulation rate used was only a speculation of the actual tree AGB recovery rate in
the selectively logged forest sites. In particular, this recovery rate applies to forest that had been
submitted to a logging intensity of 2-6 trees/ha, although in our study site the maximum logging
intensity was 3 trees/ha. Taking into account that greater opening may influence differently the
regeneration rate, possibly the growth rate for our study site is lower than 2.6 Mg/ha yr (Gourlet-Fleury
et al., 2005). Lastly, the collateral damage while selective logging was not taken into account and thus
it should be considered that the actual tree AGB values removed from the forest due to selective
logging were greater than the one calculated according to stumps dimensions. Consequently, it is
estimated that more time would be required for tree aboveground biomass and carbon stocks
recovery in the ONF selectively logged forest sampled.
4.4. Financial approach
The comparison of financial benefits from timber sale and carbon market is important to be taken into
consideration when referring to the application of the REDD finance. For this comparison it was
considered that the REDD finance would be applied for a period of 65 years which is the rotation cycle
in French Guiana so that onetime benefits would be generated from both timber market and REDD
finance within the selected time period. The financial approach showed that, the profits from selling
108.33 m3
standing timber had been €1841.61 ($1366.18) and €5416.5 ($4018.18) in the local and
open market, respectively (CCIG, 2008; personal comm. Guitet, S., 2011), whereas the financial
benefits by keeping this volume as standing forest would have been €524.61 ($707.19) (Watson,
2009; Diaz et al., 2011) by applying the REDD finance for the period of 65 years.
These numbers clearly show that timber trade either in the local or open market would
generate more than double the profits than the REDD finance within the 65 years period. More
specifically, the low carbon price could be one of the constraints towards the application of REDD
mechanism. Additionally, the investment risk is prevalent due to the lack of guarantee that the forest
will remain standing even after the exclusion of logging activity (i.e. forest fires etc.) (Carlson &
Curran, 2009). However, it should be taken into account that with every logging cycle there is a certain
amount of tree aboveground biomass loss that cannot recover with regeneration. Thus, in the long

44
term a decline in profits from timber sale will occur together with forest degradation. Moreover, the
financial aspect should not overshadow the co-benefits from retaining the forest intact. Forest
products used for food, medicines, fibres etc., watershed services and biodiversity conservation are
some of the most important benefits from keeping the forest standing. Moreover, social, environmental
and economic benefits from tropical forest are very important to local communities and indigenous
people (Viana, 2009). Consequently an REDD+ mechanism that links forest conservation with other
services apart from carbon sequestration could be more effective towards tropical forest conservation.
In any case, it is important that tropical forest conservation under the REDD mechanism is coupled
with effective monitoring in order to avoid negative effects such as leakage which imply the increase of
deforestation outside the protected forest areas (Viana, 2009).
4.5. Limitations-suggestions for improvement
In general, this study produced some interesting results concerning the impact of selective logging on
tree aboveground biomass (AGB) and carbon stocks in the tropical forest, although there is high
uncertainty surrounding these outcomes as the statistic tests showed no significant results apart from
the chi-square tests on the impact of selective logging on forest structure. Consequently, more
replicates and further study are needed in order to strengthen the observed results and conclusions.
Furthermore, the great percentage (60%) of missing taxonomic data resulted in incomplete
information on the wood specific gravity used for big tree (DBH ≥ 10 cm) AGB calculation. Additionally,
due to this information gap the investigation of possible correlation between carbon stocks and
biodiversity was not feasible. Moreover, the assumptions over tree AGB regeneration in ONF
selectively logged forest can only be considered as an estimate and no final conclusions can be driven
based on these results. Thus, long term research is needed in order to conclude on the time period
that is necessary for the selectively logged forest regeneration. Finally, the primary forest sampled in
this study could have been relatively unexploited in certain forest sites. This problem was prevalent
during the selection stage of the sampling sites as the exploitation record for certain sites was not
clear especially when referring to illegal logging activity.
4.6. Suggestions for future study
A meta-analysis could be done using the data produced from this study and comparable data
from French Guiana but also from other regions in South America in order to analyse further the
variation in tree aboveground biomass and carbon stocks among primary forest sites.
More research is needed in order to understand the influence of environmental factors (i.e.
soil characteristics, geological profile etc.) on tree aboveground biomass (AGB) as well as carbon
stocks in primary terra firme forest sites in the Guiana Shield (Takyu et al., 2002; Hammond, 2005).
Previous studies have shown that soil quality and composition can affect forest structure in terra firme
forest in Indonesia (Paoli et al., 2008). Thus, soil data could be incorporated in principle component
analysis (PCA) to investigate whether these environmental variables affect the variability in tree AGB.
The completion of taxonomic determination could spark more discussion on a possible
connection between carbon stocks and biodiversity as well as investigate possible effects of selective
logging on biodiversity. This could be very important for the REDD mechanism as forest sites with
high biodiversity are considered of first priority sites for forest conservation (UNEP-WCMC, 2008).
More carbon sinks (i.e. soil carbon), apart from aboveground carbon content in trees could be
investigated with a view to determine more precisely the total carbon stocks in a tropical forest
ecosystem (Verweij et al., 2009). Moreover, this approach could reveal possible effects of selective
logging on other carbon sinks, apart from tree aboveground carbon stocks.
45
Finally, the ground based carbon data produced from this study could be incorporated with
remote sensing data for the creation of bio-habitat GIS maps that will promote forest cover and carbon
stocks monitoring in the French Guianese region (Olson et al., 2001; Baraloto et al., 2011).
4.7. Conclusion
The present study showed that there was no significant regional variation in tree aboveground
biomass (AGB) among primary terra firme forest sites in French Guiana and climatic factors such as
rainfall and length of dry season were not adequate to explain the distribution of tree AGB among
primary forest sites. Thus, it was concluded that further research is needed on the environmental
variables that affect tree aboveground biomass content in primary terra firme forest sites. Moreover,
this study illustrated the serious impacts of selective logging on tree aboveground biomass and carbon
stocks, underlying the importance of primary forest conservation. More specifically, it was illustrated
that selective logging activity had an important impact on tree AGB and carbon stocks especially of big
trees (DBH > 10 cm). Estimates on forest recovery showed that tree AGB loss of 36.3 Mg and 13.6
Mg would recover by 14% and 38% respectively within a period of 5 years after selective logging.
These findings underlined that carefully planned logging scheme and forest management is needed in
order to conserve tree AGB and forest carbon stocks. Moreover, reduced-impact logging schemes
and specialised certification over timber extraction should soon be applied in French Guiana in order
to achieve a more sustainably managed forest. To summarise, the mean carbon content of trees in
the primary terra firme forest sites sampled was 212.35 Mg/ha in Trésor reserve and 206.74 Mg/ha in
the ONF primary forest site. On the contrary, in the ONF forest site that had been selectively logged 5
years before the mean carbon content of trees was 181.03 Mg/ha. In terms of financial value when
applying the REDD finance, the primary terra firme forest in Trésor reserve would be worth
€3179.63/ha ($4286.26/ha) and the same forest type in ONF forest site would be worth €3095.66/ha
($4173.07/ha). On the contrary the ONF forest that had been selectively logged 5 years before would
have a lower value of €2710.67/ha ($3654.09/ha). At the same time, the trade of 108.33 m3 standing
timber had generated €1841.61 ($1366.18) and €5416.5 ($4018.18) in the local and open timber
market, respectively (CCIG, 2008; personal comm. Guitet, S., 2011). Alternatively, if this volume was
retained as standing forest, it would have had the value of €524.61 ($707.19) (Watson, 2009; Diaz et
al., 2011). Considering the co-benefits of forest conservation as well as the permanent loss of a
certain amount of tree aboveground biomass due to selective logging activity resulting in forest
degradation in the long term, it is urgent to consider the preservation or wise forest management of
the tropical forests in French Guiana in order to conserve the value and services that these
ecosystems provide.

46
REFERENCES
Asner, G.P., Knapp, D.E., Broadbent, E.N., Oliveira, O.J.C, Keller, M. & Silva, J.N. 2005. Selective
logging in the Brazilian Amazon. Science 310: 480-482. Angelsen A. (ed.) 2008. Moving ahead with REDD: Issues, options and implications. CIFOR, BOGOR,
Indonesia. Baker, T.R., Honorio Coronado, E. N., Phillips, O.L., Martin, J., van der Heijden, G.M.F., Garcia, M. &
Espejo, J. S. 2007. Low stocks of coarse woody debris in a southwest Amazonian forest. Oecologia, 152: 495-504.
Baraloto, C., Paine, T.C.E., Patino, S., Bonal, D., Hérault, B. & Chave, J. 2010. Functional trait variation and sampling strategies in species rich plant communities. Functional Ecology, 24: 208–216.
Baraloto, C., Rabaud, S., Molto, Q., Blanc, L., Fortunel, C., Hérault, B., Dávila, N., Mesones, I., Rios, M., Valderrama, E. & Fine, P. V. A. 2011. Disentangling stand and environmental correlates of aboveground biomass in Amazonian forests. Global Change Biology, 17: 2677–2688.
Blanc, L., Echard, M., Herault, B., Bonal, D., Marcon, E., Chave, J. & Baraloto, C. 2009. Dynamics of aboveground carbon stocks in a selectively logged tropical forest. Ecological Applications. 19 (6): 1397-1404
Boltz, F., Carter, D.R., Holmes, T.P. & Pereira, R.Jr. 2001. Financial returns under uncertainty for conventional and reduced-impact logging in permanent production forests of the Brazilian Amazon. Ecological Economics 39:387-398.
Boyle, B.L. 1996. Changes on altitudinal and latitudinal gradients in neotropical montane forests. pp 275. Washington University, St. Louis, MO.
Buchmann N. 1997. Interseasonal comparison of CO2 concentrations, isotopic composition and carbon dynamics in the Amazonian rainforest (French Guiana). Oecologia 110:120-131
Carlson, K.M. 2009. REDD pilot project scenarios: are costs and benefits altered by spatial scale? Environmental Research Letters. 4 (031003): 3pp
CCIG. 2008. La filière foret – bois en Guyane. Edition 2008. Chambre de Commerce er d‟Industrie de la Guyane. Direction du Développement et de l‟Aménagement du Territoire Observatoire Economique.
Chave, J., Andalo, C., Brown, S., Cairns, M.A., Chambers, J.Q., Eamus, D., Folster, H., Fromard, F., Higuchi, N., Kira, T., Lescure, J.P., Nelson, B.W., Ogawa, H., Puig, H., Riera, B. & Yamakura, T. 2005. Tree allometry and improved estimation of carbon stocks and balance in tropical forests. Oecologia, 145: 87–99.
Chave, J., Coomes, D., Jansen, S., Lewis, S.L., Swenson, N.G. & Zanne, A.E. 2009. Towards a worldwide wood economics spectrum. Ecology Letters, 12: 351-366.
CIA. 2011. The world fact book. Consulted on 5 July, 2011 from: http://www.cia.gov/library/publications/the-world-factbook/index.html.
Credible Forest Certification. 2006. Why FSC and Not PEFC? Consulted on 20 October, 2011 from http://credibleforestcertification.org
DeFries, R., Achard, F., Brown, S., Herold, M., Murdiyarso, D., Schlamadinger, B. & de Sourza C. Jr. 2006. Reducing greenhouse gas emissions from deforestation in developing countries: Considerations for monitoring and measuring. Global Terrestrial Observing System (GTOS), Rome.
DeFries, R., Achard, F., Brown, S., Herold, M., Murdiyarso, D., Schlamadinger, B. & de Souza, C. Jr. 2007. Earth observations for estimating greenhouse gas emissions from deforestation in developing countries. Environmental Science & Policy 10 (4): 385-394.
Diaz, D., Hamilton, K. & Johnson, E. 2011. State of Forest Carbon Markets. From Canopy to Currency. Ecosystem Marketplace/Forest Trends.
Duden, A. & Roeling, I. 2011. Human impact on carbon stocks in the coastal Kaw region, French Guiana. Effect of selective logging and road infrastructure on carbon stocks. Master thesis. Utrecht University.
Ek., R.C., Bordenave, B.G., Sluiter, R. & van der Knaap, E.C. 2000. The floristic composition and vegetation structure of the Trésor Reserve, French Guiana. Trésor Foundation.
FAO. 2000. Annex 6: Definitions and Basic Principles of Sustainable Forest Management in relation to criteria and indicators. In: Asia-Pacific Forestry Commission: Development of National-Level Criteria and Indicators for the Sustainable Management of Dry Forests of Asia: Workshop Report 30 November-3 December, 1999, Bhopal, India. Published by the Regional Office for

47
Asia and the Pacific (RAP), Bangkok, Thailand. Retrieved on 9 October, 2011 from http://www.fao.org
FAO. 2010. Global Forest Resources Assessment 2010 (FRA2010). Main report. Retrieved on 5 July, 2011 from: http://www.fao.org/forestry/fra
FAO - UNESCO. 1981. FAO-UNESCO soil map of the world 1:5.000.000. Vol. I to X. UNESCO, Paris. Fearnside, P.M. 2000. Global warming and tropical land-use change: greenhouse gas emissions from
biomass burning, decomposition and soils in forest conversion, shifting cultivation and secondary vegetation. Climate Change 46: 115–58
Fearnside, P.M. 2001. Environmentalists split over Kyoto and Amazonian deforestation. Environmental Conservation. 28: 295-299.
Fearnside, P.M. & Laurance, W.F. 2003. Comment on „Determination of deforestation rates of the world‟s humid tropical forests‟. Science 299: 1015
Fearnside, P.M. & Laurance, W.F. 2004. Tropical deforestation and greenhouse gas emissions Ecological Applications 14: 982–6
Feldpausch, T.R., Jirka, S., Passos, C.A.M., Jasper, F. & Riha, S.J. 2005. When big trees fall: Damage and carbon export by reduced impact logging in southern Amazonia. Forest Ecology & Management 219: 199-215.
Gibbs, A.K. & Barron, C.N. 1993. The Geology of the Guiana Shield. Oxford University Press, Oxford, UK.
Gibbs, H., Brown, S., O‟Niles, J. & Foley, J. 2007. Monitoring and estimating tropical forest carbon stocks: making REDD a reality. Environmental Research Letters 2: 45-23.
GOFC - GOLD. 2009. Reducing greenhouse gas emissions from deforestation and degradation in developing countries: a sourcebook of methods and procedures for monitoring, measuring and reporting, GOFC-GOLD Report version COP 14-2. GOFC-GOLD Project Office, Natural Resources Canada, Alberta, Canada.
Goodwin, A. 1996. Principles of Precambrian Geology. Academic Press, New York. Gourlet-Fleury, S., Cornu, G., Jésel. S., Dessard, H., Jourget, J.G., Blanc, L. & Picard, N. 2005. Using
models to predict recovery and assess tree species vulnerability in logged tropical forests: A case study from French Guiana. Forest Ecology and Management 209: 69–86
Guiana Shield Initiative. Consulted on 5 July, 2011 from: http://www.guianashield.org Guitet, S. 2005. Mieux valoriser la ressource en bois et réduire les impacts sur l‟environnement: deux
objectifs convergents pour une exploitation forestière durable en Guyane française. Rendez-vous techniques, n
o9, pp. 65-69, ONF, French Guiana.
Guitet, S., Gond, V. & Brunaux, O. 2007. Les satellites au service du forestier guyanais pour améliorer l‟organisation et le contrôle de l‟exploitation forestière. Rendez-vous techniques, n
o17, pp. 17-
20, ONF, French Guiana. Guyane, La Region. Consulted on 5 July, 2011 from: http://www.cr-guyane.fr. Hammond, D.S. 2005. Ancient Land in a modern World. In: Hammond, D.S. ed. Tropical Forests of
the Guiana Shield : Ancient Forests in a Modern World. Oxfordshire: Wallingford, pp. 1-14. Healey, J.R., Price, C. & Tay, J. 2000. The cost of carbon retention by reduced impact logging. Forest
Ecology & Management 139: 237-255. Holmgren, P., Marklund, L.G., Saket, M. & Wilkie, M.L. 2007. Forest Monitoring and Assessment for
Climate Change Reporting: Partnerships, Capacity Building and Delivery. Forest Resources Assessment Working Paper 142. FAO, Rome. Retrieved on 13 July, 2011 from: http://www.fao.org/forestry/fra
Houghton, R.A. 2005. Tropical deforestation as a source of greenhouse gas emissions. Tropical Deforestation and Climate Change. ed. Mutinho and Schwartzman (Belem: IPAM)
Houghton, R.A., Lawrence, K.T., Hackler, J.L. & Brown, S. 2001. The spatial distribution of forest biomass in the Brazilian Amazon: a comparison of estimates. Global Change Biology, 7, 731-746.
Hughes, R.F., Kauffman, J.B. & Jaramillo-Luque, V.J. 2000. Ecosystem-scale impacts of deforestation and land use in a humid tropical region of México. Ecological Applications 10: 515-527.
IPCC. 2003. Good practice guidance for land use, land-use change and forestry (GPG-LULUCF). Penman, J., Gytarsky, M., Krug, T., Kruger, D., Pipatti, R., Buendia, L., Miwa, K., Ngara, T., Tanabe, K. & Wagner, F. (eds.), IPCC-IGES, Kanagawa. Retrieved on 10 July, 2011 from: http://www.ipcc-nggip.iges.or.jp/public/gpglulucf/gpglulucf_contents.html
IPCC. 2006. 2006 IPCC guidelines for national greenhouse gas inventories. Volume 4. Agriculture, forestry and other land use. Retrieved on 10 July, 2011 from: http://www.ipcc-nggip.iges.or.jp/public/2006gl/vol4.html

48
IPCC. 2007. Climate change 2007. The physical science basis: Contribution of Working Group I to the Fourth Assessment Report of the IPCC. Cambridge University Press: Cambridge, UK. Retrieved on 10 July, 2011 from: http://www.ipcc.ch/publications_and_data/ar4/wg1/en/contents.html
ITTO. 2011. Reduced Impact Logging. Consulted on 6 October, 2011 from http://www.itto.int/feature15/
Journal Officielle de la Gouvernement Française. 1967. Ministère de l‟Agriculture, Décret n°67-207 du 10 mars 1967. Consulted on 25 June, 2011from: http://legifrance.gouv.fr.
Keller, M., Melillo, J.M. & deMello, W.Z. 1997. Trace gas emissions from ecosystems in the Amazon basin. Cienca e Cultura., 49, 87-97.
Lasco, R.D. & Cardinoza, M.M. 2007. Baseline carbon stocks assessment and projection of future carbon benefits of a carbon sequestration Project in East Timor. Mitigation and Adaptation Strategies for Global Change 12: 243–257.
Lashof D.A. & Ahuja D.R. 1990. Relative contributions of greenhouse gas emissions to global warming. Nature 344: 529-531
Le, S., Josse, J. & Husson, F. 2008. FactoMineR: An R Package for Multivariate Analysis. Journal of Statistical Software, 25, 1-18.
Mazzei, L., Sist, P., Ruschel, A., Putz, F.E., Marco, P., Pena, W. & Ferreira, J.E.R. 2010. Above-ground biomass dynamics after reduced-impact logging in the Eastern Amazon. Forest Ecology & Management 259: 367–373
Malhi, Y. & Grace, J. 2000. Tropical forests and atmospheric carbon dioxide. Trends in Ecoogy & Evoluion. 15: 332–7
Météo-France. 2010. Pluvial data from the meteo station at Camp-Caiman, on Kaw Mountain. Climate data in French Guiana were provided by Météo France via a cooperative agreement with the Centre de Cooperation International pour la Recherche Agronomique pour le Développement (CIRAD). Data acquired on 10 July, 2011 from CIRAD.
Murdiyarso, D., Skutsch, M., Guariguata, M., Kanninen, M., Luttrell, C., Verweij, P., & Martins, O. S. 2008. How do we measure and monitor forest degradation? pp. 99-106. In Angelsen A. (Ed.) Moving ahead with REDD: Issues, options and implications. CIFOR, BOGOR, Indonesia.
ONF. 1994. Aménagement de la Forêt domaniale de Kaw (16.860 ha), 1995-2004. Direction régional de Guyane.
ONF. 2007. National Forestry Regulations. RNEF. Issued by the decisions of the Director General on 21 December 2007. Retrieved on 20 October, 2011 from www.onf.fr/filiere_bois/sommaire/informations
ONF. 2010. Programme Regional de Mise en Valeur Forestiere pour la Production de Bois d‟Oeuvre. Periode 2010-2014. Region Guyane. Union Europeene-Fonds Europeen Agricole pour le Developpement Rural.
ONF. 2011a. Les forêts du littoral Atlantique. Consulted on 5 July, 2011 from: http://www.onf.fr/guyane/sommaire/onf/@@index.html
ONF. 2011b. Reported timber volumes extracted from the ONF parcels under exploitation the period 1995-2009. Personal communication with Stephan Guitet in February, 2011.
Olander, L.P., Gibbs, H.K., Steininger, M., Swenson, J.J. & Murray, B.C. 2008. Reference scenarios for deforestation and forest degradation in support of REDD: a review of data and methods. Environmental Research Letters 3: 025011(11pp). Retrieved on 13
July, 2011 from:
www.iop.org/EJ/article/1748-9326/3/2/025011/erl8_2_025011.pdf. Olson, J.S., Watts, J.A., Allison, L.J. 1983. Carbon in live vegetation of major world ecosystems.
Environmental sciences division publication 1997. Oak Ridge National Laboratory, Oak Ridge, Tennessee.
Olson, D.M., Dinerstein, E., Wikramanayake, E.D., Burgess, N.D., Powell, G.V.N., Underwood, E.C., D‟Amico, J.A., Itoua, I., Strand, H.E., Morrison, J.C., Loucks, C.J., Allnutt, T.F., Ricketts, T.H., Kura, Y., Lamoreux, J.F., Wettengel, W.W., Hedao, P. and Kassem, K.R. 2001. Terrestrial ecoregions of the world: a new map of life on Earth. Bioscience 51: 933–938.
Paoli, G.D., Curran, L.M. & Slik, J.W.F. 2008. Soil nutrients affect spatial patterns of aboveground biomass and emergent tree density in southwestern Borneo. Oecologia 155: 287-299.
Penman, J., Gytarsky, M., Hiraishi, T., Krug, T., Kruger, D., Pipatti, R., Buendia, L., Miwa, K., Ngara, T., Tanabe, K. & Wagner, F. 2003. Good practice guidance for land use, land-use change and forestry IPCC National Greenhouse Gas Inventories Programme and Institute for Global Environmental Strategies (IGES), Kanagawa, Japan. Retrieved on 12 July, 2011 from: www.ipcc-nggip.iges.or.jp/public/gpglulucf/ gpglulucf.htm

49
Peters-Stanley, M., Hamilton, K., Marcello, T. & Sjardin, M. 2011. Back to the Future. State of the Voluntary Carbon Markets 2011. A report by Ecosystem Marketplace & Bloomberg New Energy Finance. Retrieved on 26 October, 2011 from http://www.ecosystemmarketplace.com
Pluggle, D., Baldauf, T., Ratsimba, H.R., Rajoelison, G., Köhl, M. 2010. Combined biomass inventory in the scope of REDD (Reducing Emissions from Deforestation and Forest Degradation). Madagascar Conservation & Development 5(1): 23-34.
Press, F. & Siever, R. 1982. Earth. W.H. Freeman and Co., San Francisco, California. Putz, F.E. & Pinard, M.A. 1993. Reduced Impact Logging as a Carbon-offset Method. Conservation
Biology 7(4): 755-757 Putz, F.E., Sist, P., Fredericksen, T. & Dykstra, D. 2008. Reduced-impact logging: Challenges and
opportunities. Forest Ecology & Management 256: 1427-1433. RNF. 2011. Trésor. Consulted on 17 July, 2011 from: http://www.reserves-naturelles.org R Core Development Team. 2009. R: A language and environment for statistical computing. R
Foundation for Statistical Computing, Vienna, Austria. Rudel T.K. 2001. Sequestering Carbon in Tropical Forests: Experiments, Policy Implications, and
Climatic Change. Society and Natural Resources, 14:525–531. Rutishauser, E., Wagner, F., Herault, B., Nicolini, E.A. & Blanc L. 2010. Contrasting above-ground
biomass balance in a Neotropical rain forest. Journal of Vegetation Science 21: 672-682. Schnitzer, S.A., DeWalt, S.J. & Chave, J. 2006. Censuring and Measuring Lianas: A Quantitative
Comparison of the Common Methods. Biotropica 38 (5): 581-591. Schroeder, P. 1992. Carbon storage potential of short rotation tropical tree plantations. Forest Ecology
and Management 50:31-41. Sist, P. & Ferreira, F.N. 2007. Sustainability of reduced-impact logging in the Eastern Amazon. Forest
Ecology & Management 243: 199-209. Takyu, M., Aiba, S.I. & Kitayama, K. 2002. Effects of topography on tropical lower montane forests
under different geological conditions on Mount Kinabalu, Borneo. Plant Ecology 159: 35-49. Ter Steege, H., Sabatier, D., Castellanos, H., Andel, T. van, Duivenvoorden, J., Adalardo de Oliveira,
A., Ek, R., Lilwah, R., Maas, P. & Mori, S. 2000. An analysis of the floristic composition and diversity of Amazonian forests including those of the Guiana shield. Journal of Tropical Ecology 16: 801-828.
Trésor Foundation. 2006. Trésor Topography. Consulted on 17 July, 2011 from: http://www.tresorrainforest.org
Trésor Foundation. 2010. The Trésor Project. Consulted on 5 July, 2011 from: http://www.tresorrainforest.org
Tropical Forest Foundation. 2009. Reduced Impact Logging. Consulted on 6 October, 2011 from http://www.tropicalforestfoundation.org/get-verified/reduced-impact-logging
UNEP. 2010. United Nations Environmental Programme Annual Report 2010. Retrieved on 5 July, 2011 from: http://www.unep.org/publications/contents/Annual_Reports.asp
UNEP - WCMC. 2008. Carbon and biodiversity: a demonstration atlas. Eds. Kapos, V., Ravilious, C., Campbell, A., Dickson, B., Gibbs, H., Hansen, M., Lysenko, I., Miles, L., Price, J., Scharlemann, J.P.W. & Trumper, K. UNEP-WCMC, Cambridge, UK.
UNFCCC. 1998. Kyoto protocol to the United Nations Framework Convention on Climate Change. Retrieved on 5 July, 2011 from: http://unfccc.int/kyoto_protocol
UNFCCC. 2008. Kyoto protocol reference manual on accounting emissions and assigned amount. Retrieved on 5 July, 2011 from: http://unfccc.int/resource/docs/publications/08_unfccc_kp_ref_manual.pdf
UNFCCC. 2011a. Essential Background. Consulted on 5 July, 2011 from: http://unfccc.int UNFCCC. 2011b. Methods & Science. Consulted on 5 July, 2011 from: http://unfccc.int Verweij, P., Schouten, M., van Beukering, P., Triana, J., van der Leeuw, K. & Hess, S. 2009. Keeping
the Amazon Forests standing: a matter of values. Report commissioned by WWF Netherlands, Zeist, the Netherlands.
Viana, V.M. 2009. Financing REDD: meshing markets with government funds. International Institute for Environment and Development (IIED). pp:1-4. Retrieved on 8 December, 2011 from: www.iied.org/pubs
Vidal, E., Johns, J., Gerwing, J.J., Barreto, P. & Uhl, C. 1997. Vine management for reduced-impact logging in eastern Amazonia. Forest Ecology & Management 98: 105-114.
Watson, C. 2009. Forest carbon accounting: overview & principles. A report for UNDP, UNEP and UNEP Risoe Centre. Retrieved on 30 November, 2011 from http://www.undp.org

50
Wertz-Kanounnikoff, S. & Verchot, L.V. with Kanninen, M. & Murdiyarso, D. 2008. How can we monitor, report and verify carbon emissions from forests? pp. 87-98. In A. Angelsen (Ed.) Moving ahead with REDD: Issues, options and implications. CIFOR, BOGOR, Indonesia.
World Bank. 2008. State and Trends of the Carbon Market. Consulted on 1 July, 2011 from: http://sitesources.worldbank.org
World Bank . 2011a. State and Trends of the Carbon Market. Consulted on 1 July, 2011 from: http://sitesources.worldbank.org
World Bank. 2011b. Reforestation Projects Bring Carbon Revenues And Co-Benefits To Poor Communities. Press Release No:2012/006/SDN. Consulted on 1 July, 2011 from: http://web.worldbank.org
World Bank. 2011c. The Prototype Carbon Fund. Consulted on 6 August, 2011 from: http://web.worldbank.org
Zanne, A.E., Lopez-Gonzalez, G., Coomes, D.A., Ilic, J., Jansen, S., Lewis, S.L., Miller, R.B., Swenson, N.G., Wiemann, M.C. & Chave, J. 2009. Global wood density database. Dryad.

51
APPENDICES APPENDIX 1: Study area
Figure S1. Map of the northern coastal part of French Guiana where the place of Kaw Mountains with Trésor nature reserve is illustrated. The location of the capital Cayenne and its relative distance from the sampling site is shown as well (© 2006 Trésor Foundation) (source: Trésor Foundation, 2011).
Figure S2. Precipitation map, French Guiana (ORSTOM, 1979) (acquired from the report of Duden & Roeling, 2011)

52
Figure S3. The location of the primary forest sites in French Guiana. Clockwise from north to south: Laussat conservation area, Kaw Mountains, Regina, Nouragues reserve and Trinité reserve (original map source: mapsof.net, edited by Alexandra Mitsiou, 2011).

53
APPENDIX 2: Details on sampling methods
Transect: the modified Gentry plot
The modified Gentry plot developed by Baraloto et al. (2010) was used for the forest sites sampling.
The protocol proposes a flexible design for the sampling of a 0.5 ha forest area with the possibility to
change the place of the subplots as well as the direction of the baseline to acquire a more
representative sample of the mosaic tropical forest within a 2 ha area. The core design of this modified
Gentry plot (transect) consists of a baseline of 190 m along which 10 10x50 m subplots, totalling 0.5
ha forest area, are orientated alternatively perpendicular to the baseline. Between the middle-line of
each subplot there is 20 m separation (Baraloto et al., 2010).
Figure S4. Transect design proposed by Baraloto et al., 2010. Ten 10x50 m subplots are oriented alternatively perpendicular along a 190 m baseline.
Methodology in the field
Initially the baseline was set by laying down 100 m tape and marking with warning tape every 20 m
starting from 5 m and finishing at 185 m (Figure S4). Each point corresponded to the start of the
middle-line of subplot. The direction of the baseline was noted and GPS coordinates at 5 m and 185 m
were marked using Garmin GPSMAP® 60CSx (© Garmin technologies). The direction of subplots was
determined using a compass and the middle-line was set using a 50 m tape. A 10 m tape was laid
perpendicular to the middle-line to mark the limits of subplot. Coordinates of position were taken for all
the individuals, using randomly the subplot middle-line as the x axis and the perpendicular tape as y
axis (- y on the one side and + y on the other side of the middle-line).

54
APPENDIX 3: Formulas for tree aboveground biomass calculation
Figure S5. Discrepancy in big tree (DBH ≥ 10 cm) aboveground biomass (AGB) values per transect when using different formulas. The formula used in this study is F3 that contains both height and wood specific gravity (WSG) per binomial (Chave et al., 2005). The scatter plot depicts the discrepancy in big tree (DBH ≥ 10 cm) AGB values per transect when
using four different formulas for big tree AGB calculation (Figure S5). All formulas were different
expressions of the Chave et al. (2005) formula used for the data analysis of the present study and that
corresponds to formula F3 in the above plot: AGB = 0.0509 (WSG) (DBH) 2
(height). Formulas F2 and
F4 did not contain the variable of height, whereas formulas F1 and F2 contained the mean wood
specific gravity value. In the case of F1 and F2, all individuals were assigned with the mean WSG =
0.66 gr/cm3 calculated from the global wood density database (Zanne et al., 2009). Whereas, in the
case of F3 and F4, the known individuals were assigned with the WSG of their binomial and the
unknown individuals were assigned with the mean WSG = 0.66 gr/cm3. It is clear from the graph that
when height was not included in the formula, big tree AGB was overestimated. However, no particular
difference was observed in big tree AGB when using the wood specific gravity per binomial instead of
the mean wood specific gravity value. On the one hand, this result might mean that the WSG per
binomial did not influence much the big tree AGB value. On the other hand, it is important to consider
that due to many missing species, the actual identified trees account for less than 40% of the total
individuals. Consequently, only the 40% of the individuals had been assigned with their specific WSG,
whereas the rest 60% had been assigned with the mean WSG value as in formulas F1 and F2. Thus,
there is a possibility that with more species known we could have seen differences in the big tree AGB
values.

55
APPENDIX 4: Statistical analysis tables
TableS1. Summary of the results from Chi-square tests analysis on the forest structure between ONF forest site that had been selectively logged 5 years before and ONF primary forest site. The chi-square tests done were: Pearson Chi-Square test, Lambda, Goodman & Kruskal tau, Phi and Cramer's V test. The analysis was done using the SPSS software.
Chi-Square Tests, ONF LOGGED - ONF PRIMARY Value df Asymp. Sig. (2-sided)
Pearson Chi-Square 84.466a 6 .000
Likelihood Ratio 85.398 6 .000 Linear-by-Linear Association
45.448 1 .000
N of Valid Cases 2414
a. 0 cells (.0%) have expected count less than 5. The minimum expected count is 20.23.
Directional Measures
Value Asymp. Std. Error
a
Approx. Tb Approx.
Sig.
Nominal by Nominal
Lambda Symmetric .059 .014 4.212 .000
Treatment Dependent
.134 .030 4.212 .000
DBH Classification Dependent
.000 .000 .c .
c
Goodman and Kruskal tau
Treatment Dependent
.035 .007 .000d
DBH Classification Dependent
.012 .003 .000d
a. Not assuming the null hypothesis. b. Using the asymptotic standard error assuming the null hypothesis. c. Cannot be computed because the asymptotic standard error equals zero. d. Based on chi-square approximation
Symmetric Measures
Value Approx. Sig.
Nominal by Nominal
Phi .187 .000
Cramer's V .187 .000 Contingency Coefficient .184 .000
N of Valid Cases 2414
Standardised Residuals
DBH class ONF LOGGED ONF PRIMARY
2.5 – 5 4.6 -4.8 Std.Residual > ± 1.96, significant at p < .05
5 – 10 1.9 -2.0 Std.Residual > ± 2.58, significant at p < .01 10 – 20 -3.3 3.5 Std.Residual > ± 3.29, significant at p < .001 20 – 30 -1.6 1.7 30 – 40 -.2 .2 40 – 70 -.5 .6
70 and up -1.5 1.5

56
TableS2. Summarising tables of the ANOVA statistical test results that was done to compare the mean aboveground biomass values in: (1) ONF forest site that had been selectively logged 5 years before and ONF primary forest site, (2) Trésor reserve primary forest and ONF primary forest site, (3) the primary forest sites Nouragues, Laussat, Trinité, Regina and Kaw Mountain in French Guiana. The analysis was done in the R environment for statistical computing.
ANOVA results, ONF LOGGED - ONF PRIMARY
Model df Sum of
Squares Mean Square F Pr (> F)
Regression 2 7169.6 3584.8 0.9088 0.4521
Residual 6 23668.3 3944.7
Total 8 30837.9 7529.5
Coefficients
Linear Hypothesis Estimate Std. Error t Pr (> │t│)
ONFL - ONFP == 0 54.271 51.282 1.058 0.571
ANOVA results, TRESOR - ONF PRIMARY
Model df
Sum of Squares Mean Square F Pr (> F)
Regression 1 148.7 148.7 0.0348 0.8611
Residual 4 17099.3 4274.8
Total 5 17248 4423.5
Coefficients
Linear Hypothesis Estimate Std. Error t Pr (> │t│)
ONFP - TRESOR == 0 9.956 53.384 0.186 0.861
ANOVA results, French Guiana
Model df Sum of
Squares Mean Square F Pr (> F)
Regression 4 34449 8612.3 0.9424 0.4546
Residual 27 246733 9138.3
Total 281182 17750.6
Coefficients
Linear Hypothesis Estimate Std. Error t Pr (> │t│)
Nour. - Lau. -35.41 51.1 -0.693 0.956
Reg. - Lau. -9.13 53.18 -0.172 1
Tri. - Lau. 63.73 53.18 1.198 0.752
Kaw - Lau. 17.73 53.18 0.333 0.997
Reg. - Nour. 26.28 53.18 0.494 0.987
Tri. - Nour. 99.14 53.18 1.864 0.36
Kaw - Nour. 53.15 53.18 0.999 0.853
Tri. - Reg. 72.86 55.19 1.32 0.681
Kaw - Reg. 26.86 55.19 0.487 0.988
Kaw - Tri. -45.99 55.19 -0.833 0.918

57
TableS3. Overview of the principal component analysis (PCA) results: eigenvalues, correlation of variables to dimensions and contribution of variables to the dimensions.
PCA - eigenvalues
eigenvalue percentage of variance cumulative percentage of variance
comp 1 4.3900065253 3.658339e+01 36.58339 comp 2 2.5736619327 2.144718e+01 58.03057 comp 3 1.6511095303 1.375925e+01 71.78982 comp 4 1.2370902871 1.030909e+01 82.09890 comp 5 0.7401385239 6.167821e+00 88.26672 comp 6 0.5147733374 4.289778e+00 92.55650 comp 7 0.3452901681 2.877418e+00 95.43392 comp 8 0.2403690089 2.003075e+00 97.43392 comp 9 0.1857783008 1.548153e+00 98.98515 comp 10 0.1094123358 9.117695e-01 99.89692 comp 11 0.0122872615 1.023938e-01 99.99931 comp 12 0.0000827882 6.899016e-04 100.00000
PCA - Correlation of variables to dimensions
Dim.1 Dim.2 Dim.3 Dim.4 Dim.5
Rainfall -0.2112532 -0.1593915 0.81842053 0.25298166 0.05693826
DSI 0.0820992 -0.1142238 -0.80004186 -0.40386771 -0.05921802 Wsg 0.4973420 -0.2543148 0.19296429 -0.48986448 0.55055008 Height 0.7133671 -0.4041421 0.01958608 -0.02796016 0.32067328 DBH 0.6249709 -0.6511176 -0.03356710 0.22415404 -0.11143397 BA 0.8167244 0.3411307 -0.15431700 0.38240145 -0.09783004 Stems 10-30 -0.1532280 0.3501462 -0.39608283 0.65857461 0.49360006
Stems 2.5-10 0.1093315 0.9011851 0.04578913 -0.20078922 0.16803218
Stems sup30 0.8456109 0.2736166 -0.09814905 0.17515920 -0.08501860
AGB sup30 0.9379346 0.1773016 0.17832881 -0.08791628 -0.11430870
AGB 2.5-10 -0.1269234 0.8296459 0.22610985 -0.23235573 -0.03198098
AGB total 0.9372559 0.1937186 0.16472022 -0.07950170 -0.11077698
PCA - Contribution of variables
Dim.1 Dim.2 Dim.3 Dim.4 Dim.5
Rainfall 1.0165800 0.9871402 40.56739765 5.1734074 0.4380215
DSI 0.1535369 0.5069458 38.76587019 13.1849008 0.4737996 Wsg 5.6343656 2.5129958 2.25516327 19.3977121 40.9525212 Height 11.5920705 6.3462431 0.02323375 0.0631943 13.8935280 DBH 8.8972215 16.4727989 0.06824200 4.0615495 1.6777304 BA 15.1944818 4.5215789 1.44228689 11.8205494 1.2930982
Stems 10-30 0.5348242 4.7637310 9.50158720 35.0597303 32.9183004
Stems 2.5-10 0.2722861 31.5556027 0.12698395 3.2589627 3.8148011
Stems sup30 16.2883064 2.9089307 0.58344012 2.4800733 0.9765959
AGB sup30 20.0391783 1.2214445 1.92604807 0.6247945 1.7654099
AGB 2.5-10 0.3669595 26.7444757 3.09644282 4.3642074 0.1381881
AGB total 20.0101895 1.4581128 1.64330408 0.5109183 1.6580057