uva-dare (digital academic repository) pulsation, … · 6678 8 6678 8 4713 3 4921 1 6678 8 4026 6...
TRANSCRIPT

UvA-DARE is a service provided by the library of the University of Amsterdam (http://dare.uva.nl)
UvA-DARE (Digital Academic Repository)
Pulsation, rotation, wind and magnetic field in early B-type stars
Neiner, C.
Link to publication
Citation for published version (APA):Neiner, C. L. (2002). Pulsation, rotation, wind and magnetic field in early B-type stars
General rightsIt is not permitted to download or to forward/distribute the text or part of it without the consent of the author(s) and/or copyright holder(s),other than for strictly personal, individual use, unless the work is under an open content license (like Creative Commons).
Disclaimer/Complaints regulationsIf you believe that digital publication of certain material infringes any of your rights or (privacy) interests, please let the Library know, statingyour reasons. In case of a legitimate complaint, the Library will make the material inaccessible and/or remove it from the website. Please Askthe Library: http://uba.uva.nl/en/contact, or a letter to: Library of the University of Amsterdam, Secretariat, Singel 425, 1012 WP Amsterdam,The Netherlands. You will be contacted as soon as possible.
Download date: 30 Jun 2018
4 4 Variabilit yy and pulsations in the Be star 666 Ophiuchi
AstronomyAstronomy & Astrophysics, in press
M.. Floquet, C. Neiner, E. Janot-Pacheco, A.M. Hubert, S. Jankov, J. Zorec, D.. Briot, J. Chauville, N.V. Leister, J.R. Percy, D. Ballereau, A.G. Bakos
Abstract t 666 Oph is a Be star seen under a moderate inclination angle that shows strong variability from UVV to IR wavelengths. A concise review of long-term variability history is given. High reso-lution,, high S/N spectroscopic observations obtained in 1997, 1998 and 2001 and spectropo-larimetricc observations obtained in 2000 are presented. These observations occurred during aa long-term decrease of Ha intensity. Fundamental parameters of the star have been revis-itedd from Barbier-Chalonge-Divan (BCD) calibrations. New vsini values are obtained using Fourierr transforms applied to observed helium lines and a rotational frequency frot = 1.29 c d "11 is determined. Time series analysis and Fourier Doppler Imaging (FDI) of He I lines (4713,, 4921, 5876 and 6678 A) lead for the first time to the detection of multi-periodicity inn 66 Oph. The two main frequencies found are f = 2.22 c d^1 and f = 4.05 c d - 1 . They aree attributed to non-radial pulsations and can be associated with mode degree / = 2 and II = 3, respectively. Inspection of Stokes V profiles suggests the presence of a weak Zeeman signaturee but further observations are needed to confirm the detection of a magnetic field in 666 Oph.
4.11 Introductio n
Bee stars are non-supergiant, usually rapid rotators showing a near infrared excess and Balmer emissionn lines imputed to an equatorially concentrated envelope fed by sporadic mass ejec-tionn episodes. These stars also show light and line-profile variations in time scales ranging fromm hours to years. Several authors such as Frost & Conti (1976) and Andrillat et al. (1986) arguedd that some O and A stars also show many of the properties used to define the so-called Bee phenomenon. Recently, Marlborough (2000) proposed the term OBA phenomenon as a
83 3

Chapterr 4
betterr descriptive term that embodies all the objects showing the observational characteristics mentionedd above. For the sake of brevity, we will use in this paper the term "Be star" to des-ignatee these objects. Masss loss in Be stars is often separated schematically into two regimes: a rapid, low-density, variable,, radiatively driven wind originating mainly in high latitude regions and character-izedd by resonance lines of "superionized" species (e.g. CIV, Si IV, N v) and a dense, slowly expanding,, equatorially concentrated circumstellar envelope (often called equatorial disk). Thee disk seems to be mainly replenished during transient mass loss episodes. Be stars are nott observed to rotate at the break-up velocity and the causes of the non-regular mass loss inn these stars are as yet unknown. Non-radial pulsations (NRP) and stellar activity of mag-neticc origin have been proposed as mechanisms that could give rise to the additional amount off momentum needed to cause mass ejection (e.g. Smith 1977; Underhill 1987; Gies 1991, andd references therein). Multi-periodicity has been detected in B-Be stars mainly in optical linee profile variations (LPV) and has been generally attributed to NRP (e.g. Gies 1994). As aa matter of fact, recent theoretical calculations by Balona & Dziembowski (1999) revealed thee existence of unstable p and g NRP high-degree modes in the B temperature range that are compatiblee with some observed periods (Balona & Kambe (1999) and Jankov et al. (2000) forr ( Oph; Janot-Pacheco et al. (1999) for 77 Cen; Hubert et al. (1997) for 48 Per; Floquet etal.. (1996) for 48 Lib).
Aperiodicc optical line profile variability on time-scales ranging from tens of minutes to hourss has also been observed in several Be stars (Peters 1986; Smith 1989; Leister et al. 2000; Smithh 2000).
Photometricc variations in visual bands (up to several tenths of magnitude) on time-scales ass short as one day have been reported by Percy et al. (1997) for a sample of active Be stars.. In a study of the variability of 273 Be stars from the Hipparcos data base (August 1989-Augustt 1993), Hubert & Floquet (1998) found the presence of short-term (< 3.5 d), mid-term (weeks,, months) and long-term (years, decades) variations. Light outbursts and fading events weree often observed in early type stars. Outbursts have been found mainly in stars showing loww to moderate vsini, while fading events are more frequent in objects with high vsini. Al ll the above-listed manifestations of "Be activity" have been attributed to sudden discrete ejectionss of matter that momentarily obscure or add light to the photosphere, depending on thee angle through which they are seen. The brightening/fading dependence with vsini seems too indicate that ejections are somewhat concentrated towards low latitudes.
Resonancee UV lines often show extended shortward absorption and asymmetry which aree signatures of a fast (<; 1000 km s_1) stellar wind. Wind variability is rather common amongg Be stars (e.g. Barker & Marlborough 1985; Snow 1987). It can be interpreted in terms off recurrent multiple shortward-shifted discrete absorption components (DACs) (Henrichs 1984;; Grady et al. 1987; Prinja 1991) variable in number and distribution in radial veloc-ityy and optical depth. Doazan et al. (1987) and Telting & Kaper (1994) found a correlation betweenn the long-term violet to red emission peak ratio V/R (i.e. disk activity) and the oc-currence/intensityy of DACs (wind activity) in 7 Cas. For stars seen at moderate inclination angles,, long term V/R variability has been successfully reproduced with a precessing one-armedd density perturbation in the disk (Okazaki 1991, 1996; Mennickent et al. 1997, and referencess therein). The DACs - V/R correlation can be understood in the frame of a dis-
84 4
Variabilityy and pulsations in 66 Oph
tortedd disk in terms of column density variation in the DACs region caused by the density perturbationn (Telting & Kaper 1994). Multiwavelength campaigns showed the presence of commonn periods in the UV and optical wavelength ranges for several Be stars. Moreover, the amplitudee of light variations increases with decreasing wavelength and the wind mass loss tendss to be enhanced when the star is brightest. UV and optical observations seem to imply thatt non-radial pulsations are responsible for line profile variations, light variability and also forr the modulation of the hot stellar wind (Peters 1991a, 1997).
666 Oph (HD164284, HR6712, B2V, V~ 4.6, t;sim=280 km s "\ this paper) is a Be star seenn at a moderate inclination angle. This star has a long history of conspicuous photometric andd spectroscopic variability, both in UV and optical wavelengths. It is also known to exhibit linearr polarization variations (Hayes 1983). Penrod (1985, private communication cited by Gradyy et al. (1987)) suggested that 66 Oph could be a nonradial pulsator on the basis of spectroscopicc observations.
InIn Sect. 2 we present high resolution, high signal-to-noise spectroscopic observations of 666 Oph obtained at Haute Provence Observatory (France) in June 1997 and June 1998 (He I 66788 and Ha) and spectropolarimetric observations at Pic du Midi Observatory (France) in Junee 2000 (4500-6600 A). Additional observations were obtained at Pic du Midi Observatory inn August 2001 (5400-8700 A), at ESO (Chile) in April 2001 (3900-9000 A) and at LNA (Brazil)) in June 2001 (He I 6678 A and Ha).
Inn Sect. 3 we reconsider the fundamental parameters of the star taking into account rota-tionall effects. New values of v&ini are obtained.
Inn Sect. 4 we present a concise review on the variability of the star with emphasis on correlationss found between optical and UV wavelengths behaviour.
Dataa were searched for rapid variability and results are interpreted in the frame of the non-radiall pulsation model (NRP) in Sect. 5.
Finallyy in Sect. 6 we report the attempt to detect a stellar magnetic field from analysis off circular polarization measurements: the presence of such a field could be one of the keys towardss the understanding of the Be phenomenon. Recall that a weak magnetic field has been detectedd in (3 Cep, a slowly rotating BlVe star which is the prototype of a class of pulsating starss (Henrichs et al. 2000).
Resultss are discussed in Sect. 7 and conclusions are presented in Sect. 8.
4.22 Observations
Thee highly variable behaviour of 66 Oph makes it a good candidate for a non-radial pulsator. Inn order to study the short-term variability of the star, observations were performed at Haute Provencee Observatory during five nights in June 1997 and seven nights in June 1998; series of subexposuress in spectropolarimetric observations carried out at Pic du Midi Observatory dur-ingg seven nights in June 2000 were also investigated to this purpose. All three runs occurred duringg the long-term decrease of Ha emission as it wil l be seen in Sect. 4.4.
85 5
Chapterr 4
4.2.11 Spectroscopic observations
Spectroscopicc observations were obtained at Haute Provence Observatory (OHP) in 1997 andd 1998 with the 1.52m telescope equipped with the spectrograph Aurélie and a 2048 linear THXX detector. The resolving power was 22000 (calculated over the 3px resolution element) andd the wavelength range ~ 200 A. We observed spectral regions centered on HQ and He I 66788 A lines.
Bias,, flat fields and wavelength calibration exposures (Th-Ar comparison lamp) were ob-tainedd regularly each night. Observations were reduced with IRAF1 using standard techniques forr CCD data. Reference regions were carefully selected for satisfactory determination of the pseudo-continuumm over about 0 A around the lines. A cubic spline function was fitted too these selected regions to determine the continuum level. All spectra were corrected for heliocentricc velocity. The mean S/N was 560.
Wee also used individual subexposures of echelle spectra obtained in 2000 at Pic du Midi Observatoryy with the 2m telescope Bernard Lyot (TBL) (see Section 4.2.2) taken in various polarimeterr configurations. During the spectropolarimetric observations, the original beam of lightt is divided into 2 beams allowing the observer to get simultaneous spectroscopic informa-tionn from each subexposure. 35 spectra were obtained during this run and yielded additional informationss on the rapid variability of 66 Oph previously detected at OHP. Data were re-ducedd using ESpRIT (Donati et al. 1997) as the polarimetric data, except for the continuum determinationn which was done using IRAF. Unfortunately the He I 6678 line was not ob-served,, so we considered other strong He I lines such as 4713, 4921 and 5876 and the Ha emissionn line. The mean S/N ratio was 260.
Wee also had additional observations collected in June-July 2001 at LNA Observatory (R=60000,, Ha and He I 6678 A lines), in April 2001 at ESO with FEROS spectrograph (R=48000,, AA 3520-8900 A) and at TBL in August 2001 with the MUSICOS spectrograph (RR = 35000, AA 5400-8700 A). A summary of our gathered database is given in Table 4.2.1.
Parameterss currently used to describe spectroscopic lines of Be stars (equivalent width EW,, radial velocity of the centroid RV, peak intensity of V and R emissions I(V) and I(R) respectively,, and their ratio V/R) have been measured for the individual He I lines in view of aa search for rapid variability. In 1997 and 1998 EW and RV have been measured only in the absorptionn part of the He I 6678 line in view of the presence of emission on the outer parts.
4.2.22 Spectropolarimetric observations
Observationss were carried out in June 200O with the MUSICOS spectropolarimeter at TBL. Thee instrument consists of a fiber-fed cross dispersed echelle spectrograph with a dedicated polarimeterr (Donati et al. 1999) mounted at the Cassegrain focus. Stellar light is collected in aa 2 arcsec entrance over a spectral range from 4500 to 6600 A and with a resolution R=35000. Thee log of these observations is reported in Table 4.2.1.
11 IRAF is distributed by the National Optical Astronomy Observatories, which is operated by the Association off Universities for Research in Astronomy (AURA), Inc., under cooperative agreement with the National Science Foundation. .
86 6
Variabilityy and pulsations in 66 Oph
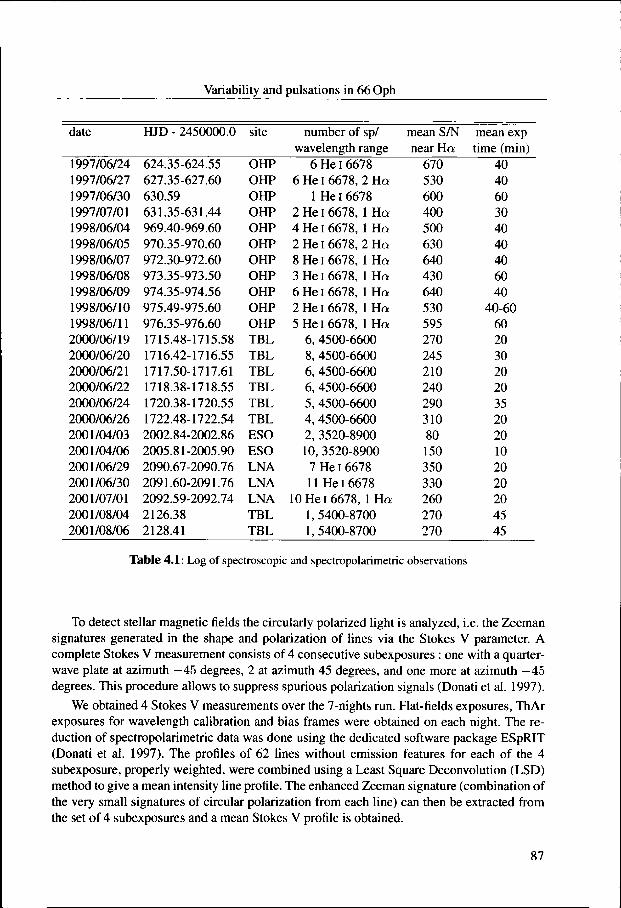
datee HJD - 2450000.0 site number of sp/ mean S/N mean exp wavelengthh range near Ha time (min)
1997/06/24 4 1997/06/27 7 1997/06/30 0 1997/07/01 1 1998/06/04 4 1998/06/05 5 1998/06/07 7 1998/06/08 8 1998/06/09 9 1998/06/10 0 1998/06/11 1 2000/06/19 9 2000/06/20 0 2000/06/21 1 2000/06/22 2 2000/06/24 4 2000/06/26 6 2001/04/03 3 2001/04/06 6 2001/06/29 9 2001/06/30 0 2001/07/01 1 2001/08/04 4 2001/08/06 6
624.35-624.55 5 627.35-627.60 0 630.59 9 631.35-631.44 4 969.40-969.60 0 970.35-970.60 0 972.30-972.60 0 973.35-973.50 0 974.35-974.56 6 975.49-975.60 0 976.35-976.60 0 1715.48-1715.58 8 1716.42-1716.55 5 1717.50-1717.61 1 1718.38-1718.55 5 1720.38-1720.55 5 1722.48-1722.54 4 2002.84-2002.86 6 2005.81-2005.90 0 2090.67-2090.76 6 2091.60-2091.76 6 2092.59-2092.74 4 2126.38 8 2128.41 1
OHP P OHP P OHP P OHP P OHP P OHP P OHP P OHP P OHP P OHP P OHP P TBL L TBL L TBL L TBL L TBL L TBL L ESO O ESO O LNA A LNA A LNA A TBL L TBL L
66 He I 6678 66 He I 6678, 2 Ha
11 He I 6678 22 He I 6678, 1 Ha 44 He I 6678, 1 Ha 22 He I 6678, 2 Ha 88 He I 6678, 1 Ha 33 He I 6678, 1 Ha 66 He I 6678, 1 Ha 22 He I 6678, 1 Ha 55 He I 6678, 1 Ha
6,, 4500-6600 8,, 4500-6600 6,, 4500-6600 6,, 4500-6600 5,, 4500-6600 4,4500-6600 0 2,, 3520-8900 10,, 3520-8900 77 He I 6678 111 He I 6678
100 He I 6678, 1 Ha 1,5400-8700 0 1,5400-8700 0
670 0 530 0 600 0 400 0 500 0 630 0 640 0 430 0 640 0 530 0 595 5 270 0 245 5 210 0 240 0 290 0 310 0 80 0 150 0 350 0 330 0 260 0 270 0 270 0
40 0 40 0 60 0 30 0 40 0 40 0 40 0 60 0 40 0
40-60 0 60 0 20 0 30 0 20 0 20 0 35 5 20 0 20 0 10 0 20 0 20 0 20 0 45 5 45 5
Tablee 4.1: Log of spectroscopic and spectropolari metric observations
Too detect stellar magnetic fields the circularly polarized light is analyzed, i.e. the Zeeman signaturess generated in the shape and polarization of lines via the Stokes V parameter. A completee Stokes V measurement consists of 4 consecutive subexposures : one with a quarter-wavee plate at azimuth -45 degrees, 2 at azimuth 45 degrees, and one more at azimuth -45 degrees.. This procedure allows to suppress spurious polarization signals (Donati et al. 1997).
Wee obtained 4 Stokes V measurements over the 7-nights run. Flat-fields exposures, ThAr exposuress for wavelength calibration and bias frames were obtained on each night. The re-ductionn of spectropolarimetric data was done using the dedicated software package ESpRIT (Donatii et al. 1997). The profiles of 62 lines without emission features for each of the 4 subexposure,, properly weighted, were combined using a Least Square Deconvolution (LSD) methodd to give a mean intensity line profile. The enhanced Zeeman signature (combination of thee very small signatures of circular polarization from each line) can then be extracted from thee set of 4 subexposures and a mean Stokes V profile is obtained.
87 7
Chapterr 4
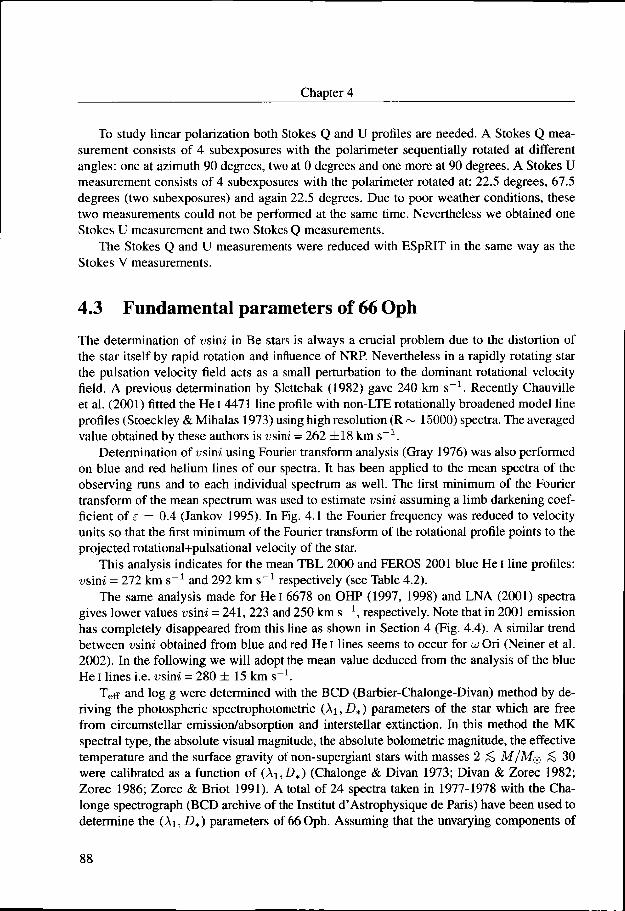
Too study linear polarization both Stokes Q and U profiles are needed. A Stokes Q mea-surementt consists of 4 subexposures with the polarimeter sequentially rotated at different angles:: one at azimuth 90 degrees, two at 0 degrees and one more at 90 degrees. A Stokes U measurementt consists of 4 subexposures with the polarimeter rotated at: 22.5 degrees, 67.5 degreess (two subexposures) and again 22.5 degrees. Due to poor weather conditions, these twoo measurements could not be performed at the same time. Nevertheless we obtained one Stokess U measurement and two Stokes Q measurements.
Thee Stokes Q and U measurements were reduced with ESpRIT in the same way as the Stokess V measurements.
4.33 Fundamental parameters of 66 Oph
Thee determination of vsini in Be stars is always a crucial problem due to the distortion of thee star itself by rapid rotation and influence of NRP. Nevertheless in a rapidly rotating star thee pulsation velocity field acts as a small perturbation to the dominant rotational velocity field.field. A previous determination by Slettebak (1982) gave 240 km s_ 1. Recently Chauville ett al. (2001) fitted the He I 4471 line profile with non-LTE rotationally broadened model line profiless (Stoeckley & Mihalas 1973) using high resolution (R ~ 15000) spectra. The averaged valuee obtained by these authors is vsini = 262 8 km s_ 1.
Determinationn of vsini using Fourier transform analysis (Gray 1976) was also performed onn blue and red helium lines of our spectra. It has been applied to the mean spectra of the observingg runs and to each individual spectrum as well. The first minimum of the Fourier transformm of the mean spectrum was used to estimate vsini assuming a limb darkening coef-ficientficient of e = 0.4 (Jankov 1995). In Fig. 4.1 the Fourier frequency was reduced to velocity unitss so that the first minimum of the Fourier transform of the rotational profile points to the projectedd rotational+pulsational velocity of the star.
Thiss analysis indicates for the mean TBL 2000 and FEROS 2001 blue He I line profiles: vsinivsini = 272 km s_1 and 292 km s^1 respectively (see Table 4.2).
Thee same analysis made for He I 6678 on OHP (1997, 1998) and LNA (2001) spectra givess lower values vsini = 241, 223 and 250 km s_ 1, respectively. Note that in 2001 emission hass completely disappeared from this line as shown in Section 4 (Fig. 4.4). A similar trend betweenn vsini obtained from blue and red He I lines seems to occur for u Ori (Neiner et al. 2002).. In the following we wil l adopt the mean value deduced from the analysis of the blue Hee I lines i.e. vsini = 280 15 kmm s_1.
Tefff and log g were determined with the BCD (Barbier-Chalonge-Divan) method by de-rivingg the photospheric spectrophotometric (Ai, D*) parameters of the star which are free fromm circumstellar emission/absorption and interstellar extinction. In this method the MK spectrall type, the absolute visual magnitude, the absolute bolometric magnitude, the effective temperaturee and the surface gravity of non-supergiant stars with masses 2 <, M/MQ & 30 weree calibrated as a function of (Ai,D* ) (Chalonge & Divan 1973; Divan & Zorec 1982; Zorecc 1986; Zorec & Briot 1991). A total of 24 spectra taken in 1977-1978 with the Cha-longee spectrograph (BCD archive of the Institut d'Astrophysique de Paris) have been used to determinee the (Ai, £>*) parameters of 66Oph. Assuming that the unvarying components of
88 8

Variabilityy and pulsations in 66 Oph
WAVELENGTH H
4911 491.5 492 492.5 493
REDUCEDD FOURIER FREQUENCY [ k m / s ]
CD D
3400 320 300 280 260 240 220 200 180 160 140 120 100
Figur ee 4.1: Mean spectrum for the He 14921 line (TBL, 2000) (top) and its Fourier transform (bottom).
thesee parameters are from the stellar photosphere, the resulting fundamental parameters and theirr uncertainties are given in Table 4.3.
Thesee parameters represent only the average photosphere of the observed hemisphere of thiss rapidly rotating star. Thus, they do not relate in a simple way either to the actual stellar
89 9
Chapterr 4
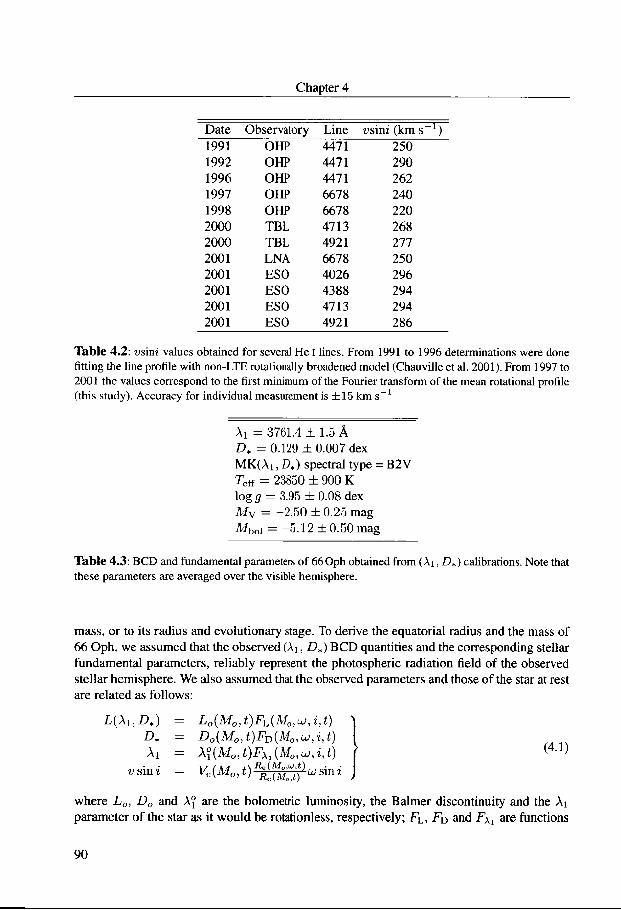
Datee Observatory Line vsini (km s 1) 1991 1 1992 2 1996 6 1997 7 1998 8 2000 0 2000 0 2001 1 2001 1 2001 1 2001 1 2001 1
OHP P OHP P OHP P OHP P OHP P TBL L TBL L LNA A ESO O ESO O ESO O ESO O
4471 1 4471 1 4471 1 6678 8 6678 8 4713 3 4921 1 6678 8 4026 6 4388 8 4713 3 4921 1
250 0 290 0 262 2 240 0 220 0 268 8 277 7 250 0 296 6 294 4 294 4 286 6
Tablee 4.2: vsini values obtained for several He I lines. From 1991 to 1996 determinations were done fittingfitting the line profile with non-LTE rotationally broadened model (Chauville et al. 2001). From 1997 to 20011 the values correspond to the first minimum of the Fourier transform of the mean rotational profile (thiss study). Accuracy for individual measurement is 5 km s_1
Aii =3761.4 5 A D*D* = 0.129 0.007 dex MK(Ai ,, £>*) spectral type = B2V refff = 23850 900 K logg 5 = 3.95 8 dex M vv = -2.50 0.25 mag M boll = -5.12 0 mag
Tablee 4.3: BCD and fundamental parameters of 66 Oph obtained from (Ai, D») calibrations. Note that thesee parameters are averaged over the visible hemisphere.
mass,, or to its radius and evolutionary stage. To derive the equatorial radius and the mass of 666 Oph, we assumed that the observed (Ai, D*) BCD quantities and the corresponding stellar fundamentall parameters, reliably represent the photospheric radiation field of the observed stellarr hemisphere. We also assumed that the observed parameters and those of the star at rest aree related as follows:
L(A i ,D 00 = Lo{Mo,t)Fh(M0,u>,i,t) D*D* = D0{M0,t)FD{MOJuj,i,t) Aii = A?(M0,£)FAl (M 0,u;,z,t)
cc{M{M 00,t),t) £^'j^u)8m
wheree LQy D0 and A£ are the bolometric luminosity, the Balmer discontinuity and the Ai parameterr of the star as it would be rotationless, respectively; FL, FO and F\x are functions
(4.1) )
90 0

Variabilityy and pulsations in 66 Oph
uu = 0.82 0.08 ii = 43° 8 RRee{uj)/R{uj)/RQQ = 6.3 5 MO/MQMO/MQ = 12.0 1.0
l ogL o /L 00 =4 .0 4 tt = (9.24 0.82) x 107 yr
Tablee 4.4: Stellar parameters of 66 Oph derived by taking its rotation into account its. The error bars doo not include incertainties of the stellar evolution tracks.
off the stellar rest mass M0, the angular velocity ratio u = Q/ttc (Qc is the critical angular velocity),, the inclination i of the rotational axis and of the stellar age t, Vc is the critical linear equatoriall velocity, Rc is the critical equatorial radius and Re the equatorial radius at the rotationall rate u> (Zorec et al. (2002), see also Section 2 in Floquet et al. (2000)). Relations (1)) are solved using the evolutionary tracks of Schaller et al. (1992) for Z = 0.02. Using vsini == 280 5 km s- 1 and the data given in Table 4.3, relations (1) produced the results displayed inn Table 4.4. The adopted v&ini and the obtained stellar radius Re(M0, u) imply a rotational frequencyy frot = 1.29 0.26 c d_1.
Fromm the visual absolute magnitude My(X1, D*) given in Table 4.3, the apparent visual magnitudemagnitude Vobs = 4.85, which corresponds both to the lower value observed in 1999 and to thee epoch around 1955 where the star is in a B phase (see Hubert-Delplace & Hubert 1979), thee interstellar colour excess E(B-V) = , derived from the 2200-ISM absorption bumpp (Beeckmans & Hubert-Delplace 1980; Zorec & Briot 1985) and using the surrounding starss of 66 Oph in a circle smaller than 1°, we obtain d(Xi ,£>*) = 224 30 pc. Note that this distancee agrees fairly well with dmPP = 2071 9̂ pc obtained from the parallax measured by thee Hipparcos satellite.
4.44 Long term variabilit y history
666 Oph is a Be star that shows a rather conspicuous variability from UV through IR wave-lengths. .
Cousinss (1952) observed irregular brightness variations with amplitudes ^ 0 .2 mag whichh are rather typical of Be stars. Page & Page (1970) reported two sudden, strong (1-2 mag)) and very rapid (2-3 mn) "flare-like" optical brightening in 1969 recorded on photo-graphicc plates.
Pavlovskii et al. (1997 and references therein) report variations in the V band up to 0.07 magg without clear periodicity in May-July 1982. Cuypers et al. (1989) detected some flicker-ingg at 0.01 mag level but did not find short-term light variations. Percy et al. (1997); Percy & Bakoss (2001) observed an overall slow fading in V and B (~0.10 mag) from 1982 to 1999. Att the same time, a state of great activity was observed. In particular from 1987 through 19933 exceptional recurrent "outbursts" up to 0.25 mag were seen from ground-based and
91 1

Chapterr 4
1984 4 1994 4 2004 4
42000 0 47000 0
hjdd - 2400000.0
52000 0
Figuree 4.2: Correlation between the long-term variation of V band magnitude and the Ha intensity. Upperr panel: filled circles for Percy et al (2001), open triangles for Hipparcos data and open squares for Adelmann (1992) data. Lower panel: values of Imax taken from Andrillat & Fehrenbach (1982); Banerjee ett al. (2000); Buil (2001); Fontaine et al. (1982); Lacy (1977); Hanuschik et al. (1995); Hummel & Vranckenn (1995); Peters (1987, 1988c,a,b, 1989a,b, 1990, 1991b,c, 1992, 1994); Slettebak & Reynolds (1978)) and this paper.
Hipparcoss photometry (see Fig. 4.2, upper panel) with a period of about one year between 2 consecutivee outbursts (Percy & Attard 1992; Percy & Bakos 2001; Hubert & Floquet 1998). Theyy seem to show a rapid rise and a £ 100 day fading time scale (see also Adelman 1992). Thee outbursts appear to be correlated with the UV wind behaviour (see below).
Thee star has shown large Balmer line emission changes since the early fifties (Hubert-Delplacee & Hubert 1979). A minimun in Ha emission strength was observed around 1955 followedd by the appearance of weak shell absorption at H7 and R5 in 1959. Ha emission EW changedd steadily from 23 A in 1975 (Lacy 1977) to ~ -60 A in 1993 (Hanuschik et al. 1995).. Emission level entered then a period of strong variability until 1995 during which its intensityy oscillated around a high level (I/Ic ~ 9.2) (see Fig. 4.2). Since then it has entered aa declining phase, EW reaching -40.6, -35.1, -30.6, -24.5 A in 1997, 1998, 2000 and 2001,, respectively (this paper, Table 4.4.1). Ha showed V/R ~ 1 at least from 1976 through 1988.. A sudden onset of V/R variability occurred probably in late 1988 and a variability cyclee of ~ 5 years was observed from 1989 to 1995 (Hanuschik et al. 1995, and references therein).. During that period the star showed steeple line profiles in Fe II with inversion of V/R
92 2

Variabilityy and pulsations in 66 Oph
1992 2 1994 4
47000 0 48000 0 hjdd - 2400000.0
49000 0
Figur ee 4.3: Correlation between the V band magnitude and the Ha intensity during the period of great activityy of the star. Symbols and references are the same as in Fig. 4.2.
asymmetryy quite typical of those predicted in the global one-armed disk oscillation model. Notee that the onset of V/R activity coincides with the epoch of great photometric activity and off the highest Balmer emission level. Hanuschik et al. (1995) propose that to trigger the disk oscillationn distortion a high level of emission is apparently required (see their Fig. 13).
IUEE observations obtained between 1982 to 1987 revealed the presence of a recurrent episodicc mass loss every year (Grady et al. 1987; Peters 1988c, 2000). The wind and Balmer-emissionn regions appear to be correlated, as changes in Ha EW lag behind wind activity byy ~ 2 months (Peters 2000). She then argued that mass loss episodes detected in the UV inn the 1980s seemed to be a precursor of the establishment of the massive Balmer-emitting diskk in 1988-91; nevertheless Rivinius et al. (2001) suggested that the relation between UV windd and star-to-disc mass transfer could be the result of an opacity effect. Moreover it has too be noted that unlike 7 Cas (see Section 4.1) no correlation seems to exist between the wind strengthh and the V/R phase in 66 Oph. On the other hand, a striking correlation is found be-tweenn these mass loss episodes and brightness in 1980-1995: several optical brightenings up
93 3

Chapterr 4
too AV ~ 0.3 mag were observed by Percy et al. (1997) and with Hipparcos (see Figs. 4.2 andd 4.3 upper panels). These maxima are close to epochs of rapid wind variations. They also seemm to correspond to a temporary reduction in the intensity of Ha which afterwards recovers andd surpasses its preceding level (see Fig. 4.3). A similar correlation is found in HD 58050 (Hubert-Delplacee et al. 1982), /uCen (Rivinius et al. 1998), 28Cyg (Tubbesing et al. 2000) andd HD 76534 (Oudmaijer & Drew 1997). Thus, whatever physical mechanism causes the onsett of mass loss and the filling up of the equatorial disk in 66 Oph, it seems to produce beforehandbeforehand an optical brightening. In this context, it is important to mention the observation off two mass loss episodes of the Be star to Ori by Hayes & Guinan (1984) and Guinan & Hayess (1984). Simultaneous optical photometry (Ha line and the near continuum) and linear polarimetryy (B-band) showed in both cases the existence of a defined sequence of events: aa brightening/fading of the star is followed by an increasing/decreasing of the polarization levell then followed by an increasing/decreasing of the Ha emission. They propose that the morphologyy and time lags of light level, polarization and Ha line emission arise from accel-eration/decelerationn of the ejected matter in its crossing through the circumstellar envelope. Puttingg together all the above information it seems quite tempting to suggest that the insta-bilitiess leading to mass loss in 66 Oph produce typically an optical brightening followed by a windd activation and polarimetric level increase and finally an emission line strengthening.
4.4.11 Long-term variation of Ha and He I 6678 lines
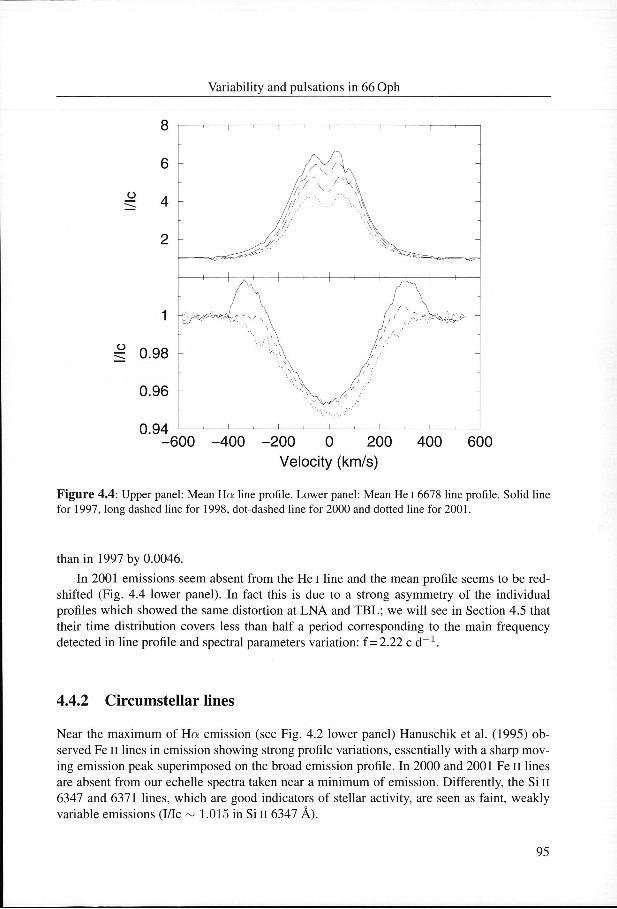
Thee Ha (1997, 1998, 2000 and 2001) and He I 6678 mean profiles (1997, 1998 and 2001) are shownn in Fig. 4.4 in upper and lower panel, respectively.
Haa is seen in strong emission with two well separated peaks. Emission intensity de-creasedd from 1997 to 2001 following the waning tendency observed since 1995 (Fig. 4.2 lowerr panel). Average Ha EW, I(V), I(R) and V/R values are presented in Table 4.4.1. In 2000,, the number of Ha profiles is large enough to notice a regular fading of the V/R ratio off Ha from 1 to 0.956 over the run. This fading is due to a decrease in the V intensity, the RR component being stable at that time. No large-scale V/R variation has been detected from 19977 to 2001 while the Ha emission is going to a minimum of intensity (see Fig. 4.2 lower panel). .
Inn 1997 and 1998 the He I 6678 line presents a quite variable profile, especially in its V andd R emission components. As for Ha, the emission intensity decreases from 1997 to 1998 (seee Fig. 4.4 lower panel) especially the V component. V/R values are globally fainter in 1998
date e Junee 1997 Junee 1998 Junee 2000 Aprill 2001 Junee 2001
EW(A) ) -40.6 6 -35.1 1 -30.6 6 -24.3 3 -22.4 4
KV) ) 6.66 6 5.94 4 5.25 5 4.36 6 4.35 5
KR) ) 6.54 4 6.09 9 5.34 4 4.39 9 4.33 3
V/R R 1.018 8 0.975 5 0.983 3 0.991 1 1.005 5
Tablee 4.5: Spectral parameters of the Ha line in 66 Oph
94 4
Variabilityy and pulsations in 66 Oph
0.944 ' ' ' ' ' ' ' ' ' ' ' ' -6000 -400 -200 0 200 400 600
Velocityy (km/s)
Figuree 4.4: Upper panel: Mean Ha line profile. Lower panel: Mean He I 6678 line profile. Solid line forr 1997, long dashed line for 1998, dot-dashed line for 2000 and dotted line for 2001.
thann in 1997 by 0.0046.
Inn 2001 emissions seem absent from the He I line and the mean profile seems to be red-shiftedd (Fig. 4.4 lower panel). In fact this is due to a strong asymmetry of the individual profiless which showed the same distortion at LNA and TBL; we will see in Section 4.5 that theirr time distribution covers less than half a period corresponding to the main frequency detectedd in line profile and spectral parameters variation: f =2.22 c d- 1 .
4.4.22 Circumstellar lines
Nearr the maximum of Ha emission (see Fig. 4.2 lower panel) Hanuschik et al. (1995) ob-servedd Fe II lines in emission showing strong profile variations, essentially with a sharp mov-ingg emission peak superimposed on the broad emission profile. In 2000 and 2001 Fe n lines aree absent from our echelle spectra taken near a minimum of emission. Differently, the Si n 63477 and 6371 lines, which are good indicators of stellar activity, are seen as faint, weakly variablee emissions (I/Ic ~ 1.015 in Si n 6347 A).
95 5

Chapterr 4
4.55 Time series analysis of He I lines Frequencyy analysis of line profile variations (LPV) of He I lines present in the three principal dataa sets (OHP 1998, TBL 2000 and LNA 2001) was performed on each resolution bin of line profilee time series. In 1997 the number of spectra (14 spectra over 7 nights) was too scarce to allowallow frequencies analysis.
Periodicitiess were also searched in the line parameters EW, V, R and V/R time series for bothh 1997 and 1998 data, and RV for all 1997, 1998, 2000 and 2001 data.
Fourierr analysis + CLEAN algorithm (as in Gies & Kullavanijaya 1988) and Least-Squaress sinusoidal fitting with the AIC criterion (Kambe et al. 1993) were used in the time seriess analysis. In both methods, weighting by the signal to noise ratio was introduced in the calculationn of averaged data.
Thee Fourier Doppler Imaging (hereafter FDI) method developed by Kennelly et al. (1992) wass also applied to the time series obtained in 1998 and 2000 in the same way as in Janot-Pachecoo et al. (1999). The method works in the general case, when sectoral and/or tesseral modess are present, and the obtained normalized wavelength frequency more closely repre-sentss the nonradial degree I rather than the azimuthal order m (Kennelly et al. 1996). The applicationn of this technique to the 1998 and 2000 data gives similar results as the two first methods. .
Thee frequency resolution was ~ 0.14 c d"1 for the OHP 1997 and 1998 data, ~ 0.17 cc d-1 for the TBL 2000 data and ~ 0.34 c d"1 for the LNA 2001 data.
4.5.11 Line profil e variations
4.5.1.11 He I 6678 line
Firstly,, we analyzed 32 spectra taken in 1998 at OHP over 7 nights. Two main frequencies aree detected (by order of decreasing power): 4.05 and 2.22 c d_1. Results are given in Table 4.66 and the summed power across this line profile is shown in Fig. 4.5.
Thee power and phase distribution (A<£> being the slope of the phase diagram over the wholee profile) of both frequencies across the line profiles are displayed in Figs. 4.6 (upper figure:figure: f = 2.22 c d_1, A $ ~ 2.5TT and lower figure: f= 4.05 c d"1, A $ ~ 3.57r). Note that thee power is higher in the extreme blue and red sides of the He I 6678 line which shows V andd R emission components in 1998. Time evolution of residuals folded modulo f=4.05 and 2.222 c d_1 is displayed in Figs. 4.7 and 4.8 upper panel, respectively.
profiless EW RV I(V ) I(R) V/R 4.055 4.45 2.21 2.17 2.21 2.19 2.222 4.10 4.36 4.36 0.89 9
Tablee 4.6: Short-term variability in the He 16678 line of 66 Oph. Main frequencies (in c d_1) obtained byy the Least Squares method are listed by order of decreasing power. Only line profiles obtained in 19988 have been considered but other quantities include 1997 and 1998 data.
96 6

Variabilit yy and pulsations in 66 Oph
400 0
300 0
200 0
100 0
--
--
" "
I I l\l\i\l\l\i\ I.
--
A A
II A 22 4
Frequenciess (c/d)
Figur ee 4.5: Power summed across the line profile obtained with the Least Squares method for He I 66788 in 1998.
in n o o
I I
CD D
o o
Q. .
0.94 4 -500-300-1000 100 300 500
Velocityy (km/s)
0.94 4 -500-300-1000 100 300 500
Velocityy (km/s)
Figur ee 4.6: Line profile variations of He I 6678 in 1998 corresponding to the two detected frequencies 2.222 c d_1 (left figure) and 4.05 c d_1 (right figure). In each figure power distribution is shown in the upperr panel, phase distribution in the middle panel and mean line profile in the lower panel. The vertical liness symbols are: dotted-dashed line for the stellar radial velocity, solid line for the i extension andd dashed lines for the extreme limits of power extension of the two frequencies.
97 7
Chapterr 4
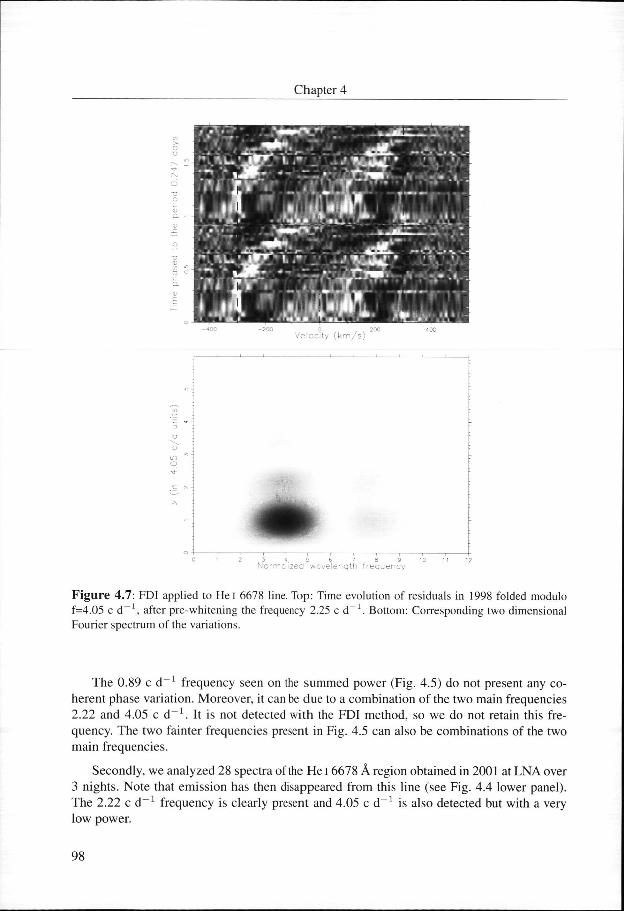
Figur ee 4.7: FDI applied to He I 6678 line. Top: Time evolution of residuals in 1998 folded modulo f=4.055 c d- 1, after pre-whitening the frequency 2.25 c d_1. Bottom: Corresponding two dimensional Fourierr spectrum of the variations.
Thee 0.89 c d frequency seen on the summed power (Fig. 4.5) do not present any co-herentt phase variation. Moreover, it can be due to a combination of the two main frequencies 2.222 and 4.05 c d 1. It is not detected with the FDI method, so we do not retain this fre-quency.. The two fainter frequencies present in Fig. 4.5 can also be combinations of the two mainn frequencies.
Secondly,, we analyzed 28 spectra of the He I 6678 A region obtained in 2001 at LNA over 33 nights. Note that emission has then disappeared from this line (see Fig. 4.4 lower panel). Thee 2.22 c d_1 frequency is clearly present and 4.05 c d_1 is also detected but with a very loww power.
98 8
Variabilityy and pulsations in 66 Oph
- 4 0 00 - 2 0 0 0 200 400
Velocityy (km/s)
vi vi
TJTJ :
CMM ^ "
CNN :
00 1 2 3 4 , 5 6 7 8 9 10 1 1 12
Normalizedd wavelenqth f requency
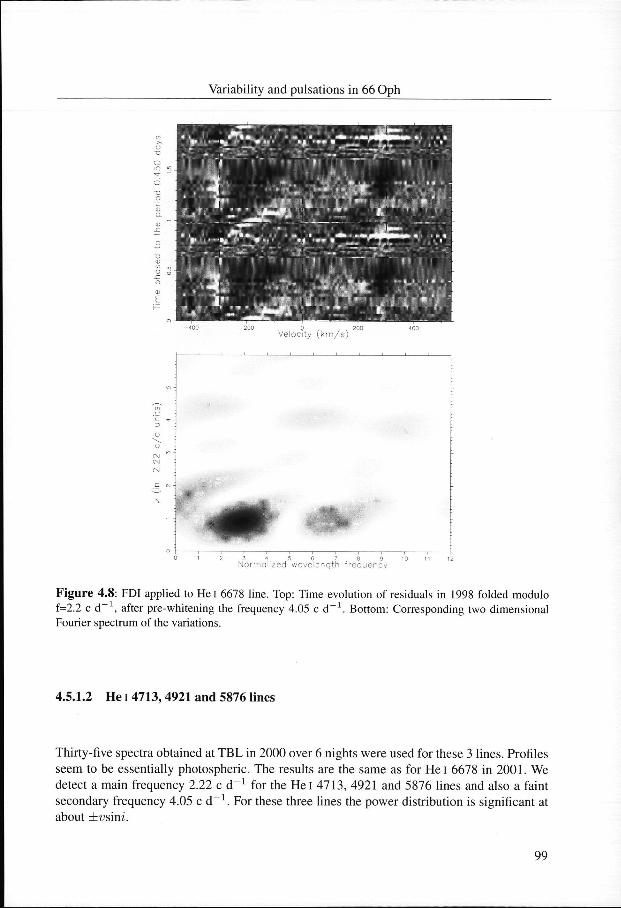
Figur ee 4.8: FDI applied to Hei 6678 line. Top: Time evolution of residuals in 1998 folded modulo f=2.22 c d "1 , after pre-whitening the frequency 4.05 c d_1. Bottom: Corresponding two dimensional Fourierr spectrum of the variations.
4.5.1.22 He I 4713,4921 and 5876 lines
Thirty-fivee spectra obtained at TBL in 2000 over 6 nights were used for these 3 lines. Profiles seemm to be essentially photospheric. The results are the same as for He I 6678 in 2001. We detectt a main frequency 2.22 c d"1 for the He I 4713, 4921 and 5876 lines and also a faint secondaryy frequency 4.05 cd"1. For these three lines the power distribution is significant at aboutt .
99 9
Chapterr 4
1.01 1
>> 0.99 - °
oo o „bb O .
oo o
0.988 - — ^ —' — 00 0.5 1 1.5 2
Phasee (freq=2.2c/d)
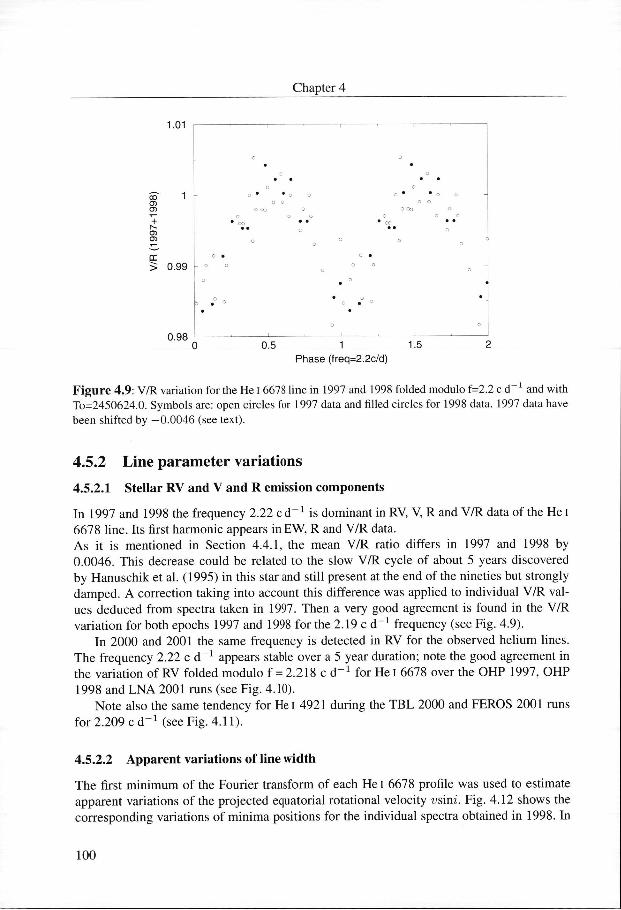
Figuree 4.9: V/R variation for the He I 6678 line in 1997 and 1998 folded modulo £=2.2 c d~' and with To=2450624.0.. Symbols are: open circles for 1997 data and filled circles for 1998 data. 1997 data have beenn shifted by -0.0046 (see text).
4.5.22 Line parameter variations
4.5.2.11 Stellar RV and V and R emission components
Inn 1997 and 1998 the frequency 2.22 cd_ 1 is dominant in RV, V, R and V/R data of the He I 66788 line. Its first harmonic appears in EW, R and V/R data. Ass it is mentioned in Section 4.4.1, the mean V/R ratio differs in 1997 and 1998 by 0.0046.. This decrease could be related to the slow V/R cycle of about 5 years discovered byy Hanuschik et al. (1995) in this star and still present at the end of the nineties but strongly damped.. A correction taking into account this difference was applied to individual V/R val-uess deduced from spectra taken in 1997. Then a very good agreement is found in the V/R variationn for both epochs 1997 and 1998 for the 2.19 c d '1 frequency (see Fig. 4.9).
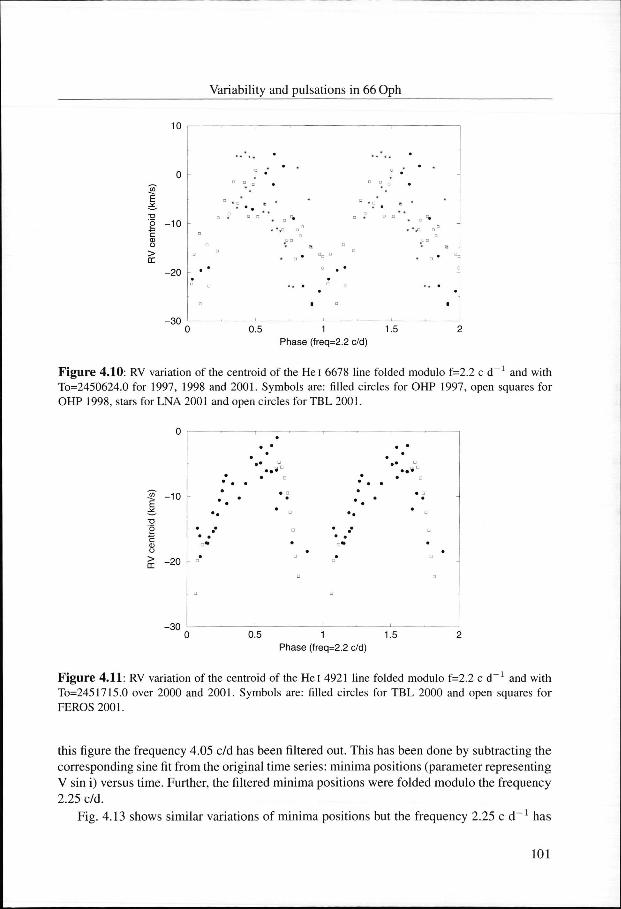
Inn 2000 and 2001 the same frequency is detected in RV for the observed helium lines. Thee frequency 2.22 c d_1 appears stable over a 5 year duration; note the good agreement in thee variation of RV folded modulo f = 2.218 c d^1 for He I 6678 over the OHP 1997, OHP 19988 and LNA 2001 runs (see Fig. 4.10).
Notee also the same tendency for He I 4921 during the TBL 2000 and FEROS 2001 runs forr 2.209 c d"1 (see Fig. 4.11).
4.5.2.22 Apparent variations of line width
Thee first minimum of the Fourier transform of each He I 6678 profile was used to estimate apparentt variations of the projected equatorial rotational velocity vsini. Fig. 4.12 shows the correspondingg variations of minima positions for the individual spectra obtained in 1998. In
100 0
Variabilityy and pulsations in 66 Oph
> >
0 0
- 10 0
- 20 0
--
D D
. B B
**
--
° °
--
D D # #
BB *
0 *
** a
0.55 1 Phasee (freq=2.2 c/d)
1.5 5
Figuree 4.10: RV variation of the centroid of the He I 6678 line folded modulo f=2.2 c d_1 and with To=2450624.00 for 1997, 1998 and 2001. Symbols are: filled circles for OHP 1997, open squares for OHPP 1998, stars for LNA 2001 and open circles for TBL 2001.
U) )
t--^ ^ "O O
o o
o o > > a: a:
-10 0
-20 0 n n
.
1 1
* *
. .8
•• a
:J J
r. r.
1 1
## / ii *
:: :
1 1
D D
* *
a a
0.5 5 1.5 5 Phasee (freq=2.2 c/d)
Figuree 4.11: RV variation of the centroid of the He I 4921 line folded modulo f=2.2 c d_1 and with To=2451715.00 over 2000 and 2001. Symbols are: filled circles for TBL 2000 and open squares for FEROS2001. .
thiss figure the frequency 4.05 c/d has been filtered out. This has been done by subtracting the correspondingg sine fit from the original time series: minima positions (parameter representing VV sin i) versus time. Further, the filtered minima positions were folded modulo the frequency 2.255 c/d.
Fig.. 4.13 shows similar variations of minima positions but the frequency 2.25 c d^1 has
101 1

Chapterr 4
P-aseP-ase (freq = 2.25 c / d )
Figur ee 4.12: First minima of the Fourier transform of each He I 6678 line profiles in 1998 folded moduloo f = 2.25 c d_1 and with T0=2450969.0. The frequency f = 4.05 c d_1 has been filtered out.
Phasee (freq = 4.05 c / d )
Figur ee 4.13: First minima of the Fourier transform of each He I 6678 line profiles in 1998 folded moduloo f = 4.05 c d- 1 and with T(,=2450969.0. The frequency f = 2.22 c d_1 has been filtered out.
beenn filtered out and the minima positions were folded modulo the frequency 4.05 c d "1 . Thesee apparent variations can result from an horizontal velocity field and/or temperature oscillations. .
102 2

Variabilityy and pulsations in 66 Oph
4.66 Polarimetry
4.6.11 Circular polarization
Thee profiles of 62 relatively faint and purely photospheric lines selected with a table appro-priatedd for a B2 star were combined by means of a least square deconvolution (LSD) method (Donatii et al. 1997). The quarter-wave plate introduces fringes in the Stokes V profiles, which couldd not be removed. Moreover, the quality of the data is very poor and only 4 measurements weree obtained. Therefore, the longitudinal magnetic field of 66 Oph could not be determined. However,, looking at the Stokes V profiles (Fig. 4.14), one cannot exclude the presence of a weakk Zeeman signature. Measurements of better quality are needed to clearly establish the presencee (or absence) of a magnetic field in this star.
0.0005 5
-6000 -400 -200 0 200 Velocityy (km/s)
400 0 600 0
Figuree 4.14: Example of circularly polarized (Stokes V, upper panel) and unpolarized (lower panel) meann stellar profile of 66 Oph. The null profile is shown in the middle panel.
103 3

Chapterr 4
4.6.22 Linear polarization
Twoo Stokes Q and U measurements obtained at the same rotational phase were used to study thee stellar linear polarization. Because the instrumental accuracy in continuum polarization iss about 1 % and the expected stellar continuum polarization is of the same order, the results obtainedd in the continuum cannot be trusted (see Donati et al. 1999). However, polarization acrosss emission lines can be studied with respect to the surrounding continuum. On the other hand,, the instrumental cross-talk between Stokes Q and U can be up to 7 %, leading to a wrongg determination of the position angle (see Wade et al. 2000). Therefore only the relative changess in angle should be considered. Although the absolute polarization level and angle cannott be established, depolarization across Ha line profile is similar to that measured in 666 Oph by Poeckert (1975). The decrease in polarization in the emission line can be explained byy electron scattering of radiation which is higher for the stellar continuum than for photons emittedd by the envelope.
_*: : _o o CO O
0.003 3
0.002 2
0.001 1
-0.001 1
-0.002 2
-0.003 3
Bluee peak
Continuumm points
Limitss of Halpha
Center r
Redd Peaks
-0.00255 0 0.0025 0.005 Stokess Q
0.0075 5 0.01 1
Figuree 4.15: Polarization across the H« line of 66 Oph in the Q-U plane. Q and U are given in percent. Thee arrows indicate the increasing wavelength across the line profile. Center, V and R emission peaks aree indicated as well as continuum points. The apparent duplicity of the red peak is due to a telluric absorptionn line.
104 4
Variabilityy and pulsations in 66 Oph
Changess in the QU plane (Fig. 4.15) deviate from a straight line. This had already been observedd in 66 Oph (e.g. Hayes 1983) and in other Be stars (e.g. 7 Cas, Poeckert & Marlbor-oughh 1977). The sense of the loop formed by the variation of U and Q across the emission line profilee can be related with the sense of envelope rotation (Poeckert & Marlborough 1978b; McLeann 1979). It is to be noted that for 66 Oph the shape of the loop in the QU plane is inn good agreement with the modelled shape corresponding to i = 45° in fig. 5 of Poeckert && Marlborough (1978a), this i value being close to the one determined above (see Section 4.3).. Linear polarization effects have usually been attributed to a non-spherical envelope of Bee stars (Capps et al. 1973) but could also be partly due to the presence of a magnetic field.
4.77 Discussion
Inn spite of the scarce data for each observing run (1997, 1998, 2000 and 2001) we have been ablee to detect two frequencies from LPV and spectral parameters analysis of several blue and redd helium lines. Frequency 2.22 c d_1 is detected in all runs with roughly constant power. Frequencyy 4.05 c d "1 is strong in 1998 data (see Fig. 4.6, lower figure); in 2000 and 2001 itt is only detected on helium lines having the higher S/N ratio, and its power summed over thee line profile is of the same order as in 1998 (~ 7.10-6). This restricted detection results probablyy from a lower S/N ratio (~ 250), comparatively to 500-600 in 1998. This can also be duee in part to the fact that this frequency is probably associated with a NRP mode of higher degreee than the 2.22 c d- 1 frequency (see below), the amplitude of the resulting deformations acrosss the line profile being smaller and therefore more difficult to detect.
Thee presence of a multiperiodicity in 66 Oph is a strong argument in favour of NRP. Furthermoree these two independent frequencies are clearly distinct from the stellar rotational frequencyy determined in the present study. In terms of NRP and following Telting & Schri-jverss (1997, eq. 9), the phase variations indicate I — and / = 3 1 for 2.22 c d - 1 and 4.055 c d- 1, respectively. Similar I values are obtained in 2000 from LPV of the He 14921 line andd from the FDI method applied to the Hel 6678, 4713 and 4921 lines (see e.g. Fig. 4.7, lowerr panel).
Thee power distribution across the He 16678 line profile shows a similar behaviour for both 2.222 c d_1 and 4.05 c d_1 frequencies (see Fig. 4.6): maximum power occurs at the extreme linee wings which are disturbed by V and R variations. Nevertheless, the signal power peaks att about i l . lus im for 2.22 c d_1, and at 8 and 1.05vsim for 4.05 c d_1. The presence of LPVV variability outside the dbvsini range is observed in red He 1 lines contaminated by V and RR emission in other Be stars seen under a moderate inclination angle (fi Cen, Rivinius et al. (2001);; to Ori, Neiner et al. (2002)). In the case of fi Cen, note that a quadruple peak structure inn the power signal corresponding to period PI can be seen in both He 1 5876 and 6678 lines (Riviniuss et al. 2001, their Fig. 3): the signal power peaks at i as in blue He I lines andd also at i l . lus im. The origin of LPV variability outside the i range gives rise to distinctt interpretations, e.g. a rotationally accelerated region occuring at the photospheric levell during the emission phase as in A Eri (Kambe et al. 1993), or a geometrical effect of the ^-componentt of the NRP velocity in the case of low inclination stars such as \i Cen (Rivinius etal.. 2001).
105 5
Chapterr 4
Itt has to be stressed that present spectroscopic observations are too scarce to allow any correlationn analysis between oscillation state and activity.
4.88 Conclusion
666 Oph is a Be star which shows a high degree of variability in light and in Ha emission intensity.. The present study confirms the long-term slow weakening of circumstellar emission whichh started around 1990. From 1997 to 2001 we observed a strong decrease in Ha emission ass well as in V and R emission components of He I 6678 line which were present in 1997 and 19988 and absent in 2001. So a minimum level of emission is expected in the near future.
Fundamentall parameters of the star derived from BCD calibrations have been re-investigatedd and a rotational frequency was estimated (frot = 1.29 6 c d_ 1) . vsini derived fromm red helium lines seems to be lower than that derived from blue ones but this result needs too be confirmed by high S/N ratio echelle spectra observations.
AA concise review of the variability of 66 Oph is presented. Nicely complementary ground-basedd and Hipparcos photometric observations allow to confirm a one-year recurrent light outburstss between 1985 and 1995 similar to the time-scale in the wind variation between 19800 and 1987 reported by Peters (2000). Maxima of light outbursts are found to be anti-correlatedd with Ha emission as reported in other Be stars. The summary of informations gatheredd in previous studies seems to suggest the following sequence: optical brightening occurs,, UV wind activates, polarimetric level increases and optical line emission strengthens.
Timee series analysis of He I line data leads for the first time to the detection of multi-frequenciess in 66 Oph. The main frequencies present are: f = 2.22 c d_1 and f = 4.05 c d- 1 . Theyy are attributed to non-radial pulsation modes and their phase distribution over the line profilee indicate / = 2 1 and I — 3 1, respectively. More observations are needed to model thee LPV and to determine the nature and the characteristics of NRP modes involved.
Searchh for stellar magnetic field through the analysis of circularly polarized light has been attemptedd for the first time in 66 Oph. In spite of the poor quality of our spectropolarimetric data,, we cannot exclude the presence of a weak Zeeman signature.
Ourr observational material is inappropriate to investigate discrete and recurrent emission linee outbursts thought to be associated with beating of NRP modes as in fi Cen (Rivinius ett al. 1998). Nevertheless, taking into account the high degree of variability of 66 Oph, it can bee considered as a very good target to search for a correlation between oscillating state and episodicc mass loss events. Futhermore, more accurate determination of Zeeman signatures allowingg the detection of magnetic fields in the star would be available with the future exper-imentt such as the Echelle SpectroPolarimetric Device for the Observation of Stars at CFHT (ESPaDOnS). .
Acknowledgements.Acknowledgements. We thank the referee, Th. Rivinius, for his constructive comments.
106 6
Variabilityy and pulsations in 66 Oph
Bibliography y
Adelman,, S. J. 1992, PASP, 104, 392 Andrillat,, Y. & Fehrenbach, C. 1982, A&AS, 48, 93 Andrillat,, Y., Jaschek, M , & Jaschek, C. 1986, A&AS, 65, 1 Balona,, L. A. & Dziembowski, W. A. 1999, MNRAS, 309, 221 Balona,, L. A. & Kambe, E. 1999, MNRAS, 308, 1117 Banerjee,, D. P. K., Rawat, S. D., & Janardhan, P. 2000, A&AS, 147, 229 Barker,, P. K. & Marlborough, J. M. 1985, ApJ, 288, 329 Beeckmans,, F. & Hubert-Delplace, A. M. 1980, A&A , 86, 72 Buil,, C. 2001, Atlas of Be stars on the web http://www.astrosurf.com/buil/us/bestar.htm Capps,, R. W., Coyne, G. V., & Dyck, H. M. 1973, ApJ, 184, 173 Chalonge,, D. & Divan, L. 1973, A&A , 23, 69 Chauville,, J„ Zorec, J., Ballereau, D., et al. 2001, A&A , 378, 861 Cousins,, A. W. J. 1952, Monthly Notes of the Astronomical Society of South Africa, 11,9 Cuypers,, J., Balona, L. A., & Marang, F. 1989, A&AS, 81, 151 Divan,, L. & Zorec, J. 1982, in The Scientific Aspects of the Hipparcos Space Astrometric
Mission,, ESA-SP 177, 101 Doazan,, V., Bourdonneau, B., Rusconi, L., Sedmak, G., & Thomas, R. N. 1987, A&A , 182,
L25 5 Donati,, J.-F., Catala, C, Wade, G. A., et al. 1999, A&AS, 134, 149 Donati,, J.-F., Semel, M., Carter, B. D., Rees, D. E., & Collier Cameron, A. 1997, MNRAS,
291,658 8 Floquet,, M., Hubert, A. M., Hirata, R., et al. 2000, A&A , 362, 1020 Floquet,, M., Hubert, A. M., Hubert, H., et al. 1996, A&A , 310, 849 Fontaine,, G., Villeneuve, B., Landstreet, J. D., & Taylor, R. H. 1982, ApJS, 49, 259 Frost,, S. A. & Conti, P. S. 1976, in IAU Symp. 70: Be and Shell Stars, Vol. 70, 139 Gies,, D. R. 1991, in Rapid Variability of OB-Stars: Nature and Diagnostic Value, Proc. ESO
Workshopp No. 36, ed. D. Baade, 229 Gies,, D. R. 1994, in IAU Symp. 162: Pulsation; Rotation; and Mass Loss in Early-Type Stars,
Vol.. 162, 89 Gies,, D. R. & Kullavanijaya, A. 1988, ApJ, 326, 813 Grady,, C. A., Sonneborn, G., Wu, C, & Henrichs, H. F. 1987, ApJS, 65, 673 Gray,, D. F. 1976, The observation and analysis of stellar photospheres (New York, Wiley-
Interscience,, 484) Guinan,, E. F. & Hayes, D. P. 1984, ApJ, 287, L39 Hanuschik,, R. W., Hummel, W., Dietle, O., & Sutorius, E. 1995, A&A , 300, 163 Hayes,, D. P. 1983, Informational Bulletin on Variable Stars, 2350, 1 Hayes,, D. P. & Guinan, E. F. 1984, ApJ, 279, 721 Henrichs,, H. F. 1984, in Proceedings of 4th European IUE Conference, ESA SP-218, 43 Henrichs,, H. E, de Jong, J. A., Donati, J.-F, & et al. 2000, in ASP Conf. Ser. 214: The Be
Phenomenonn in Early-Type Stars, 324 Hubert,, A. M. & Floquet, M. 1998, A&A , 335, 565 Hubert,, A. M., Floquet, M., Hao, J. X., et al. 1997, A&A , 324, 929
107 7

Chapterr 4
Hubert-Delplace,, A. & Hubert, H. 1979, An atlas of Be stars (Paris-Meudon Observatory) Hubert-Delplace,, A. M., Hubert, H., Ballereau, D., & Chambon, M. T. 1982, in IAU Symp.
98:: Be Stars, Vol. 98, 195-198 Hummel,, W. & Vrancken, M. 1995, A&A , 302, 751 Jankov,, S. 1995, Publications de 1'Observatoire Astronomique de Beograd, 50, 75 Jankov,, S., Janot-Pacheco, E., & Leister, N. V. 2000, ApJ, 540, 535 Janot-Pacheco,, E., Jankov, S., Leister, N. V., Hubert, A. M., & Floquet, M. 1999, A&AS,
137,407 7 Kambe,, E., Ando, H., & Hirata, R. 1993, A&A , 273,435 Kennelly,, E. J., Walker, G. A. H., Catala, C, et al. 1996, A&A , 313, 571 Kennelly,, E. J., Walker, G. A. H., & Merryfield, W. J. 1992, ApJ, 400, L71 Lacy,, C. H. 1977, ApJ, 212, 132 Leister,, N. V., Janot-Pacheco, E., Leyton Z, J., & et al. 2000, in ASP Conf. Ser. 214: The Be
Phenomenonn in Early-Type Stars, 272 Marlborough,, J. M. 2000, in ASP Conf. Ser. 214: The Be Phenomenon in Early-Type Stars,
743 3 McLean,, I. S. 1979, MNRAS, 186, 265 Mennickent,, R. E., Sterken, C, & Vogt, N. 1997, A&A , 326, 1167 Neiner,, C, Hubert, A.-M., Floquet, M., et al. 2002, A&A , 388, 899 Okazaki,, A. T. 1991, PASJ, 43, 75 —.. 1996, PASJ, 48, 305 Oudmaijer,, R. D. & Drew, J. E. 1997, A&A , 318, 198 Page,, A. A. & Page, B. 1970, Proceedings of the Astronomical Society of Australia, 1, 324 Pavlovski,, K., Harmanec, P., Bozic, H., et al. 1997, A&AS, 125, 75 Percy,, J. R. & Attard, A. 1992, PASP, 104, 1160 Percy,, J. R. & Bakos, A. G. 2001, PASP, 113, 748 Percy,, J. R., Harlow, J., Hayhoe, K. A. W., et al. 1997, PASP, 109, 1215 Peters,, G. J. 1986, ApJ, 301, L61 —.. 1987, Be Star Newsletter, 16, 15 —.. 1988a, Be Star Newsletter, 18, 9 —.. 1988b, Be Star Newsletter, 19, 28 —.. 1988c, PASP, 100, 207 —.. 1989a, Be Star Newsletter, 20, 12 —.. 1989b, Be Star Newsletter, 21,9 —.. 1990, Be Star Newsletter, 22, 18 Peters,, G. J. 1991a, in Rapid Variability of OB-Stars: Nature and Diagnostic Value, Proc.
ESOO Workshop No. 36, ed. D. Baade, 171 —.. 1991b, Be Star Newsletter, 23, 14 —.. 1991c, Be Star Newsletter, 24, 17 —.. 1992, Be Star Newsletter, 25, 10 —.. 1994, Be Star Newsletter, 27, 13 Peters,, G. J. 1997, in Proc. ESO Workshop Cyclical Variability in Stellar Winds, eds. L. Kaper
&& AW. Fullerton, 127 Peters,, G. J. 2000, in ASP Conf. Ser. 214: The Be Phenomenon in Early-Type Stars, 212
108 8
Variabilityy and pulsations in 66 Oph
Poeckert,, R. 1975, ApJ, 196, 777 Poeckert,, R. & Marlborough, J. M. 1977, ApJ, 218, 220 —.. 1978a, ApJ, 220, 940 —.. 1978b, ApJS, 38, 229 Prinja,, R. K. 1991, in Rapid Variability of OB-Stars: Nature and Diagnostic Value, Proc. ESO
Workshopp No. 36, ed. D. Baade, 211 Rivinius,, T., Baade, D., Stefl, S., et al. 1998, A&A , 336, 177 Rivinius,, T., Baade, D., Stefl, S., et al. 2001, A&A , 369, 1058 Schaller,, G., Schaerer, D., Meynet, G., & Maeder, A. 1992, A&AS, 96, 269 Slettebak,, A. 1982, ApJS, 50, 55 Slettebak,, A. & Reynolds, R. C. 1978, ApJS, 38, 205 Smith,, M. A. 1977, ApJ, 215, 574 —.. 1989, ApJS, 71, 357 Smith,, M. A. 2000, in ASP Conf. Ser. 214: The Be Phenomenon in Early-Type Stars, 292 Snow,, T. P. 1987, in IAU Colloq. 92: Physics of Be Stars, 250-260 Stoeckley,, T. R. & Mihalas, D. 1973, in Limb Darkening and Rotation Broadening of Neutral
Heliumm and Ionized Magnesium Line Profiles in Early-Type Stars, NCAR-TN/STR-84 Telting,, J. H. & Kaper, L. 1994, A&A , 284, 515 Telting,, J. H. & Schrijvers, C. 1997, A&A , 317, 723 Tubbesing,, S., Rivinius, T, & et al. 2000, in ASP Conf. Ser. 214: The Be Phenomenon in
Early-Typee Stars, 232 Underhill,, A. B. 1987, in IAU Colloq. 92: Physics of Be Stars, 411^25 Wade,, G. A., Donati, J.-E, Landstreet, J. D., & Shorlin, S. L. S. 2000, MNRAS, 313, 823 Zorec,, J. 1986, Structure et rotation différentielle dans les étoiles B avec et sans emission
(Thesee d'Etat, Université Paris VII ) Zorec,, J. & Briot, D. 1985, Revista Mexicana de Astronomia y Astrofisica, vol. 10,10, 209 —.. 1991, A&A , 245, 150 Zorec,, J., Frémat, Y., Hubert, A. M., & Floquet, M. 2002, in ASP Conf. Ser. 259: Radial and
Nonradiall Pulsations as Probes of Stellar Physics, 244
109 9

110 0
" I NN ONE SENSE, EVERY STAR IS MORE OR L E SS P E-
CULIAR ;; WHICH FEATURES AND PHENOMENA ARE TO BEE CONSIDERED AS NORMAL, AND WHICH ARE TO BE SINGLEDD OUT AS PECULIAR, MUST DEPEND ON THE STATEE OF OUR KNOWLEDGE AND ON THE TASTE OF THE INDIVIDUA LL INVESTIGATOR."
Ottoo Struve

112 2