uw seminar kaj thomsen
TRANSCRIPT

1
Thermodynamic modeling of some properties of electrolyte
solutions
Kaj Thomsen IVC-SEP, Department of Chemical
Engineering, Technical University of Denmark, DK-2800 Lyngby, Denmark.
E-mail: [email protected]

3
Models for electrolytes
• Long range interactions
–Debye-Hückel electrostatic term
• Short range interactions
–Pitzer virial expansion in molality
–Electrolyte NRTL
–UNIQUAC
• Gas phase fugacity
–PR or SRK equation of state
4
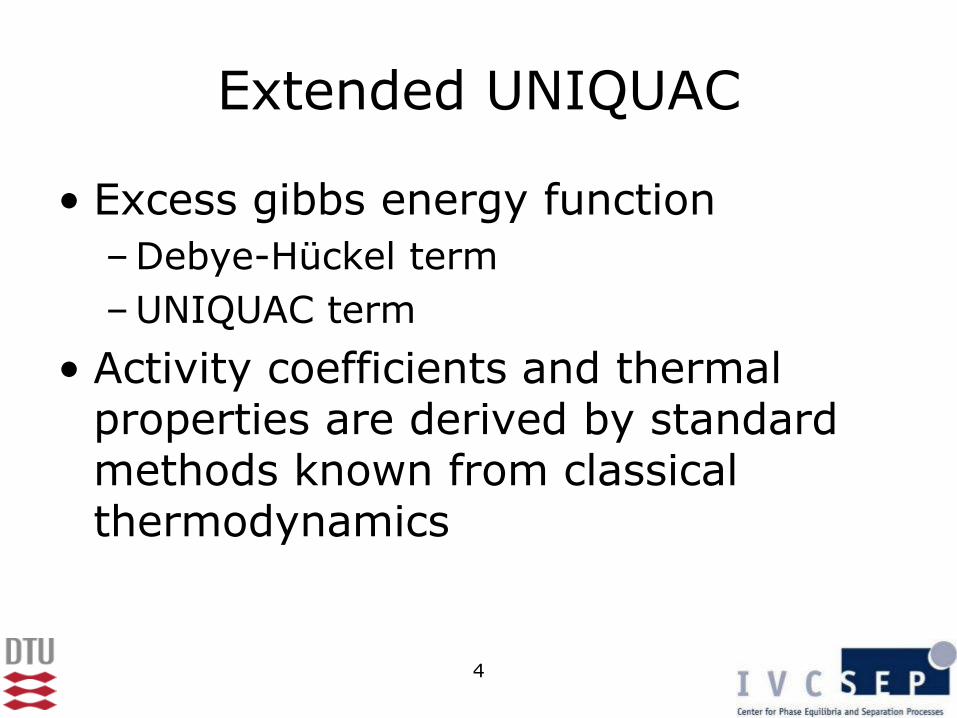
Extended UNIQUAC
• Excess gibbs energy function
–Debye-Hückel term
–UNIQUAC term
• Activity coefficients and thermal properties are derived by standard methods known from classical thermodynamics

5
Standard states
• Water is the solvent
• Ions, non-electrolytes and gases are treated equally as solutes in water
0
1ln( ); 1
wxw w w w wRT x
* * *
0ln( ); 1
i
i
i i i i i xRT x

6
Gibbs energy of transfer
Kamps, A.P-S., Ind. & Eng. Chem. Res., 44(2005)201-225

7
Relative permittivity Relative permittivity of aqueous solutions
0
10
20
30
40
50
60
70
80
90
0 10 20 30 40 50 60 70 80 90 100
Mass % solute
Re
lati
ve
pe
rm
itti
vit
y
.
NaCl, Hasted et al, 1948Ethanol, Åkerlöf, 1932

8
Conventional and ”Mixed solvent” approach
* *ln ln
"Mixed solvent" approach:
ln ln
i i i i
ideal excess
Mixed solvent Mixed solvent
i i i i
ideal excess
RT x RT
RT x RT
In the ”Mixed solvent” approach, the standard state chemical potential is a function of the solvent composition

9
Model parameters
• Standard UNIQUAC parameters
–Volume parameter for each species
–Surface area parameter for each species
– Interaction energy parameter for each pair of species
• Temperature dependence of interaction energy parameter
• Number of parameters:
• eUNIQUAC ~ eNRTL << Pitzer

10
Databank
• Over 100,000 experimental data on electronic form – Activity/osmotic coefficient
– Enthalpy of mixing
– Heat capacity
– Degree of dissociation
– Gas solubility
– Density
– Salt solubility (Solid-liquid equilibrium)
– Liquid-liquid equilibrium
– Vapor-liquid equilibrium

11
Parameter estimation
• Critical review of data
• Non-linear least squares optimization
–Differences between experimental and calculated values are minimized
–The calculation of the difference depends on the type of data
–All data of same type weighted equally
12
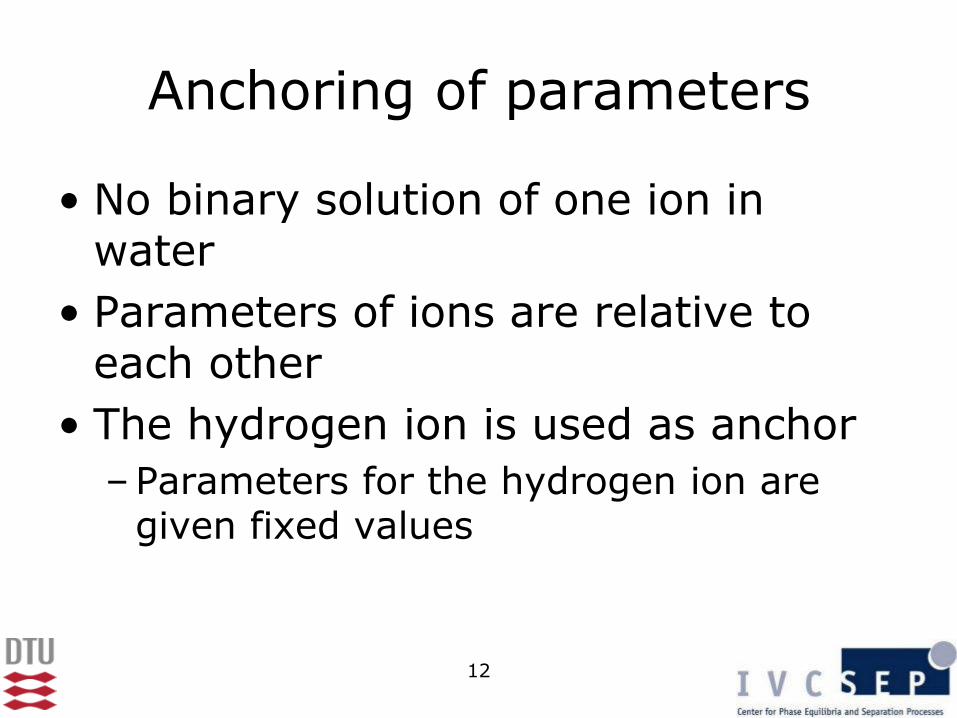
Anchoring of parameters
• No binary solution of one ion in water
• Parameters of ions are relative to each other
• The hydrogen ion is used as anchor
–Parameters for the hydrogen ion are given fixed values

13
Thermal properties
• Excess enthalpy is calculated from the temperature derivatives of activity coefficients.
• By using thermal properties in the parameter estimation a better temperature dependency of activity coefficients is achieved
• Clear distinction between temperature dependency and concentration dependency

14
Parameters
• H+, Na+, K+, NH4+, Ca2+, Mg2+, Mn2+, Fe2+,
Co2+, Ni2+, Cu2+, Zn2+, Ba2+, Sr2+
• F-, Cl-, Br-, NO3-, SO4
2-, HSO4-, OH-, CO3
2-, HCO3
-, S2O82-, SO3
2-, HSO3-, HPO4
-, H2PO4-
• H2O, CO2, NH3, SO2, HNO3, H3PO4, C12H22O11, CH3OH, C2H5OH, n-C3H7OH, i-C3H7OH, n-C4H9OH, i-C4H9OH, s-C4H9OH, t-C4H9OH

15
Equilibrium calculations
• Speciation equilibrium
• +
• Solid-liquid equilibrium
• Vapor-liquid equilibrium
• Liquid-liquid equilibrium

16
Speciation equilibria
NH3(aq)+H2O NH4+(aq)+OH-(aq)
Equilibrium condition:
-3 2 4
- -3 24 4
3 2
* * * 0 * *
*
- -- ln
NH H O NH OH
NH H ONH OH NH OH
NH H O
a a
RT a a
17
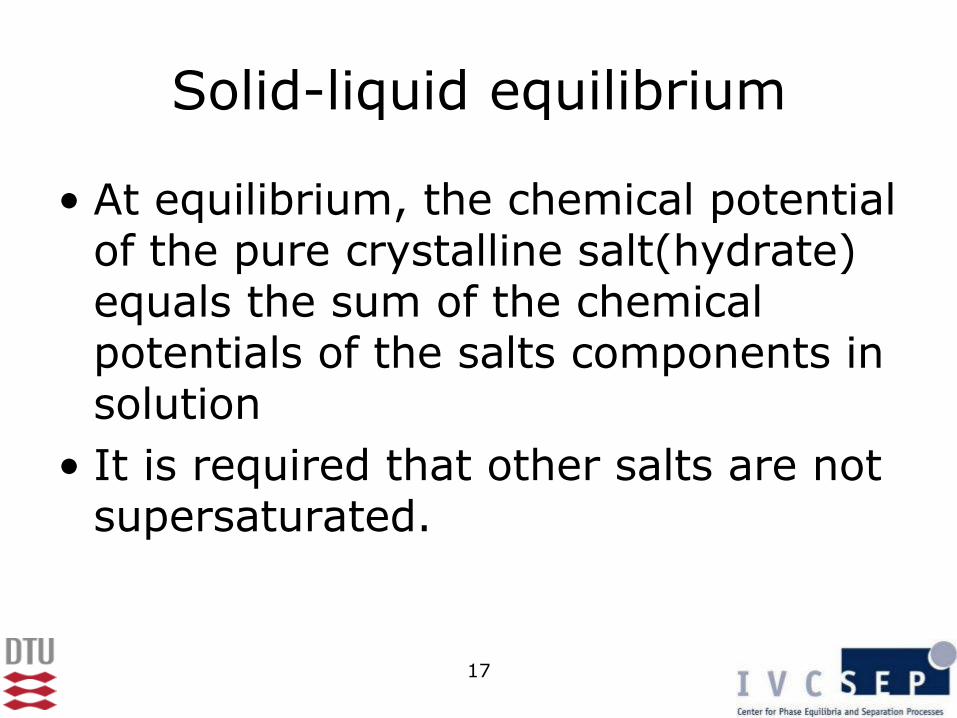
Solid-liquid equilibrium
• At equilibrium, the chemical potential of the pure crystalline salt(hydrate) equals the sum of the chemical potentials of the salts components in solution
• It is required that other salts are not supersaturated.

18
Vapor-liquid equilibrium
• Equality of chemical potential in gas phase and in liquid phase (Gamma-phi method)
• Gas phase fugacities are calculated with the Soave-Redlich-Kwong equation of state
2 2
2 2 2 2 2 2
( ) ( )
0, * *
0
ˆln ln
CO g CO aq
ig
CO CO CO CO CO CO
PRT y RT x
P

19
Liquid-liquid equilibrium
• Here the activity product of salts rather than the activities of the individual ions ions are compared
I II
* * I * * II
* I * II
ln( ) ln( )
( ) ( )
i i
i i i i i i
i i i i
RT x RT x
x x
• Equilibrium between component i in phase I and phase II

20
Standard state properties
• The numerical values of standard state chemical potentials are needed before equilibrium calculations can be made
• Such values for most solutes and many salts have been published by NIST
• Those not found are fitted to experimental data
• Temperature dependence calculated with classical thermodynamic method

21
-20
-10
0
10
20
30
40
50
60
70
80
90
0 10 20 30 40 50 60 70 80 90 100
Tem
pera
ture °
C
Extended UNIQUAC modelExperimental data--
Mass percent Mn(NO3)2
Ice
Mn
(NO
3) 2
·6H
2O
Mn
(NO
3) 2
·4H
2O
Mn
(NO
3) 2
·2H
2O
Mn
(NO
3) 2
·H2O

22
0
20
40
60
80
100
120
0 0.05 0.1 0.15 0.2
Mass percent Ca(OH)2
Te
mp
era
ture
°C
Calculated
Experimental
Ca(OH)2

23
0
0.1
0.2
0.3
0.4
0.5
0.6
0.7
0.8
0.9
1
-40 -30 -20 -10 0 10 20 30 40 50 60 70 80 90 100 110
salt
fra
cti
on
Extended UNIQUAC modelExperimental data
Temperature, °C
K2C
O3
Na
2C
O3
Na2CO3·K2CO3
NaKCO3·6H2O
Na2CO3
Na2CO3·H2O
Na2CO3·7H2O
Na2CO3·10H2O Ice
K2CO3·½H2O

24
100
90
80
70
60
50
40
30
20
10
0100
90
80
70
60
50
40
30
20
10
0
0
10
20
30
40
50
60
70
80
90
100
0 10 20 30 40 50 60 70 80 90 100
Experimental
data, various
sources
Extended
UNIQUAC,
Equilibrium lines
and tie lines
K2CO3
Na2CO3
H2O(l)
T= 75.0°C
Na2CO3∙H2O
Na2CO3∙K2CO3
K2CO3∙½H2O

25
0
10
20
30
40
50
60
70
80
90
0 2 4 6 8 10
CO2 mol kg-1
CO
2 p
arti
al
press
ure, b
ar
Extended UNIQUAC modelExperimental data__
80°C
12 molal NH3
9 molal NH3
2 molal
NH3
6.8 molal NH3
4.1 m1 m0.6 m
5.9 molal NH3
26
100
90
80
70
60
50
40
30
20
10
0
0
10
20
30
40
50
60
70
80
90
100
0
10
20
30
40
50
60
70
80
90
100
0 10 20 30 40 50 60 70 80 90 100
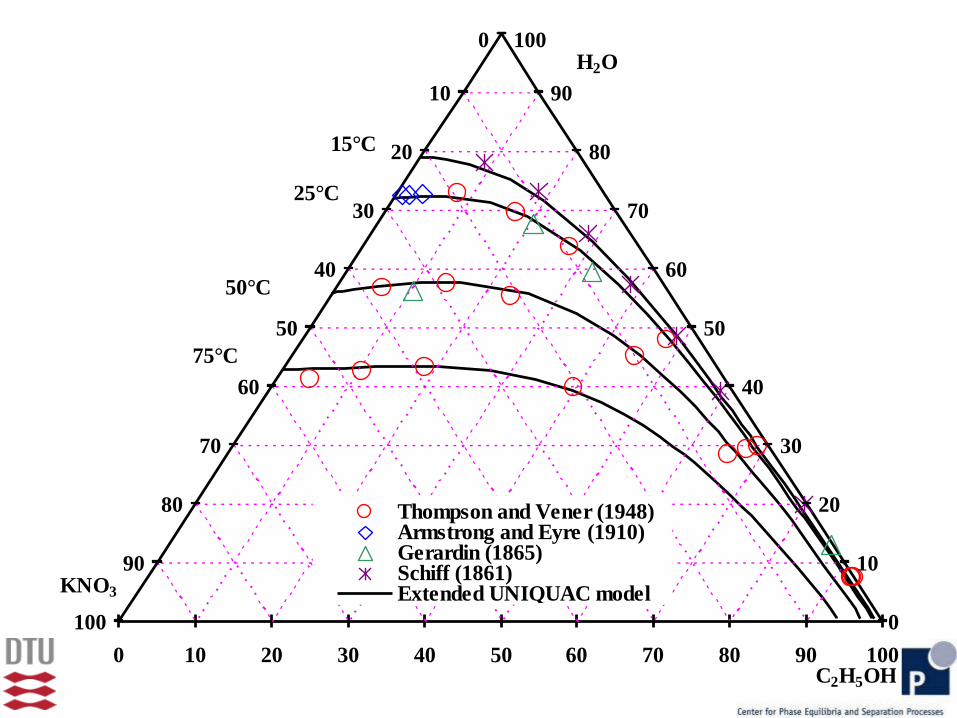
Thompson and Vener (1948)Armstrong and Eyre (1910)Gerardin (1865)Schiff (1861)Extended UNIQUAC modelSeries2Series3Series4
C2H5OH
KNO3
H2O
15°C
25°C
50°C
75°C

27
100
90
80
70
60
50
40
30
20
10
0100
90
80
70
60
50
40
30
20
10
0
0.0
0
10.0
0
20.0
030.0
0
40.0
0
50.0
0
60.0
0
70.0
080.0
0
90.0
0100.0
0
0 10 20 30 40 50 60 70 80 90 100
Iino et al. (1971)Do & Park (1974)Extended UNIQUACSeries2Series3Series4Series7
iso-propanol
K2CO3
H2O
30 °C

28
xy - diagram for iso-propanol - water, 1 bar
0
0.1
0.2
0.3
0.4
0.5
0.6
0.7
0.8
0.9
1
0 0.1 0.2 0.3 0.4 0.5 0.6 0.7 0.8 0.9 1
x iso-propanol
y iso
-pro
pa
no
l
Extended UNIQUAC modelMarzal et al. (1996)Saturation with K2CO3

29
Integral heat of dilution to infinite dilution
-3000
-2000
-1000
0
1000
2000
3000
4000
0 2 4 6Molality of KCl
J mol-1Ext. UNIQUAC
Experimental, 12.5°C
Experimental, 25°C
Experimental, 40°C
Experimental, 60°C
Experimental, 80°C

30
Apparent molal heat capacity
-200
-150
-100
-50
0
50
0 0.5 1 1.5 2 2.5 3Molality of NaOH
J mol-1 K-1
Ext. UNIQUAC
Experimental, 10°CExperimental, 25°C
Experimental, 40°CExperimental, 100°C
31
Pressure dependency
• No pressure dependency in activity coefficient model
• High pressure applications
–Scale formation in oil production equipment and reservoirs
–Scale formation in equipment used for producing geothermal energy


33
Pressure dependency
• Solubility product:
• Activity coefficients:
0
0
2
0 0ln ln ( ) ( )2
dis P disP P
VK K P P P P
RT RT
0
0
,* * 2
, , 0 0ln ln ( ) ( )2
ex exi P i
i P i P
VP P P P
RT RT
34
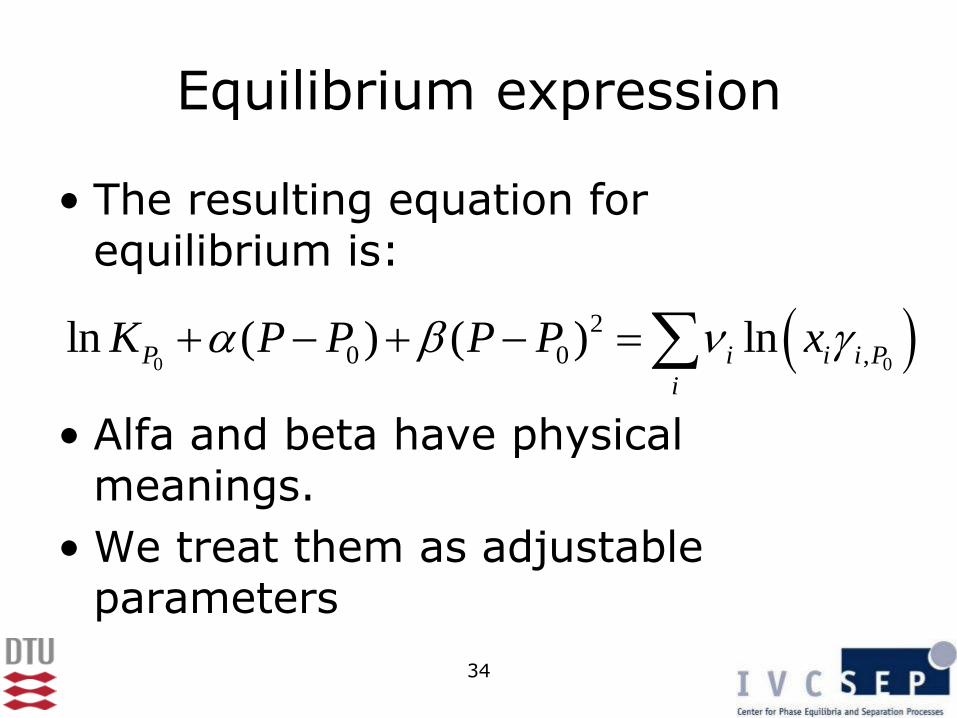
Equilibrium expression
• The resulting equation for equilibrium is:
• Alfa and beta have physical meanings.
• We treat them as adjustable parameters
0 0
2
0 0 ,ln ( ) ( ) lnP i i i P
i
K P P P P x

35
BaSO4 solubility at 500 bar
1.00E-06
6.00E-06
1.10E-05
1.60E-05
2.10E-05
2.60E-05
3.10E-05
3.60E-05
4.10E-05
4.60E-05
0 50 100 150 200 250 300
T (oC)
BaS
O4 (
m)
Extended UNIQUAC model
Blount (1977)
Lyashchenko and Churagulov (1981)García A.V., Thomsen K., Stenby E.H.,
Geothermics 34(2005)61-97

36
SrSO4 solubility isotherms
0.0E+00
2.0E-04
4.0E-04
6.0E-04
8.0E-04
1.0E-03
1.2E-03
1.4E-03
0 100 200 300 400 500 600 700
P (bar)
SrS
O4 (
m)
Extended UNIQUAC model
Howell et al. (1992)25 °C
100 °C
200 °C

37
CaCO3 solubility at 30 bar CO2
0.000
0.005
0.010
0.015
0.020
0.025
0.030
0 50 100 150 200
T (oC)
CaC
O3 (
m)
Extended UNIQUAC model
Segnit et al. (1962)
Miller (1952)
García A.V., Thomsen K., Stenby E.H., Geothermics 35(2006)239-284

38
Inconsistent data
0.000
0.001
0.002
0.003
0.004
0.005
0.006
0.007
0.008
0.009
0.010
0 1 2 3 4 5 6
NaCl (m)
SrS
O4 (m)
Howell et al. (1992)
Brower and Renault (1971)
Vetter et al. (1983)
Lucchesi and Whitney (1962)
Müller (1960)


40
Measurements
• Analysis for Ba performed by ICP-MS (Inductively Coupled Plasma – Mass Spectrometry)
• Three different labs measured three different Ba contents in the same sample!
• We did not get any good data yet!
41
Corrosion in wet gas pipelines
• In another project, the Extended UNIQUAC model is being applied for describing and preventing corrosion
• Equilibrium calculations to be combined with electrochemical and transport aspects
• PhD student Philip Fosboel

42
Where do we find corrosion?
GAS Line 16”
CO2
H2O
Natural gas
CO2
H2O
NaOH
MEG

43
CO2 Corrosion
• pH is lowered by dissolved CO2.
2 2 3
2
2
2
2 2 3 2
( ) ( ) ( ) ( )
Half cell reactions:
2 2
2
The sum of reactions:
( ) 2 ( ) 2 ( ) ( ) 2 ( ) ( )
CO aq H O l HCO aq H aq
H e H
Fe Fe e
Fe s CO aq H O l Fe aq HCO aq H g

44
CO2 corrosion
• If pH is high enough, a protective layer of FeCO3 is formed
• Gas composition
–1.6 mol % CO2
–0.1 mol % H2O
–Balance light alkanes
• Temperature 10 to 50°C
• Pressure 60 to 70 bar

45
CO2 corrosion
• Inhibitors:
–NaOH
–Mono ethylene glycol (MEG)
• Liquid phase:
–27 to 0.5 wt % NaOH in water
–95 - 30 wt % MEG
• How much CO2 can dissolve in this solution?

46
CO2 corrosion
• If sufficient data are available, the system can be modelled
– No data for solubility of CO2 in H2O – MEG mixture published
– Few data for solubility of Na2CO3 and NaHCO3 in H2O – MEG mixture
• Highly non ideal solution
– High ionic strength (up to 10 molal)
– Mixed solvent solution
– Speciation equilibria

47
CO2 –NaOH - H2O – MEG measurements
• New measurements are required • The solubility of Na2CO3 and NaHCO3 is
being measured by titration – The total Na+ content can be determined – The carbonate/bicarbonate ratio is not
determined – Solvent composition changes during
precipitation of hydrates • Na2CO3∙10H2O • Na2CO3∙7H2O • Na2CO3∙H2O • Na2CO3∙NaHCO3∙2H2O

48
CO2 – NaOH - H2O – MEG measurements
Equilibration
Automated accurate titration
10 < T°C < 50
0 < wt % MEG < 100
Saturated solutions

49
CO2 – NaOH - H2O – MEG NaHCO3 solubility determined by titration of saturated solution
Two salt transition points marked by sudden density change of saturated solution
Solubility of salts can be determined if amount of precipitate is known. Raw data are used for parameter estimation
100
90
80
70
60
50
40
30
20
10
0
0
10
20
30
40
50
60
70
80
90
100 Solid phase
Saturated
Start
0
10
20
30
40
50
60
70
80
90
100
0 10 20 30 40 50 60 70 80 90 100
Solubility isothermTie-linesExperiment
NaHCO3
Na2CO3
H2O+MEG
Na2CO3∙NaHCO3∙2H2O
Na2CO3∙10H2O

50
CO2 – NaOH - H2O – MEG
Preliminary results calculated with Extended UNIQUAC model based on model parameters determined from literature data. (Gärtner et al. J. Chem. Eng. Data, 49(2004)116-125)
0
5
10
15
20
25
0 20 40 60 80 100
wt% saltfree MEG
g/1
00g
solv
ent
model 25C
model 50C
model 80C
experimental 25C
experimental 50C
experimental 80C
0
5
10
15
20
25
0 20 40 60 80 100
wt% saltfree MEG
g/1
00g
solv
ent
model 25C
model 50C
model 80C
experimental 25C
experimental 50C
experimental 80C

51
CO2 corrosion
• When parameters in the model are determined, we can – Combine this thermodynamic model with a
diffusion model to determine corrosion rate
– Calculate speciation equilibria in the mixed solvent solution
– Calculate the saturation index of the protective coating of FeCO3
– Determine the optimal amount of NaOH to add to the solution to avoid corrosion
– Determine the optimal amount of MEG to add to avoid gas hydrate formation

52
Equation of state for electrolytes
• Current activity coefficient models are good but not perfect –No pressure dependency
–No density calculation
–Decreasing accuracy with increasing number of components
• Practical to use same equation of state for all components
• PhD student Yi Lin

53
Comparative study of four EOS
• Short range interactions: –Soave-Redlich-Kwong
–Peng-Robinson
–Wertheim association term for water
• Long range electrostatic interactions: –Mean spherical approximation (MSA)
• Implicit and explicit version
–Simpel Debye-Hückel term
–Born term

54
Myers, Sandler and Wood (MSW) electrolyte EOS
• Myers et al., Ind. Eng. Chem. Res. 41(2002)3282-3297
• AR = APR + ABorn + AMSA
• Short range term : PR EOS
• Long range terms: Explicit MSA, Born
• We use ion specific parameters.
• APR :
• ABorn , AMSA :
, , i i ija b k
i

55
Modified MSW electrolyte EOS
• We replace the explicit MSA term with the implicit MSA term
• AR = APR + ABorn + AimMSA
• Short range term : PR EOS
• Long range terms: Implicit MSA, Born
• Ion specific parameters.
• APR :
• ABorn , AimMSA :
, , i i ija b k
i

56
Electrolyte CPA EOS
• We replace the Peng-Robinson term with the Soave-Redlich-Kwong + Wertheim term
• AR = ASRK + AW + ABorn + AimMSA
• Short range term : SRK + Association
• Long range terms: Implicit MSA, Born
• Ion specific parameters.
• ASRK :
• ABorn , AimMSA :
, , i i ija b k
i

57
Approximation
• An approximation introduced by Myers, Sandler and Wood (Ind. Eng. Chem. Res. 41(2002)3282-3297) is implemented for the three EOS mentioned.
• The density of water is needed for calculating the relative permittivity of water from the relation of Uematsu and Franck
•
2 2 2
2 2
· /
( , ) ( , , )
H O H O H O
r H O r H O
n M V
T T V n

58
SRK + DH EOS
• Short range term : SRK
• Long range terms: Debye-Hückel
• Ion specific parameters.
• The Debye-Hückel parameter A is a function of temperature only
• Debye-Hückel term with no contribution to volume
, , i i ija b k
ln ln lnSRK DH SRK DH
i i i

59
Test system at 298.15 K
• H2O-(Na+, Ca2+, H+)-(Cl-, SO42-, OH-)
• 1300 experimental data points used
–Osmotic/activity coefficient
–Solid-liquid equilibrium data
–Apparent molar volume
0*
,
ex ex
w w S S w wS S
S S
nM n M n M n MM M
n n

60
Results
0 1 2 3 4 5 6 7
0.85
0.90
0.95
1.00
1.05
1.10
1.15
1.20
1.25
1.30
1.35NaCl
Osm
otic C
oe
ffic
ien
t
Molality (mol/kg)
Experimental data
MSW EOS
mMSW EOS
eCPA EOS
SRK+DH
0 1 2 3 4 5 6 7 8 9 10
0.5
1.0
1.5
2.0
2.5
3.0
3.5
4.0
4.5 CaCl2
Osm
otic C
oe
ffic
ien
t
Molality (mol/kg)
Experimental data
MSW EOS
mMSW EOS
eCPA EOS
SRK+DH
Lin Y., Thomsen K., and de Hemptinne J-C., submitted to AIChE Journal

61
Results
0 1 2 3 4 5 6 7
0.0
0.5
1.0
1.5
2.0
NaCl
Na2SO
4
Na2SO
4·10H
2O
Na
2S
O4 M
ola
lity (
mo
l/kg
)
NaCl Molality (mol/kg)
Experimental Data
MSW EOS
mMSW EOS
eCPA EOS
SRK+DH
0.000 0.002 0.004 0.006 0.008 0.010 0.012 0.014 0.016
0.000
0.005
0.010
0.015
0.020
0.025
Ca(OH)2
CaSO4·2H
2O
Ca
(OH
) 2 M
ola
lity (
mo
l/kg
)
CaSO4 Molality (mol/kg)
Experimental Data
MSW EOS
mMSW EOS
eCPA EOS
SRK+DH

62
Results
0 1 2 3 4 5 6 7
12
14
16
18
20
22
24
Ap
pa
ren
t M
ola
r V
olu
me
Molality (mol/kg)
Experimental data
MSW EOS
mMSW EOS
eCPA EOS
SRK+DH
HCl
0 1 2 3 4 5 6 7 8
0.75
0.80
0.85
0.90
0.95
1.00
1.05
1.10
1.15 HCl
De
nsity (
g/c
m3)
Molality (mol/kg)
Experimental data
MSW EOS
mMSW EOS
eCPA EOS
SRK+DH
0 1 2 3 4 5 6
-5
0
5
Ap
pa
ren
t M
ola
r V
olu
me
Molality (mol/kg)
Experimental data
MSW EOS
mMSW EOS
eCPA EOS
NaOH
0 1 2 3 4 5 6
0.75
0.80
0.85
0.90
0.95
1.00
1.05
1.10
1.15
1.20
1.25 NaOH
De
nsity (
g/c
m3)
Molality (mol/kg)
Experimental data
MSW EOS
mMSW EOS
eCPA EOS

63
Temperature dependence
• Usually the ”a” parameter in cubic EOS is temperature dependent
• We chose to let the ion size parameter be temperature dependent too
• Seven different temperature dependence functions were tested
• The best was:
•
•
•
0 1 2
0 1
2( )
( )
298.15 298.15
298.15
a T a a a
T
T T
T

64
Results
0 0.5 1 1.5 2 2.5 3 3.5 4
0
20
40
60
80
100
120
Molality (mol/kg)
Tem
pera
ture
oC
Exp data
MSW EOS
mMSW EOS
CPA EOS
SRK+DH EOS
Ice
Na2SO
4 .10H
2O
Na2SO
4
0 1 2 3 4 5 60
1
2
3
4
5
6
7
8
-40 oC
-25 oC
-20 oC
-20 oC, y + 0.5
-10 oC
-10 oC, y + 1.5
0 oC
0 oC, y + 2.5
NaCl Molality (mol/kg)
CaC
l 2 M
ola
lity
(m
ol/
kg
) )
Exp data
MSW EOS
mMSW EOS
CPA EOS
NaCl .2H2O
Ice
-25 oC
Ca
2C
l .6H
2O

65
Temperature dependence
• The thermal properties (heat of mixing, heat capacity) of electrolyte solutions could not be well correlated by any of the EOS
• The same is the case for the apparent molar volume of these solutions
• Alternative to be tested:
– Use temperature dependent interaction parameters in the EOS as it is done in the activity coefficient model

66
Results
5
7
9
11
13
15
17
19
21
23
25
0 1 2 3 4 5 6
NaCl molality
Ap
pa
ren
t m
ola
r vo
lum
e c
m3/
mo
l
MSW, 100 °CmMSW, 100 °CCPA, 100 °CExperimental, 100 °CExperimental, 25 °CMSW, 25 °CmMSW, 25 °CCPA, 25 °C

67
Conclusions
• Activity coefficient models like the Extended UNIQUAC model is currently the only way to model properties of electrolyte solutions
• Electrolyte EOS based on cubic EOS need more developement before they can be used as engineering equations