v116n10a13 x-ray computed microtomography studies of mim
TRANSCRIPT

Metal injection moulding (MIM) is a novelprocess, which combines the advantages ofpowder metallurgy (PM) and plastic injectionmoulding. MIM has found widespreadapplications in the cost-effective production ofhigh-sintered density small parts withcomplicated shapes and mechanical propertiesequivalent to those of wrought materials(German and Bose, 1977; Machaka andChikwanda, 2015; German, 2013). There arefour basic processing steps involved in MIM,namely; feedstock preparation, injectionmoulding, debinding and sintering. Thesesteps are discussed in greater detail elsewhere(Machaka, Seerane and Chikwanda, 2014;German and Bose, 1977; Machaka andChikwanda, 2015; German, 2013).
Feedstock preparation involves mixingmetal powder with a carefully selectedcomposition of polymeric binder materials at aspecific temperature. The feedstock is thengranulated and injected into a predefinedmould die with the desired shape. The part
produced during the moulding step is referredto as a ‘green’ component. The greencomponent typically contains no porosity sincethe spaces between adjacent powder particlesare readily filled with the binder materials(German and Bose, 1977; Li, Li and Khalil,2007). Debinding is the systemic removal ofthe binder components by chemical, catalytic,or/and thermal means while maintaining theshape of the component. The part producedafter the debinding step is referred to as a‘brown’ component. Debinding is known to bethe source of porosity in brown components (Jiet al., 2001; Tsai and Cen, 1995). Finally, thebrown debound part is sintered to full or near-full density (Sotomayor, Várez and Levenfeld,2010). The sintering step and associateddensification closes up the majority of thepores. Sintered MIM parts are typically sinteredto high density (95–99%) and retain anirreducible amount of residual porosity(Barriere, Liu and Gelin, 2003; German,1990).
Direct powder rolling (DPR) of metalpowders is a fairly new process (Cantin andGibson, 2015). The DPR process consists of (i)roll compaction, sintering, mechanical workingand/or heat treatment (Ro, Toaz and Moxson,1983) or (ii) roll compaction, hot rolling,mechanical working and/or heat treatment(Cantin et al., 2011). The rolling mill consol-idates the powders into green compacts (Parket al., 2012; Chikosha, Shabalala andChikwanda, 2014; Cantin et al., 2010;Peterson, 2010). The green compacts producedvia DPR contain pores between the consol-idated powder particles. Sintering or hot rolling
X-ray computed microtomographystudies of MIM and DPR partsby N.S. Muchavi*, L. Bam‡, F.C. De Beer‡, S. Chikosha* and R. Machaka*
Parts manufactured through power metallurgy (PM) typically containpores that can be detrimental to the final mechanical properties. Thispaper explores the merits of 3D X-ray computed tomography overtraditional microscopy for the characterization of the evolution of porosityin metal injection moulding (MIM) and direct powder rolling (DPR)products. 17-4 PH stainless steel (as-moulded, as-debound and sintered)dog-bone samples produced via MIM and Ti-HDH strips (as-rolled andsintered) produced via DPR and were analysed for porosity. 3D micro-focus X-ray tomography (XCT) analysis on specimens from both processesrevealed spatial variations in densities and the existence of characteristicmoulding and roll compaction defects in agreement with traditionalmicroscopic microstructural analysis. It was concluded that micro-focusXCT scanning can be used to study MIM and DPR parts for the characteri-zation of the amount, position and distribution of porosity and otherdefects. However, the majority of the sub-micron sized pores could not beclearly resolved even at the highest possible instrument resolution.Higher-resolution scans such as nano-focus XCT could be utilized in orderto fully study the porosity in MIM and DPR parts.
X-ray tomography, metal injection moulding, direct powder rolling, 17-4 PH stainless steel, titanium.
* Light Metals, Materials Science andManufacturing, Council for Scientific andIndustrial Research, Pretoria, South Africa.
† Radiography/Tomography Section, Necsa,Radiation Science Department, Pretoria, SouthAfrica.
© The Southern African Institute of Mining andMetallurgy, 2016. ISSN 2225-6253. This paperwas first presented at the AMI Ferrous and BaseMetals Development Network Conference 201619–21 October 2016, Southern Sun ElangeniMaharani, KwaZulu-Natal, South Africa.
973VOLUME 116 �
http://dx.doi.org/10.17159/2411-9717/2016/v116n10a13
X-ray computed microtomography studies of MIM and DPR parts
followed by mechanical working and/or heat treatment isperformed to reduce the pores, resulting in a highly densifiedpart (Qian, 2010; Froes et al., 2004). The number, distri-bution and evolution of pores throughout the DPR stages arederived from the measured densities. The methods used fordensity studies of powder metallurgy parts such asdimensional measurements and the hydrostatic Archimedesmethod can be labour-intensive and time-consuming as theycan involve sectioning and infiltrating specimens (Bateni,Parvin and Ahmadi, 2011; Martin et al., 2003). As such,nondestructive material testing such as gamma radiology,ultrasonic tomography, eddy current measurements andmicro-focus X-ray computed tomography ( XCT) becomeattractive alternative ways of identifying and characterizingporosity and other flaws in a material (Bateni, Parvin andAhmadi, 2011; Kohn, 1972).
Recent developments have seen a growing interest inXCT analysis both as a characterization and quality
inspection technique in material science; it has beensuccessfully applied to many different materials (Heldele etal., 2006; Kara and Matula, 2015; O’Brien and James, 1988;Yang, Zhang and Qu, 2015a; Lunel, 2013; Mutina andKoroteev, 2012; Tammas-Williams et al., 2015; du Plessis etal., 2016; Alcica et al., 2010) to show the resolvablemicrostructural features such as second-phase particulates aswell as defects such as inclusions, pores and cracks (Maire etal., 2001). To date, the application of XCT analysis inpowder metallurgy has been explored by several groups: deChiffre et al. surveyed existing systems, scanning capabilitiesand technological advances on a variety of XCT scanningtechnologies while reviewing the state of the industrialapplications of XCT methods in general. Bateni, Parvin andAhmadi (2011) conducted in situ density measurements onporous PM compacts using XCT techniques. O'Brien andJames (1988), Yang, Zang and Qu (2015a) and Kara andMatula (2015) reviewed the application of XCT techniques toissues relating to powder compaction and compact ejection forPM components. Ma, Li and Tang (2016) applied XCTtechnique in characterizing the microstructural evolution anddensification mechanisms during the sintering of steelpowders. Aldica et al. (2010) used XCT in the characteri-zation of mechanically alloyed MgB2 superconductormaterials consolidated by spark plasma sintering. Heldele etal (2006), Weber et al. (2011), Yang, Zhang and Qu (2015b)and Fang et al. (2014) investigated various aspects of MIMparts using XCT. No literature sources currently available
report on the application of XCT techniques to study thepowder rolling process or intermediate MIM debinding stages.However, available literature shows that XCT techniqueshave found widespread quality inspection application instudying porosity formation in additive manufactured metalcomponents and the formation of porosity therein (Tammas-Williams et al., 2015; du Plessis et al., 2016).
This paper explores the merits of 3D XCT over traditionalmicroscopy and inspection techniques for the characterizationof the evolution of 3D pore distribution, concentration andsize in MIM and DPR products. This technique will offer moredetailed results than the traditional microscopy technique,which provides only 2D surface information of the specimen.
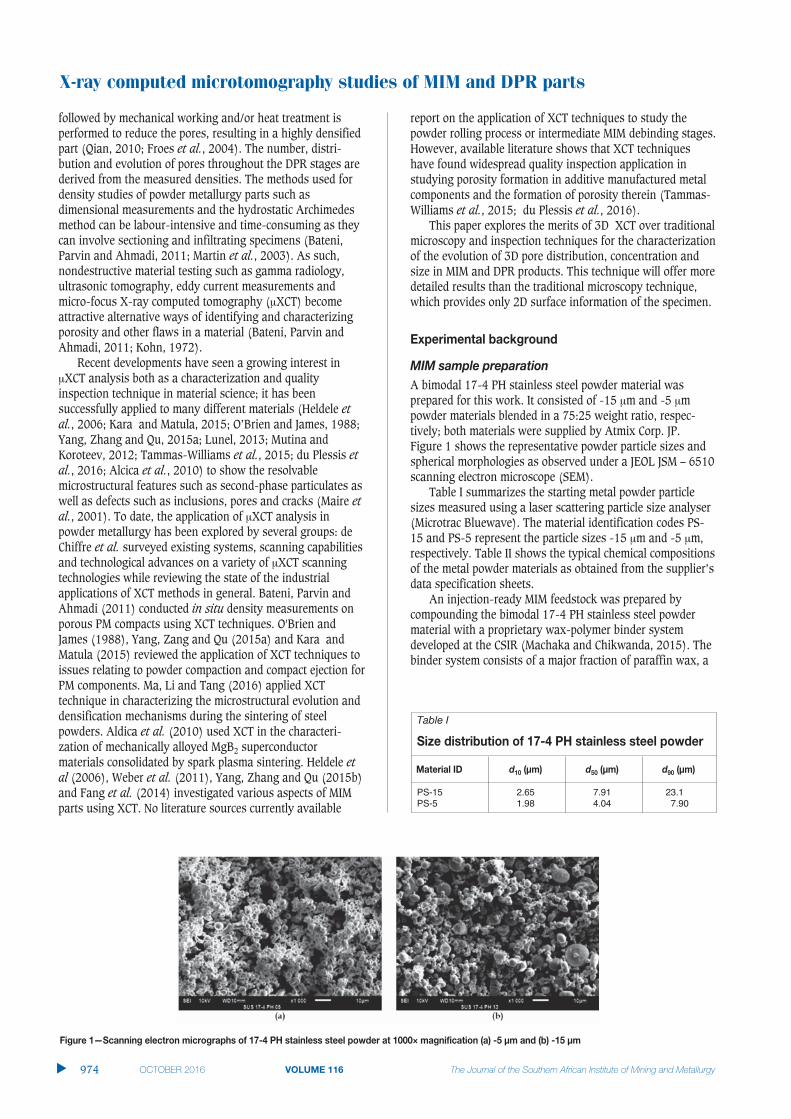
A bimodal 17-4 PH stainless steel powder material wasprepared for this work. It consisted of -15 m and -5 mpowder materials blended in a 75:25 weight ratio, respec-tively; both materials were supplied by Atmix Corp. JP. Figure 1 shows the representative powder particle sizes andspherical morphologies as observed under a JEOL JSM – 6510scanning electron microscope (SEM).
Table I summarizes the starting metal powder particlesizes measured using a laser scattering particle size analyser(Microtrac Bluewave). The material identification codes PS-15 and PS-5 represent the particle sizes -15 m and -5 m,respectively. Table II shows the typical chemical compositionsof the metal powder materials as obtained from the supplier’sdata specification sheets.
An injection-ready MIM feedstock was prepared bycompounding the bimodal 17-4 PH stainless steel powdermaterial with a proprietary wax-polymer binder systemdeveloped at the CSIR (Machaka and Chikwanda, 2015). Thebinder system consists of a major fraction of paraffin wax, a
�
974 VOLUME 116
Table I
PS-15 2.65 7.91 23.1PS-5 1.98 4.04 7.90

blend of low-density polyethylene, polypropylene and astearic acid surfactant of less than 1 wt.% of the bindersystem composition. The feedstock was prepared in a sigma-type blade mixer for at least 1 hour at 140°C in air.
Upon cooling, the feedstock was appropriately granulatedand injection-moulded into standard MPIF ‘dogbone’ tensilespecimens. The injection moulding was done at 140°C usingan ARBURG Allrounder 270U 400-70 injection mouldingmachine.
Debinding of green parts was performed in two steps. Thefirst step was solvent extraction of the low-molecular-weightsolvent-soluble binder components in n-heptane (Merck) at60°C for up to 24 hours. The sample was subsequently driedbefore being weighed to obtain the percentage weight loss ofthe binder. The second step was thermal decomposition of thebackbone binder during the pre-sintering cycle. This wasaccomplished in a Carbolite tube furnace under a controlledflowing argon atmosphere at 550°C. The mechanism of thisthermal debinding procedure has been reported elsewhere(Machaka and Chikwanda, 2015; Machaka, Seerane andChikwanda, 2014; Seerane, Chikwanda and Machaka, 2015)
The thermally debound components were sintered at1300°C for 4 hours followed by furnace cooling. The argongas flow was maintained at 1.0 L/min. The microstructure,density, microhardness and tensile properties of the sinteredcomponents were investigated accordingly.
Ti-HDH 100 mesh (-150 m) powders supplied by ChengduHuarui Industrial in China were used. The powders wererolled in a modified Schwabenthal Polymix 150T rubber millwith a roll diameter of 170 mm. The rolling speed was set at10 r/min with a roll gap of 0.3 mm. The set strip width wasvaried at 20, 50 and 100 mm.
The masses of the strips were measured using an OhausExplorer balance, the length and width were measured usinga Vernier caliper and the thickness was measured using a TAmicrometer screw gauge. Five measurements were taken foreach parameter and an average value used. The green densityof each strip was calculated using the measured mass, length,width and thickness of the compact strips.
Sintering was carried out in a Carbolite tube furnace at1300ºC for 3 hours followed by furnace cooling. Argon wasused as an inert atmosphere at 1 L/min. After sintering, thedensity of each strip was measured using an Ohaus Explorerdensity determination kit based on the Archimedes principleaccording to ASTM standard B311. The sintered compactswere sectioned into several pieces, mounted, ground andpolished according to standard metallography procedures.The microstructures of the polished samples were recordedusing a DM5000 optical microscope with Image Pro-AMS 603software for recording the micrographs.
Representative as-moulded green component, dried browncomponents and final sintered components were probed bymeans of XCT to investigate the evolution of the poresthroughout the stages of MIM processing (injectionmoulding, debinding and sintering). For the DPR process,sintered samples that were 20, 50 and 100 mm wide wereprobed to investigate the residual porosity in terms of theposition and distribution.
The X-ray computed tomography scans were conducted atthe Micro-focus X-ray Radiography/Tomography (MIXRAD)laboratory using the NIKON XTH 225ST system based at theSouth Africa Nuclear Energy Corporation (Necsa) (Hoffmanand Beer, 2012). The high-resolution system consists of atungsten target with a 3.7 m spot size with a variableenergy potential of approximately 25 to 225 kV. Themaximum resolution achievable at the detector is 200 m.Each sample was scanned at a potential of 115 kV and beamcurrent of 100 A to obtain beam penetration > 10% frombackground. During the scan the sample rotated in equalangular steps through 360° to produce 1000 radiographs ateach step angle, which were then reconstructed using the CT-Pro 3D-reconstruction software (Hoffman and Beer, 2012).The reconstruction process transforms the acquired 2Dradiographs into a virtual 3D volume that is an exact digitalcopy of the sample. This virtual 3D volume was analysedusing VGStudioMAX (ver. 2.2) rendering software, whichallows rendering of the sample in 3D. The background isrepresented by darker grey values, whereas the sample haslighter/bright grey values. This grey value difference wasused to determine porosity distribution within the samples.
Figure 2 depicts the differences between the as-mouldedgreen, solvent-debound and sintered components. Thesurface appearance of specimens (a–c) gives an indication ofthe binder lost from the green state to the sintered state andthis equates to the level of shrinkage that occurred. Specimen(b) underwent solvent debinding and no significantshrinkage difference was observed relative to the as-mouldedpart. The linear shrinkage of the sintered sample (Figure 2(c)) was calculated to be 12.5%.
The as-sintered dogbone specimens were used for tensiletests without any preparation. The mechanical properties ofunimodal 17-4 PH stainless steel feedstock specimens are
X-ray computed microtomography studies of MIM and DPR parts
975VOLUME 116 �
Table II
17-4 PH ≤ 0.5 ≤ 0.3 3.0–5.0 15.5–17.5 3.0–5.0 0.15–0.45 Bal.

X-ray computed microtomography studies of MIM and DPR parts
reported elsewhere (Seerane, Ndlangamandla and Machaka,2016). Table III summarizes the mechanical properties ofmetal-injection-moulded 17-4 PH stainless steel obtained inthis study. The values are well above minimum standardstipulated values (MPIF, 2016; ASTM International, 2005).
The densities of the sintered specimens were determinedaccording to ASTM B311 (Archimedes method). Specimenhardness was determined at room temperature using theVickers hardness testing procedure.
Unless purposely intended (Chen et al., 2016), sintered MIMparts are typically sintered to high density (95–99%); a smallamount of residual porosity may arise from (a combinationof) poorly formulated feedstock, the debinding process, gasentrapment during sintering and/or incomplete sintering ofmetal particles (German and Bose, 1977; German. 2013;Machaka, Seerane and Chikwanda, 2014).
Figure 3 to Figure 5 illustrate the XCT 3D analysis ofreconstructed green, solvent-debound and sintered MIMparts. The three steps conducted in each case involved (a)reconstructing the 3D surface from raw data, (b) histogramsegmentation and identification of the open pores and interiorpores and inclusions from the background and (c) separatingthe various individual components identified in Figure 2 forstructural properties such as relative volume, spatial distri-bution, domain size and shape distributions, specific area,interconnectedness and spatial orientation.
The reconstructed surface in Figure 3a shows the holisticsurface integrity of the green part and can also be used as aversatile inspection tool (for obvious moulding defects andresolvable surface porosity) and for dimensionalmeasurements. In Figure 3b, the 3D distribution surface andinterior pores in the green part volume are determined, whilein Figure 3c the identified defects are analysed in isolation.The results aid the visualisation of the size and spatial distri-bution of injection moulding defects. A maximum defectvolume of approximately 0.05 mm3 was identified; however,no MIM-specific standards have been developed to determineif such defect volumes are reparable in subsequent steps. It ishas been shown that some defects do occur in green partsand these defects can be avoided or controlled by adoptinggood tooling design and optimizing injection mouldingparameters (see Nor et al., 2009).
Figure 4a shows a reconstructed 3D surface image of thesolvent-debound part that shows no evidence of surfaceporosity. From Figure 3a, it is also apparent that the shapeform and dimensions of the green part are largely retained inthe brown part. The visualization of the debinding defectsand resulting surface porosity shows a two-fold increase inthe relative pore density to approximately 0.10 mm3 inFigures 4b and 4c. This observation is expected since theextraction of the soluble binder during solvent debinding isknown to be the source of porosity in the brown part (Ji et al.,2001; Tsai and Chen, 1995). Hwang, Shu and Lee (2005)have also demonstrated that pore channels develop and theaverage pore size increases as solvent debinding proceeds.
Figure 4b shows remarkable differences between thesurface regions and the interior due to varying materialdensity. This difference can be used to determine porositydistribution towards the sample surfaces arising from thedevelopment of pore channels and increasing average poresize during solvent debinding (Hwang, Shu and Lee, 2005).
Perhaps the most compelling evidence for the use oftomographical probing techniques to non-destructivelyinvestigate the 3D internal structure of MIM-prepared 17-4 PH stainless steel is shown in the analysis of thesintered part illustrated in Figure 5. Figure 5a shows areconstructed 3D surface image of a selected sintered partexhibiting only some occurrences of open pores. Figure 5band Figure 5c however reveal the existence of an uncharac-teristically large irregular subsurface feature with a maximumdefect volume of approximately 1.00 mm3.
�
976 VOLUME 116
Table III
This study 7.6 661 838 6.4 308#Standards 7.5 650 790 4.0 279
# indicates that the hardness values were converted from HRC to HV inaccordance with ASTM A370 – 03A (ASTM International, 2003)

MIM-fabricated 17-4 PH stainless steel parts are intrin-sically susceptible to porosity (Murray et al., 2011; James,2015) which arises from innumerable sources during MIMprocessing. However, after sintering, the pores are typicallynear-spherical in morphology; see Figure 6a for example. Theorigin of the ‘uncharacteristically large irregular pore’ featureis attributed to either incomplete die cavity filling during theinjection moulding stage or (most probably) a combination ofpore formation due to gas entrapment (thermal debindingevolved products) during sintering (German and Bose, 1977)and the shrinkage porosity, since it is located in the thickestsection of the part. Such features are uncommon and aretherefore seldom reported. The observed open surface poresafter sintering can be attributed to either the residual porosityfrom solvent debinding, voids remaining after thermaldebinding, or the evaporation of alloy elements (chromiumand manganese) due to their high vapour pressure duringhigh-temperature sintering (Murray et al., 2011).
A typical secondary electron SEM micrograph of the as-polished 17-4 PH sintered specimen is presented in Figure6a. The pores are evenly distributed and primarily sphericalin morphology; indicating that at 1300°C, sinteringprogressed to its final possible stages.
The pore sizes and distribution were determined byevaluating the SEM micrographs using ImageJ software(Schindelin et al., 2015). The pore size distribution
histogram obtained from comprehensive image analysis ispresented in Figure 6b. The pore sizes observed exhibit alognormal peak (distribution mode approx. 1.0 m) with thelargest pores typically less than 4.5 m in diameter. Thelargest pore sizes obtained from the image analysis are muchsmaller than those detected by the lowest resolution of 10 mthat can be achieved by the XCT machine even after havingcompromised on the size of the piece to be analysed.
Ti-HDH 100 mesh (-150 m) powders were supplied byChengdu Huarui Industrial Co., Ltd in China. The powderparticle sizes and morphology are reported elsewhere(Motsai, 2016). The powders were roll compacted. Figure 7shows photographs of rolled strips that are 20, 50 and 100 mm wide. By observation, the rolled strips demonstrate
X-ray computed microtomography studies of MIM and DPR parts
VOLUME 116 977 �

X-ray computed microtomography studies of MIM and DPR parts
good densification without exhibiting obvious signs ofwarping, cracking and alligatoring, which are typical rollingdefects (Park et al., 2012; Joo et al., 2005).
Table IV summarizes the properties of the green (rolled)and brown (sintered) Ti-HDH strips. The hardness values forthe higher density 20 mm strips were closer to the commer-cially pure Ti grade 4. The hardness values were reduced forthe lower density 50 mm and 100 mm strips. A reduction inhardness has been observed in powder metallurgycomponents and is due to the amount of pores in thecomponents (Dutta and Bose, 2012). The density resultsshow an increase after sintering. However, full density wasnot achieved by sintering for all the strips.
Sintering of the strips in Figure 7 was carried out. Results ofthe sintering studies showed that full density was notachieved at the selected sintering condition used. Thesemeasured densities do not provide any information regardingthe position and distribution of the pores within the strips.Therefore, microscopy was carried out to determine the distri-bution of porosity within the strips. The 20 mm strip was cutin half along the rolling direction, mounted and polished.Figure 8a shows a micrograph taken to include the edge ofthe strip. It can be seen that the strip had a lower density atthe edge (right side of the micrograph) which increasedtowards the centre (left side of micrograph) of the strip. Forsamples larger than 20 mm, several samples were cut fromthe edge, midway between edge and centre and centre of thestrips. Figure 9b and 9c show the micrographs of the 100 mm wide strip from the centre and the edge of the stripsrespectively. It is clear from the micrographs that the porositypattern is similar to that of the 20 mm strips was observed,with the density being higher at the centre and lower at theedge of the compact.
It was also observed that after sintering, warping of thestrips occurred. The microscopy studies showed that thesintered strips had non-uniform density across the width,which implies non-uniform density in the green strips aswell. Density variations within the green strip are known tocreate residual stresses and cause different densification ratesduring sintering, which ultimately cause the dimensionaldistortions (Khoei, 2995). It is therefore plausible that theobserved dimensional distortions (warping) of the sinteredstrips in this study are a consequence of the non-uniformdensity within the strips.
In order to understand the extent of density variations in theDPR strips, an alternative XCT scanning technique was used.
The XCT scanning technique was evaluated for use as a non-destructive test for detecting non-uniform densities, with theadditional benefit of elimination of the tedious microscopystudies required to map DPR strips that are long and wide.
By way of illustration, Figure 9 shows the visualization of3D XCT data on a section of the 20 mm wide sintered rolledstrip. Similarly to the MIM XCT results shown in Figure 3,three analysis steps were conducted in each case involving(a) reconstructing the 3D surface, (b) the identification of theopen pores, interior pores and inclusions and (c) isolating theopen pores, interior pores and inclusions identified in (b) forstructural properties and visualisation
The reconstructed surface in Figure 9a shows the surfacedefects such as chipping of the strip at the edges and thedifferent grey levels characteristic of the varying densities. Noother rolling defects are detected in the strip. Figure 9b showsthe 3D distribution of pores in the sintered volume whileFigure 9c shows the pores in isolation. The result confirmsthe presence of density variations in the sintered DPR stripsas shown by the microscopy studies. Furthermore, XCT wasable to show that the pores are concentrated at the edges ofthe strips, with some detected in the transverse direction torolling as is typical of compacts produced by non-optimalrolling conditions. Using traditional techniques to detect thesedensity changes, sections of the strips are cut up, mountedand polished to look for porosity differences in the compacts.This process is destructive and tedious. In this study the
�
978 VOLUME 116
Table IV
20 mm wide strip 3.7 4.3 26850 mm wide strip 3.2 4.0 185100 mm wide strip 3.2 4.0 180ASTM CP Grade 4 Ti 4.51 280
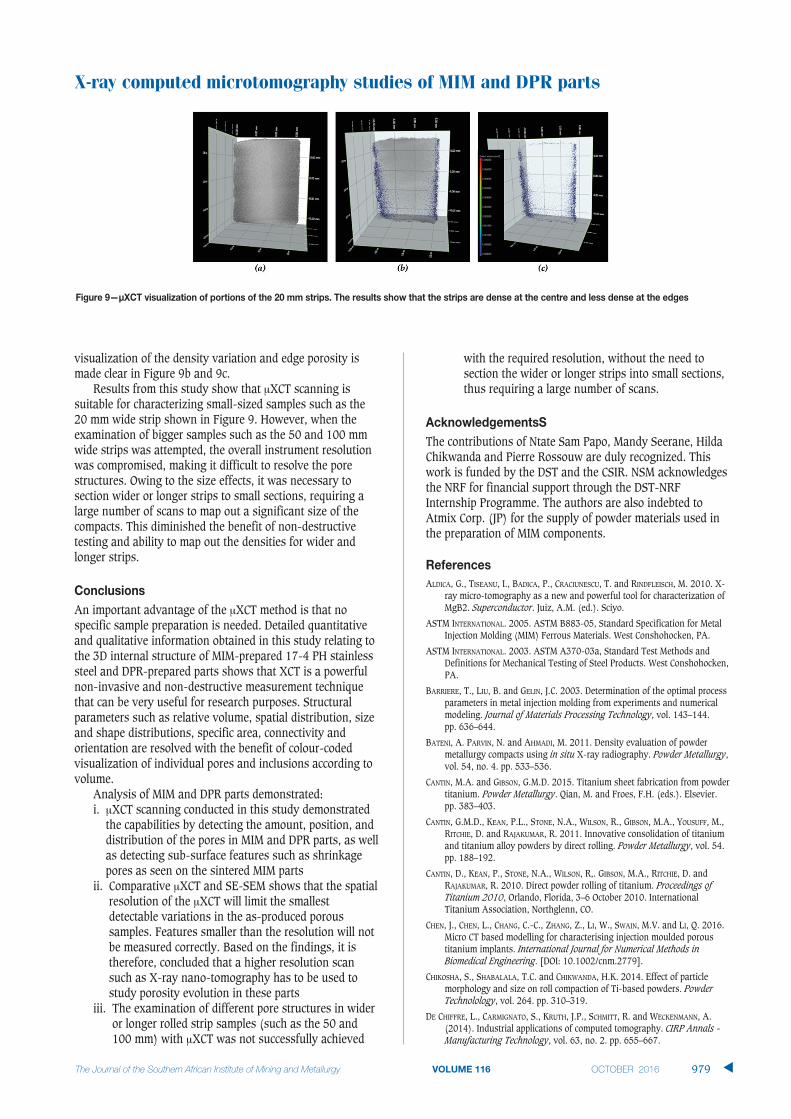
visualization of the density variation and edge porosity ismade clear in Figure 9b and 9c.
Results from this study show that XCT scanning issuitable for characterizing small-sized samples such as the20 mm wide strip shown in Figure 9. However, when theexamination of bigger samples such as the 50 and 100 mmwide strips was attempted, the overall instrument resolutionwas compromised, making it difficult to resolve the porestructures. Owing to the size effects, it was necessary tosection wider or longer strips to small sections, requiring alarge number of scans to map out a significant size of thecompacts. This diminished the benefit of non-destructivetesting and ability to map out the densities for wider andlonger strips.
An important advantage of the XCT method is that nospecific sample preparation is needed. Detailed quantitativeand qualitative information obtained in this study relating tothe 3D internal structure of MIM-prepared 17-4 PH stainlesssteel and DPR-prepared parts shows that XCT is a powerfulnon-invasive and non-destructive measurement techniquethat can be very useful for research purposes. Structuralparameters such as relative volume, spatial distribution, sizeand shape distributions, specific area, connectivity andorientation are resolved with the benefit of colour-codedvisualization of individual pores and inclusions according tovolume.
Analysis of MIM and DPR parts demonstrated:i. XCT scanning conducted in this study demonstrated
the capabilities by detecting the amount, position, anddistribution of the pores in MIM and DPR parts, as wellas detecting sub-surface features such as shrinkagepores as seen on the sintered MIM parts
ii. Comparative XCT and SE-SEM shows that the spatialresolution of the XCT will limit the smallestdetectable variations in the as-produced poroussamples. Features smaller than the resolution will notbe measured correctly. Based on the findings, it istherefore, concluded that a higher resolution scansuch as X-ray nano-tomography has to be used tostudy porosity evolution in these parts
iii. The examination of different pore structures in wideror longer rolled strip samples (such as the 50 and 100 mm) with XCT was not successfully achieved
with the required resolution, without the need tosection the wider or longer strips into small sections,thus requiring a large number of scans.
The contributions of Ntate Sam Papo, Mandy Seerane, HildaChikwanda and Pierre Rossouw are duly recognized. Thiswork is funded by the DST and the CSIR. NSM acknowledgesthe NRF for financial support through the DST-NRFInternship Programme. The authors are also indebted toAtmix Corp. (JP) for the supply of powder materials used inthe preparation of MIM components.
ALDICA, G., TISEANU, I., BADICA, P., CRACIUNESCU, T. and RINDFLEISCH, M. 2010. X-ray micro-tomography as a new and powerful tool for characterization ofMgB2. Superconductor. Juiz, A.M. (ed.). Sciyo.
ASTM INTERNATIONAL. 2005. ASTM B883-05, Standard Specification for MetalInjection Molding (MIM) Ferrous Materials. West Conshohocken, PA.
ASTM INTERNATIONAL. 2003. ASTM A370-03a, Standard Test Methods andDefinitions for Mechanical Testing of Steel Products. West Conshohocken,PA.
BARRIERE, T., LIU, B. and GELIN, J.C. 2003. Determination of the optimal processparameters in metal injection molding from experiments and numericalmodeling. Journal of Materials Processing Technology, vol. 143–144.pp. 636–644.
BATENI, A. PARVIN, N. and AHMADI, M. 2011. Density evaluation of powdermetallurgy compacts using in situ X-ray radiography. Powder Metallurgy,vol. 54, no. 4. pp. 533–536.
CANTIN, M.A. and GIBSON, G.M.D. 2015. Titanium sheet fabrication from powdertitanium. Powder Metallurgy. Qian, M. and Froes, F.H. (eds.). Elsevier. pp. 383–403.
CANTIN, G.M.D., KEAN, P.L., STONE, N.A., WILSON, R., GIBSON, M.A., YOUSUFF, M.,RITCHIE, D. and RAJAKUMAR, R. 2011. Innovative consolidation of titaniumand titanium alloy powders by direct rolling. Powder Metallurgy, vol. 54.pp. 188–192.
CANTIN, D., KEAN, P., STONE, N.A., WILSON, R,. GIBSON, M.A., RITCHIE, D. andRAJAKUMAR, R. 2010. Direct powder rolling of titanium. Proceedings ofTitanium 2010, Orlando, Florida, 3–6 October 2010. InternationalTitanium Association, Northglenn, CO.
CHEN, J., CHEN, L., CHANG, C.-C., ZHANG, Z., LI, W., SWAIN, M.V. and LI, Q. 2016.Micro CT based modelling for characterising injection moulded poroustitanium implants. International Journal for Numerical Methods inBiomedical Engineering. [DOI: 10.1002/cnm.2779].
CHIKOSHA, S., SHABALALA, T.C. and CHIKWANDA, H.K. 2014. Effect of particlemorphology and size on roll compaction of Ti-based powders. PowderTechnolology, vol. 264. pp. 310–319.
DE CHIFFRE, L., CARMIGNATO, S., KRUTH, J.P., SCHMITT, R. and WECKENMANN, A.(2014). Industrial applications of computed tomography. CIRP Annals -Manufacturing Technology, vol. 63, no. 2. pp. 655–667.
X-ray computed microtomography studies of MIM and DPR parts
VOLUME 116 979 �
X-ray computed microtomography studies of MIM and DPR parts
DU PLESSIS, A., LE ROUX, S.G., BOOYSEN, G. and ELS, J. 2016. Directionality ofcavities and porosity formation in powder-bed laser additive manufac-turing of metal components investigated using X-ray tomography. 3DPrinting and Additive Manufacturing, vol. 3, no. 1. pp. 48–55.
DUTTA, G. and BOSE, D. 2012. Effect of sintering temperature on density,porosity and hardness of a powder metallurgy component. InternationalJournal of Emerging Technology and Advanced Engineering, vol. 2, no. 8. pp. 121–123.
FANG, W., HE, X., ZHANG, R., YANG, S. and QU, X. 2014. The effects of fillingpatterns on the powder–binder separation in powder injection molding.Powder Technolology, vol. 256. pp. 367–376.
FROES, F.H., MASHL, S.J., HEBEISEN, J.C., MOXSON, V.S. and DUZ, V.A. 2004. Thetechnologies of titanium powder metallurgy. JOM, vol. 56. pp. 46–48.
GERMAN, R. 2013. Progress in titanium metal powder injection molding.Materials, vol. 6. pp. 3641–3662.
GERMAN, R.M. 1990. Powder injection molding. Metal Powder IndustriesFederation, Princeton, NJ.
GERMAN, R.M. and BOSE, A. 1977. Injection Molding of Metals and Ceramics.Metal Powder Industries Federation Princeton, NJ.
HELDELE, R., RATH, S., MERZ, L., BUTZBACH, R., HAGELSTEIN, M. and HAUSSELT, J.2006. X-ray tomography of powder injection moulded micro parts usingsynchrotron radiation. Nuclear Instruments and Methods in PhysicsResearch Section B: Beam Interactions with Materials and Atoms, vol. 246, no. 1. pp. 211–216.
HOFFMAN, J.W. and BEER, F.C.D.E. 2012. Characteristics of the micro-focus X-ray tomography system at the MIXRAD facility at NECSA in South Africa.Proceedings of the 18th World Conference on Nondestructive Testing,Durban, South Africa, 16–20 April 2012. South African Institute for Non-Destructive Testing. http://www.ndt.net/article/wcndt2012/papers/37_wcndtfinal00037.pdf
HWANG, P.S.K..S., SHU, G.J. and LEE, H.J. 2005. Solvent debinding behavior ofpowder injection molded components prepared from powders withdifferent particle sizes. Metallurgical and Materials Transactions,vol. 36no. 1. pp. 161–167.
JAMES, W.B. 2015. ASM Handbook, vol. 7. 922 p.
JOO, S.H., CHANG, H.J., BANG, W.H., HAN, H.N. anD OH, K.H. 2005. Analysis ofalligatoring behavior during roll pressing of DRI powder with flat rollerand indentation-type roller. Materials Science Forum, vol. 475–479. pp. 3223–3226.
KARA , Ł. and MATULA, G. 2015. Review of innovation in using X-raytomography for non-destructing analysing of the green parts. Journal ofAchievements in Materials and Manufacturing Engineering, vol. 73, no. 2. 139 p.
KHOEI, A. 2005. Computational Plasticity in Powder Forming Processes.Elsevier, Tehran.
KOHN, H.W. 1972. Non-destructive testing. Journal of General Education, vol.24. pp. 176–178.
LI, Y., LI, L. and KHALIL, K.A. 2007. Effect of powder loading on metal injectionmolding stainless steels. Journal of Materials Processing Technology, vol. 183. 432 p.
JI, C.H., LOH, N.H. KHOR, K.A. and TOR, S.B. 2001. Sintering study of 316Lstainless steel metal injection molding parts using Taguchi method: finaldensity. Materials. Science and Engineering A, vol. 311. pp. 74–82.
LUNEL, M. 2013. Structure Characterisation of catalysts using X-ray micro-computed tomography, PhD thesis, University of Birmingham, UnitedKingdom.
MA, J., LI, A. and TANG, H. 2016. Study on sintering mechanism of stainlesssteel fiber felts by X-ray computed tomography. Metals, vol. 6, no. 1. 18 p.
MACHAKA, R. and CHIKWANDA, H.K. 2015. Kinetics of titanium metal injectionmoulding feedstock thermal debinding. Proceedings of the SeventhInternational Light Metals Technology Conference, (LMT 2015), PortElizabeth, South Africa, 27–29 July 2015. Chikwanda, H.K..and Chikosha,S. (eds.). pp. 1–6.
MACHAKA, R., SEERANE, M. and CHIKWANDA, H.K. 2014. Binder development formetal injection moulding: a CSIR perspective. Advances in PowderMetallurgy and Particulate Materials - 2014. Proceedings of the 2014World Congress on Powder Metallurgy and Particulate Materials, PM2014, Orlando, Florida, 18–22 May. Metal Powder Industries Federation.pp. 43–58.
MAIRE, E., BUFFIÈRE, J.Y., SALVO, L., BLANDIN, J.J., LUDWIG, W. and LÉTANG, J.M.(2001). X-ray micro-tomography an attractive characterisation techniquein materials science. Advanced Engineering Materials, vol. 3, no. 8. pp. 539–546.
MARTIN, P., HASKINS, J., THOMAS, G. and DOLAN, K. 2003. Advanced NDEtechniques for powder metal components. Proceedings of the InternationalConference on Powder Metallurgy and Particulate Materials (PM2TEC2003), Las Vegas, Nevada, 8–12 June 2003. Metal Powder IndustriesFederation, Princeton, NJ.
MOTSAI, T.M., CHIKOSHA, S., BHERO, S. and CHIKWANDA, H.K. 2016. Investigationof pressing and sintering of Ti-HDH powder. Proceedings of Ferrous 2016,Ferrous and Base Metals Development Network (FMDN), (In Press).
MPIF. 2016. MPIF Standard 35, Materials Standards for Metal Injection MoldedParts. 2016 edn. Metal Powder Industries Federation (MPIF), Princeton,NJ.
MURRAY, K., COLEMAN, A.J., TINGSKOG, T.A. and WHYCHELL D.T. SR. 2011. Effect ofparticle size distribution on processing and properties of MIM 17-4PH.International Journal of Powder Metallurgy, vol. 47, no. 4. pp. 21–28.
MUTINA, A. and KOROTEEV, D. 2012. Using X-ray microtomography for the threedimensional mapping of minerals. Microscopy and Analysis, vol. 26, no. 2. pp. 7–12.
NOR, N.H.M., MUHAMAD, N., ISMAIL, M.H., JAMALUDIN, K.R., AHMAD, S. andIBRAHIM, M.H.I. 2009. Flow behaviour to determine the defects of greenpart in metal injection molding. International Journal of Mechanical andMaterials Engineering, vol. 4. pp. 70–75.
O’BRIEN, R.C. and JAMES, W.B. 1988. A review of nondestructive testingmethods and their applicability to powder metallurgy processing. MPIFSeminar on Prevention and Detection of Cracks in Ferrous P/M Pads,International Powder Metallurgy Conference and Exhibition. pp. 1–17.
PARK, N.K., LEE, C.H., KIM, J.H. and HONG, J.K. 2012. Characteristics of powder-rolled and sintered sheets made from HDH Ti powders. Key EngineeringMaterials, vol. 520. pp. 281–288.
PETERSON, S. 2010. Investigation of the Hot deformation of Sintered TitaniumCompacts Produced from Direct reduction Powder. Masters thesis,University of Cape Town, South Africa.
Qian, Mn. 2010. Cold compaction and sintering of titanium and its alloys fornear-net- shape or preform fabrication. International Journal of PowderMetallurgy, vol. 46, no. 5. pp. 29–44.
RO, D.H., TOAZ, M.W. and MOXSON, V.S. 1983. The direct powder-rolling processfor producing thin metal strip. JOM, vol. 35, no. 1. pp. 34–39.
SCHINDELIN, J., RUEDEN, C.T., HINER, M.C. and ELICEIRI, K.W. 2015. The ImageJecosystem: An open platform for biomedical image analysis. MolecularReproduction and Development, vol. 82, nos. 7–8. pp. 518–529.
SEERANE, M., CHIKWANDA, H. and MACHAKA, R. 2015. Determination of optimumprocess for thermal debinding and sintering using Taguchi method.Materials Science Forum, vol. 828–829. 138 pp.
SEERANE, M., NDLANGAMANDLA, P. and MACHAKA, R. 2016. The influence ofparticle size distribution on the properties of metal-injection-moulded 17-4 PH stainless steel. Proceedings of Ferrous 2016, Ferrous and BaseMetals Development Network (FMDN), (In Press).
SOTOMAYOR, M.E., VÁREZ, A. and LEVENFELD, B. 2010. Influence of powder sizedistribution on rheological properties of 316L powder injection mouldingfeedstocks. Powder Technology, vol. 200, nos. 1–2. pp. 30–36.
TAMMAS-WILLIAMS, S., ZHAO, H., LÉONARD, F., DERGUTI, F., TODD, I. and PRANGNELL,P.B. 2015. XCT analysis of the influence of melt strategies on defectpopulation in Ti–6Al–4V components manufactured by selective electronbeam melting. Materials Characterization, vol. 102. pp. 47–61.
TSAI, D.S. and CHEN, W.W. 1995. Solvent debinding kinetics of alumina greenbodies by powder injection molding. Ceramics International, vol. 21, no. 4.pp. 257–264.
WEBER, O., RACK, A., REDENBACH, C., SCHULZ, M. and WIRJADI, O. 2011.Micropowder injection molding: investigation of powder-binder separationusing synchrotron-based microtomography and 3D image analysis.Journal of Materials Science,vol. 46, no. 10. pp. 3568–3573.
YANG, S.-D., ZHANG, R.-J. and. QU, X.-H. (2015a). X-ray tomography analysis ofaluminum alloy powder compaction. Rare Metals. pp. 1–7.
YANG, S., ZHANG, R. and QU, X. 2015b. Optimization and evaluation of metalinjection molding by using X-ray tomography. MatererialsCharacterization, vol. 104. pp. 107–114. �
�
980 VOLUME 116