v9 n2 page 75.pdf - isedj
TRANSCRIPT

Volume 9, No. 2 June 2011
ISSN: 1545-679X
Information Systems
Education Journal
In this issue: 4. Are Password Management Applications Viable? An Analysis of User Training and
Reactions Mark Ciampa, Western Kentucky University
14 A ‘Rainmaker’ Process for Developing Internet-based Retail Businesses Alan S. Abrahams, Virginia Tech
Tirna Singh, Virginia Tech
27 Texting and the Efficacy of Mnemonics: Is Too Much Texting Detrimental?
Randy Ryker, Nicholls State University
Chuck Viosca, Nicholls State University
Shari Lawrence, Nicholls State University
Betty Kleen, Nicholls State University
34 Cloud Computing in the Curricula of Schools of Computer Science and
Information Systems
James P. Lawler, Pace University
55 IS/IT Education vs. Business Education: The Plight of Social Collapse in
Technical Business Environments
Brian Hall, Champlain College
65 Incorporating Capstone Courses in Programs Based upon IS2010 Model
Curriculum
Ken Surendran, Southeast Missouri State University
Dana Schwieger, Southeast Missouri State University
75 Predicting Success in the Introduction to Computers Course: GPA vs.
Student’s Self-Efficacy Scores
Joseph T. Baxter, Dalton State College
Bruce Hungerford, Dalton State College
Marilyn M. Helms, Dalton State College
95 Impact of Pre-Grading / Resubmission of Projects on Test Grades in an
Introductory Computer Literacy Course
Thomas N. Janicki, University of North Carolina Wilmington
Judith Gebauer, University of North Carolina Wilmington
Ulku Yaylacicegi, University of North Carolina Wilmington
101 Design, The “Straw” Missing From the “Bricks” of IS Curricula
Leslie J. Waguespack, Bentley University
Information Systems Education Journal (ISEDJ) 9 (2) June 2011
©2011 EDSIG (Education Special Interest Group of the AITP) Page 2
www.aitp-edsig.org /www.isedj.org
The Information Systems Education Journal (ISEDJ) is a double-blind peer-reviewed academic journal published by EDSIG, the Education Special Interest Group of AITP, the Association of Information Technology Professionals (Chicago, Illinois). Publishing frequency is quarterly. The first year of publication is 2003.
ISEDJ is published online (http://isedjorg) in connection with ISECON, the Information Systems Education Conference, which is also double-blind peer reviewed. Our sister publication, the Proceedings of ISECON (http://isecon.org) features all papers, panels, workshops, and presentations from the conference.
The journal acceptance review process involves a minimum of three double-blind peer reviews, where both the reviewer is not aware of the identities of the authors and the authors are not aware of the identities of the reviewers. The initial reviews happen before the conference. At that point papers are divided into award papers (top 15%), other journal papers (top 30%), unsettled papers, and non-journal papers. The unsettled papers are subjected to a second round of blind peer review to establish whether they will be accepted to the journal or not. Those papers that are deemed of sufficient quality are accepted for publication in the ISEDJ journal. Currently the target acceptance rate for the journal is about 45%.
Information Systems Education Journal is pleased to be listed in the 1st Edition of Cabell's Directory of Publishing Opportunities in Educational Technology and Library Science, in both the electronic and printed editions. Questions should be addressed to the editor at
[email protected] or the publisher at [email protected].
2011 AITP Education Special Interest Group (EDSIG) Board of Directors
Alan Peslak
Penn State University
President 2011
Wendy Ceccucci
Quinnipiac University
Vice President
Tom Janicki
Univ of NC Wilmington
President 2009-2010
Scott Hunsinger Appalachian State University
Membership Director
Michael Smith High Point University
Secretary
Brenda McAleer Univ of Maine Augusta
Treasurer
Michael Battig Saint Michael’s College
Director
George Nezlek Grand Valley State University
Director
Leslie J. Waguespack Jr Bentley University
Director
Mary Lind North Carolina A&T St Univ
Director
Li-Jen Shannon Sam Houston State Univ
Director
S. E. Kruck James Madison University
JISE Editor
Kevin Jetton Texas State University
FITE Liaison
Copyright © 2011 by the Education Special Interest Group (EDSIG) of the Association of Information Technology Professionals (AITP). Permission to make digital or hard copies of all or part of this journal for personal or classroom use is granted without fee provided that the copies are not made or distributed for profit or commercial use. All copies must bear this notice and full citation. Permission from the Editor is required to post to servers, redistribute to lists, or utilize in a for-profit or commercial use. Permission requests should be sent to Wendy Ceccucci, Editor, [email protected].

Information Systems Education Journal (ISEDJ) 9 (2) June 2011
©2011 EDSIG (Education Special Interest Group of the AITP) Page 3
www.aitp-edsig.org /www.isedj.org
Information Systems
Education Journal
Editors
Wendy Ceccucci
Senior Editor
Quinnipiac University
Thomas Janicki Publisher
Univ NC Wilmington
Don Colton Emeritus Editor
Brigham Young University Hawaii
Nita Brooks
Associate Editor
Middle Tennessee State University
George Nezlek Associate Editor
Grand Valley State University
Mike Smith Associate Editor - Cases
High Point University
ISEDJ Editorial Board
Alan Abrahams Virginia Tech
Mike Battig Saint Michael’s College Gerald DeHondt II Grand Valley State University Janet Helwig Dominican University
Mark Jones Lock Haven University Cynthia Martincic Saint Vincent College
Brenda McAleer University of Maine at Augusta
Monica Parzinger St. Mary’s University San Antonio Doncho Petkov Eastern Connecticut State Univ.
Samuel Sambasivam Azusa Pacific University
Mark Segall Metropolitan State College of
Denver
Li-Jen Shannon Sam Houston State University Karthikeyan Umapathy University of North Florida
Laurie Werner Miami University
Bruce White Quinnipiac University
Charles Woratschek Robert Morris University.
Peter Y. Wu Robert Morris University

Information Systems Education Journal (ISEDJ) 9 (2) June 2011
©2011 EDSIG (Education Special Interest Group of the AITP) Page 75 www.aitp-edsig.org /www.isedj.org
Predicting Success in the Introduction to
Computers Course: GPA vs. Student’s Self-Efficacy Scores
Joseph T. Baxter
Management Information Systems [email protected]
Bruce Hungerford
Management Information Systems [email protected]
Marilyn M. Helms Management
Dalton State College Dalton, GA 30720, USA
ABSTRACT
This study examines whether students’ final grades in an introductory college business computing class correlate with their self-reported computer skill levels provided at the beginning of the course. While significant research effort has been devoted to studying the effects of student self-efficacy on course outcomes and studying the moderating effects of various demographic variables (such as age and gender) and experience variables (such as computer access at home), there is a dearth of studies examining a student’s grade-point-average (GPA) as a predictor of final course success in the introductory computing class. For the fundamentals of computer applications course at the medium-
size state college, student self-perceptions of their own computer abilities explained very little of the variation in the final course grade outcomes. GPA, however, was a more powerful predictor (adjusted R2 = 0.365) of the final class grade as well as the students’ grades on individual course modules. Students’ perceptions of their own computer abilities added very little additional predictive value, increasing the full model’s adjusted R2 only to 0.393. Given the predictive power of GPA relative to course success, discussion is included concerning ways to use this information to offer additional
assistance to lower performing students. The study contributes to the existing literature and refutes
the value of self-assessment of skills and abilities as a sole predictor of success. Although the literature has suggested non-traditional or adult students may have more difficulty with the computer course, our findings do not support this. Areas for future research are suggested.
Keywords: information literacy, business student, introduction to computers, self-efficacy, computer literacy

Information Systems Education Journal (ISEDJ) 9 (2) June 2011
©2011 EDSIG (Education Special Interest Group of the AITP) Page 76 www.aitp-edsig.org /www.isedj.org
1. INTRODUCTION
Information literacy research is growing due to the Internet, digital media, and the pervasiveness of personal computers. With
electronic media and devices proliferating, what encompasses computer literacy and fluency becomes a changing construct and universal definitions still do not exist. McDonald (2004) agrees the definition of computer literacy continues to change as technological innovations are adopted by the marketplace. There is broad
agreement, however, that college students need computer and information literacy as part of their studies to be competitive as graduates in
an environment that increasingly relies on information technology.
The challenge for universities is to ensure their
students meet a minimum level of competency when using constantly changing technology. McDonald (2004) further suggests universities incorporate flexible testing tools to measure basic computer skills such as an Internet-based, interactive skills test. Hawkins and Oblinger (2006) indicate technology is nearly ubiquitous
on campus; and, although conversations about the digital divide are relatively uncommon today, it remains incorrect to assume all students own a computer or have an Internet connection.
2. LITERATURE REVIEW
Colleges have traditionally used the freshman- or sophomore-level course in microcomputer
applications/introduction to computers to accomplish basic computer literacy. The purpose of this research is to determine if predictors exist for student success in this course. Most studies focusing on students’ skill and success in the introduction to computers
course at the college level examine a variety of experience variables, demographic variables, and students’ self-reported skill levels on a variety of microcomputer applications. This latter variable is termed self-efficacy.
Self-Efficacy
Self-efficacy is a social cognitive construct
popularized in the 1970s and later formally defined by Bandura (1986) as “people’s judgments of their capabilities to organize and execute courses of action required to attain designated types of performances” (p. 39). Bandura (1986) argued beliefs about efficacy influence a person’s choice of activities, the level
of effort an individual is willing to expend, their persistence even in the presence of difficulties,
and their overall performance. Self-efficacy remains a key concept in social cognitive theory.
Computer Self-Efficacy
Computer self-efficacy is a derivation of self-
efficacy in general (Bandura, 1986, 1997) and has been defined as "...a judgment of one's ability to use a computer" (Compeau & Higgins, 1995, p. 192). It has also been studied and found to be a determinant of computer-related ability and the use of computers (Hasan, 2003). Hasan and Jafar (2004) empirically examined
computer-learning performance and used the definition of self-efficacy as referring to an individual’s judgment of their own capabilities to
organize and execute courses of action to attain designated performance.
Compeau, Higgins, and Huff (1999) found that
those individuals with a higher computer self-efficacy participate in computer-related activities, expect success in these activities, persist and employ effective coping behaviors when encountering difficulty, and exhibit higher levels of performance than individuals low in computer self-efficacy. Karsten and Roth
(1998a) found that the construct captures the competence and confidence management information systems (MIS) professors hope to provide their students. The construct has been studied in depth by a number of MIS researchers (see Agarwal, Sambamurthy, & Stair, 2000;
Marakas, Johnson, & Clay, 2007; Marakas, Yi, &
Johnson, 1998).
Students gain self-efficacy from a variety of sources (Bandura, 1997), including their personal successes and failures, observing the successes and failures of friends and classmates, encouragement, and confidence or anxiety when
faced with tasks. Computer self-efficacy is dynamic, changing as students gain new information and computer-related experiences (Gist & Mitchell, 1992), but Karsten and Roth (1998b) found that it is the kind of experience, and not just the experience per se, that changes perceptions of computer self-efficacy. Marakas,
Yi, and Johnson (1998) studied the construct
and separated task-specific measures of computer self-efficacy from general computer self-efficacy. They defined the task-specific measures as "...an individual's perception of efficacy in performing specific computer-related tasks within the domain of general computing"
(Marakas, Yi, & Johnson, 1998, p. 128).
Hasan (2006a) further described the construct as a judgment of efficacy (or success or skill) in

Information Systems Education Journal (ISEDJ) 9 (2) June 2011
©2011 EDSIG (Education Special Interest Group of the AITP) Page 77 www.aitp-edsig.org /www.isedj.org
performing a well-defined computing task using a particular application, including word processing, spreadsheet, or database programs. Qutami and Abu-Jaber (1997) studied gender
and cognitive learning styles to determine students’ self-efficacy in computer skills. Shiue (2003) studied the effect of cognitive learning styles and prior computer experience on students’ computer self-efficacy in computer literacy courses, while Albion (2001) used pre- and post-tests and found that students’ self-
efficacy, after completing computing courses, was influenced by their personal ownership of computers. Hsu and Huang (2006) found that computer use and interest had a significant, direct effect on student computer self-efficacy.
They further found that computers at home and
work had indirect effects on computer self-efficacy as did trend motivations and interests. Computers are pervasive in business and education, and Buche, Davis, and Vician (2007) agree it would be easy to assume that all individuals embrace technology. However, their study found that 30 to 40 percent of individuals
experience some level of computer anxiety.
Self-Efficacy, Computer Literacy, and Demographics
Studies of the first computer course have explored gender differences in self-efficacy and attitudes toward computers (Busch, 1995).
Busch (1996) added group composition and
cooperation variables to his subsequent study. Introductory information systems course-related factors were also studied as indicators of computer self-efficacy (Karsten & Roth, 1998a), while Houle (1996) studied student differences (including a variety of demographics
characteristics) in his research on understanding student differences in computer skills courses.
Davis and Davis (2007) surveyed 58 students in technology teacher education and training to determine self-perception of their competency in five constructs made up of 43 elements related to personal computer knowledge and skills.
While gender did not make a difference, they did find a statistically significant difference between
the perceived competencies of the participants based on age range, with students 35 years old or younger perceiving a higher level of competence compared to those 36 years old or older. Further analysis within construct variables
revealed instances of statistically significant differences based on gender and age range.
Divaris, Polychronopoulou, and Mattheos (2007) agree an accurate assessment of the computer
skills of students is a pre-requisite for success in other areas, including e-learning. They studied 50 post-graduate students and calculated competence scores and gathered socio-
demographic characteristics. Using both descriptive statistics and linear regression modeling, the authors found that competence scores were normally distributed but that gender and use of e-mail were significant predictors of computer literacy.
Students believe they are computer literate
according to Wilkinson (2006). Her research compared students’ perceptions with reality and found that students did not perform well on pre-tests of Microsoft Office™, but improved their
post-test scores with instruction. She found that a comparison of student classifications regarding
perceptions with the reality of computer productivity yielded no significant differences but did find significant differences between Caucasian students and ethnic minorities.
Goh, Ogan, Ahuja, Herring, and Robinson (2007) investigated the relationship among computer self-efficacy, mentoring, and the gender of
students and their mentors. Students with male mentors reported significantly higher computer self-efficacy as compared to those students with female mentors. Kuhlemeier and Hemker (2007) studied the impact of secondary students’ use of the Internet and the computer at home on the
digital skills they need in school and found that
home access to e-mail and students’ use of home computers for various tasks, including surfing, e-mailing, chatting, and text processing were related to Internet and computer interest. Ballantine, Larres, and Oyelere (2007) studied the reliability of self-assessment as a measure of
computer competence. They agreed recent research on the topic has employed self-reported ratings as the sole indicator of students’ computer competence. They compared the self-assessment to results on objective tests and found that students significantly over-estimated their level of
computer competence. Interestingly, they found that students’ home and high school computer
use did not affect the results, and they questioned the use of self-assessment as a measure of computer competence.
In their study of the digital divide, Tien and Fu (2008) used multiple regression and logit
models and found that demographic and socioeconomic family background did not predict computer skills of first year college students. They did find that different kinds of computer

Information Systems Education Journal (ISEDJ) 9 (2) June 2011
©2011 EDSIG (Education Special Interest Group of the AITP) Page 78 www.aitp-edsig.org /www.isedj.org
knowledge affect student learning with knowledge of software helping students learn the most. Some differences in computer knowledge were found among female students,
minorities, and those with blue-collar or unemployed parents. These students were at a disadvantage in digital understanding. Banister and Vannatta (2006) suggest colleges must develop strategies to assess technology competencies of beginning college students and then move beyond such assessments to provide
student support for achieving technological competencies. They found that various methodologies have been used to measure a student’s computer competencies but agree that there are no standardized scales for assessing
competence.
In her study of the introduction to computers course, Webster (2004) examined the relationship between computer use confidence and computer literacy scores before the course began and repeated the test at the end of the course to assess gains in computer usage confidence and literacy. She found that prior
computer classes and computer usage positively influenced literacy scores and confidence. In addition, she found that hours using the computer for e-mail purposes also influenced confidence scores. After completing the introductory course, students had higher confidence and literacy ratings than the control
group.
In their study of the reported experience, comfort level, and perceived information technology skills of 233 college students, Messineo and DeOllos (2005) found that students view their computer competence
differently depending on whether they are using the technology for personal or course-related tasks. They discovered that even when the expressed levels of experience and comfort for some forms of technology were high, exposure to and confidence with more advanced applications were lacking. They agreed faculty
members may make false assumptions about student preparedness, which hinders their
students’ success. Their research found differences by gender and race/ethnicity and suggested faculty should be aware of the varied skill levels and experiences of their students.
Cassidy and Eachus (2002) developed a
computer user self-efficacy scale. They agree self-efficacy beliefs have been identified as a success factor for completing tasks. With the increasing reliance on computer technologies in
all aspects of life, it is important to measure the construct. Their research found a significant positive correlation between computer self-efficacy and computer experience. Familiarity
with computer software packages was a significant predictor of computer self-efficacy, and computer ownership and training increased efficacy. In their study, males reported higher results than females. This supports the findings of Varank (2007) who found that gender was significant for predicting computer attitudes but
not perceived skills. In Mayall’s (2008) study of technology self-efficacy among high school students, no statistically significant differences based on gender were detected in either pre- or post-tests.
Stephens (2006) found that subjects with low
computer self-efficacy will avoid interacting with computer technology when given a choice or opportunity. Oblinger and Hawkins (2006) suggest that when faculty, staff and administrators see how easily students use technology, they may mistakenly assume students have more than adequate IT
competency. They question whether students are competent or just overly confident and caution having no fear is not the same as having knowledge or skill. Stephens (2005) developed a decision support system built around a self-efficacy scale that can be implemented to perform training needs assessment. The system
can determine who requires training and which training mode is most appropriate.
Computer Course and Instruction
In their research, Creighton, Kilcoyne, Tarver, and Wright (2006) ask two related questions: Is a freshman-level microcomputer
applications/introduction to technology course obsolete? Are students, especially new freshmen, enrolling in the course already computer literate? Their research found that students enrolling in such courses were not literate in general computer technology and spreadsheet applications, but were computer
literate in the more familiar and often used word processing, e-mail, and Internet applications.
They found the higher the ACT score, the better the students scored on the objective pre-test exam and the performance-based post-test exam, but found only a weak relationship between taking a previous computer course and
pre-test scores.
Hollister and Koppell (2008) studied the information technology course in an assurance of learning program in an undergraduate

Information Systems Education Journal (ISEDJ) 9 (2) June 2011
©2011 EDSIG (Education Special Interest Group of the AITP) Page 79 www.aitp-edsig.org /www.isedj.org
program at an AACSB accredited business school to redesign the content and pedagogy of the computer literacy course. Mykytyn (2007) agrees that while colleges of business have dealt
with teaching computer literacy and computer application concepts for many years, teaching tool-related features in a lecture in a computer lab may not be the best instructional mode. He suggests problem-based learning as an alternative for teaching computer application concepts, operationally defined as Microsoft
Excel™ and Access™. Ballou and Huguenard (2008) studied an introduction to computer course with both a lab and lecture component and found that higher levels of perceived computer experience positively affected lecture
and lab homework and exam scores.
Hindi, Miller, and Wenger (2002) investigated students’ perceptions of computer literacy skills they had obtained prior to enrolling in a university to develop implications and recommendations for teaching a college-level computer course. Students perceived themselves better prepared in word processing
than they were in spreadsheet and database applications. However, computer self-efficacy measures suffered from degradation of their explanatory power over time (Marakas, Johnson, & Clay, 2007).
The proposed research model developed by
Hasan (2006b) makes a clear distinction
between general and application-specific computer self-efficacy and found that both had negative effects on computer anxiety. A model by Thatcher and Perrewe (2002) found that computer anxiety mediates the influence of situation-specific traits on computer self-
efficacy.
Karsten and Schmidt (2008) in their ten-year study of business student computer self-efficacy found that when controlling for changes over time, students have lower computer-self efficacy in 2006 than in 1996. It was surprising that increased use of computers and technology over
time did not lead to higher self-efficacy scores. Sharkey (2006), in her study of information
fluency and computer literacy, found that universities are responding with a more rapid integration and adoption of technology and emphasizing information use and retrieval. Findings on self-efficacy and computer skills
acquisition among graying workers by Reed, Doty, and May (2005) suggested older participants’ beliefs about their efficacies in
acquiring computer skills were lower than their actual abilities.
GPA
Research has considered a number of
demographic variables as determinants of student performance in various business courses. Trine and Schellenger (1999) studied determinants of student performance in an upper level corporate finance course and found that GPA, the financial accounting grade, basic finance grade, math ACT, a self-motivation
factor, an information processing factor, and sharing living quarters with non-family members were all significant in determining the student’s
course performance. Typically the list of variables is more limited to gender, age, or ethnicity.
Wilson, Ward, and Ward (1997) found that both self-reported and actual data on ACT scores, GPAs, and grades earned in specific courses were similarly correlated with accounting course performance. Christensen, Fogarty, and Wallace (2002) studied the directional accuracy of self-efficacy and performance in accounting courses
mid-way through the academic term. They found the more conservative a student’s self-efficacy of their skill levels and abilities, the higher the second exam score and final course grade, even when controlling for cumulative GPA in accounting courses, average exam
performance, number of accounting classes
completed, and the extent of involvement in extracurricular activities. There is a dearth of studies focusing on these demographic characteristics, specifically GPA, in the introduction to computers course.
Table 1 (Appendix A) summarizes variables
affecting computer self-efficacy and/or performance for selected research.
3. METHODOLOGY
The literature on students’ self-efficacy in general and computer self-efficacy in particular considers a number of demographic characteristics and skill levels. However,
inconsistencies remain as to which variables have the most predictive power. Our study extends the research on this topic and gathers data on student’s self-efficacy in a number of specific computer applications. The research examines if the self-rated skill sets are predictive directly or indirectly of the knowledge-
level scores of the various computer applications or of the final, overall course grade and whether

Information Systems Education Journal (ISEDJ) 9 (2) June 2011
©2011 EDSIG (Education Special Interest Group of the AITP) Page 80 www.aitp-edsig.org /www.isedj.org
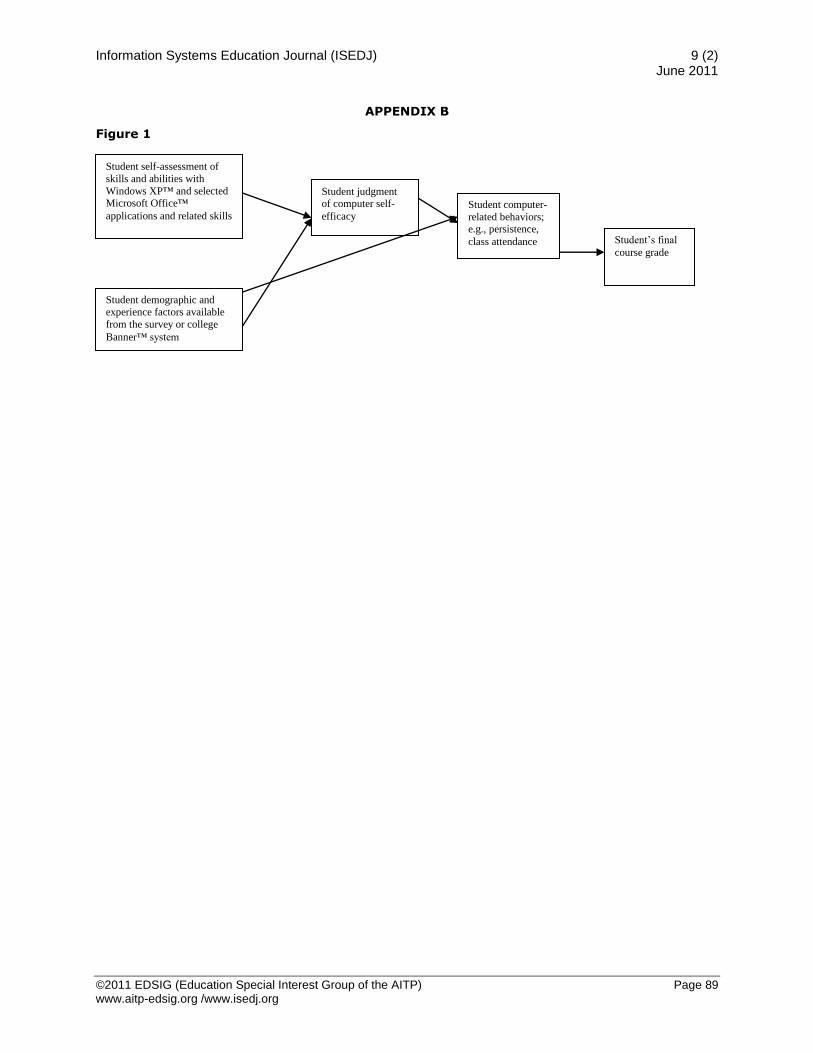
such predictions are significantly improved by the inclusion of demographic and prior experience variables. The model shown in Figure 1 (Appendix B) indicates our
hypothesized relationships and leads to our hypotheses.
H1: Student self-assessment of skills and abilities with Windows XP™ and selected Microsoft Office™ applications (Word™, Excel™, PowerPoint™, and Access™) and related skills and abilities is not a predictor
of final course outcomes (final overall letter grade).
H2: Student demographic and experience data
from the survey and the college Banner™ database system (including gender, age, high school computer training experience,
prior college computer training experience, bachelor or non-bachelor degree candidate, previous attempts of the computer literacy course and overall/current GPA) are not predictors of final course outcomes (final overall letter grade).
H3: Student self-assessment of skills and
abilities with Windows XP™ and selected Microsoft Office™ applications (Word™, Excel™, PowerPoint™, and Access™) and available student demographic and experience data from the survey and the college Banner™ database system are not
predictors of final course outcomes (final
overall letter grade).
The course chosen for study was an introduction to computer applications course. Appendix C includes an abbreviated course syllabus highlighting topic coverage and weights. The course covers multiple modules, including
hardware and operating systems, productivity applications such as word processing, database and spreadsheet software, information literacy, networking, and the Internet. A survey instrument was developed based on key topics and constructs from the literature review. The survey was reviewed and further edited by
management information system faculty for
completeness and accuracy.
Survey Instrument
Students reported their name, e-mail address, and various phone numbers, as well as computer courses (identified by name) they had completed in high school, college, and/or
technical school. They also completed a list of other computer training and experiences. On a
five-point Likert-type scale, they rated their level of knowledge on various applications from 1 (none) to 5 (expert), with points in between for novice, intermediate, and advanced. No specific
definitions of these terms were given. Applications included Windows XP™, MS Word™, MS Excel™, MS Access™, and MS PowerPoint™, as well as e-mail, Internet searching, and general computer hardware/ software concepts.
The next questions focused on student’s personal goals as an outcome of the class and
included their expected grade and a place for open-ended comments on what they hoped to achieve and the knowledge they expected to gain. The final three pages asked students to
check their specific skills for each of the applications, including the computer operating
systems, word processing, spreadsheets, databases and presentation software (See Appendix D for a copy of the survey instrument). Specific skill variables for each application were developed from the textbook used in the course.
Survey Population and Sample Demographics
Self-reported data were collected from 259 students in a freshman/sophomore-level microcomputer applications and introduction to information technology course at a medium-size, AACSB-accredited state college. The course is required for all business majors and is an
elective for a number of associate and bachelor’s
degree programs. Due to incomplete and missing data, 207 student surveys and records were used for the analysis.
Additional gathered information, as shown in Table 2 (Appendix A), included status as bachelor’s or non-bachelor’s degree student,
overall GPA, gender, age (as date of birth), and overall course grade (all of which were gathered from the campus Banner™ database system following course completion). The age was separated to account for traditional versus non-traditional students using the breakdown used by Justice (2001) in her study of traditional and
nontraditional-age college students. Justice
(2001) defined traditional-age students as between 18 and 23 years of age and nontraditional-age college students as age 24 and above (through age 64). These are the age ranges used in this analysis. Individual student’s scores on each individual computer
package (word processing, spreadsheet, database, and operating system) were obtained from the professor of record’s lab and lecture grades.
Information Systems Education Journal (ISEDJ) 9 (2) June 2011
©2011 EDSIG (Education Special Interest Group of the AITP) Page 81 www.aitp-edsig.org /www.isedj.org
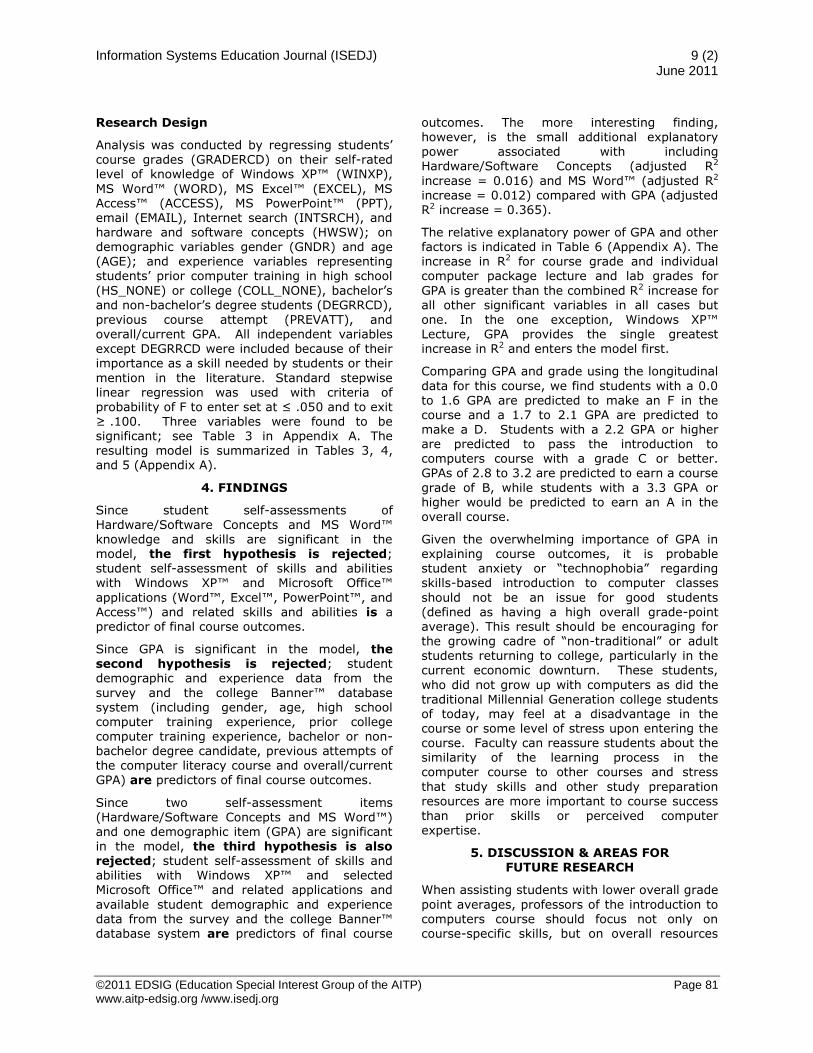
Research Design
Analysis was conducted by regressing students’ course grades (GRADERCD) on their self-rated level of knowledge of Windows XP™ (WINXP),
MS Word™ (WORD), MS Excel™ (EXCEL), MS Access™ (ACCESS), MS PowerPoint™ (PPT), email (EMAIL), Internet search (INTSRCH), and hardware and software concepts (HWSW); on demographic variables gender (GNDR) and age (AGE); and experience variables representing students’ prior computer training in high school
(HS_NONE) or college (COLL_NONE), bachelor’s and non-bachelor’s degree students (DEGRRCD), previous course attempt (PREVATT), and overall/current GPA. All independent variables
except DEGRRCD were included because of their importance as a skill needed by students or their
mention in the literature. Standard stepwise linear regression was used with criteria of probability of F to enter set at ≤ .050 and to exit ≥ .100. Three variables were found to be significant; see Table 3 in Appendix A. The resulting model is summarized in Tables 3, 4, and 5 (Appendix A).
4. FINDINGS
Since student self-assessments of Hardware/Software Concepts and MS Word™ knowledge and skills are significant in the model, the first hypothesis is rejected; student self-assessment of skills and abilities
with Windows XP™ and Microsoft Office™
applications (Word™, Excel™, PowerPoint™, and Access™) and related skills and abilities is a predictor of final course outcomes.
Since GPA is significant in the model, the second hypothesis is rejected; student demographic and experience data from the
survey and the college Banner™ database system (including gender, age, high school computer training experience, prior college computer training experience, bachelor or non-bachelor degree candidate, previous attempts of the computer literacy course and overall/current GPA) are predictors of final course outcomes.
Since two self-assessment items (Hardware/Software Concepts and MS Word™) and one demographic item (GPA) are significant in the model, the third hypothesis is also rejected; student self-assessment of skills and abilities with Windows XP™ and selected Microsoft Office™ and related applications and
available student demographic and experience data from the survey and the college Banner™ database system are predictors of final course
outcomes. The more interesting finding, however, is the small additional explanatory power associated with including Hardware/Software Concepts (adjusted R2
increase = 0.016) and MS Word™ (adjusted R2
increase = 0.012) compared with GPA (adjusted R2 increase = 0.365).
The relative explanatory power of GPA and other factors is indicated in Table 6 (Appendix A). The increase in R2 for course grade and individual computer package lecture and lab grades for
GPA is greater than the combined R2 increase for all other significant variables in all cases but one. In the one exception, Windows XP™ Lecture, GPA provides the single greatest
increase in R2 and enters the model first.
Comparing GPA and grade using the longitudinal
data for this course, we find students with a 0.0 to 1.6 GPA are predicted to make an F in the course and a 1.7 to 2.1 GPA are predicted to make a D. Students with a 2.2 GPA or higher are predicted to pass the introduction to computers course with a grade C or better. GPAs of 2.8 to 3.2 are predicted to earn a course
grade of B, while students with a 3.3 GPA or higher would be predicted to earn an A in the overall course.
Given the overwhelming importance of GPA in explaining course outcomes, it is probable student anxiety or “technophobia” regarding
skills-based introduction to computer classes
should not be an issue for good students (defined as having a high overall grade-point average). This result should be encouraging for the growing cadre of “non-traditional” or adult students returning to college, particularly in the current economic downturn. These students,
who did not grow up with computers as did the traditional Millennial Generation college students of today, may feel at a disadvantage in the course or some level of stress upon entering the course. Faculty can reassure students about the similarity of the learning process in the computer course to other courses and stress
that study skills and other study preparation resources are more important to course success
than prior skills or perceived computer expertise.
5. DISCUSSION & AREAS FOR FUTURE RESEARCH
When assisting students with lower overall grade
point averages, professors of the introduction to computers course should focus not only on course-specific skills, but on overall resources

Information Systems Education Journal (ISEDJ) 9 (2) June 2011
©2011 EDSIG (Education Special Interest Group of the AITP) Page 82 www.aitp-edsig.org /www.isedj.org
appropriate to improve students’ study habits. It may be that students having problems in the course are juggling work, family, and school demands or taking too many courses. Short
sessions on managing time, improving concentration, preparing to study, reading textbooks, setting goals, managing test anxiety, and improving study habits may be more important for these students. Short workshops emphasizing these skills are often offered on college campuses. Advising students with low
GPAs to take one or more of these targeted workshops prior to enrolling in the introduction to computers class may be warranted.
While our study was exploratory in nature,
further studies should better pinpoint the GPA range that indicates whether students will have
difficulty in the course. If future analysis confirms GPA as a key predictor, then faculty may want to advise students with these lower GPAs to enroll in workshops or college success courses as a possible prerequisite. Surveys of prerequisites and remediation at other colleges and universities would be helpful in starting the
dialogue.
One interesting note from the study is the negative coefficient for student-reported ability with MS Word™. This sign was unexpected but may be due to students’ greater familiarity with Word™ than the other selected Microsoft Office™
applications (Excel™, PowerPoint™, and
Access™). This familiarity with Word™ may lead students to overestimate their skills and abilities as compared to the other applications within the course based solely on the name recognition and general familiarity.
Further studies are needed on the design of the
introduction to computers course. While beyond the scope of this study, there has been much discussion in schools of business that today’s entering students may have enough experience in computer applications from high school and/or work experience to omit all or part of the course. The business community agrees students need
less computer theory and more application in Windows™, Word™, Access™, Excel™ and
PowerPoint™ (Spinuzzi, 2006; Wilkinson, 2006). However, the academic community continues to debate the appropriate balance of theory and application, as well as the appropriate format for the course and whether it should be continued
(McDonald, 2004; Stephens, 2006). A comparative article that profiles the structure of the course at various institutions is also needed, along with further discussion in the academic
community. Further study of how the course is taught and organized at other colleges and universities would also be helpful for academicians.
Further replication and extension of this study too could determine the GPA cut-off point for remediation and study skills instruction prior to attempting the introduction to computers course. This study found students with a GPA of 2.1 or lower would earn either a D or F in the introduction to computers course, with those
students with a 1.6 or lower earning an F. Further studies should attempt to validate this scale.
This study found overall student GPA to be a better predictor of the final course grade than the variables in the self-reported skills
inventory. GPA was also a better predictor of performance in each of the various computer skills and packages lab and lecture modules. Further research is needed with a larger sample size, across additional time periods, and with samples from a variety of institutions to confirm the findings. If the findings continue to point to
GPA as a better predictor over time, then the current stream of research in self-efficacy will need to be amended, as will the focus on various individual and combinations of demographic variables as predictors of course performance. Further research is needed to determine if
targeted interventions to improve overall GPA
would help the overall grades in the introduction to computers course.
6. REFERENCES
Agarwal, R., Sambamurthy, V., & Stair, R. M. (2000). Research report: The evolving relationship between general and specific
computer self-efficacy - an empirical assessment. Information Systems Research, 11(4), 418-430.
Albion, P. R. (2001). Some factors in the development of self-efficacy beliefs for computer use among teacher education students. Journal of Technology and
Teacher Education, 9(3), 321-334.
Ballantine, J. A., Larres, P. M., & Oyelere, P. (2007). Computer usage and the validity of self-assessed computer competence among first-year business students. Computers & Education, 49(4), 976-990.
Ballou, D. J. & Huguenard, B. R. (2008). The
impact of students’ perceived computer experience on behavior and performance in

Information Systems Education Journal (ISEDJ) 9 (2) June 2011
©2011 EDSIG (Education Special Interest Group of the AITP) Page 83 www.aitp-edsig.org /www.isedj.org
an introductory information systems course. Journal of Information Systems Education, 19(1), 87-97.
Bandura A. (1986). Social foundations of
thought & action: A social cognitive theory. Englewood Cliffs, NJ: Prentice Hall.
Bandura, A. (1997). Self-efficacy: The exercise of control. New York, NY: W. H. Freeman.
Banister, S. & Vannatta, R. (2006). Beginning with a baseline: Insuring productive technology integration in teacher education.
Journal of Technology and Teacher Education, 14(1), 209-235.
Buche, M. W., Davis, L. R., & Vician, C. (2007). A longitudinal investigation of the effects of computer anxiety on performance in a computing-intensive environment. Journal of
Information Systems, Winter, 18(4), 415-423.
Busch, T. (1995). Gender differences in self-efficacy and attitudes toward computers. Journal of Educational Computing Research, 12(2), 147-159.
Busch, T. (1996). Gender, group composition,
cooperation, and self-efficacy in computer studies. Journal of Educational Computing Research, 15(2), 125-138.
Cassidy, S. & Eachus, P. (2002). Developing the computer user self-efficacy (CUSE) scale: Investigating the relationship between computer self-efficacy, gender and
experience with computers. Journal of Educational Computing Research, 26(2), 133-53.
Christensen, T. E., Fogarty, T. J., & Wallace, W. A. (2002) The Association Between the Directional Accuracy of Self-Efficacy and
Accounting Course Performance. Issues in Accounting Education, 17(1), 1-27.
Compeau, D. R. & Higgins, C. A. (1995). Computer self-efficacy: Development of a measure and initial test. MIS Quarterly,
19(2), 189-211.
Compeau, D. R., Higgins, C. A., & Huff, S.
(1999). Social cognitive theory and individual reactions to computing technology: A longitudinal study. MIS Quarterly, 23(2), 145-158.
Creighton, W., Kilcoyne, M., Tarver, R., & Wright, S. (2006). Computer literacy levels of students enrolling in a post-secondary
computer applications/information technology course. Information Technology, Learning, and Performance Journal, 24(1), 15-23.
Davis, J. L. & Davis, H. (2007). Perceptions of career and technology and training and development students regarding basic personal computer knowledge and skills. College Student Journal, 41(1), 69-78.
Divaris, K., Polychronopoulou, A., & Mattheos, N. (2007). An investigation of computer literacy
and attitudes amongst Greek post-graduate dental students. European Journal of Dental Education, 11(3), 144-147.
Gist, M. E. & Mitchell, T. R. (1992) Self-efficacy: A theoretical analysis of its determinants and malleability. Academy of Management
Review, 17(2), 183-211.
Goh, D., Ogan, C., Ahuja, M., Herring, S. C., & Robinson, J. C. (2007). Being the same isn’t enough: Impact of male and female mentors on computer self-efficacy of college students in IT-related fields. Journal of Educational Computing Research, 37(1), 19-40.
Hasan, B. (2003). The influence of specific computer experiences on computer self-efficacy beliefs. Computers in Human Behavior, 19, 443-450.
Hasan, B. (2006a). Delineating the effects of general and system-specific computer self-efficacy beliefs on IS acceptance.
Information & Management, 43, 565-571.
Hasan, B. (2006b). Effectiveness of computer training: The role of multilevel computer self-efficacy. Journal of Organizational and End User Computing, 18(1), 50-68.
Hasan, B. & Jafar, M. H. (2004). An empirical
examination of a model of computer learning performance. The Journal of Computer Information Systems, 44(4), 27-33.
Hawkins, B. L. & Oblinger, D. G. (2006). The myth about the digital divide. EDUCAUSE
Review, 41(4), 12-13.
Hindi, N. M., Miller, D., & Wenger, J. (2002).
Computer literacy: Implications for teaching a college-level course. Journal of Information Systems Education, 13(2), 143-151.
Hollister, K. K. & Koppell, N. B. (2008). Curricular changes in response to assurance of learning results in information technology.

Information Systems Education Journal (ISEDJ) 9 (2) June 2011
©2011 EDSIG (Education Special Interest Group of the AITP) Page 84 www.aitp-edsig.org /www.isedj.org
Journal of American Academy of Business, 13(1), 287-293.
Houle, P. A. (1996). Toward understanding student differences in a computer skills
course. Journal of Educational Computing Research, 15(1), 25-39.
Hsu, W. K. & Huang, S. S. (2006). Determinants of computer self-efficacy – An examination of learning motivations and learning environments. Journal of Educational Computing Research, 35(3), 245-65.
Justice, E. M. (2001). Metacognitive differences between traditional-age and nontraditional-age college students. Adult Education
Quarterly, 51(3), 236-249.
Karsten, R. & Roth, R. M. (1998a). Computer self-efficacy: A practical indicator of student
computer competency in introductory IS courses. Informing Science, 1(3), 61-68.
Karsten, R. & Roth, R. M. (1998b). The relationship of computer experience and computer self-efficacy to performance in introductory computer literacy courses. Journal of Research on Computing in Higher
Education, 31(1), 14-24.
Karsten, R. & Schmidt, D. (2008). Business student computer self-efficacy: Ten years later. Journal of Information Systems
Education, 19(4), 445-453.
Kuhlemeier, H. & Hemker, B. (2007). The impact of computer use at home on students’
internet skills. Computers & Education, 49(2), 460-80.
Marakas, G. M., Johnson, R. J., & Clay, P. F. (2007). The evolving nature of the computer self-efficacy construct: An empirical investigation of measurement construction,
validity, reliability, and stability over time. Journal of the Association for Information Systems, 8(1), 16-46.
Marakas, G. M., Yi, M. Y., & Johnson, R. D. (1998). The multilevel and multifaceted
character of computer self-efficacy: Toward clarification of the construct and an
integrative framework for research. Information Systems Research, 9(2), 126-163.
Mayall, H. J. (2008). Differences in gender based technology self-efficacy across academic levels. International Journal of Instructional Media, 35(2), 145-155.
McDonald, D. S. (2004). Computer literacy skills for computer information systems majors: A case study. Journal of Information Systems Education, 15(1), 19-33.
Messineo, M. & DeOllos, I. Y. (2005). Are we assuming too much? Exploring students’ perceptions of their computer competence. College Teaching, 53(2), 50-55.
Mykytyn, P. P. (2007). Educating our students in computer application concepts: A case for problem-based learning. Journal of
Organizational and End User Computing, 19(1), 51-61.
Oblinger, D. G. & Hawkins, B. L. (2006). The
myth about student competency. Educause Review, 41(2), 12-13.
Qutami, Y. & Abu-Jaber, M. (1997). Students’
self-efficacy in computer skills as a function of gender and cognitive learning style at Sultan Qaboos University. International Journal of Instructional Media, 24(1), 63-74.
Reed, K. D., Doty, H., & May, D. R. (2005). The impact of aging on self-efficacy and computer skill acquisition. Journal of
Managerial Issues, 17(2), 212-228.
Sharkey, J. (2006). Towards information fluency: Applying a different model to an information literacy credit course. Reference
Services Review, 24(1), 71-85.
Shiue, Y. (2003). The effects of cognitive learning style and prior computer experience
on Taiwanese college students’ computer self-efficacy in computer literacy courses. Journal of Educational Technology Systems, 31(4), 393-410.
Spinuzzi, C. (2006). Multiliteracies for a digital age. Journal of Business and Technical
Communication, 20(2) 225-228.
Stephens, P. (2005). A decision support system for computer literacy training at universities. The Journal of Computer Information Systems, 46(2), 33-44.
Stephens, P. (2006). Validation of the business computer self-efficacy scale: Assessment of
the computer literacy of incoming business students. Journal of Educational Computing Research, 24(1), 29-46.
Thatcher, J. B. & Perrewe, P. L. (2002). An empirical examination of individual traits as antecedents to computer anxiety and

Information Systems Education Journal (ISEDJ) 9 (2) June 2011
©2011 EDSIG (Education Special Interest Group of the AITP) Page 85 www.aitp-edsig.org /www.isedj.org
computer self-efficacy. MIS Quarterly, 26(4), 381-396.
Tien, F. F. & Fu, T. (2008). The correlates of the digital divide and their impact on college
student learning. Computers & Education, 50(1), 421-36.
Trine, J. A. & Schellenger, M. H. (1999) Determinants of student performance in an upper level corporate finance course. In Allied Academies International Conference Academy of Educational Leadership
Proceedings, 4(1), 91-100.
Varank, I. (2007). Effectiveness of quantitative skills, qualitative skills, and gender in
determining computer skills and attitudes: A
causal analysis. The Clearing House, 81(2), 71-80.
Webster, L. D. (2004). Measuring change in computer self-efficacy and computer literacy
of undergraduates in an introduction to computers course. UMI Dissertation Service. (UMI No. 3164548).
Wilkinson, K. (2006). Students computer literacy: Perception versus reality. Delta Pi Epsilon Journal. 48(2), 108-20.
Wilson, T. E., Jr., Ward, S. P., & Ward, D. R.
(1997). Empirical evidence regarding the use of self-reported student data in accounting education research. The
Accounting Educators’ Journal, 9(1) 50-69.

Information Systems Education Journal (ISEDJ) 9 (2) June 2011
©2011 EDSIG (Education Special Interest Group of the AITP) Page 86 www.aitp-edsig.org /www.isedj.org
APPENDIX A
TABLE 1
Selected Research – Variables Affecting Computer Self-Efficacy and/or Performance
Gen
der
Gen
der o
f
men
tor
Eth
nic
min
orit
y
sta
tus
Ag
e
Co
gn
itiv
e
learn
ing
sty
le
Co
mp
ute
r
access
an
d/
or
exp
erie
nce
Em
ail
use
Prio
r
co
mp
ute
r
train
ing
S
oft
ware
kn
ow
led
ge
Blu
e-c
oll
ar o
r
un
em
plo
yed
paren
ts
AC
T S
co
re
Busch (1995) X
Qutami & Abu-Jaber (1997)
X X
Albion (2001) X
Cassidy & Eachus (2002)
X X
Shiue (2003) X X
Webster (2004) X X X
Messineo & DeOllos (2005)
X X
Reed, Doty, & May (2005)
X
Creighton, Kilcoyne, Tarver, & Wright (2006)
X X X
Hsu & Huang (2006) X
Wilkinson (2006) X
Davis & Davis (2007) X X
Divaris, Polychronopoulou, &
Mattheos (2007)
X X
Goh, Ogan, Ahuja, Herring, & Robinson (2007)
X
Tien & Fu (2008) X X X X
Ballou & Huguenard (2008)
X

Information Systems Education Journal (ISEDJ) 9 (2) June 2011
©2011 EDSIG (Education Special Interest Group of the AITP) Page 87 www.aitp-edsig.org /www.isedj.org
TABLE 2
Sample Demographics
Variable Total Percent Total Percent
Gender Male 94 45.6% Female 112 54.4%
Age Under age 24 138 66.7% 24 and older 69 33.3%
High School
Computer Training Experience
None 146 70.9% Some 60 29.1
Prior College Computer Training
Experience
None 54 26.2% Some 152 73.8%
Major Non-Bachelor’s Degree
Seeking
100 48.3% Bachelor’s Degree
Seeking
107 51.7%
Previous Course Attempts
None 141 68.1% One or More 66 31.9%
Overall GPA < 1.00 1.00 to < 2.00 2.00 to <3.00 3.00 to 4.00
Number|%-age 2 1.0% 18 8.7% 82 39.6% 105 50.7%
Course Grades A B C D F
Number|%-age 45 21.8% 99 48.1% 53 25.7% 4 1.9% 5 2.4%
TABLE 3
Variables Entered/Removed During Stepwise Regressiona
Model Variables Entered
Variables Removed
Method
1 GPA . Stepwise (Criteria: Probability-of-F-to-enter <= .050, Probability-of-F-to-remove >= .100).
2 HWSW . Stepwise (Criteria: Probability-of-F-to-enter <= .050, Probability-of-F-to-remove >= .100).
3 WORD . Stepwise (Criteria: Probability-of-F-to-enter <= .050, Probability-of-F-to-remove >= .100).
a Dependent Variable: GRADERCD
TABLE 4
Model Summary
R R
Square
Adjusted R
Square
Std. Error of the
Estimate
Change Statistics
Model R Square
Change
F
Change df1 df2
Sig. F
Change
1 .607(a) .368 .365 .713 .368 118.422 1 203 .000
2 .622(b) .387 .381 .704 .019 6.221 1 202 .013
3 .634(c) .402 .393 .697 .014 4.846 1 201 .029
a Predictors: (Constant), GPA b Predictors: (Constant), GPA, HWSW c Predictors: (Constant), GPA, HWSW, WORD

Information Systems Education Journal (ISEDJ) 9 (2) June 2011
©2011 EDSIG (Education Special Interest Group of the AITP) Page 88 www.aitp-edsig.org /www.isedj.org
TABLE 5
Regression Coefficientsa
Unstandardized Coefficients Standardized Coefficients
t Sig.
Model B Std. Error Beta
1 (Constant) .482 .226 2.129 .034
GPA .827 .076 .607 10.882 .000
2
(Constant) .133 .264 .504 .615
GPA .841 .075 .617 11.175 .000
HWSW .121 .049 .138 2.494 .013
3
(Constant) .466 .302 1.543 .124
GPA .833 .075 .611 11.153 .000
HWSW .176 .054 .200 3.246 .001
WORD -.136 .062 -.135 -2.201 .029
TABLE 6
R2 Increase for Course Grade and Individual Computer Packages Due to GPA and Other Significant Factors
DEPENDENT VARIABLE
R2 Increase Order of GPA Entry Into Model GPA Sum of Other Sig. Factors
Course Grade 0.368 0.033 1
XP Lecture 0.151 0.175 1
XP Lab 0.049 0.000 1
Word Lecture 0.218 0.016 1
Word Lab 0.056 0.000 1
Excel Lecture 0.326 0.016 1
Excel Lab 0.158 0.000 1
Access Lecture 0.374 0.031 1
Access Lab 0.250 0.041 1
Information Systems Education Journal (ISEDJ) 9 (2) June 2011
©2011 EDSIG (Education Special Interest Group of the AITP) Page 89 www.aitp-edsig.org /www.isedj.org
APPENDIX B
Figure 1
Student self-assessment of
skills and abilities with
Windows XP™ and selected Microsoft Office™
applications and related skills
Student’s final
course grade
Student judgment of computer self-
efficacy Student computer-
related behaviors; e.g., persistence,
class attendance
Student demographic and experience factors available
from the survey or college
Banner™ system

Information Systems Education Journal (ISEDJ) 9 (2) June 2011
©2011 EDSIG (Education Special Interest Group of the AITP) Page 90 www.aitp-edsig.org /www.isedj.org
APPENDIX C
ABRIDGED SYLLABUS
CLASS TEXT:
Shelly, Gary B., T. J. Cashman, and M. E. Vermaat. 2008. Microsoft Office 2007:
Introductory Concepts and Techniques, Windows Vista Edition. Thomson Course
Technology: Boston.
COURSE DESCRIPTION:
Assures a basic level of computer applications literacy to include spreadsheet, database,
word processing, LAN, e-mail, presentation software, and Internet utilizations. This
course satisfies the computer literacy requirement.
STUDENT LEARNING OUTCOMES: To successfully complete this course, the student should achieve the following objectives:
1. Understand how information technology aids business decision making.
2. Identify the components of a typical microcomputer system.
3. Identify and describe the most widely used general microcomputer software
applications, the difference between application software and system software and
understand the role of operating system software.
4. Demonstrate knowledge of computer hardware and software, including “multimedia”
and be familiar with the legal, ethical, and privacy issues relating to the use of
hardware and software in a business environment.
5. Be familiar with computer networks and know the basic components of a
communications system to include e-mail, user interfaces, communications, and the
Internet.
6. Effectively use a word processing software program, a spreadsheet program, a
database management program, and develop a simple presentation using a
presentation software program.
These objectives will be measured through written tests, laboratory assignments, and
laboratory tests.
ASSESSMENT SCALE:
A = 90 – 100 B = 80 - 89 C = 70 - 79 D = 60 - 69 F = < 60
ASSESSMENT:
Component Percent of total grade
Lecture tests (3-4 @100 points) 60%
Lab and Other Assignments 15%
Lab tests 25%
100%
ATTENDANCE AND OTHER MATTERS:

Information Systems Education Journal (ISEDJ) 9 (2) June 2011
©2011 EDSIG (Education Special Interest Group of the AITP) Page 91 www.aitp-edsig.org /www.isedj.org
Regular lecture and laboratory attendance is expected. If you miss a class, it is your
responsibility to find out what you missed, including announcements of homework, lab
assignments, test dates, etc. Exams are to be taken on designated test dates. No makeup
tests for missed exams will be given, except in the case of extreme emergency and only
with prior notification, if possible.
All assignments that have due dates are to be turned in at the beginning of the class
meeting on the assigned due date. Late work will be accepted, but with a 10% penalty for
each class day the work is late.

Information Systems Education Journal (ISEDJ) 9 (2) June 2011
©2011 EDSIG (Education Special Interest Group of the AITP) Page 92 www.aitp-edsig.org /www.isedj.org
APPENDIX D
Survey Instrument
I have read, understand, and agree to abide by the policies established in this course.
Printed Name: Signature:
Date:
Please complete the following information:
Email address: _________________________________
Phone number where you can be reached:
Day: Night: Cell Phone:
Computer courses completed in:
High School:
College (or technical school)
Other computer training, experience, etc.:
Please rate your level of knowledge in each of the following:
Application None Novice Intermediate Advanced Expert
Windows Vista
MS Word
MS Excel
MS Access
MS PowerPoint
Internet Searching
Computer Hardware/
Software concepts
My personal goals as an outcome of this class:
expected grade:
what I hope to achieve:
knowledge I expect to gain:
I can perform the following activities (check all that apply):
Operating System:
Create text files
Create folders
Format disks with operating system (make a boot disk)
Format disks without operating system
Copy files
Move files
Create subfolders
Capture a screen image

Information Systems Education Journal (ISEDJ) 9 (1) April 2011
©2011 EDSIG (Education Special Interest Group of the AITP) Page 64 www.aitp-edsig.org /www.isedj.org
Word Processing: Create a document
Set margins
Set Tabs (left, right, center, dot leader)
Center text
Bold text
Underline text
Add borders
Add shading
Import graphics
Create tables
Add headers
Add footers
Create page breaks
Print a document
Show formatting marks
Show reveal formatting task pane
Customize word processor toolbars
Change font characteristics
Inserting dates (static and dynamic)
Create a hyperlink
Create a bulleted list
Save a document
Save a document as a web page
Create endnotes and footnotes
Find and replace text
Align text in a document
Align text in a table
Spreadsheets:
Create a new workbook
Select a cell
Enter text in a cell
Justify text in a cell
Enter numbers
Change font type, style, size and color
Save a workbook
Create formulas to add, subtract, multiply, and divide cell contents
Use built-in functions (e.g., SUM, MIN, MAX, AVERAGE)
Add shading and borders
Change column width and row height
Delete text in cells
Delete rows and/or columns
Copy cell contents
Move cell contents
Insert dates as text, as numbers, as system

Information Systems Education Journal (ISEDJ) 9 (1) April 2011
©2011 EDSIG (Education Special Interest Group of the AITP) Page 65 www.aitp-edsig.org /www.isedj.org
Use relative, mixed and absolute addressing of cells
Create charts (both embedded and on a separate sheet)
Create X-axis, and Y-axis and Chart titles
Create an exploded pie chart
Name individual worksheets in a workbook
Make decisions using IF statements
Create static and dynamic web pages
Perform what-if analysis using
Goal-Seek
Databases:
Create a new database
Create tables
Create forms
Create reports
Create queries
Add, change, and/or delete data to/in/from a table
Create permanent relationships among tables
Enforce referential integrity
Specify cascade deletes and cascade updates
Create calculated fields
Specify validation rules for entering data
Apply filters to a query
Create a parameter query
Change the structure of a table
Save a database
Create an index
Create a primary key
Use wildcards in queries to search for certain records
Compact and repair a database
Backup a database
Use comparison operators to look up records
Use AND and/or OR operators in a query
Presentation Software:
Create a presentation file
Create slides in the presentation
Add graphics to the presentation
Create bullets
Change the background of the slides
Create animation effects
Add a new slide
Create a slide show
Check presentation for spelling errors
Create an outline
Print a presentation as slides, notes, and/or handouts

Information Systems Education Journal (ISEDJ) 9 (1) April 2011
©2011 EDSIG (Education Special Interest Group of the AITP) Page 66 www.aitp-edsig.org /www.isedj.org
Please put your initials here: