vaasaett world energy retail market rankings 2010
DESCRIPTION
The world's leading report on international switching rates, trends and analysis in competitive liberalised electricity and gas markets. Part of the VaasaETT Utility Customer Switching Research Project series. Main writer Dr Philip E Lewis of VaasaETT.TRANSCRIPT

www.utility-customer-switching.com
Editor and lead writer: Dr Philip E. Lewis

2010 VaasaETT World Energy Retail Market Rankings Report 2010 2
2009 was a year where global electricity customer switching activity reached new
boundaries. While New York and Texas eased off a little, Europe and Australia were
more active than ever before, continuing their growth in switching momentum.
Of the 33 markets followed by the VaasaETT Utility Customer Switching Research
project in 2009/2010, nine substantially increased their switching rates.
The global average switching rate for 2009 was 6.12%, around one percentage
point higher than two years ago.
Australia, and in particular Victoria, once again led the world in electricity
customer switching, increasing to record levels and establishing itself as the
example for others to follow.
For the first time since the start of global electricity market liberalization, Great
Britain (still a hot market) was knocked off the top spot in Europe, surprisingly by
Ireland, a former laggard in terms of customer switching.
In 2009, nearly 21% of all electricity customers in the Republic of Ireland switched
supplier, 2% more than in Great Britain. Between February 2009 and February
2010, Bord Gáis Energy won nearly 21% of the residential electricity market in
Ireland, by far the world’s most successful marketing campaign ever for an
electricity retailer, measured in terms of the percentage of residential customers
in the market who were won over a 12 month period.
For the first time social media marketing was shown to be a major trigger and
channel for utility customer switching.
Switching also increased in other medium activity markets, such as Finland and
Sweden as well as lower activity markets such as Italy, the Czech Republic,
France, Greece, Portugal and Slovenia.
in Austria, Germany, Belgium (Flanders, Wallonia and Brussels), Norway and the
Netherlands, switching trends were at similar or lower levels to 2008, limited in
part by reduced price volatility and a generally uneventful market.
Other markets remained dormant, for now, but the evidence shows a general
increase in the momentum of switching activity globally. The trend is typically
upward.
Active utility customer switching can no longer be considered an Anglo Saxon or
Nordic only phenomenon.
2009 Highlights - A Record Year for Customer Switching

2010 VaasaETT World Energy Retail Market Rankings Report 2010 3
Introducing the 2010 World Energy
Retail Market Rankings Report
The Fifth Edition of the VaasaETT World Energy Retail Market Rankings Report remains to this
day the only truly comparative global view of utility customer switching activity.
Drawn from the VaasaETT Utility Customer Switching Research Project (UCSRP), the most
comprehensive and uniform source of comparable switching statistics (past and present) in the
electricity and gas markets worldwide, this report is merely an overview of selected analysis that
has been collected by the UCSRP in 2010, combined with some additional analysis collected
during the past 14 years. If you would like to enquire about information from the UCSRP please
visit www.utility-customer-switching.com or contact us through any of our direct phone numbers
or email addresses listed at www.vaasaett.com/contact.
IMPORTANT NOTE: Please note that in this report we generally refer to energy Suppliers as
Retailers. Unless otherwise stated, statistics refer to electricity and to Aggregated (weighted
residential and I&C) data.
We encourage you to use tables, charts and other figures from this report in your own reports
and presentations providing they are unchanged and accompanied by full reference to the
VaasaETT World Energy Retail Market Rankings Report, or alternatively to www.VaasaETT.COM .
If you would like further usage rights, please contact [email protected]
CONTENTS
1. About the VaasaETT Global Energy Think-Tank 4-5
2. The Utility Customer Switching Research Project 6-10
3. 2009-2010 Switching Trends 10-13
4. Market Switching Reports 14-37
5. Little Bits
a. Switching Myths 26-27
b. The Importance of Timing 38
6. Authors and Sources 39-41

2010 VaasaETT World Energy Retail Market Rankings Report 2010 4
The VaasaETT Global Energy
Think-Tank
The VaasaETT Global Energy Think-Tank is a unique and
independent collaborative concept based on the
philosophy of mutuality. Through its network of thousands
of senior executives, officials, researchers and other
experts who are for the most part known and trusted
personally, the Think-Tank provides value-to-all by
combining an interactive Community and Collaborative
Projects. The Think-Tank focuses broadly on practical strategic business and market issues, as
well as envisioning state of the art innovations and developments. The VaasaETT Global Energy
Think Tank brings together utilities, authorities, universities, NGOs and other players in the
energy industry. More Information at www.vaasaett.com
The VaasaETT Global Energy Think-Tank offers knowledge sharing through its extensive online
knowledge centre, unique data sharing through various projects such as the Household Energy
Price Index for Europe and the Utility Customer Switching Research Project, networking
integration through its intimate high level events, the VaasaETT Community and world leading
round-tables and coalitions such as the Smart Energy Demand Coalition based in Brussels.

2010 VaasaETT World Energy Retail Market Rankings Report 2010 5
The VaasaETT Global Energy Think-Tank also publishes an array of free reports, on its own or in
partnership with other organizations such as Capgemini, and its collaborative projects, such as
the renowned Respond 2010 smart metering and demand response project, incorporate the best
partner organizations and experts that the world has to offer.
This knowledge sharing, best practice identification and collaboration ultimately leads to
outstandingly innovative strategies, solutions, methodologies, tools and visions, such as the
Utility Churn Radar, the most advanced loyalty/disloyalty prediction tool available in the energy
utilities market, developed through 14 years of research and collaboration in over 35 liberalised
energy markets around the globe.
“VassaETT provided a concise and infomative report using primary and
secondary information to survey international energy markets. The depth of
content and speed of which the report was assimilated was remarkable and of
great value to us”
Pádraig Fleming, Head of Regulation, Bordgais, Ireland

2010 VaasaETT World Energy Retail Market Rankings Report 2010 6
The Utility Customer Switching research project (UCSRP),
founded jointly in 2004 by Dr Philip E. Lewis and Paul
Grey, monitors switch rates and trends in all fully liberalised
energy retail markets worldwide.
It was the first and remains to this day the only global view of
utility customer switching activity, as well as being the most
comprehensive and uniform source of comparable switching
statistics in the electricity and gas markets worldwide. For all
observed markets we have switch trend data since the time
those markets were fully liberalised until the present.
It also provides ever-increasing analysis of observed trends
and explanations for utility customer switching behavior.
Some of this information is provided free or through
subscription services to our network members, additional
insight is provided through client offerings.
More Information at:
www.utility-customer-switching.com
The Utility Customer
Switching Research Project
The Utility Customer Switching
Research Project is used
extensively around the global
utilities industry and in leading
reports such as the Capgemini
European Energy Market
Observatory
Project Scope Research, measure and compare customer switch rates
Historical customer switching trends and projections
Identify factors promoting and hindering competitive retail activity
Insights into successful customer acquisition and retention strategies
Customer switch rates as a benchmark for market success
Retail market share analysis
The UCSRP currently follows 37 liberalised electricity markets, many of which also have liberalised
gas markets. Both residential and I&C switch rates are covered separately, although publicly, only
aggregated switch rates are published. This year however, while Alberta was followed and
recorded, it was not included in the rankings due to data comparability issues.

2010 VaasaETT World Energy Retail Market Rankings Report 2010 7
Why Measure Customer Switch Rates?
Customer switch rates are an important dimension of energy market competitiveness and have
the advantage of being objective, measurable and comparable between markets. Many energy
market commentators tend to focus on the wholesale aspects of the utility value chain as a
measure of restructured market success, such as generation sources, transmission
interconnections and wholesale market trading. The UCSRP contends that both retail and
wholesale markets must be successful for consumers to receive the full benefits of competition.
A Definition of Customer Switching
In January 2006 Dr Philip E. Lewis, in a report for the European Regulators Group for
Electricity and Gas (ERGEG) proposed a comprehensive definition of utility customer
switching which has been adopted by the CEER (Council of European Energy Regulators),
ERGEG and therefore the effectively the European Union:
Switching supplier is defined as “the action through which a customer changes supplier”.
More specifically: A switch is essentially seen as the free (by choice) movement of a
customer (defined in terms of an overall relationship or the supply points and quantity of
electricity or gas associated with the relationship) from one supplier to another. Switching
activity is defined as the number of switches in a given period of time.
A switch additionally includes: a) A re-switch: when a customer switches for the second or
subsequent time, even within the same measured period of time b) A switch -back: when a
customer switches back to his/her former or previous supplier. When a customer m oves, a
switch should only be recorded if a customer switches to a supplier other than the supplier
which is incumbent in the area where he/she is moving to. Theoretically, a switch should
NOT be recorded if the customer remains with the same supplier as before the move, but
for practicality this specification has been removed from the definition for this project and
from those of CEER and ERGEG. A change of tariff with the same retailer is not equivalent
to a switch (this exclusion extends to: changing to a new tariff; changing from a regulated
to a non-regulated tariff with the same supplier or a subsidiary of the same supplier).
Sources of Data
The Utility Customer Switching Research Project draws on more than 60 of the best sources for
data collection. These sources typically include national or regional regulators, system operators,
energy associations, meter registration organizations and statistical authorities.

2010 VaasaETT World Energy Retail Market Rankings Report 2010 8
Levels of Activity
Taking account of the rapid growth in the number of competitive markets, and increasing
diversity of switching activity and market maturity, levels of switching are now divided into
six categories:
Super Hot Markets: A new category for the 2009 rankings. These are markets where
activity is (in the current year) over 20% and has been consistentl y at or above 20% for at
least three years. These are markets where high levels of switching and competition are an
inevitable reality of the market, where at least half of all customers have switched supplier.
These are the truly competitive markets where customers come first (or on a level par with
other key business objectives) and complacency leads to major losses of customers. Prices
may not be lower than in less active markets, nor may retailer image be higher, but a high
emphasis is placed on the development of long-term lifestyle and added value services.
Energy efficiency, smart home, demand response and other offerings are expected to
flourish in such markets, depending on regulatory and other market structure conditions.
Hot Markets: Annual switching is approximately 15% or higher. Typically, switching activity
is so intensive that competitive positioning becomes one of the utility’s most strategic
issues. Switching momentum is usually high, constant, needs little encouragement and
easily flares up.
Warm Active Markets: Annual switching is between 8.5% and 14%. Typically, switching
activity is sufficient that utilities risk losing significant numbers of customers if they do not
actively compete, or if they make loyalty-related errors. Switching momentum is significant
but less permanent and mainly related to occasional stimulants in the market, such as price
rises or profit announcements. While many utilities are far more customer focused,
traditional corporate attitudes and over-complacency often remain despite the looming
major threat facing revenues and customer profitability.
Active Markets: ek. Entry into this level of activity often acts as a wake-up call for utilities,
although for many it will not take place until at least the next level of switching activity.
Cool Active Markets: Annual switching is between 1% and 3.0%. Typically, switching is
noticeable and measurable, but insufficient to affect substantial change in the attitudes or
behaviour of utilities. Competition is barely visible and customer awareness poor. The
seeds of future activity may nevertheless already be sown.

2010 VaasaETT World Energy Retail Market Rankings Report 2010 9
Dormant Markets: Annual switching is less than 1%. Typically, switching and competition
exist only in theory. The markets may be officially open to competition, and customers are
able to choose their supplier, but in practice only larger consumers are motivated or able
to do so, competitors may not be able to compete with the prices of incumbent utilities
(due to scale, access to energy or low-set regulated incumbent price issues) and in general
the market is likely to be inhibited by insufficient conditions for real competition. This is
not necessarily to say that competition cannot emerge, however, but regulators may need
to take action in order to break the deadlock.
Comparative Data
It should be noted that not all countries/markets collect or document data in a way that
corresponds to this definition. Through cooperation with our data sources and careful re-
calibration (where necessary) we are able to largely overcome these limitations, but some
markets are nevertheless unavoidably non-comparable (and therefore left out of the rankings),
and a margin of error is factored into all ranking comparisons.
Defining Fully Liberalised Markets
Full liberalisation (otherwise known as full retail competition or FRC) is when residential and I&C
(Industrial and Commercial) customers are all eligible to choose their energy (electricity and or
gas) retailer (otherwise known as supplier). In the Utility Customer Switching Research Project
Full Liberalization additionally refers to electricity or gas markets where end customers can
choose their retailer freely, where they have at least one alternative retailer realistically available
to them, and where switching supplier does not incur additional financial costs, reprisals from the
former utility/retailer, technical changes (such as the need for an additional meter), or other
unreasonable or excessive effort on the part of the customer. The dates when markets became
fully liberalised are given in the following timeline.
Switch Rate Metric
The UCSRP customer switching rate metric is calculated by dividing the number of customers
who switched suppliers in a given period by the total number of customers in the market, and the
result is then converted to an annual rate. For example, if one percent of customers switch
suppliers in a given month, that month would have a 12 percent annualised customer switch
rate. Similarly, where switching trend data is reported on a quarterly basis, the quarterly switch
percentage has been multiplied by four to derive the `annualised quarterly' switching rate.

2010 VaasaETT World Energy Retail Market Rankings Report 2010 10
2009-2010 Switching Trends
Levels of Activity
2009 saw a steady increase in the number of active and highly active markets. All in all the
VaasaETT Utility Customer Switching Research Project recorded 23 active markets, compared to
13 dormant markets. Of the active markets five reached only Cool Active levels but a further 5
reached the Hot level of activity, a record number of markets.
For the first time, one market, namely Victoria, was so active that it reached a ‘Super Hot’ level
of activity, reflecting not only extreme levels of switching, but also an average switching level of
above 25% over the past three year period. This level of switching was well above that of any
other market.
It is also important to note that in 2009, the myth that switching is a Nordic or Anglo Saxon
phenomenon was exposed, with three non-Nordic or Anglo Saxon markets reaching annual levels
of switching above 10%, in addition to four other such markets in the Active category.
The Dormant markets were a mixed bunch, but apart from Spain, Portugal and Iceland, all
represented Eastern or South Eastern Europe.

2010 VaasaETT World Energy Retail Market Rankings Report 2010 11
Dormant Markets
Lithuania
Slovakia
Bulgaria
Croatia
Hungary
Latvia
Romania
Luxembourg
Poland
Spain
Greece
Portugal
Iceland
Cool Active
Markets
New York
Austria
Czech Republic
Italy
France
Active Markets
Germany
Slovenia
Flanders
Brussels
Finland
Denmark
Warm Active
Markets
Norway
Wallonia
Sweden
New South Wales*
Netherlands
South Australia*
Hot Markets
New Zealand
Queensland*
Great Britain
Ireland
Texas
Super Hot Markets
Victoria*
Levels of Switching Activity 2009
The true extent of the variation in switching levels in only apparent when more switching
percentages are compared. The VaasaETT Utility Customer Switching Research Project precisely
and in great detail analyses these percentages, a simple summary of which is provided below. For
more detailed analysis please contact VaasaETT.
In the following chart it can be seen that despite the enormous variation in switching levels, there
is something of an evenness to the range of the spread, from markets with 20-26% annual
switching right down to those with 0%.

2010 VaasaETT World Energy Retail Market Rankings Report 2010 12
The percentage of customers in these markets who have switched at least one likewise ranges
massively, from nearly 0% right up to over 60%. The higher the level of switching however, the
higher the amount of re-churn (customers who have switched more than once). In fact in the
most active markets, most customers who switch have switched from once to several times
before. Utility companies’ costs-to-serve are therefore increased, pushing profitability down.
Copyright 2010 VaasaETT

2010 VaasaETT World Energy Retail Market Rankings Report 2010 13
By looking at historical switching patterns (the VaasaETT Utility Customer Switching Research
Project has collected historical switching trends for all tracked markets since the onset of
competition in those markets) it can furthermore be seen that despite obvious differences
between market switch patterns, there are some statistically observable commonalities. For
instance, put simply all markets tend to follow common rules and dynamics relating to seasonal,
cyclical and other market variables. In general, markets furthermore tend to follow an upward
long-term trend.
Consequently switching trends can be predicted and leading markets explained.
Copyright 2010 VaasaETT

2010 VaasaETT World Energy Retail Market Rankings Report 2010 14
For electricity Victoria had by far the highest level of switching throughout 2009, but unlike the
other jurisdictions, saw a slight decline in the last two quarters of the year. According to the
2009/2010 VaasaETT ranking definition, only Victoria is a ‘Super Hot’ market in terms of
activity. The other Australian jurisdictions are ‘Hot’ or ‘Warm Active’.
Australia
Australia remains the most active country in the world
in terms of electricity and gas customer switching, but rates
differ greatly between jurisdictions.
For electricity a clear activity divide exists between the two most
active markets (Victoria and Queensland) and the less active
markets (South Australia and New South Wales), with Victoria
the clear leader overall. For gas, Victoria is out on its own. In fact in 2009 Victoria achieved the
highest levels of calendar year residential and aggregated* customer switching ever recorded
for an electricity or gas market, anywhere in the world**.
*Important Note: The following trends illustrate aggregated (residential plus commercial)
switch rates. All quarterly values have been annualized.
**In 2007 slightly higher rates were recorded in Victoria, but that was based on NEMMCO data,
which is believed to overstate switching levels by approximately 2-3% compared to Switchstats
Australia data (due to methodological and definitional differences). When this is taken into
account the 2009 Victoria switching levels are higher than the 2007 levels.

2010 VaasaETT World Energy Retail Market Rankings Report 2010 15
In the Gas market, Victoria saw
switching rates consistently
between 25- 30% throughout
2009, around 15-20% higher
than the other jurisdictions.
While all jurisdictions are
therefore ‘Warm Active’ or
‘Hot’ according to VaasaETT
ranking definitions, only
Victoria is ‘Super Hot’.
“The (VaasaETT Switchstats Australia) figures show that Victorian energy consumers are
embracing retail choice, setting a global benchmark for competition among electricity and gas
companies,…Since electricity retail price competition was introduced in Victoria in 2002, over 60
per cent of the state's residential and small business energy customers have chosen to change
retailers…The switch has saved them between 5 to 10 per cent on their energy bills, Our
Government removed energy retail price caps for small businesses customers in 2008, and for
residential customers in 2009, and the decision has allowed Victorian energy consumers to choose
from an even wider range of energy price and service options. The figures released today show
the success of this competition, with Victorian households and businesses able to choose from
about a dozen electricity and gas retailers.”
Peter Batchelor , Energy and Resources Minister, Victorian Government,
Australia, May 2010
Commentary

2010 VaasaETT World Energy Retail Market Rankings Report 2010 16
Australia State-by-State
Victoria
Victoria’s “Super Hot” ranking continues the pattern of it being Australia’s most active state
market. The record customer switching in 2009 owes much to the decision of the State
Government to phase out retail price regulation from 1 January that year. Regulation was
replaced by a regime of price monitoring by the Essential Services Commission of Victoria (ESCV),
which involves all retailers actively selling to small customers, of which there are fourteen, having
default tariffs listed and compared on the regulator’s web-site.
With other Australian states yet to follow the Victorians in removing price regulation retailers
upped their marketing efforts in the state and the pursuit of customers became even more
intense than in previous years. Use of door to door strategies was extensive and with marketing
occurring against the backdrop of a possible domestic emissions trading scheme, consumers were
perhaps more engaged on energy matters than usual.
It is likely that high levels of activity will continue in the current year as there are limited
prospects for price deregulation in other states, and the failure to pass the proposed emissions
trading scheme means that wholesale energy prices should remain fairly stable.
2010 VaasaETT World Energy Retail Market Rankings Report 2010 17
South Australia
What had traditionally been Australia’s second “hot” market came off the boil in 2009. While
activity is still apparent new entrant retailers are shunning the market in the belief that its high
summer “peaks” and lack of wholesale market liquidity are significant barriers to entry. There is
also a view that the current regulated tariffs in the state provide limited “headroom”. Switching
that did occur in 2009 was largely between the retailers with an established presence in South
Australia, most of whom have generation cover in the state.
The independent review and rule setting body, the Australian Energy Markets Commission
(AEMC), had found in 2008 that the South Australian market was “effectively competitive” and
that price regulation should be removed. The incumbent state government chose to reject that
recommendation in the lead up to a state election in 2010. Unless that decision is revisited and
prices are deregulated it seems unlikely the South Australian market will return to its “hot” status
in the near term.
Queensland
Since being opened up to full contestability on 1 July, 2007 the Queensland market has been on
somewhat of a rollercoaster ride. When one looks at Queensland, it really should be considered
as two markets, the largely urbanised south-east corner of the state and the extensive regional
and rural areas north of the Sunshine Coast.
With its price regulation policy the State Government maintains a “maximum uniform tariff” for
all consumers regardless of where they live. To do so in regional areas requires a government
Community Service Obligation (CSO) payment, which is payable only to consumers serviced by
the incumbent government owned retailer for those areas. Customers who move away from the
incumbent retailer lose the CSO and therefore competing providers are unable to offer a more
attractive product, making switching almost non-existent outside the south-east corner.
In the south-east customer switching was particularly high in the year after full contestability
began, which also coincided with the privatisation of the government owned retailers in that part
of the state. New entrant retailers were therefore competing against new incumbents without
brand loyalty so activity was high and “headroom” was allowed for in the initial regulated tariff
decision. After a consumer backlash about price increases and some service issues, the state
government began interfering in pricing decisions from mid 2008 and the squeezing of margin
and regulatory risk led to a downscaling of activity. The pick-up in switching to ‘Hot’ in the second
half of 2009 indicates “headroom” is returning to the market although new entrants remain wary
of the regulated price setting process.

2010 VaasaETT World Energy Retail Market Rankings Report 2010 18
New South Wales
New South Wales continued to exhibit moderate levels of customer switching in 2009, although
largely between the incumbent government owned electricity retailers and existing gas retailer.
The level of “headroom” in the regulated tariff and the high level of public ownership of the
energy industry continued to keep private new entrant retailers out of the market. Ongoing
uncertainty about a drawn out privatisation policy of the state government, which will shape the
market structure in both retailing and generation, has also
impacted on the willingness of new players to enter New
South Wales.
Until the ownership and market structure issues are
resolved, it is unlikely NSW will see a significant pick-up in
customer switching. On the positive side a controversial
2010 three year price determination may have improved the
outlook for “headroom” and could make consumers more
active in seeking out market contracts.
Some keys to success in the Australian market
have included clear, simple, hassle free
marketing and sign-up processes, lifestyle
focused incentives and products by multiple
competing newcomers, as well as excellent
price comparison and switching web sites
including SwitchWise and others.

2010 VaasaETT World Energy Retail Market Rankings Report 2010 19
“The success of Australian Power & Gas has been around understanding
that within the Australian market customer acquisition has been primarily
a marketing channel strategy plan rather than a product play. What that means is that in our
market most customers are not self seeking a
better energy offer but will respond to one when it
is put to them directly. Therefore most energy
sales at a residential level are made directly by a
cold call either through door to door or
telemarketing.
The core strength of APG has been to build its outsourced relationships in particular with the
Cobra Group who are one of the world’s biggest
direct sales companies to sell for APG. Cobra
were incentivised to come with a smaller retailer
initially as they were able to earn equity into APG
as their success grew. Cobra now has about a
20% ownership of the company and is very
aligned as our success grows so does their wealth
as shareholders.
Secondly we then diversified away from a singular channel to where we now have 2 direct sales
companies, we tele-market are part of a home movers channel where people get their utilities
moved for them when they
move house and we are
using internet switching
which is continuing to grow.
As with the UK we believe
this channel will continue to
increase as energy prices rise
in Australia.”
James Myatt, CEO,
Australian Power &
Gas
CASE STUDY
Australian Power & Gas has been named
the fastest growing company in Australia
by Business Review Weekly Magazine with
1,300% growth in the last 3 years.
2010 VaasaETT World Energy Retail Market Rankings Report 2010 20
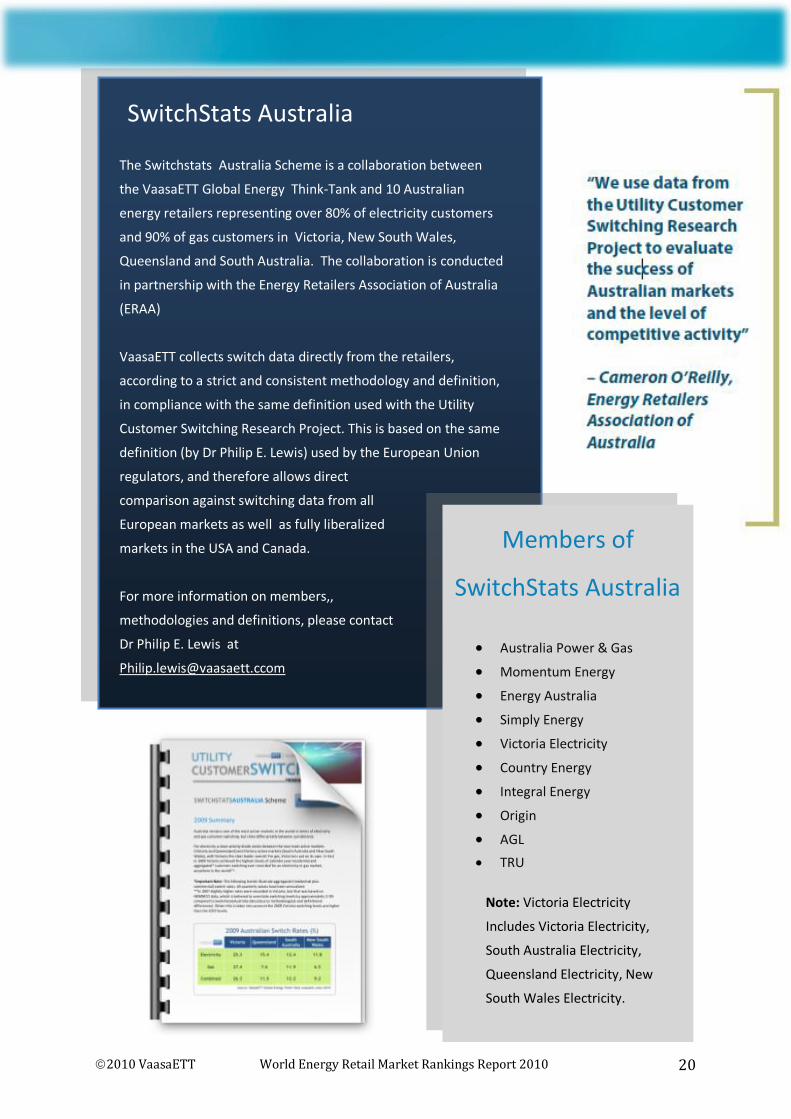
SwitchStats Australia
The Switchstats Australia Scheme is a collaboration between
the VaasaETT Global Energy Think-Tank and 10 Australian
energy retailers representing over 80% of electricity customers
and 90% of gas customers in Victoria, New South Wales,
Queensland and South Australia. The collaboration is conducted
in partnership with the Energy Retailers Association of Australia
(ERAA)
VaasaETT collects switch data directly from the retailers,
according to a strict and consistent methodology and definition,
in compliance with the same definition used with the Utility
Customer Switching Research Project. This is based on the same
definition (by Dr Philip E. Lewis) used by the European Union
regulators, and therefore allows direct
comparison against switching data from all
European markets as well as fully liberalized
markets in the USA and Canada.
For more information on members,,
methodologies and definitions, please contact
Dr Philip E. Lewis at
Members of
SwitchStats Australia
Australia Power & Gas
Momentum Energy
Energy Australia
Simply Energy
Victoria Electricity
Country Energy
Integral Energy
Origin
AGL
TRU
Note: Victoria Electricity
Includes Victoria Electricity,
South Australia Electricity,
Queensland Electricity, New
South Wales Electricity.

2010 VaasaETT World Energy Retail Market Rankings Report 2010 21
Republic of Ireland
The Republic of Ireland (referred to here as Ireland) electricity market has been open
to competition for larger businesses since February 2000 and has been fully open to
competition in all market segments since 2005, but it was only in 2009, with the arrival of
two key new entrants in February 2009, Bord Gáis Energy (the Incumbent Irish Gas Provider) and
Airtricity, that the residential market became active, resulting in the electricity incumbent ESB
losing large numbers of retail customers.
After the initial wave of switching activity among larger energy users following market opening in
2000, there was a slow but steady level of switching only within business markets with the ESB
losing approximately 4% of business consumption per annum during the period 2002-2008. Both
Bord Gáis Energy and Airtricity had both been active in this business market for a number of
years but had only built up relatively small (yet nevertheless significant customer bases), mainly
in the SME markets.
The entry of Bord Gáis Energy and Airtricity into the domestic market in 2009 howevver,
transformed the competitive landscape not only in the domestic market, but also in the business
market where it has had a major knock-on effect on business awareness of supplier switching
options.
Record Irish Switching in 2009-2010
Between February 2009 and 2010, Bord Gáis Energy won
nearly 21% of the occupied residential electricity market in
the Republic of Ireland. This Bord Gáis Energy campaign
has in fact been by far the world’s most successful
marketing campaign ever for an electricity retailer, if
measured in terms of the percentage of residential
customers in the market who were won over a 12 month
period.
Only five national markets have ever managed a (calendar)
yearly level of switching above 20% (the Australian markets
of Victoria, Queensland and South Australia, plus Great
Britain and New Zealand). Prior to 2009, the highest
national switch rate ever recorded for a 12 month period
was 28.33% in Victoria, Australia, between the 4th Quarter
2006 and 3rd Quarter 2007, and that switch level was
shared between competitors in the market.
The Irish Experience is
additional proof that there is
no such thing as a safe
customer for incumbent
energy companies. Markets
that are uncompetitive now,
can become active very
quickly if the conditions are
right. In the coming few
years it is predicted that
similar the experiences will
happen in other markets
around Europe and
elsewhere, especially since
evidence indicates that once
truly active, such markets
tend to remain active.

2010 VaasaETT World Energy Retail Market Rankings Report 2010 22
Bord Gáis Energy are though not the only energy company in Ireland that has won customers
from the incumbent. Airtricity has also won significant numbers of residential customers, and
additional new entrants into the market are now a possibility since the market has shifted from
near inactivity just over a year ago, to being one of the most active electricity markets in the
world.
It remains to be seen if there is yet enough long-term momentum in the market to sustain this
level of activity, but the high rate of switching has continued from 2009 into 2010 with over
30,000 switches every month in the domestic market, approximately 1.5% of the total domestic
market.
Why the change in fortunes ?
The main reason for this extraordinary level of customer switching has arguably been price
margins at a time of economic downturn in Ireland. Price margins were achieved through a
combination of regulatory price controls placed on the incumbent ESB (ESB was not allowed by
the regulator CER to lower its regulated standard prices in the face of lowered price offerings
from the new entrants) and happenings in the wholesale market. More specifically, the lower
new entrant prices were facilitated by the softening of the wholesale market in 2008 and 2009 in
the context of former extensive high cost forward hedging by the incumbent at a time of very
high fuel prices.
The ’clever’ or ’fortunate’ purchasing strategies of Bord Gáis Energy in particular and Airtricity,
combined with the ’price-to-beat’ price regulations of CER therefore enabled the new entrants to
offer significant discounts ranging from a minimum of 5% on the incumbent’s regulated tariffs up
to 14% depending on payment options and dual fuel discounts.
One should not underplay the significance of marketing on Irish switching levels however. Energy
companies typically fail to achieve sufficiently simple, clear and appealing campaigns. Energy may
seem like a simple product to sell but few companies have ever managed to win many customers
in this market. Ireland’s outstanding marketing has made the difference. Nicky Doran, Head of
Marketing at Bord Gáis Energy states that the success of the campaign was down to a number of
factors, “the right price point, the simplicity of the message and great creativeness were all major
factors in the success of the campaign” according to Doran. Furthermore Doran states that “The
web has proved to play a huge part in the success of the campaign with as many as 30% of
customers switching on our micro site thebigswitch.ie”. The advertising campaigns of the new
entrants have been very effective in communicating the message that significant savings were to
be made through engaging in a simple, pain-free switching process, and that the reliability of the
service offered would not be affected by switching. Most significant though was the extensive
role of social media, the first time this has been proven to have won large numbers of customers
within competitive electricity markets.

2010 VaasaETT World Energy Retail Market Rankings Report 2010 23
Most significantly Bord Gais Energy launched, ‘The Big Switch’ campaign which has had a high-
profile media presence across all major forms of advertising in 2009 and 2010. Airtricity has
followed suit and this has undoubtedly raised awareness of switching and created a momentum
which has continued unabated to date. The simplicity of the industry switching process has also
been key to this success.
The Significance of Regulation
Nowhere else has switching been influenced more by regulation than in Ireland, but in response
to these changing competitive conditions, the CER published its consultation on a ‘Roadmap’ to
deregulation in December 2009. This document set out the competitive milestones that would
signal the end to regulated prices in the Irish retail market. The CER reviewed the relevant
markets; domestic, small and medium businesses and large industrial & commercial customers
and concluded that all three business markets are sufficiently competitive to allow for the
complete removal of regulated prices. Unregulated competitors currently account for more than
half of business market consumption and therefore ESB Customer Supply was freed to compete
in business segments from 1st October 2010. They will be free to compete in the domestic market
as soon as it has lowered its domestic market share to no more than 60%.
Regulatory support for competition will not end there, however. As part of the broader retail
market workstream, The CER plans to continue to take measures to sustain and potentially
improve upon the high rate of customer switching in the Irish market, focusing especially upon
improving general customer awareness and price transparency as well as encouraging active
market participation across all market sectors.
Social media marketing
has been a key to the
Irish Switching
Phenomenon

2010 VaasaETT World Energy Retail Market Rankings Report 2010 24
Great Britain Great Britain was Europe’s second most active market in 2009, supported once
again by for example, aggressive and effective marketing, significant retail margins,
high levels of customer awareness, powerful online switching and comparison
services, active media and retail price volatility. The element of recession also appears to
have played a supportive role.
The continued activity of the Great Britain market, having remained highly active for over 11
years, is testament to the switching momentum that can develop in competitive electricity
markets. Although 2009 saw a general easing off of electricity tariffs switching remained the 3rd
highest in the world. Some of this activity was however a delayed response to large gas and
electricity price increases in 2008 as well as increasing public annoyance at what is seen as unfair
growing price margins of retailers, especially for gas where wholesale prices have fallen far more
sharply than retail prices.
In a market where the majority of switching for the past 13 years appears to have been directly
or indirectly the result of perceptions of price increases, margins and profits, it is both ironic and
paradoxical that one of the world’s highest levels of switching still exists in parallel with some of
Europe’s highest gross retail margins and costs-to-serve. It is not illogical though, that high levels
of competition appear to have left relatively large margins intact, since retail margins facilitate
price savings, encourage customer focus/acquisition/retention and give retailers a reason to stay
in the market.
Source: Household Energy Price Index for Europe 2010 (HEPI), E-
Control and VaasaETT, 2010 http://www.vaasaett.com/projects/hepi/

2010 VaasaETT World Energy Retail Market Rankings Report 2010 25
At the same time the high levels
of switching heavily increase
cost-to-serve through costs
associated with winning,
switching and retaining
customers. Churn is an expensive
business and who wants to be in
a business with low margins?
What is perhaps surprising
however, is that after nearly 13
years of such high levels of
competition, and apparently
strong handed regulation,
utilities in Great Britain
appeared in 2009 to generally still
be publicly heavily criticsised,
average gross margins rose
temporarily to extreme levels and
utility profit increases followed. Under such circumstances, it is perhaps easy to see why skeptic
onlookers may view the energy industry in Great Britain as non-competitive, even anti-
competitive or monopolistic, despite its high levels of switching and relatively high levels of
customer focus.
It is interesting therefore to note that, finally, after 13 years of full liberalization, in 2010 British
utilities have begun to move away from the tradition of competing over price and ‘service’,
towards a new paradigm of competition through partnership with the customers. The imminence
of mandated smart meter rollout throughout Great Britain has been preceded by attempts by
utilities to build closer relationships with customers.
A number of the leading retailers in particular for instance are now offering customers in-home
feedback displays to assist them to save energy and therefore money. These offerings are
accompanied by energy savings advice, associated tariffs and even (in at least one case) the
ability to remotely turn off devices to save money. Not only do such offerings help customers to
save money in other ways than switching supplier (potentially avoiding the need to change
supplier to ensure a good deal), but they also build a more mutual relationship with the
customer, to some extent may tie in the customers, and may go some way to reversing the
negative images associated with the utilities and the energy industry. In the longer-term they
may also enable more advanced revenue generating or cost-reducing offerings to the mass
market.
Source: Office for National Statistics/Bloomberg
2010, Chart produced and published by BBC:
www.bbc.co.uk.

2010 VaasaETT World Energy Retail Market Rankings Report 2010 26
Switching Myths
Research over the years has revealed a myriad of myths associated with utility
customer switching: That customers need large savings to switch retailers, that
satisfaction and loyalty are closely correlated, that energy is necessarily boring,
that energy needs to be interesting for customers to switch retailer. The list goes
on and on. In this edition of the world energy retail market rankings we bring
your attention to just two myths: that switching process speed and the number of contracts a
customer has to sign correlate with national switching levels.
Regarding the relationship between the time taken to switch suppliers and the level of switching,
the following graph indicates that not only is such a relationship at best weak, but that there is
probably no significant relationship at all. While retailers may find less profitability in a market
where switching is more complex and thus more expensive, customers generally have no idea
how long it will take to switch when they decide to do so, and for the most part they do not care.
What appears to matter most to customers is that from their point of view the switching process
is smooth, simple and predictable. As long as they know it will take a month, then that is rarely a
problem for them, as long as they know it is happening. They are not excitedly waiting for
something to happen.

2010 VaasaETT World Energy Retail Market Rankings Report 2010 27
Regarding the relationship between the number of contracts a customer has to sign
if they switch retailers, the following chart concerning electricity, supported also by
survey data, clearly reveals that in Europe at least, as elsewhere, there is no sign of
any impact of the number of contracts.
For sure customers would prefer to have just one contract, and thus one bill relating
to the supply of electricity or gas. At present for instance in Sweden, Norway and
typically also Finland, customers who switch retailers will end up with two regular
bills for electricity instead of one, one bill for distribution and one for the electricity commodity.
The distribution bill will be sent by the distribution company and the electricity commodity bill
will be sent by the retailer.
Interestingly Great Britain and France both have one bill, yet Great Britain is highly active and
France is not. Sweden has two bills and is a Warm Active market, yet Austria and Greece which
have one bill are not very active. This would indicate at least that having one bill is not a pre-
requisite for an active market, even though it is desirable from the customer’s perspective. Nor
are two bills a major deterrent to switching even though customers who find out about having
two bills once they have already switched are sometimes disappointed.
A single biller regime can therefore be seen as a preferred market characteristic, but not one of
the more important determinants of an active electricity market.
Source: VaasaETT
& Capgemini

2010 VaasaETT World Energy Retail Market Rankings Report 2010 28
The Netherlands The Netherlands was a Warm Active market in 2009, standing 8th in the rankings,
with stabilization in its switching trend at around 11% per annum. The outlook
for switching was however downgraded in Autumn 2009 following the
introduction of a 'do not call me - register' and an apparent consumer tiring of direct marketing
coinciding with reduced (survey) stated intentions to switch. The consequence of the ‘don’t call
me register’ is thought that once a customer has registered himself, retailers are forbidden to
call them. For retailers, canvassing via telephone was formerly by far the most significant
channel of customer acquisition.
Typical of more active and mature liberalised electricity markets, this is a year-on-year slight
decrease in the number of customers switching away from their incumbents to one of the
newcomers in the market. This is not a sign of slowing competition, but a reflection of the
maturity of the market (the lower hanging fruit have already dropped) and the fact that more
and more customers are now switching between retailers for the second or successive time. To
date, almost one third of the residential customers in the Netherlands have switched at least
once and (once again in line with other active markets) customers who have switched at least
once have a higher than average intention to switch in the future.
The level of activity in the Netherlands is though somewhat masked by the significant number
of customers renegotiating their contract with their own retailer. These customers do not
actually switch retailers, but do switch contracts.
Copyright 2010 VaasaETT
2010 VaasaETT World Energy Retail Market Rankings Report 2010 29
Sweden Sweden was 10th in the 2009 rankings,
and a Warm Active Market, where as of
January 2010 approximately 75% of
customers had either switched retailers or at least
switched contracts with their incumbent, around
9% higher than the previous year. A total of almost
1.8 million domestic customers (40% of the total
number of such customers in the Swedish
electricity market) either switched suppliers or
changed contracts with their existing one.
The increased activity is considered to be a reflection of Customers moving away from standard
price contracts to the preferred variable contracts. In December 2009, for the first time ever,
variable-price contracts were the most common type of supply contract among Swedish
households with 30% of customers on variable-price contracts as opposed to 22% in December
2008. Activity is also supported by the Energy Markets Inspectorate’s independent, web-based
price comparison site Elpriskollen, which brings together prices and terms and conditions for all
Swedish electricity supply companies in order to facilitate the choice by consumers of the
supplier that best suits them.
It should be noted however, that the ability for Swedish electricity customers to request and
receive personal improved contract offers from their existing retailers, may be seen as a barrier
to more intensive competition rather than an illustration of it. As in other parts of the Nordic
region, retailers can offer lower prices to their customers who request offers, than to those who
do not (termed price-matching). This cherry picking means that incumbent retailers can subsidise
their competitiveness to active and valuable (preferred) customers using margins from their less
active incumbent customers. This extends their already significant home advantage against
newcomers and neutralises much customer switching that would have occurred if price-matching
was not allowed (price matching for instance does not occur in Australia or Great Britain for
instance).
Of course it can be argued that does this matter, well it does matter because it prevents greater
switching momentum in the market (essential for more newcomer competition), and since prices
do not have to be as low to keep customers as to win them, the customer may end up with a
worse price than if they had switched retailers. Incumbent retailers therefore retain most of their
customers and most of their original market power, and true competition is killed off before it
can even truly begin.
2010 VaasaETT World Energy Retail Market Rankings Report 2010 30
Norway In Norway there are about 100 energy suppliers. Some of them have offers
nationwide, and some are local suppliers. A little more than 50% of the household
customers and almost 70% of the industry customers have a spot contract in
Norway. A spot contract is a contract that offers the customer the monthly average
system price at Nord Pool Spot (corrected for the price area of the customer) plus a mark up
from the supplier. The mark up is normally a sum per kWh, but could also be a monthly or yearly
amount. For the customers with this kind of contract the mark up difference between suppliers
is the potential gain by switching. The mark up is in itself low, in fact sometimes close to zero.
The difference in mark up between the most expensive supplier and the least expensive supplier
in this type of contract is normally small and thereby does not in itself trigger switches on a large
scale, at least not for those with a low yearly consumption.
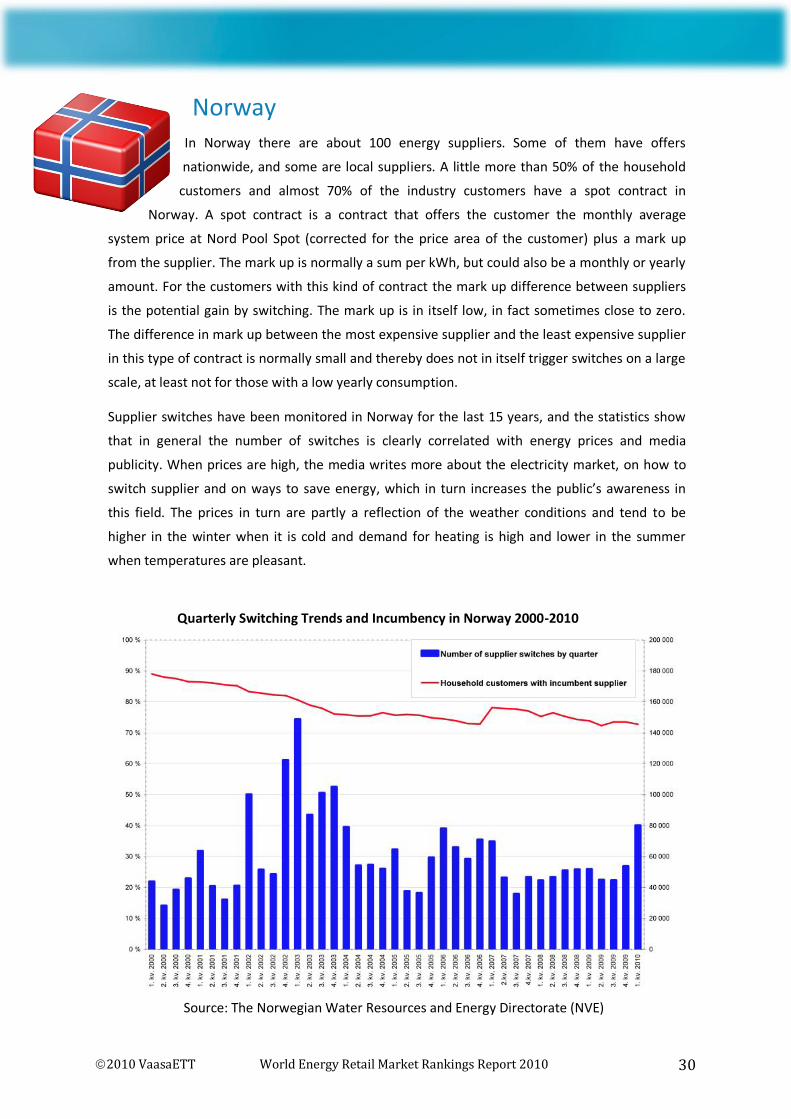
Supplier switches have been monitored in Norway for the last 15 years, and the statistics show
that in general the number of switches is clearly correlated with energy prices and media
publicity. When prices are high, the media writes more about the electricity market, on how to
switch supplier and on ways to save energy, which in turn increases the public’s awareness in
this field. The prices in turn are partly a reflection of the weather conditions and tend to be
higher in the winter when it is cold and demand for heating is high and lower in the summer
when temperatures are pleasant.
Source: The Norwegian Water Resources and Energy Directorate (NVE)
Quarterly Switching Trends and Incumbency in Norway 2000-2010

2010 VaasaETT World Energy Retail Market Rankings Report 2010 31
Supplier switching trends behaved typically in 2009, with the highest levels in the first and last
quarter of the year (incidentally similar to most other European energy markets). Switching levels
were also similar to previous years with 195 250 household market switches and about 24 700
I&C switches, representing 8.1% and 7.9% of the market respectively. These numbers were
unremarkable in part because there were no sustained periods of extreme prices, but also
because the Norwegian electricity market appears to have somewhat matured and stabilised
within the Warm Active switching level category. Only in periods of relatively very high energy
prices do switching rates substantially increase beyond typical levels.
This stabilisation could be partly explained by the fact that the margins of energy retailers are low
and so the differences in prices between the retailers are not big enough to motivate the
customer to switch. Some customers also have other preferences than prices when choosing a
retailer, for instance supporting local initiatives or retaining familiarity or peace of mind.
Because of many factors including relative price volatility, fast and simple switching procedures
with no economic costs for the customer, and relatively high levels of customer awareness,
Norway has for over a decade been one of Europe’s most active energy markets in terms of
customer switching. Nevertheless the majority of customers in Norway tend to stay with or
return to their local supplier, even if that supplier is not the cheapest one. In fact around 70% of
household customers and 65% of I&C customers still have a contract with the retailer connected
with the local DSO.
Norway could therefore be described as a relatively mature, moderately active, low margin
market with volatile tendancies, where incumbents remain dominant and most customers
remain loyal , but those who switch tend to be habitual switchers.
Denmark Denmark was an emerging market in 2009. Although still only 6.3% of electricity
customers switched retailers, this was approximately twice the previous highest ever
recorded level of activity (recorded in 2008), and it brings Denmark very near the border
with the Warm Active markets category. The main reasons for this activity was the increased
marketing activity of new entrants combined with increased customer elasticity resulting from
the effects of the recession. Switching has not been very evenly spread around the market
however, with some of the more local players experiencing much lower levels of switching.
Switching levels appear however to be even higher in 2010 than in 2009.
As in other Nordic markets, many customers (2.5% in the case of Denmark) instead negotiated or
received better contracts from their existing retailer, thus reducing the potential for genuine
switching activity, but competition has apparently led to an emerging interest in additional
competitive offerings such as home smart meter based energy feedback and the development of
forthcoming home energy management and smart home services.

2010 VaasaETT World Energy Retail Market Rankings Report 2010 32
Nordic Switching Determinants
Research conducted by VaasaETT in collaboration with he Central Research Institute of the
Electric Power industry of Japan (CRIEPI) in 2009, indicates that switching in the Nordic markets
is primarily influenced by a number of key drivers. In the following table, the degree to which
each market conforms to each criteria is defined by the numbers in the columns, ranging from
1 to 4 (where 4 indicates the highest and 1 the lowest degree of confirmation). By averaging the
numbers for each market it is possible to then consider the overall switching propensity of each
market. Analysis found that the relative propensities of the four markets closely reflected the
relative observed switching levels in each market, indicating the importance of the selected
switching variables.
The Churn Radar
Through extensive analysis such as this and much more, covering 13 years and markets around
the world, VaasaETT has now developed a loyalty / disloyalty engine, known as the Churn Radar
which enables utilities to predict, in real-time the switching propensity and likely switch levels
in their market . The Churn Radar integrates more than 100 variables and is totally
customizable to almost any liberalised market. This tool is now available to all utilities.
Source: VaasaETT & CRIEPI

2010 VaasaETT World Energy Retail Market Rankings Report 2010 33
Belgium In general, switching levels in Belgium, where three separate regional liberalised
markets co-exist, are mid-table ranging from modestly Active to Warm Active.
Switching is stimulated and restricted by the same flawed competitive environment.
Limited switching has been restricted by a mixture of factors including for instance
excessive market concentration (two utilities control over 80% of generation), insufficient savings
opportunities and switching process and rule inefficiencies. Factors including for instance
dissatisfaction with incumbents, prices and the industry in general have on the other hand
stimulated switching despite the restrictions.
Wallonia is the most active of the Belgian markets, with an annual switch rate of around 10% and
incumbent retailers losing in the region of between 1-3% of their customer base each year
(meaning that the majority of switching is taking place between former incumbents). Switching
would now appear to be sustained by a reasonably stabilised level of momentum, but further
activity is arguably restricted by unclear game rules between retailers.
Since full liberalisation was achieved on July 1st 2003, Flanders has seen a consistent increase in
the level of switching. The trend has however been (at least temporarily) been leveling off (even
slightly decreasing for gas) during the past two years and in 2009 was just under 6% in the Active
switching level category. This downturn is considered to be at least in part in part a response to
reduced price differentials in the market and an overall downward trend in energy prices during
2009 (in comparison to a peak at the end of 2008). Not only could many customers benefit less
from switching, but there was less impetus from news media as a result of the absence of price
shocks (customers are even more likely to switch because of price increases than in response to
increases in price differentials).
Switching in Brussels has nearly doubled since 2008 making it an Active market, and while not
exactly a volatile or prolific market (switching rates for each quarter in 2009 did not vary much),
it would appear to be a market with some potential. Nonetheless, the Brussels trend is showing
that it will be a more active market in the coming years.
Slovenia
In Slovenia, switching levels in 2009 were approximately 150% higher than 2008,
making it the most active market in the Eastern and South Eastern European region.
Activity was enhanced by increased marketing activity from one marketing focused new entrant
player GEN-I. GEN-I increased its market portion in the total retail market by approximately 6%
whereas most other retailers approximately retained their 2008 positions, except one
distribution company / retailer which increased its market share by approximately 2%.

2010 VaasaETT World Energy Retail Market Rankings Report 2010 34
France
In France in 2009, an increase in marketing activity for electricity, and a relatively
favorable wholesale market for gas, meant that non-incumbent (new entrant) retailers
temporarily showed signs of prospering, especially in the residential segment, arguably for the
first time since French electricity and gas markets were fully liberalised on 1 July 2007 (although
end-user regulated prices still exist in all market segments).
Electricity
The number of monthly switchers remained remarkably stable between July 2008 and August
2009, promoting France into the Cool Active switching level category for the first time since the
market was fully liberalised. New entrant marketing activity however subsequently slowed down
again in early 2010, due to the squeeze effect between wholesale sourcing costs and the retail
price cap established by the government based on the (relatively low) cost of nuclear base owned
by the national incumbent EDF. Additionally, an important change has taken place since
September 2009, as competitors have been focusing on improving the quality of their portfolio
rather than indiscriminately gaining new customers.
On the positive side, ten country wide suppliers compete with EDF in the residential market
compared to six in 2008. New entrant retailers also doubled their customer base in 2009. On the
negative side, by mid 2010, three years after market opening their market share was still only 5%
of the market (in terms of numbers of customers), even though approximately 10% choose a new
entrant when moving home. In the non-residential segment the situation was rather different.
The market has been inactive throughout 2009-2010, despite the existence of 18 country wide
competitors to EDF, resulting in new entrant market share decreasing to around 8% by mid 2010.
Changes in store for 2011
The French government has drafted a bill which is currently under discussion in the Parliament to
achieve two objectives: to impose a right of access for alternative suppliers to EDF nuclear
facilities at a wholesale price based on cost; and to remove retail price regulation on the non
residential market.
Gas
In 2009 and the first half of 2010, wholesale market prices have been lower than long term
contract prices indexed on oil. As a consequence retailers have had the opportunity to compete
fully with end user regulated prices based on long term contracts.

2010 VaasaETT World Energy Retail Market Rankings Report 2010 35
Nevertheless, only six country wide retailers compete with the incumbent GDF Suez on the
residential market (although this compares to three in 2008) and new entrant retailers’ customer
base represents only 6% of the market three years after market opening. This market continues
to suffer from the lack of customer awareness and the complex legislation that impeded
customers having switched to a non regulated offer to switch back to it.
In contrast to the residential market, the non-residential market has 21 retailers covering the
whole country and competitors to GDF Suez have reached 17+ % market share (25% in volume).
An optimistic outlook
The possibility to switch back to a regulated offer has been introduced in the legislation since the
beginning of 2010 for residential customers.
Marketing Characteristics for Gas and Electricity
All new entrants have now chosen a dual fuel strategy. It would seem that today, gas is
the main driver for the electricity market: competitors try to target those customers with
the highest gas bill.
The smaller competitors mostly rely on door-to-door sales, in spite of high acquisition
costs associated to this channel.
Competitors have re-internalized their sales forces after several years of outsourcing, in
part because they intend to place a lot more emphasis on customer segmentation.
Increased targeting and segmentation: Until now, the lack of proper customer targeting
has resulted in important portfolio adjustments: both Poweo and Direct Energy had to
terminate a large number of contracts due to bad debt problems. Another issue for new
entrants related to segmentation is the fact that they had difficulty to recruit
homeowners. With a majority of leaseholders among their portfolio, they suffer from
important churn rates when those customers move. Poweo for example has seen its
churn rate peak at 6% per month by mid 2009 (according to a press release). It appears
new entrants are now trying to improve their targeting, in order to reduce churn and
debt. New massive recruitment campaigns are not expected to start again until the
details of the NOME law are known.
Czech Republic
An increase in marketing and new supplier activity characterised the 2009 switching
environment in the Czech republic, along with the collapse of a major electricity trader (Moravia
Energo, a.s.) and the subsequent application (for the first time) of the concept of supplier of last
resort.

2010 VaasaETT World Energy Retail Market Rankings Report 2010 36
2009 was the first year when competition was visibly active in the household segment, rather
than just larger consumer groups. Nearly four times as many residential customers switched their
retailer in 2009 compared to 2008, and nine retailers were competing for residential customers.
Alberta, Canada
Alberta is considered an Active market, but due to switching data comparability issues,
it is not included in the VaasaETT World Energy Retail Market Rankings List for 2009.
Fully open to competition already in January 2001, between January 2002 to December 2009 the
percentage of customers (metering sites) that switched to a competitive retailer increased from
approximately 3% to 30%, representing all customer classes. In the same time period 82% of
large commercial and industrial customers and 47% of small commercial and industrial customers
switched to a competitive retailer. Commercial and industrial customers are (relative to other
customer groups) generally more knowledgeable of the electricity markets and therefore more
comfortable in choosing an electricity retailer.
In the Alberta retail market customers who use less than 250,000kWh annually can choose
between a regulated rate option (RRO) or a competitive contract. The rate under the RRO
consists of a blend of monthly forward contacts and long-term hedges that RRO providers
purchase on behalf of their customers. Customers have, since 2006, gradually been transitioning
to a rate where the RRO will be entirely based on monthly forward hedges. In July 2010 the RRO
will be based 100% on monthly forward hedges. There are currently four residential retailers and
ten commercial and industrial retailers. Most competitive contracts available to residential
customers are either for one to five year terms or for a flow-through of the monthly average
wholesale price. The Alberta retail electricity market has shown a continuous increase in the
number of customers switching from the RRO to competitive market products.
Portugal
In 2009 Portuguese competition activity benefited from the Spanish new entrant
utilities (facilitated by low interconnection constraints with Spain), with the context of
savings potentials driven by wholesale opportunities. Nevertheless, Portugal remains a Dormant
market according to the VaasaETT UCSRP definition. Following the voluntary return of most non-
residential customers to the regulated tariff in 2008, switching from the regulated tariff has
however once again returned due to favorable conditions for the transition of customers from
the regulated market to liberalized market, (taking advantage of the gap that existed between
the last resort tariffs and the prices in the liberalized market).

2010 VaasaETT World Energy Retail Market Rankings Report 2010 37
In 2009, the existence of a small but significant price spread between Portugal and Spain and
reduced interconnect congestion, meant that trading risk for Spanish retailers (which do not have
generation in Portugal) reduced, encouraging more competitiveness and competition from those
retailers, enabling the new entrants to gain slightly larger numbers of customers. The level of
aggregated switching remained under 1% per annum, as it did in 2008, but there are signs of
sprouts in the Portuguese market. The future of competition in Portugal is nevertheless
considered bleak unless regulated tariffs are removed.
Greece
Greece’s still Dormant switching level increased ever so slightly in 2009, largely due to
high retail prices for smaller consumption segments combined with wholesale opportunities for
new entrants, and increased activity from new entrants (known as non PPC suppliers). The trend
furthermore appeared to continue into 2010, with nearly 25000 customers (mainly industrial and
commercial) switching retailer (to a non-incumbent retailer) in the first quarter of 2010.
According to ERSE, the Portuguese energy regulatory authority, there are two main reasons for
the increase in switching:
a. The tariffs of the integrated company PPC suffer from distortions and cross subsidies that
benefit residential customers at the expense of I&C customers. This provides opportunities for
retailers that focus on the needs of I&C customers.
b. During 2009 high hydro generation meant wholesale prices were quite low, offering a
considerable margin to suppliers to enter the retail market. Nevertheless, during 2010 it is
expected that the tariffs of PPC will be rebalanced and all cross subsidies and distortions will be
removed, result the containment of switching to new suppliers.
Greece is expected to remain a dormant market, especially for residential customers, in the
foreseeable future, and until major regulatory and structural reform takes place.

2010 VaasaETT World Energy Retail Market Rankings Report 2010 38
From a marketing perspective, there is no
more important determinant of switching
than effective timing. Timing manifests
itself in the dynamics of switching through
a multitude of ways.
Whether competing to win or keep customers, utilities must consider
factors such as seasonality, cyclicality, taking advantage of competitors’
price rises and publicity mishaps and
playing to customer emotions and
levels of critical awareness, to name but a few.
Furthermore, we are not just talking about approximate
timing, sometimes windows of opportunity extend no more
than a matter of days.
No switching determinant dominates however. VaasaETT has
identified and analysed over 100 variables that are all
significant within the context of switching rates. It is the
state, interplay and dynamics of all these variables that
determines switching levels and trends.
The Importance of Timing
On average, across all markets
(excluding AUS and NZ), over 69% of
switching takes place in Q1 & Q2

2010 VaasaETT World Energy Retail Market Rankings Report 2010 39
Meet the Authors
Dr Philip E Lewis
Dr Lewis is a leading international specialist in utility customer behaviour and
psychology and related market and marketing issues including especially
Customer Loyalty, Demand Response/Eco-Home/Smart Grid and Market
Competitiveness.
During 14 years in the liberalized utilities industry Dr Lewis has conducted customer
switching related research in over 50 countries and four continents for over 330
organizations including for instance Shell, E.ON, EDF, Panasonic, BP, Nokia and British Gas.
Dr Lewis has also worked extensively at an industry and market-wide
level, having written major benchmarking and advisory reports for
e.g. the European Regulator’s Group for Electricity and Gas (ERGEG)
and government ministries, as well as providing opinion and advice
for e.g. the EU, the Finnish Parliament and various other
governmental organizations around the world.
Dr Lewis is a globally renowned expert in the field of customer
switching and loyalty. His World Energy Retail Market Rankings report
is the leading authority on customer switching trends around the
world, and his definition of customer switching has been effectively
adopted as the European norm within Europe and Australia (by the
European Union / European Regulators) as the Energy Retailers of
Australia Association). Dr Lewis also has an extensively array of both
Industry and Academic publications to his name and was founding
chief editor of the book 'The Energyforum Global Report’, as well as a
co-writer of the renowned Capgemini European Energy Markets Observatory. He has also
chaired and co-organized dozens of high level conferences globally.
Dr Lewis was formerly head of Marketing Research and Analysis for a UK based retailing
subsidiary of Amoco and (now) EDF, during the onset of competition in the British retail
energy market. Following this Dr Lewis was founder and chief of the University of Vaasa
Energy Markets Group (VaasaEMG) as well as an Assistant Professor of Marketing. Dr Lewis
holds a PhD in Marketing (customer psychology and behaviour) from the University of Edinburgh,
Scotland and developed his graduate marketing expertise in the banking sector with American
Express Bank in Frankfurt and National Westminster Bank in London. More information at:
www.vaasaett.com/contact
2010 VaasaETT World Energy Retail Market Rankings Report 2010 40
Sean Brennan
Sean is a research analyst at VaasaETT, and has been investigating
global utility customer switching trends for the past two years under the
guidance of Dr Philip E. Lewis.
Sean, collaborating with contacts within the Utility Customer Switching Research Project’s
extensive global network of sources, is VaasaETT’s lead connection to the latest and best
switching data from around the world. Born and educated in the USA, Sean is now based in
Finland and is additionally trained in IT related market issues as well as network
development.
Contributors The authors gratefully acknowledge and appreciate all the many
people who generously donated time, knowledge and or data to
assist the development of this report, including the following:
Jennifer Mosende, Department of Energy, Electricity
Division, Retail Policy Business Unit , Alberta, Canada
Gert Mergan, Vlaamse Reguleringsinstantie voor de
Elektriciteits- en Gasmark, Belgium – Flanders
Alain Vasteels; Commission Wallonne Pour L’Energie, The
Regulatory Authority for Energy, Belgium – Wallonia
Marko Senčar; Energy Agency of the Republic of Slovenia
Ivar Þorsteinsson, Orkustofnun, National Energy Authority,
Iceland
Matthias Noorlander, Netherlands Competition Authority
(NMa) / Office of Energy Regulation
Members of the Energy Retailers of Australia Association
Helle Stisen; Dansk Energi
Patricia de-Suzzoni; Commission de régulation de l'énergie
Please note that many contributors stated a wish not to be named in this report. To those people
we also express our sincere gratitude.

2010 VaasaETT World Energy Retail Market Rankings Report 2010 41
Additional Sources and References We would also like to thank the following organizations for providing or facilitating data that was
used for the purpose of compiling this report:
ERAA (Australia), AEMO (Australia), BBC.co.uk, Electricity Authority (New Zealand), ERCOT
(Texas), New York State Public Service Commission, Government of Alberta Department of
Energy, OFGEM (Great Britain), Energiamarkkinavirasto (Finnish Energy Market Authority),
BnetzA (Germany), E-Control (Austria), Energiezaak (Netherlands), CNE (Spain), The Norwegian
Water Resources and Energy Directorate (NVE), Statistics Sweden (SCB), Swedish Energy Agency,
The Energy Markets Inspectorate (Sweden), Dansk Energi (Denmark), VREG (Flanders), Autorità
per l'energia elettrica e il gas (Italy), CRE (France), EDF (France), RAE (Greece), Commission for
Energy Regulation – CER - (Ireland), Public Utilities Commission of Latvia –PUC-(Latvia), Energy
Regulatory Office of Poland, ANRE (Romania), Energy Agency of the Republic of Slovenia, CWAPE
(Wallonia), RUGEL (Brussels), Orkustofnun National Energy Authority (Iceland), Entidade
Reguladora dos Serviços Energéticos – ERSE - (Portugal), Institut Luxembourgeois De Regulation
(Luxemburg), Energetický regulační úřad – ERU - (Czech Republic), Operátor trhu s elektřinou, a.s.
- OTE – (Czech Republic), Central Research Institute of Electric Power Industry of Japan (CRIEPI).
www.utility-customer-switching.com
VaasaETT Global Energy Think Tank
www.vaasaett.com