vacuum deposition of resistors - philips bound... · 1962/63, no. 4/5 vacuumdeposition of resistors...
TRANSCRIPT
144 PHILIPS TECHNICAL REVIEW VOLUME 24
VACUUM DEPOSITION OF RESISTORS
by P. HUIJER *), W. T. LANGENDAM *) and J. A. LELY *).
Vacuum deposition of metals and alloys
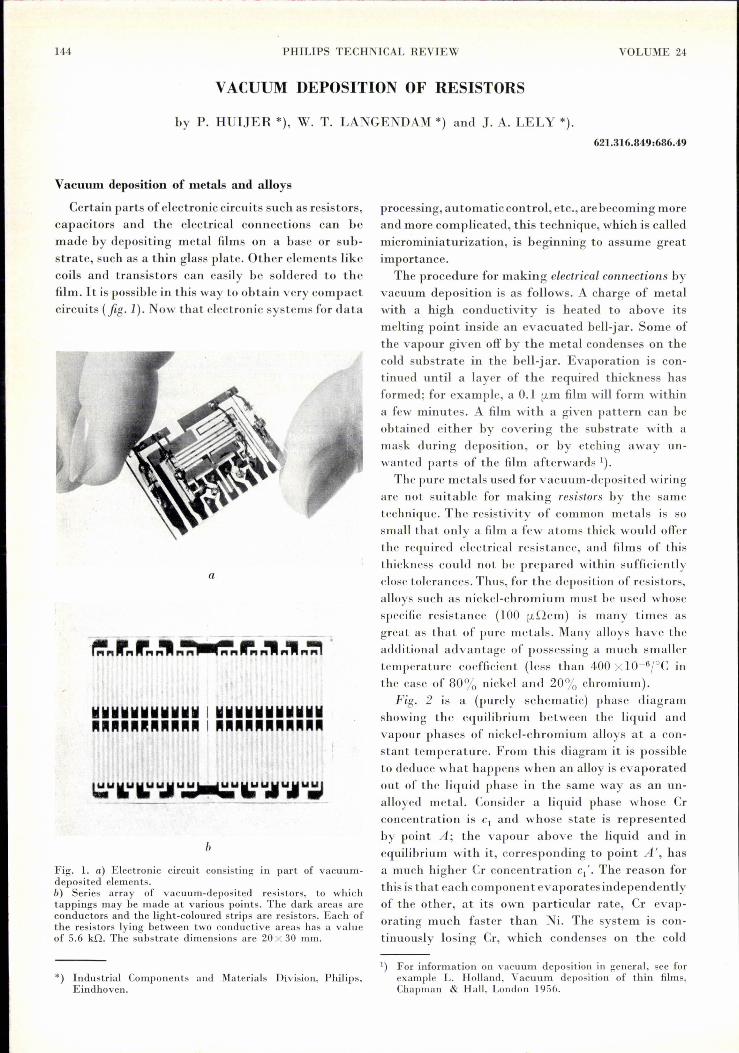
Certain parts of electronic circuits such as resistors,capacitors and the electrical connections can bemade by depositing metal films on a base or sub-strate, such as a thin glass plate. Other elements likecoils and transistors can easily be soldered to thefilm. It is possible in this way to obtain very compactcircuits (fig.1). Now that electronic systems for data
a
b
Fig. La) Electronic circuit consisting III part of vacuum-deposited elements.b) Series array of vacuum-deposited resistors, to whichtappings may be made at various points. The dark areas areconductors and the light-coloured strips are resistors. Each ofthe resistors lying between two conductive areas has a valueof 5.6 kno The substrate dimensions are 20 X 30 mm.
*) Industrial Components and Materials Division, Philips,Eindhoven.
621.316.849:686.49
processing, automaticcontrol, etc., arebecoming moreand more complicated, this technique, which is calledmicrominiaturization, is beginning to assume greatimportance.
The procedure for making electrical connections byvacuum deposition is as follows. A charge of metalwith a high conductivity is heated to above itsmelting point inside an evacuated bell-jar. Some ofthe vapour given off by the metal condenses on thecold substrate in the bell-jar. Evaporation is con-tinued until a layer of the required thickness hasformed; for example, a 0.1 f1.mfilm will form withina few minutes. A film with a given pattern can beobtained cither by covering the substrate with amask during deposition, or by etching away un-wanted parts of the film afterwards 1).The pure metals used for vacuum-deposited wiring
are not suitable for making resistors by the sametechniquc. Thc resistivity of common metals is sosmall that only a film a few atoms thick would offerthe required electrical resistance, and films of thisthickness could not be prepared within sufficientlyclose tolerances. Thus, for the deposition of resistors,alloys such as nickel-chromium must be used whosespecific resistance (100 f1.Qcm) is many times asgrcat as that of pure metals. Many alloys have theadditional advantage of possessing a much smallertemperature coefficient (less than 400 X 10-6;oC inthe case of 80% nickel and 20% chromium).
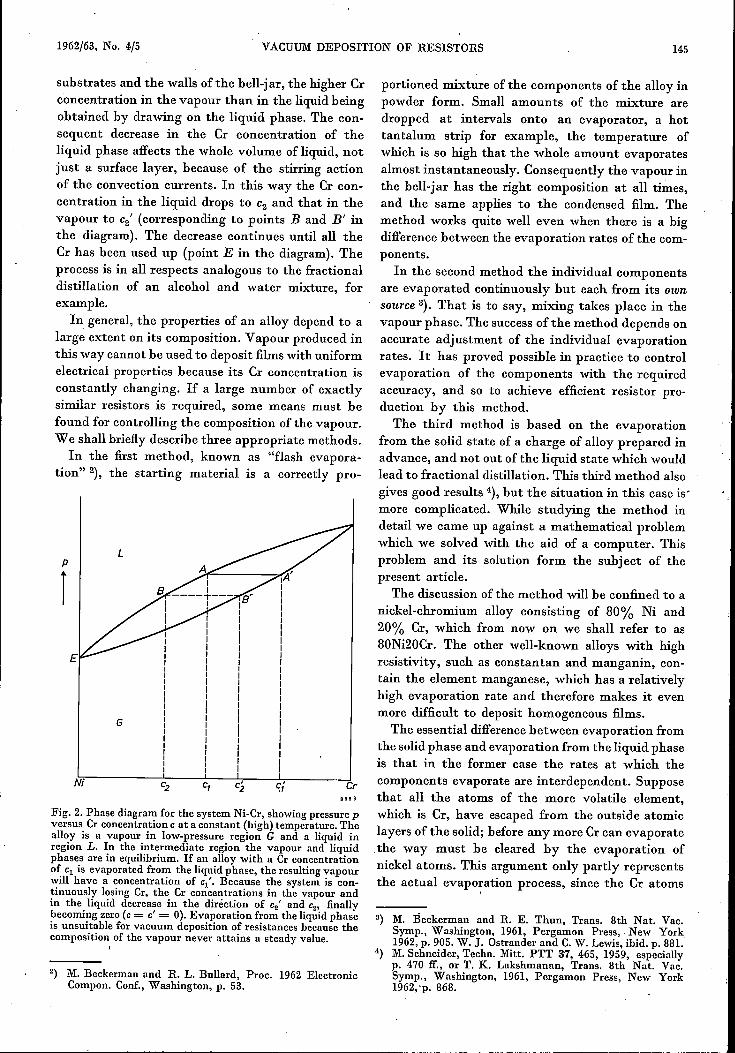
Fig. 2 is a (purely schematic) phase diagramshowing the equilibrium between the liquid andvapour phases of nickel-chromium alloys at a con-stant temperature. From this diagram it is possibleto deduce what happens when an alloy is evaporatedout of the liquid phase in the same way as an un-alloyed metal. Consider a liquid phase whose Cl'concentration is Cl and whose state is representedby point A; the vapour above the liquid and inequilibrium with it, corresponding to point A', hasa much higher Cl' concentration Cl" The reason forthis is that each component evaporatesindependentlyof the other, at its own particular rate, Cl' evap-orating much faster than Ni. The system is con-tinuously losing Cl', which condenses on the cold
1) For inform a tion on vacuum deposition in gcneral, see forexample L. Holland, Vacuum deposition of thin films,Chapman & Hall, London 1956.
1962/63, No. 4/5 VACUUM DEPOSITION OF RESISTORS 145
substrates and the walls ofthe bell-jar, the higher Crconcentration in the vapour than in the liquid beingobtained by drawing on the liquid phase. The con-sequent decrease in the Cr concentration of theliquid phase affects the whole volume of liquid, notjust a surface layer, because of the stirring actionof the convection currents. In this way the Cr con-centration in the liquid drops to C2 and that in thevapour to c2' (corresponding to points Band B' inthe diagram). The decrease continues until all theCr has been used up (point E in the diagram). Theprocess is in all respects analogous to the fractionaldistillation of an alcohol and water mixture, forexample.
In general, the properties of an alloy depend to alarge extent on its composition. Vapour produced inthis way cannot he used to deposit films with uniformelectrical properties because its Cr concentration isconstantly changing. If a large number of exactlysimilar resistors is required, some means must befound for controlling the composition of the vapour.We shall briefly describe three appropriate methods.
In the first method, known as "flash evapora-tion" 2), the starting material is a correctly pro-
p
r
G
Ni c'.,Fig. 2. Phase diagram for the system Ni-Cr, showing pressure pversus Cr concentration C at a constant (high) temperature. Thealloy is a vapour in low-pressure region G and a liquid inregion L. In the intermediate region the vapour and liquidphases are in equilibrium. If an alloy with a Cr concentrationof Cl is evaporated from the liquid phase, the resulting vapourwill have a concentration of Cl" Because the system is con-tinuously losing Cr, the Cr concentrations in the vapour andin the liquid decrease in the direction of C2' and C2, finallybecoming zero (e= c' = 0). Evaporation from the liquid phaseis unsuitable for vacuum deposition of resistances because thecomposition of the vapour never attains a steady value.,
2) M. Beckerman and R. L. Bullard, Proc. 1962 ElectronicCompon. Conf., Washington, p. 53.
Cr
portioned mixture of the components of the alloy inpowder form. Small amounts of the mixture aredropped at intervals onto an evaporator, a hottantalum strip for example, the temperature ofwhich is so high that the whole amount evaporatesalmost instantaneously. Consequently the vapour inthe bell-jar has the right composition at all times,and the same applies to the condensed film. Themethod works quite well even when there is a bigdifference between the evaporation rates of the com-ponents.
In the second method the individual componentsare evaporated continuously but each from its ownsource 3). That is to say, mixing takes place in thevapour phase. The success of the method depends onaccurate adjustment of the individual evaporationrates. It has proved possible in practice to controlevaporation of the components with the requiredaccuracy, and so to achieve efficient resistor pro-duction by this method.The third method is based on the evaporation
from the solid state of a charge of alloy prepared inadvance, and not out of the liquid state which wouldlead to fractional distillation. This third method alsogives good results 4), but the situation in this case is'more complicated. While studying the method indetail we came up against a mathematical problemwhich we solved with the aid of a computer. Thisproblem and its solution form the subject of thepresent article.
The discussion of the method will be confined to anickel-chromium alloy consisting of 80% Ni and20% Cr, which from now on we shall refer to as80Ni20Cr. The other well-known alloys with highresistivity, such as constantan and manganin, con-tain the element manganese, which has a relativelyhigh evaporation rate and therefore makes it evenmore difficult to deposit homogeneous films.
The essential difference between evaporation fromthe solid phase and evaporation from the liquid phaseis that in the former case the rates at which thecomponents evaporate are interdependent. Supposethat all the atoms of the more volatile element,which is Cr, have escaped from the outside atomiclayers of the solid; before any more Cr can evaporatethe way must be cleared by the evaporation ofnickel atoms. This argument only partly representsthe actual evapo~ation process, since the Cr atoms
BaB 3
3) M. :Beckerman and R. E. Thun, Trans. 8th Nat. Vac.Symp., Washington, 1961, Pergamon Press, New York1962,p. 905. W. J. Ostrander and C.W. Lewis, ibid. p. 881.
4) M. Schneider, Techn. Mitt. PTT 37, 465, 1959, especiallyp. 470 if., or T. K. Lakshmanan, Trans. 8th Nat. Vac.Symp., Washington, 1961, Pergamon Press, New York1962, p. 868.

146 PIULIPS TECHNICAL REVIEW VOLUME 24
can also reach the surface by diffusion. But thediffusion process is much slower than convection,and hence, in the solid phase, equilibrium may beestablished between the rate at which the diffusingchromium atoms are arriving at the surface and therate at which they are removed by evaporation.Once this steady state has been attained the com-position of the vapour will remain constant; and filmsdeposited successively will have the same electricalcharacteristics.
We have been able to demonstrate that a steadystate of this kind can in fact be attained when evap-oration takes place from the solid phase. We shallnQWgo into the matter and show how the time takento reach the steady state is calculated. Little im-portance need be attached to the conditions actuallyprevailing in the steady state; if this is associatedwith a vapour phase of composition other than thedesired one, then the remedy will be to modify thestarting composition.
The steady state
The sample of 80Ni20Cr to be evaporated from thesolid phase - it might take the form of a wire 4) -"has to be raised to a temperature of about 1300 °C(the melting point of the alloy is 1395 0c). At thistemperature the vapQur pressures of Ni and Cr are0.25 xl0-3 and 1.8 Xl0-3 torr respectively - highenough to ensure reasonably fast evaporation.If the resulting vapour is condensed in a series of
films, the films first deposited prove to have a veryhigh Cr concentration. This is in accordance withLangmuir's formula 5), which gives the rate Wi ingrammes per second at which a component i evap-crates from unit area at a temperature T:
W' = 5.85 XI0-2p'll Mi C' gfcm2sti, Tt'
where Mi is the molecular weight of the component,Pi its vapour pressure in torr at T "K, and Ci afraction indicating its atomic concentration at thesurface. ~i and Cr have about the same atomicweight (59 and 52 respectively), but the vapourpressure of Cr is a good 7 times that of Ni. Hencethe Cr evaporates much faster than the Ni, with theresult that the system becomes short of Cr; CCr de-.
5) This formula is intended to describe the evaporation ofsingle substances. It is permissible to use it for the com-ponents of an alloy provided these form homogeneousmixed crystals and provided the alloy is an ideal solidsolution. Strictly speaking, 80Ni20Cr satisfies the first con-dition but not the second; however, our experiments haveshown that in regard to evaporation, 80Ni20Cr can safelybe regarded as an ideal solid solution. .'
creases, as does WCr and the Cr concentratien in thevapour (fig. 3). The question now arising is whetherthe decrease of the Cr concentration in the vapourfinally levels off, a steady state thus being attained.Langmuir's formula indicates that it cannot do sounless the concentratien Ci at the surface attains aconstant value; for this to happen, the distributionof concentrations through the bulk of the wire would
0,5eer
x~xr 0,4- <,x xx
0,3 x~xx
0,2
0.1
°0~----~--~2~--~3~--~4-~h---_t e876
Fig. 3. Vapour composition as a function of time when evapo-ration takes place from the solid phase. The sample of alloy tobe evaporated was in the form of a wire which was in theoriginal state at instant t = O. The vapour composition atvarious stages of evaporation was deterrnined by X-ray spectro-scopie examination of the corresponding condensates (i.e. thedeposited metallic films).The spread in the measured concen-trations is of the correct order for this method of determination.
(1)
have to become stationary. The problem is thereforeone of finding whether a concentration gradient canexist in the alloy independent of time.If the material is in the form of a wire, the surface
from which evaporation takes place will be curved,but we shall first consider the simplified case of awire of infinite radius, which corresponds to a flatinterface between a vacuum on the left and a blockof alloy on the right which we can imagine extendingto infinity, this infinitely large block having a tem-perature of 1300 °C.An x axis is drawn perpendicularto the interface. For large positive values of x theCr concentration is constant at 0.2. The evaporationprQcess gives rise to a concentration gradient overthe range of small x values (i.e. near the interface),in cQnsequence of which diffusion takes place. Thelatter process is described by the familiar diffusionequation:
(2)

1962/63, No. 4/5 VACUUMDEPOSITION OF RESISTORS 147
where t is time and D is the diffusion constant 6).Before applying this equation to the present problemwe must remember that Ni and Cr atoms are con-tinuously being lost by evaporation, so that theinterface is steadily moving to the right. The"stationary distribution of concentrations" that weare looking for cannot strictly speaking he stationaryat all, since it will move with the interface, but it;must have a form independent of time. The obviouscourse will therefore be to adopt a moving frame ofreference, the origin of which is located in the inter-face. Let y he the distance of an arbitrary fixed pointfrom this interface, then
y = x-vt,
where v is the constant rate of displacement of theinterface. On substitution of y, (2) becomes
OC 02C OC-=D-+v-.ot oy2 oy
In the steady state oc/ot = 0, and that state will beattainable provided the equation
02C oeD-+v-=Ooy2 oy
possesses a real solution. Itdoes in fact prove to havethe real solution
A is a constant depending on the ratio between theevaporation rates ofNi and Cr; the value ofCoo is 0.2.
Clearly, the shape of the steady-state concentra-tion curve is governed by the ratio vlD,the fall-offbeing restricted to a narrow surface layer in caseswhere v is relatively large (i.e. where evaporation isfast) or where D is relatively small. Concentrationcurves for two values of vlDhave been plotted infig·4.
The above solution applies to a flat interface. Toa first approximation it is also valid for evaporationfrom. a cylindrical wire, provided its diameter is nottoo small. We were able to determine the distrihu-tion of concentrations in a 2 mm wire experimentally,by repeatedly dipping it in a hot mixture of H3P04and HCI04 and measuring the Cr concentrations inthe successive "skins" thus stripped from the wire.A plot of these concentrations has much the sameshape as the curves in fig. 4.
6) The Ni concentration is greater at the surface than in thebulk of the sample, and consequently Ni diffusesinto theinterior. However, we feel it is justified to base the argumenton the difference between the outward diffusion of Cr andthe inward diffusion of Ni. D thus represents the netdiffusion.
OL- _o
-----+ y "H
Fig. 4. The steady-state distribution c(y) of Cr concentrationsin a block bounded by a flat surface, for (1) large and (II) smallvalues of parameter o[D,
(3)
At this juncture we still do not know how long ittakes for the steady state to establish itself, but wecan at least demonstrate that once it is attained, thecomposition of the vapour must be the same as thatof the bulk of the solid alloy. Over a certain intervalof time evaporation will cause the interface to shiftthrough a distance I (fig. 5), the shape of thedistribution curve undergoing no change. If evapo-ration is taking place from a surface of area S, thevolume of solid thus removed and converted intovapour is IS. The proportion of Cr in it is given by Stimes the hatched area in fig. 5; this area is the differ-ence between the areas of two plane figures individ-ually bounded by curves 1 and 2 and extending upto a remote point P on the x axis, and it has a valueof 0.21 (being a curved parallelogram of height 0.2on a base I). The Cr concentration in the vapour istherefore 0.2, the same as that in the bulk of thesolid alloy.
(4)
P--ll>X a878
Fig. 5. If, in the steady state, evaporation causes the interfaceto shift through a distance of I, a volume IS will be removedper area S of interface. The proportion of Cr in this volume isgiven by S times the hatched area in the above diagram, thisarea being 0.21. Once the steady state has been attained,the Cr concentrations in the solid and vapour phases are bothequal to 0.2.
Time required to reach the steady state
We shall now calculate the time that must elapsebefore equilibrium is sufficiently closely approaehedto allow the vacuum deposition of the resistive films
148 PHILIPS TECHNICAL REVIEW VOLUME 24
to be started. For the case of the flat interface thisentails solving eq. (3) in its complete form. With theaid of formula (4.),in which an estimated D and ameasured v value were inserted, it has been estab-lished that the layer within which the concentra-tion varies is about 100 !Lmthick. Unless very thickwires are being used, the curvature of the surfacemay have a marked influence on the evaporationprocess right from the start. Itwill therefore be saferto solve the equation right away for the case of acylindrical wire. For this purpose we shall adopt thecylindrical coordinates r and cp. Eq. (2) now assumesthe form
OC = D (b2C +~OC) ,
ot br2 r ör
where r denotes distance from the axis of the wire.As an initial condition we shall assume that at the
instant t = 0 the Cr concentration is 0.2 throughoutthe sample of alloy. As boundary condition we cantake Langmuir's formula, bearing in mind that WCris proportional to the slope of the concentrationcurve at the surface of the wire, at a distance e fromthe axis. Stated mathematically, the condition isthat
(OC) = kc(e) ,ör r=(]
k being a constant of proportionality. In this casethe displacement of the interface is not allowed forby introducing a moving frame of reference, as wasdone in the case of the flat interface. Accordingly theboundary condition will apply to a moving boundaryand hence to a variable value of e, viz. e = ro- vt,where ro is the radius of the wire at instant t = 0and v is the rate of displacement of the interface.Differential equation (5) subject to boundary con-
dition (6) cannot be solved by the usual analyticalmethods, and we therefore used a computer, arrivingat the solution by numerical methods.
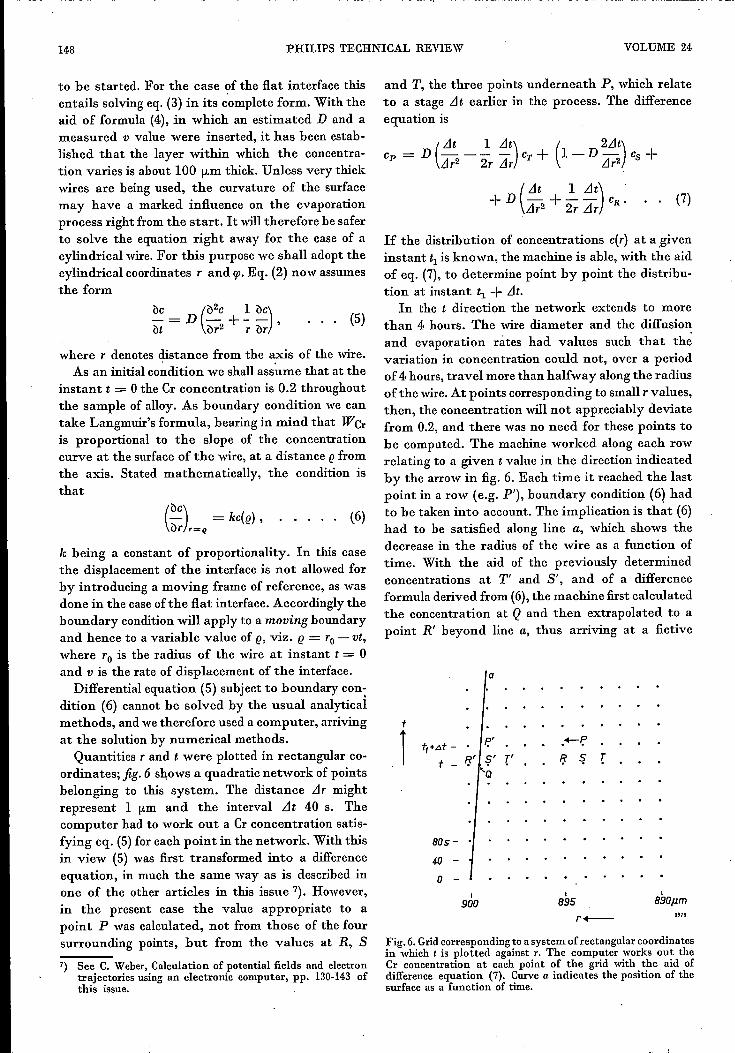
Quantities rand t were plotted in rectangular co-ordinates; fig. 6 shows a quadratic network of pointsbelonging to this system. The distance .1r mightrepresent 1 (Lm and the interval LIt 40 s. Thecomputer had to work out a Cr concentration satis-fying eq. (5) for each point in the network. With thisin view (5) was first transformed into a differenceequation, in much the same way as is described inone of the other articles in this issue 7). However,in the present case the value appropriate to apoint P was calculated, not from those of the foursurrounding points, but from the values at R, S7) See C. Weber, Calculation of potential fields and electron
trajectories using an electronic computer, pp. 130-143 ofthis issue.
and T, the three points underneath P, which relateto a stage Llt earlier in the process. The differenceequation is
Cp = D (~ _.~ Llt) CT + (l-D 2Llt) Cs +Llr2 2r zlr Llr2
(Llt 1 Llt)+D -+-- CR'Llr2 2r zlr
(7)
(5)
If the distribution of concentrations c(r) at a giveninstant tI is known, the machine is able, with the aidof eq. (7), to determine point by point the distribu-tion at instant tI + Llt.
In the t direction the network extends to morethan 4 hours. The wire diameter and the diffusionand evaporation rates had values such that th~variation in concentration could not, over a periodof 4 hours, travel more than halfway along the radiusof the wire. At points corresponding to small rvalues,then, the concentration will not appreciably deviatefrom 0.2, and there was no need for these points tobe computed. The machine worked along each rowrelating to a given t value in the direction indicatedby the arrow in fig. 6. Each time it reached the lastpoint in a row (e.g. PI), boundary condition (6) hadto be taken into account. The implication is that (6)had to be satisfied along line a, which shows thedecrease in the radius of the wire as a function oftime. With the aid of the previously determinedconcentrations at T' and S', and of a differenceformula derived from (6),the machine first calculatedthe concentration at Q and then extrapolated to apoint R' beyond line a, thus arriving at a fictive
(6)
805-
40
o
a
t
Î t,+At - F;' .-I?
t - ~' S' t ~ s r....iJ
I
900I895
I89op.m
B879
Fig. 6.Gridcorresponding to a system of rectangular coordinatesin which t is plotted against T. Thc computer works out theCr concentration at each point of the grid with the aid ofdifference equation (7). Curve a indicates the position of thesurface as a function of time.
1962/63, ~o. 4/5 VACUUM DEPOSITIO~ OF RESISTORS 149
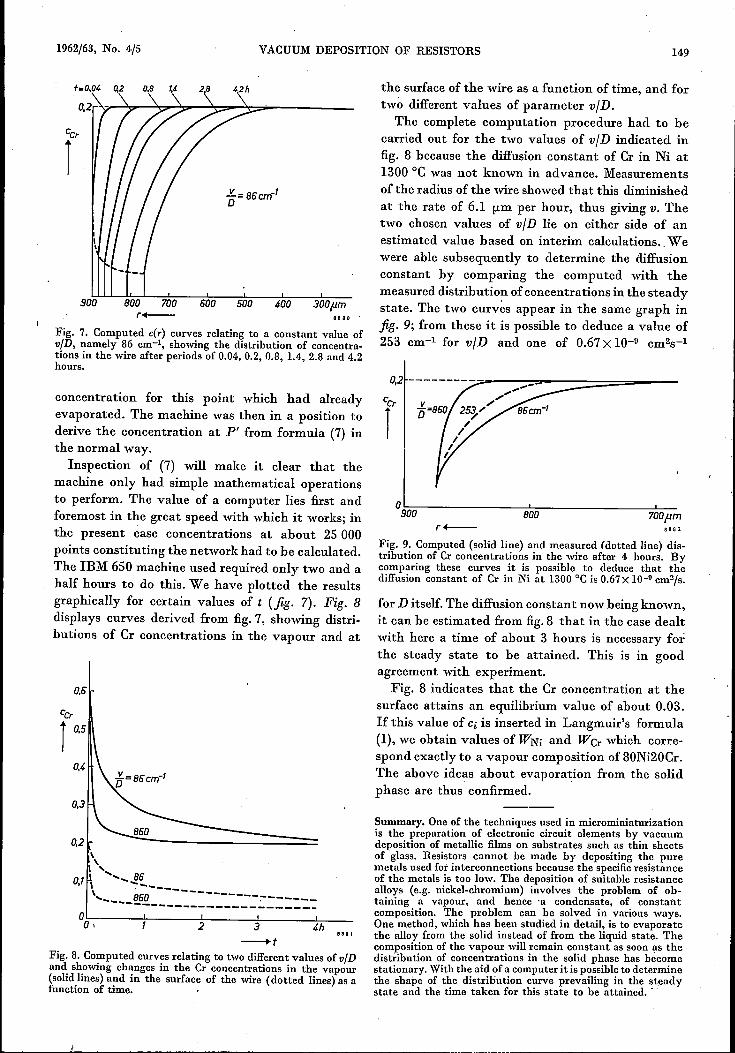
900 800 700 600 500 400 300pm88 8 0
Fig. 7. Computed c(r) curves relating to a constant value of»[I), namely 86 cm-I, showing the distribution of concentra-tions in the wire after periods of 0.04, 0.2, 0.8, 1.4, 2.8 and 4.2hours.
concentration for this point which had alreadyevaporated. The machine was then in a position toderive the concentration at P' from formula (7) inthe normal way.
Inspection of (7) will make it clear that themachine only had simple mathematical operationsto perform. The value of a computer lies first andforemost in the great speed with which it works; inthe present case concentrations at about 25 000points constituting the network had to be calculated.The IBM 650 machine used required only two and ahalf hours to do this. We have plotted the resultsgraphically for certain values of t (jig. 7). Fig. 8displays curves derived from fig.7, showing distri-butions of Cr concentrations in the vapour and at
0.6
eerr 0.5
,\, '....
01 ........86, , ..........'...._ 860--------------:----- __-------------------------
~~, ----~------~2~-----3~------4~h----
-fFig. 8. Computed curves relating to two different values of vlDand showing changes in the Cr concentrations in the vapour(solidlines) and in the surface of the wire (dotted lines) as afunction of time. .
the surface of the wire as a function of time, and fortwo different values of parameter viD.
The complete computation procedure had to becarried out for the two values of vlD indicated infig. 8 because the diffusion constant of Cr in Ni at1300 °C was not known in advance. Measurementsof the radius of the wire showed that this diminishedat the rate of 6.1 !Lmper hour, thus giving v. Thetwo chosen values of vlD lie on either side of anestimated value based on interim calculations ..Wewere able subsequently to determine the diffusionconstant by comparing the computed with themeasured distribution of concentrations in the steadystate. The two curves appear in the same graph injig. 9; from these it is possible to deduce a value of253 cm-1 for »[I) and one of 0.67 X 10⁻⁹ cm2s-1
r.1=------=,=, ~'900 800 700pm
8882r+--Fig. 9. Computed (solid line) and measured (dotted line) dis-tribution of Cr concentrations in the wire after 4. hours. Bycomparing these curves it is possible to deduce that thediffusion constant of Cr in Ni at 1300 °C is 0.67x 10-D cm2/s.
for D itself. The diffusion constant now being known,it can he estimated from fig.8 that in the case dealtwith here a time of about 3 hours is necessary forthe steady state to be attained. This is in goodagreement with experiment.Fig. 8 indicates that the Cr concentration at the
surface attains an equilibrium value of about 0.03.If this value of ei is inserted in Langmuir's formula(1), we obtain values of WNi and WCr which corre-spond exactly to a vapour composition of 80Ni20Cr.The above ideas about evaporation from the solidphase are thus confirmed.
8881
Summary. One of the techniques used in microminiaturizationis the preparation of electronic circuit elements by vacuumdeposition of metallic films on substrates such as thin sheetsof glass. Resistors cannot be made by depositing the puremetals used for interconnections because the specificresistanceof the metals is too low. The deposition of suitable resistancealloys (e.g. nickel-chromium) involves the problem of ob-taining a vapour, and hence 'a condensate, of constantcomposition. The problem can be solved in various ways.One method, which has been studied in detail, is to evaporatethe alloy from the solid instead of from the liquid state. Thecomposition of the vapour will remain constant as soon as thedistribution of concentrations in the solid phase has becomestationary. With the aid of a computer it is possible to determinethe shape of the distribution curve prevailing in the steadystate and the time taken for this state to be attained. -