vail, colorado february 14, 2018 presentation meg gentle, ceo credit suisse 23rd annual energy...
TRANSCRIPT
Corporate presentation
Meg Gentle, CEO
Credit Suisse 23rd Annual Energy SummitVail, ColoradoFebruary 14, 2018
Cautionary statementsThe information in this presentation includes “forward-looking statements” within the meaning of Section 27A of the Securities Act of 1933, as amended, and Section 21E of the Securities Exchange Act of 1934, as amended. All statements other than statements of historical fact are forward-looking statements. The words “anticipate,” “assume,” “believe,” “budget,” “estimate,” “expect,” “forecast,” “initial,” “intend,” “may,” “plan,” “potential,” “project,” “should,” “will,” “would,” and similar expressions are intended to identify forward-looking statements. The forward-looking statements in this presentation relate to, among other things, future contracts, contract terms and margins, future cash flows and production, estimated ultimate recoveries and delivery of LNG, future costs, prices, financial results, rates of return, liquidity and financing, regulatory and permitting developments, construction and permitting of pipelines and other facilities, future demand and supply affecting LNG and general energy markets and other aspects of our business and our prospects.
Our forward-looking statements are based on assumptions and analyses made by us in light of our experience and our perception of historical trends, current conditions, expected future developments, and other factors that we believe are appropriate under the circumstances. These statements are subject to numerous known and unknown risks and uncertainties which may cause actual results to be materially different from any future results or performance expressed or implied by the forward-looking statements. These risks and uncertainties include those described in the “Risk Factors” section of our Quarterly Report on Form 10-Q for the quarter ended September 30, 2017 filed with the Securities and Exchange Commission (the “SEC”) on November 9, 2017 and other filings with the SEC, which are incorporated by reference in this presentation. Many of the forward-looking statements in this presentation relate to events or developments anticipated to occur numerous years in the future, which increases the likelihood that actual results will differ materially from those indicated in such forward-looking statements.
Plans for the Permian Global Access Pipeline and Haynesville Global Access Pipeline projects discussed herein are in the early stages of development and numerous aspects of the projects, such as detailed engineering and permitting, have not commenced. Accordingly, the nature, timing, scope and benefits of those projects may vary significantly from our current plans due to a wide variety of factors, including future changes to the proposals. Although the Driftwood Pipeline project is significantly more advanced in terms of engineering, permitting and other factors, its construction, budget and timing are also subject to significant risks and uncertainties.
Projected future cash flows as set forth herein may differ from cash flows determined in accordance with GAAP.
The information on slides 15, 16, 24, and 25 is meant for illustrative purposes only and does not purport to show estimates of actual future financial arrangements or performance.
The forward-looking statements made in or in connection with this presentation speak only as of the date hereof. Although we may from time to time voluntarily update our prior forward-looking statements, we disclaim any commitment to do so except as required by securities laws.
Reserves and resourcesEstimates of non-proved reserves and resources are based on more limited information, and are subject to significantly greater risk of not being produced, than are estimates of proved reserves.
Forward-looking statements
2 Disclaimer
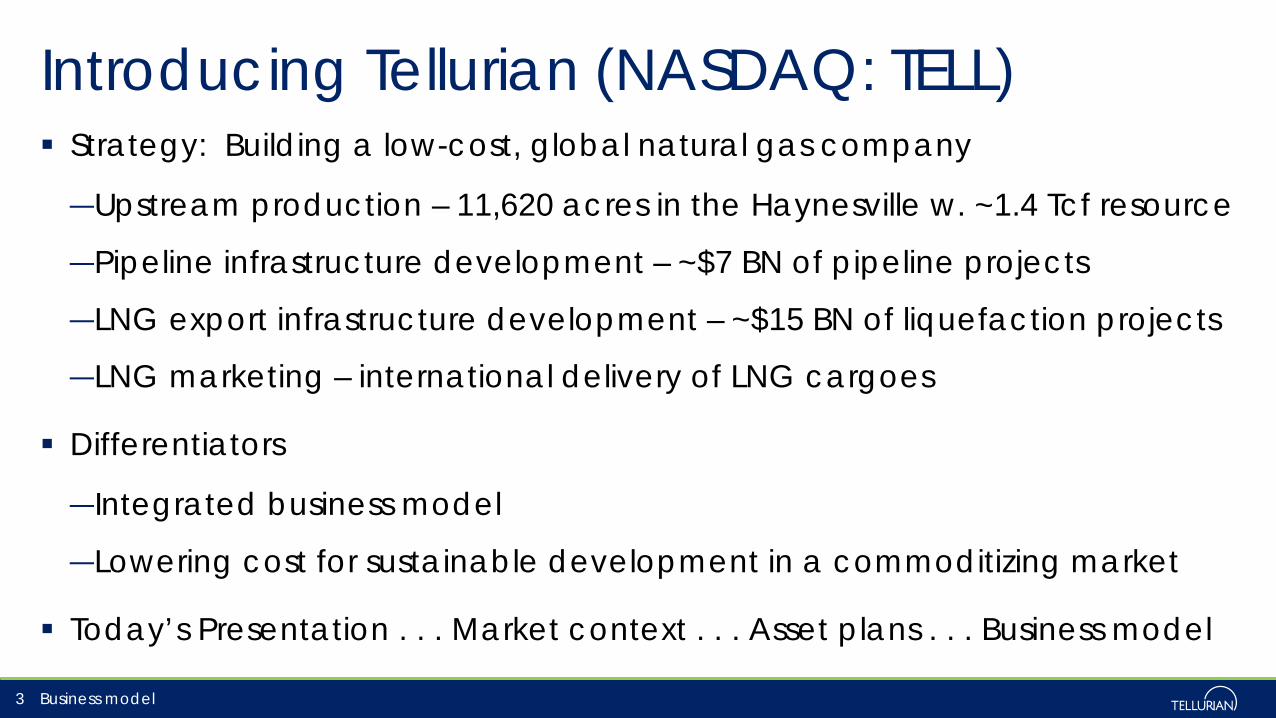
Strategy: Building a low-cost, global natural gas company
―Upstream production – 11,620 acres in the Haynesville w. ~1.4 Tcf resource
―Pipeline infrastructure development – ~$7 BN of pipeline projects
―LNG export infrastructure development – ~$15 BN of liquefaction projects
―LNG marketing – international delivery of LNG cargoes
Differentiators
―Integrated business model
―Lowering cost for sustainable development in a commoditizing market
Today’s Presentation . . . Market context . . . Asset plans . . . Business model
Introducing Tellurian (NASDAQ: TELL)
3 Business model
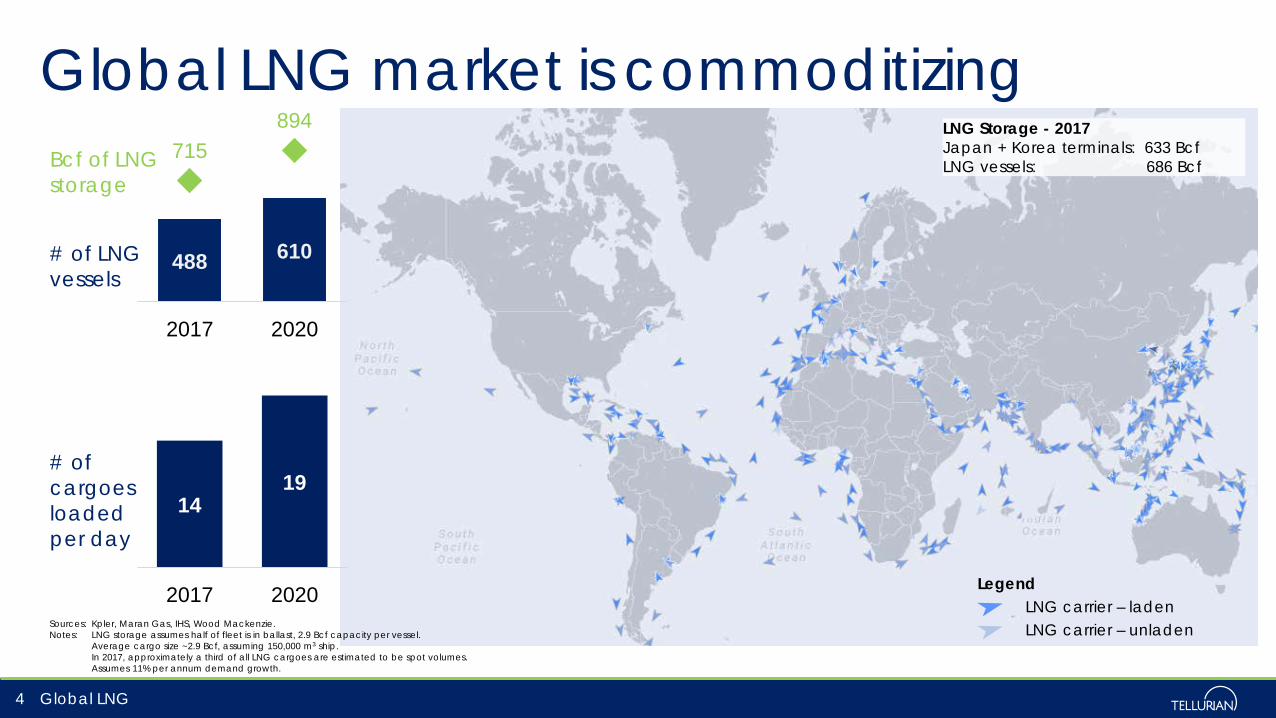
Sources: Kpler, Maran Gas, IHS, Wood Mackenzie.Notes: LNG storage assumes half of fleet is in ballast, 2.9 Bcf capacity per vessel.
Average cargo size ~2.9 Bcf, assuming 150,000 m3 ship.In 2017, approximately a third of all LNG cargoes are estimated to be spot volumes.Assumes 11% per annum demand growth.
Global LNG market is commoditizing
4 Global LNG
488 610
715894
2017 2020
Bcf of LNG storage
# of LNG vessels
# of cargoes loadedper day
LegendLNG carrier – ladenLNG carrier – unladen
LNG Storage - 2017Japan + Korea terminals: 633 BcfLNG vessels: 686 Bcf
1419
2017 2020
10
15
20
25
30
35
40
45
2001
2003
2005
2007
2009
2011
2013
2015
2017
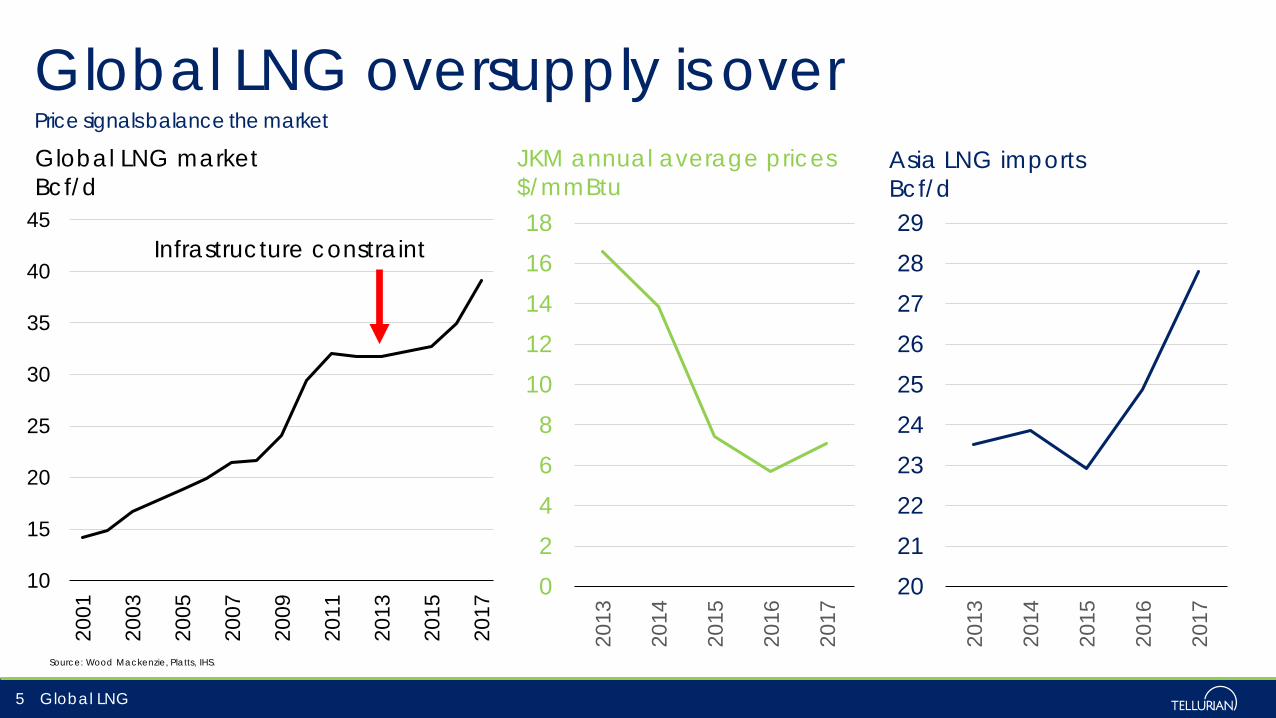
Global LNG oversupply is over
Global LNG5
02468
1012141618
2013
2014
2015
2016
2017
20212223242526272829
2013
2014
2015
2016
2017
Asia LNG importsBcf/d
JKM annual average prices$/mmBtu
Source: Wood Mackenzie, Platts, IHS.
Price signals balance the market
Global LNG marketBcf/d
Infrastructure constraint
$ 0
$ 2
$ 4
$ 6
$ 8
$ 10
Jan-
15
Jul-1
5
Jan-
16
Jul-1
6
Jan-
17
Jul-1
7
Jan-
18
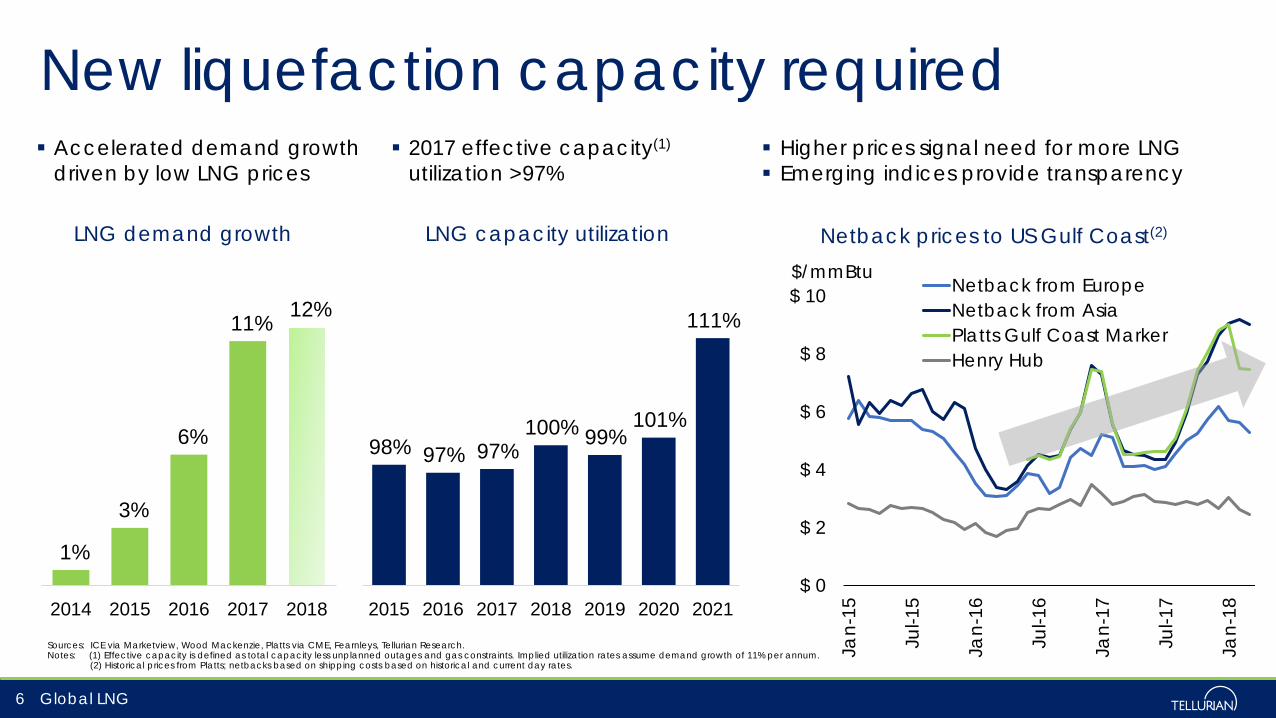
$/mmBtuNetback from EuropeNetback from AsiaPlatts Gulf Coast MarkerHenry Hub
Netback prices to US Gulf Coast(2)
New liquefaction capacity required
6
Sources: ICE via Marketview, Wood Mackenzie, Platts via CME, Fearnleys, Tellurian Research.Notes: (1) Effective capacity is defined as total capacity less unplanned outages and gas constraints. Implied utilization rates assume demand growth of 11% per annum.
(2) Historical prices from Platts; netbacks based on shipping costs based on historical and current day rates.
Global LNG
Accelerated demand growth driven by low LNG prices
2017 effective capacity(1)
utilization >97% Higher prices signal need for more LNG Emerging indices provide transparency
LNG demand growth LNG capacity utilization
1%
3%
6%
11% 12%
2014 2015 2016 2017 2018
98% 97% 97%100% 99%
101%
111%
2015 2016 2017 2018 2019 2020 2021

Driftwood LNG terminal
Notes: (1) Before owners’ costs, financing costs and contingencies.
7
Driftwood LNG terminal
Land ~1,000 acres near Lake Charles, LA
Capacity ~27.6 mtpa
Trains Up to 20 trains of ~1.38 mtpa each Chart heat exchangers GE LM6000 PF+ compressors
Storage 3 storage tanks 235,000 m3 each
Marine 3 marine berths
Capex ~$550 per tonne ~$15.2 billion(1)
Artist rendition
Driftwood LNG
0
2
4
6
8
10
12
1 2 3 4 5 6 7 8
Bcf/d
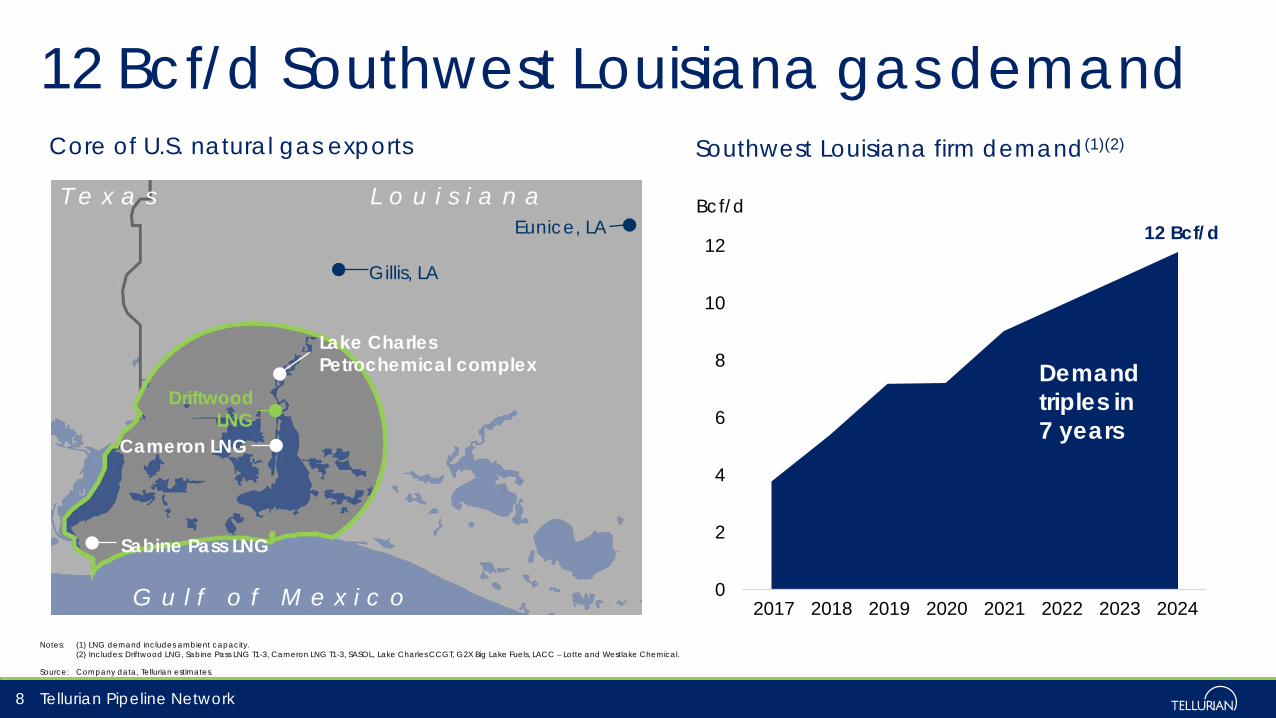
Notes: (1) LNG demand includes ambient capacity.(2) Includes: Driftwood LNG, Sabine Pass LNG T1-3, Cameron LNG T1-3, SASOL, Lake Charles CCGT, G2X Big Lake Fuels, LACC – Lotte and Westlake Chemical.
Source: Company data, Tellurian estimates.
L o u i s i a n aT e x a s
G u l f o f M e x i c o
Lake CharlesPetrochemical complex
Gillis, LA
Eunice, LA
Driftwood LNG
8 Tellurian Pipeline Network
Cameron LNG
Sabine Pass LNG
12 Bcf/d
Southwest Louisiana firm demand(1)(2)Core of U.S. natural gas exports
12 Bcf/d Southwest Louisiana gas demand
2017 2018 2019 2020 2021 2022 2023 2024
Demand triples in 7 years
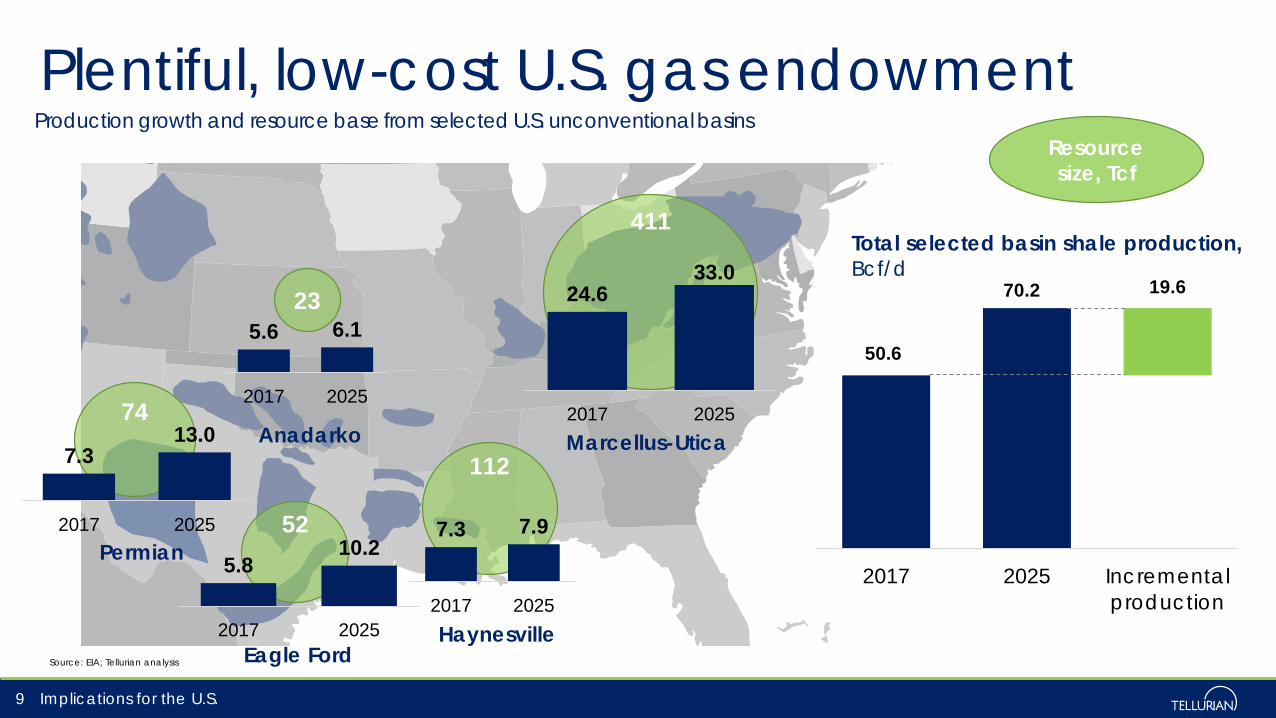
Plentiful, low-cost U.S. gas endowment
Implications for the U.S.9
Production growth and resource base from selected U.S. unconventional basins
Source: EIA; Tellurian analysis
411
112
74
23
52
Resource size, Tcf
Marcellus-Utica
HaynesvilleEagle Ford
Permian
Anadarko
7.3 7.9
2017 2025
7.313.0
2017 2025
24.633.0
2017 2025
5.6 6.1
2017 2025
5.810.2
2017 2025
50.6
70.2 19.6
2017 2025 Incrementalproduction
Total selected basin shale production,Bcf/d
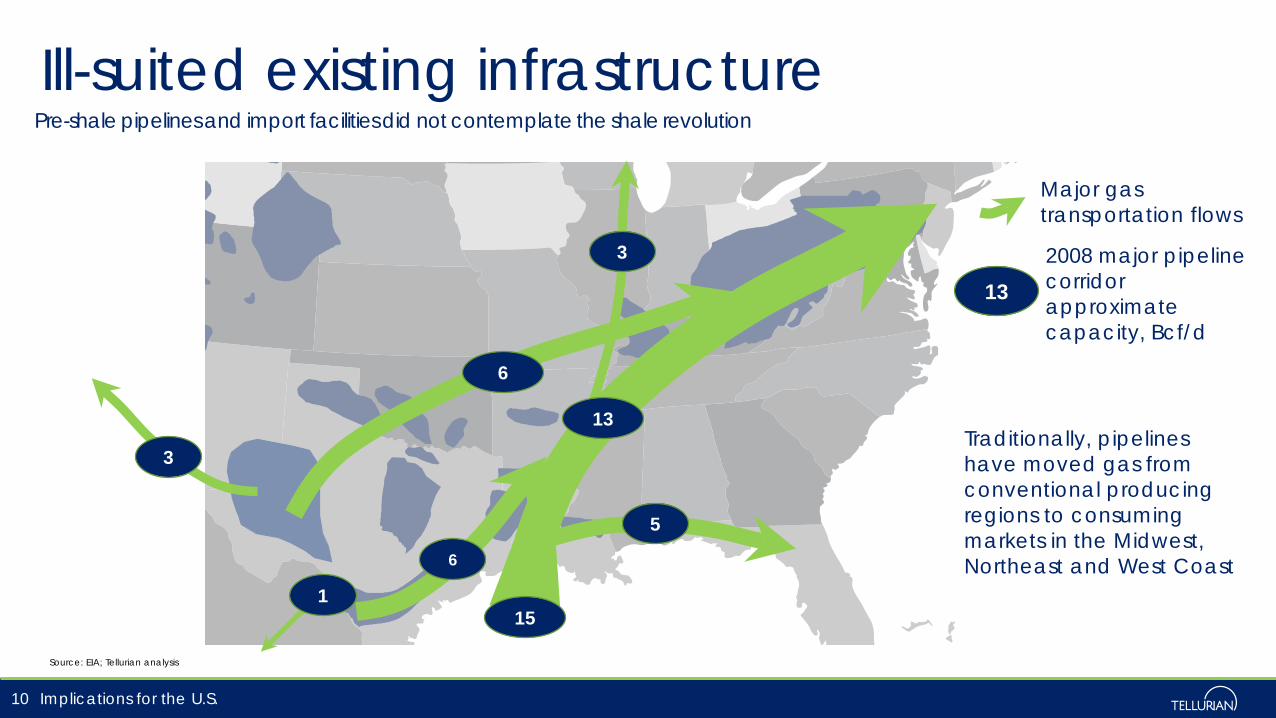
Ill-suited existing infrastructure
Implications for the U.S.10
Pre-shale pipelines and import facilities did not contemplate the shale revolution
Source: EIA; Tellurian analysis
Traditionally, pipelines have moved gas from conventional producing regions to consuming markets in the Midwest, Northeast and West Coast
Major gas transportation flows
13
132008 major pipeline corridor approximate capacity, Bcf/d
3
3
1
5
6
6
15
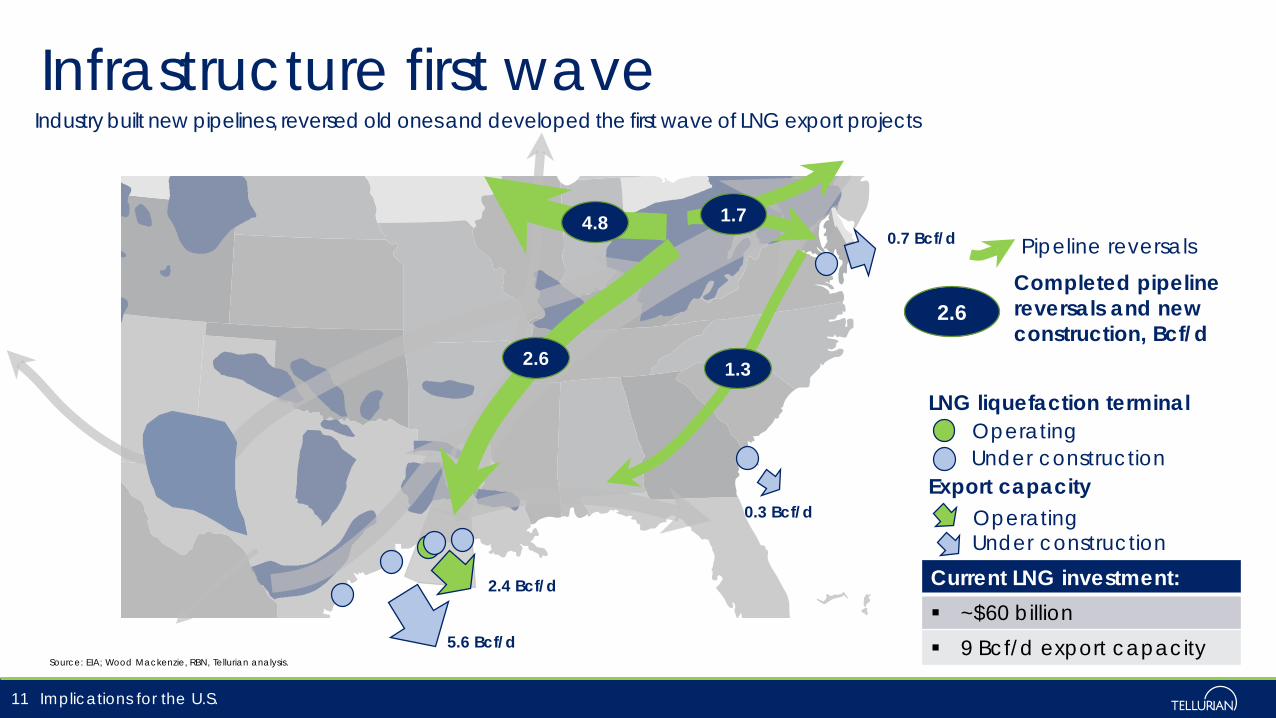
Infrastructure first wave
Implications for the U.S.11
Industry built new pipelines, reversed old ones and developed the first wave of LNG export projects
Source: EIA; Wood Mackenzie, RBN, Tellurian analysis.
0.3 Bcf/d
5.6 Bcf/d
2.4 Bcf/d
0.7 Bcf/d1.7
Current LNG investment: ~$60 billion 9 Bcf/d export capacity
4.8
2.6 1.3
2.6Completed pipeline reversals and new construction, Bcf/d
Pipeline reversals
LNG liquefaction terminalOperatingUnder construction
Export capacityOperatingUnder construction
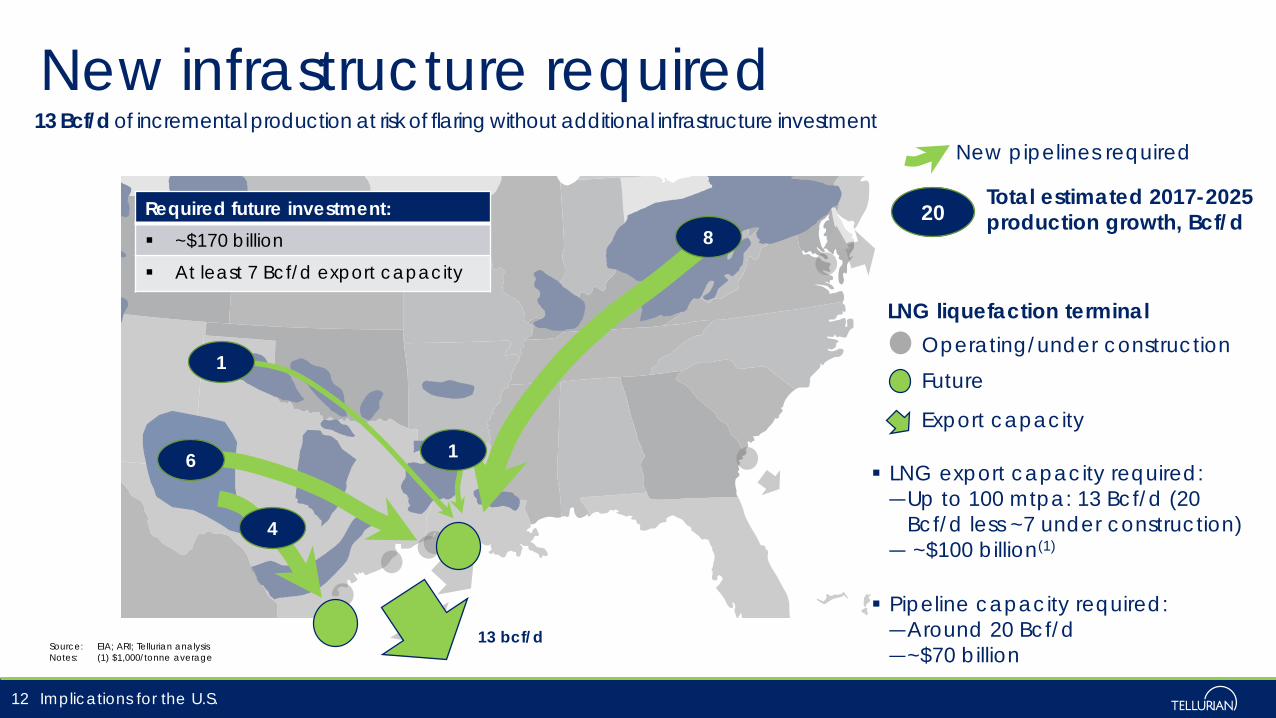
New infrastructure required
Implications for the U.S.12
13 Bcf/d of incremental production at risk of flaring without additional infrastructure investment
Source: EIA; ARI; Tellurian analysisNotes: (1) $1,000/tonne average
LNG export capacity required:―Up to 100 mtpa: 13 Bcf/d (20
Bcf/d less ~7 under construction)― ~$100 billion(1)
Pipeline capacity required:―Around 20 Bcf/d ―~$70 billion
LNG liquefaction terminalOperating/under constructionFuture
Export capacity
13 bcf/d
6
1
8
1
Required future investment: ~$170 billion
At least 7 Bcf/d export capacity
4
20Total estimated 2017-2025 production growth, Bcf/d
New pipelines required
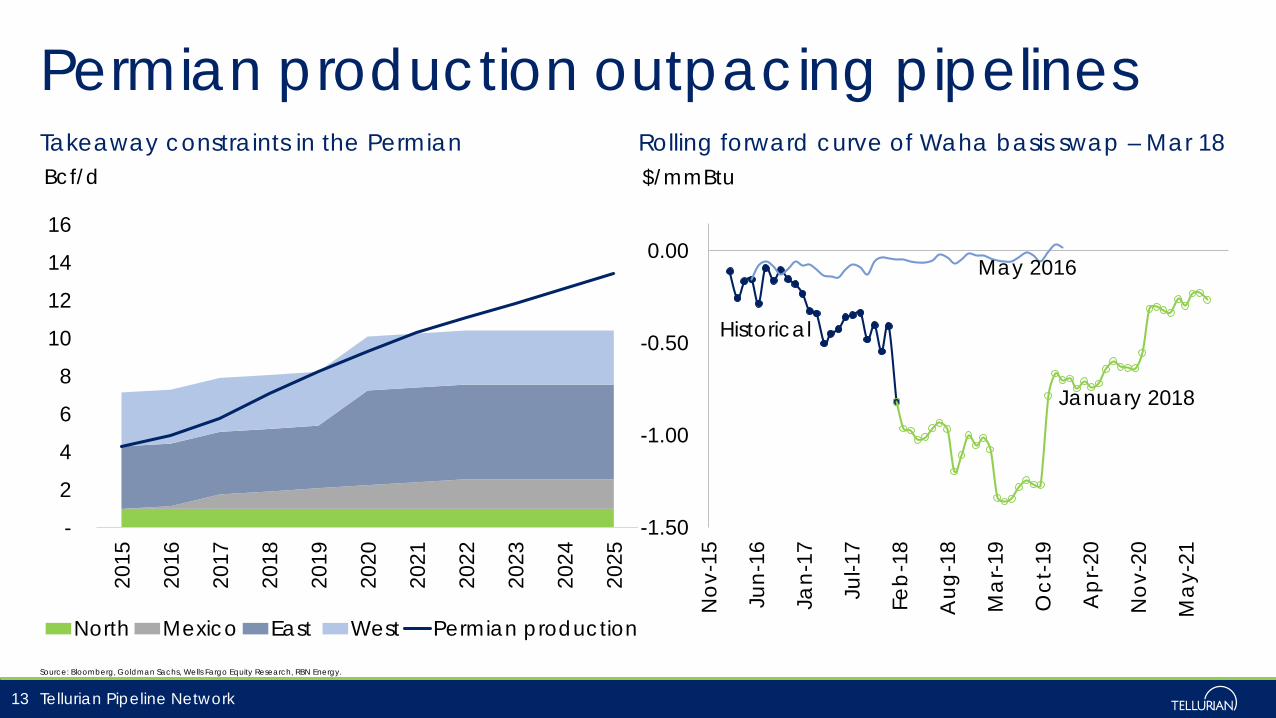
Permian production outpacing pipelines
Tellurian Pipeline Network
Takeaway constraints in the Permian Rolling forward curve of Waha basis swap – Mar 18
Source: Bloomberg, Goldman Sachs, Wells Fargo Equity Research, RBN Energy.
13
-
2
4
6
8
10
12
14
16
2015
2016
2017
2018
2019
2020
2021
2022
2023
2024
2025
Bcf/d
North Mexico East West Permian production
-1.50
-1.00
-0.50
0.00
Nov
-15
Jun-
16
Jan-
17
Jul-1
7
Feb
-18
Aug
-18
Ma
r-19
Oct
-19
Ap
r-20
Nov
-20
Ma
y-21
$/mmBtu
Historical
January 2018
May 2016
Tellurian Pipeline Network
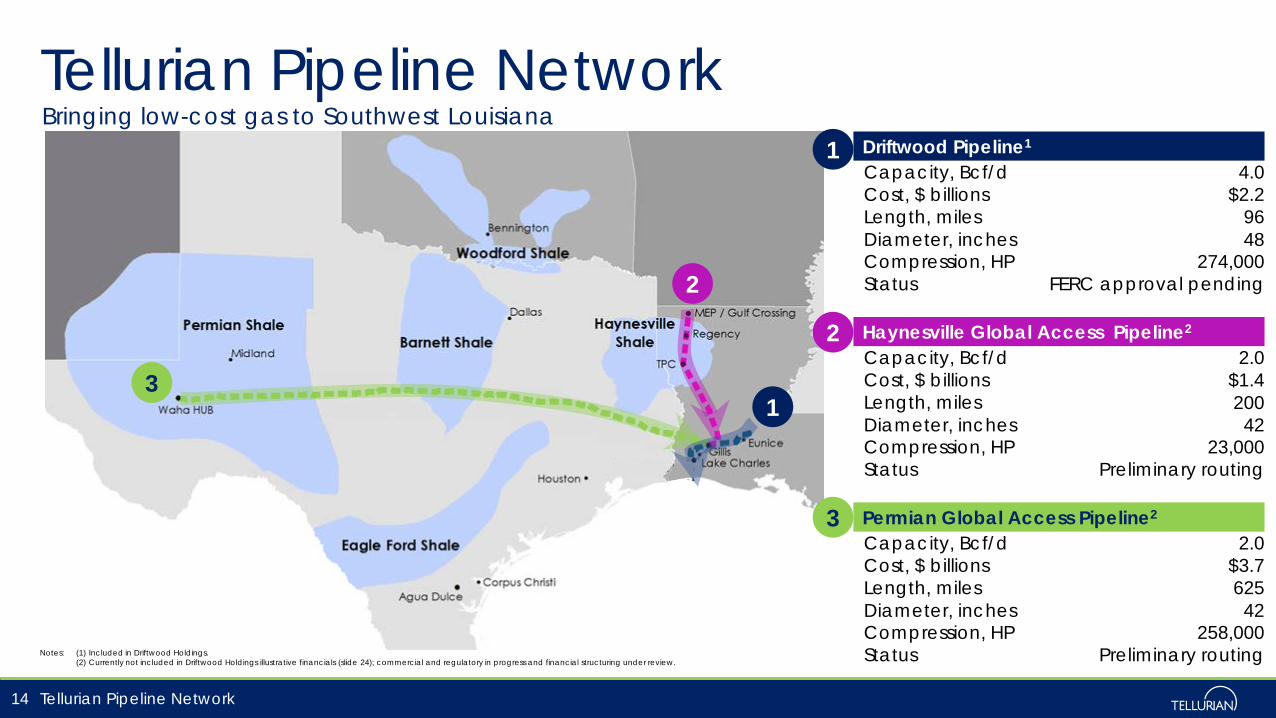
Notes: (1) Included in Driftwood Holdings. (2) Currently not included in Driftwood Holdings illustrative financials (slide 24); commercial and regulatory in progress and financial structuring under review.
14 Tellurian Pipeline Network
Driftwood Pipeline1
Capacity, Bcf/d 4.0Cost, $ billions $2.2 Length, miles 96Diameter, inches 48Compression, HP 274,000Status FERC approval pending
Haynesville Global Access Pipeline2
Capacity, Bcf/d 2.0Cost, $ billions $1.4Length, miles 200Diameter, inches 42Compression, HP 23,000Status Preliminary routing
Permian Global Access Pipeline2
Capacity, Bcf/d 2.0Cost, $ billions $3.7Length, miles 625Diameter, inches 42Compression, HP 258,000Status Preliminary routing
Bringing low-cost gas to Southwest Louisiana1
2
3
1
2
3
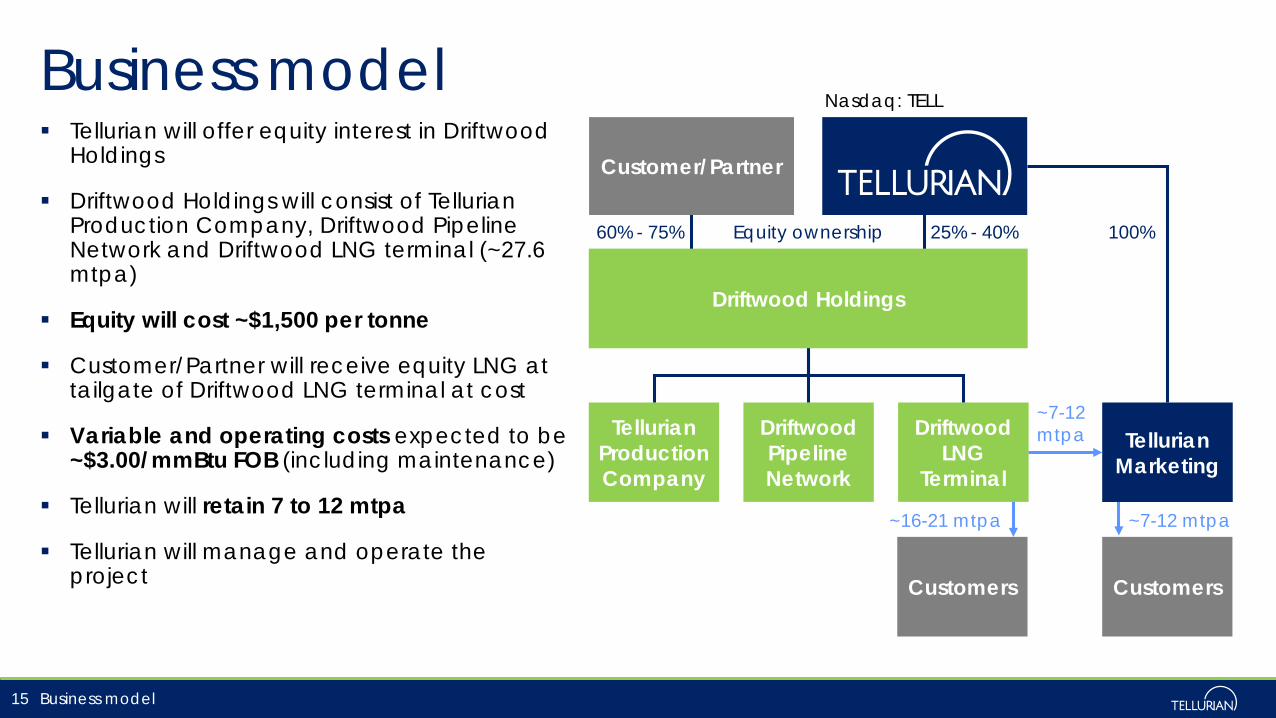
Tellurian will offer equity interest in Driftwood Holdings
Driftwood Holdings will consist of Tellurian Production Company, Driftwood Pipeline Network and Driftwood LNG terminal (~27.6 mtpa)
Equity will cost ~$1,500 per tonne
Customer/Partner will receive equity LNG at tailgate of Driftwood LNG terminal at cost
Variable and operating costs expected to be ~$3.00/mmBtu FOB (including maintenance)
Tellurian will retain 7 to 12 mtpa
Tellurian will manage and operate the project
Business model
15
Tellurian Marketing
Driftwood Holdings
Driftwood LNG
Terminal
Driftwood PipelineNetwork
Tellurian ProductionCompany
Customers
Equity ownership 25% - 40%
~7-12 mtpa~16-21 mtpa
~7-12 mtpa
Customer/Partner
60% - 75%
Customers
100%
Business model
Nasdaq: TELL
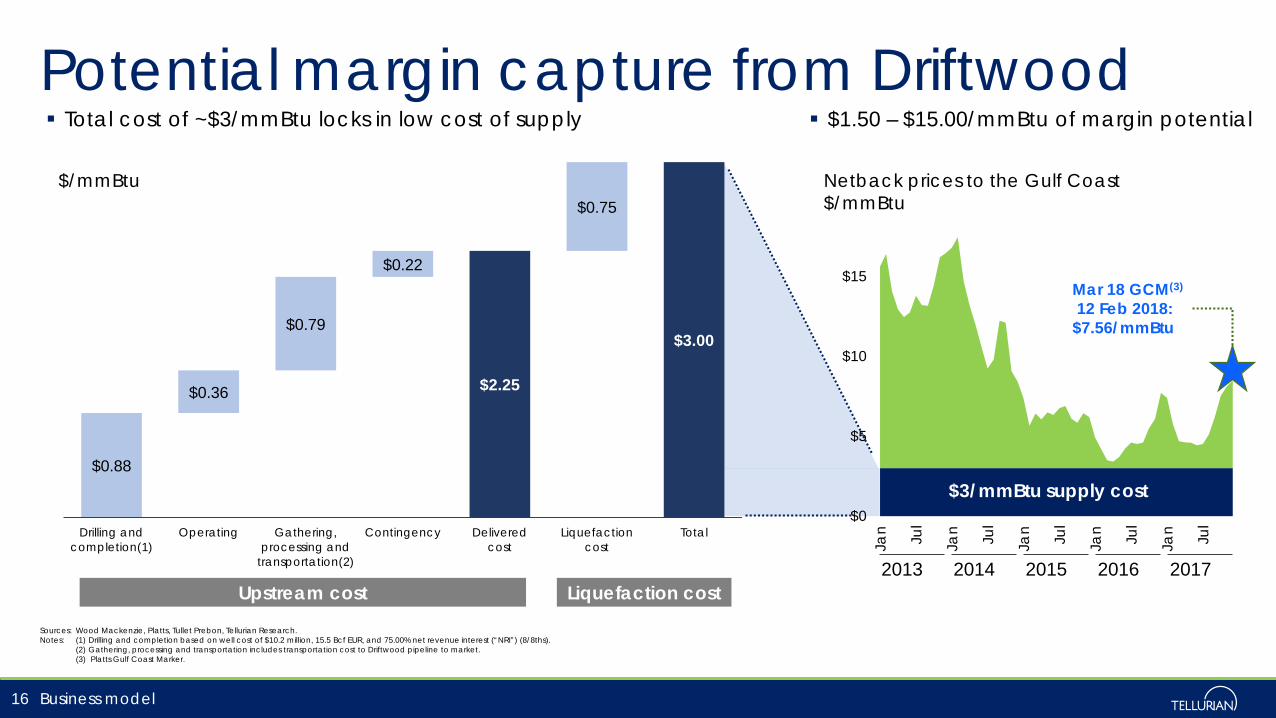
Total cost of ~$3/mmBtu locks in low cost of supply
$0.88
$0.36
$0.79
$0.22
$2.25
$0.75
$3.00
Drilling andcompletion(1)
Operating Gathering,processing and
transportation(2)
Contingency Deliveredcost
Liquefactioncost
Total
Potential margin capture from Driftwood
Sources: Wood Mackenzie, Platts, Tullet Prebon, Tellurian Research.Notes: (1) Drilling and completion based on well cost of $10.2 million, 15.5 Bcf EUR, and 75.00% net revenue interest (“NRI”) (8/8ths).
(2) Gathering, processing and transportation includes transportation cost to Driftwood pipeline to market.(3) Platts Gulf Coast Marker.
16
Upstream cost
$/mmBtu
Liquefaction cost
$3/mmBtu supply cost
$1.50 – $15.00/mmBtu of margin potential
Business model
$0
$5
$10
$15
$20
Jan Jul
Jan Jul
Jan Jul
Jan Jul
Jan Jul
Mar 18 GCM(3)
12 Feb 2018: $7.56/mmBtu
2013 2014 2015 2016 2017
Netback prices to the Gulf Coast$/mmBtu
$3/mmBtu supply cost
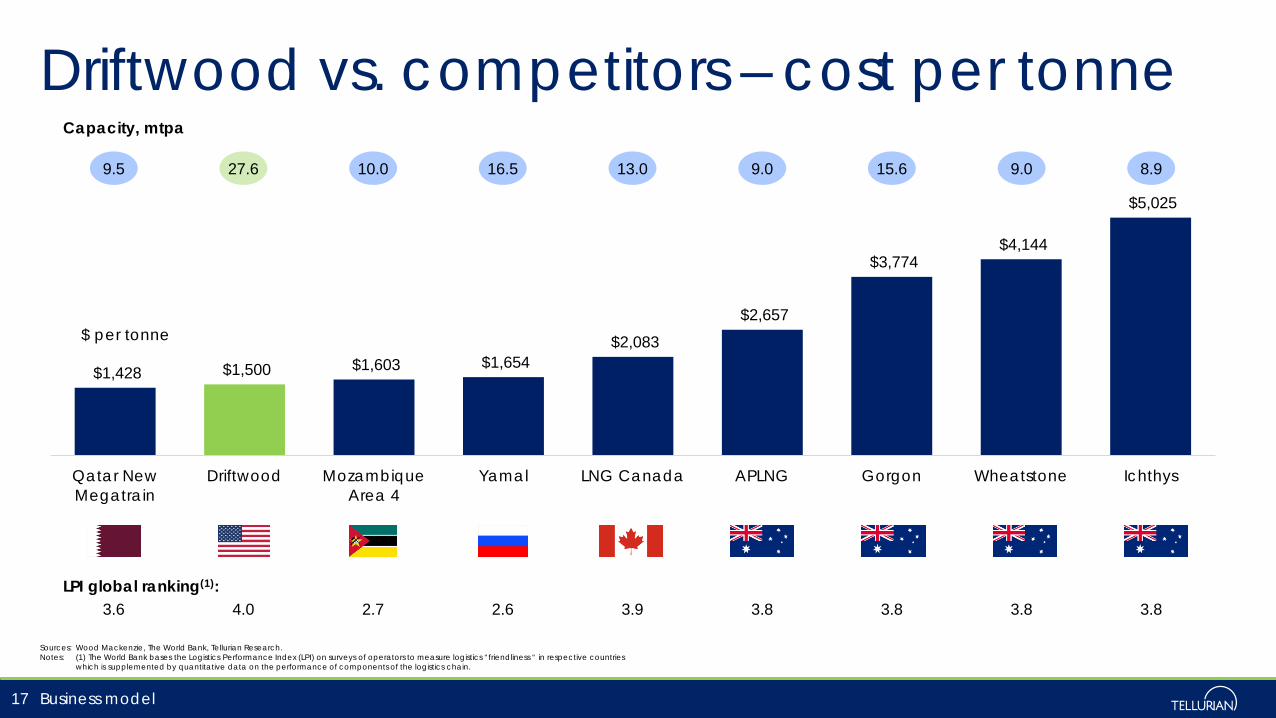
Driftwood vs. competitors – cost per tonne
Sources: Wood Mackenzie, The World Bank, Tellurian Research.Notes: (1) The World Bank bases the Logistics Performance Index (LPI) on surveys of operators to measure logistics “friendliness “ in respective countries
which is supplemented by quantitative data on the performance of components of the logistics chain.
17
$1,428 $1,500 $1,603 $1,654 $2,083
$2,657
$3,774 $4,144
$5,025
Qatar NewMegatrain
Driftwood MozambiqueArea 4
Yamal LNG Canada APLNG Gorgon Wheatstone Ichthys
$ per tonne
Capacity, mtpa
9.5 27.6 10.0 16.5 13.0 9.0 15.6 9.0 8.9
LPI global ranking(1):3.6 4.0 2.7 2.6 3.9 3.8 3.8 3.8 3.8
Business model
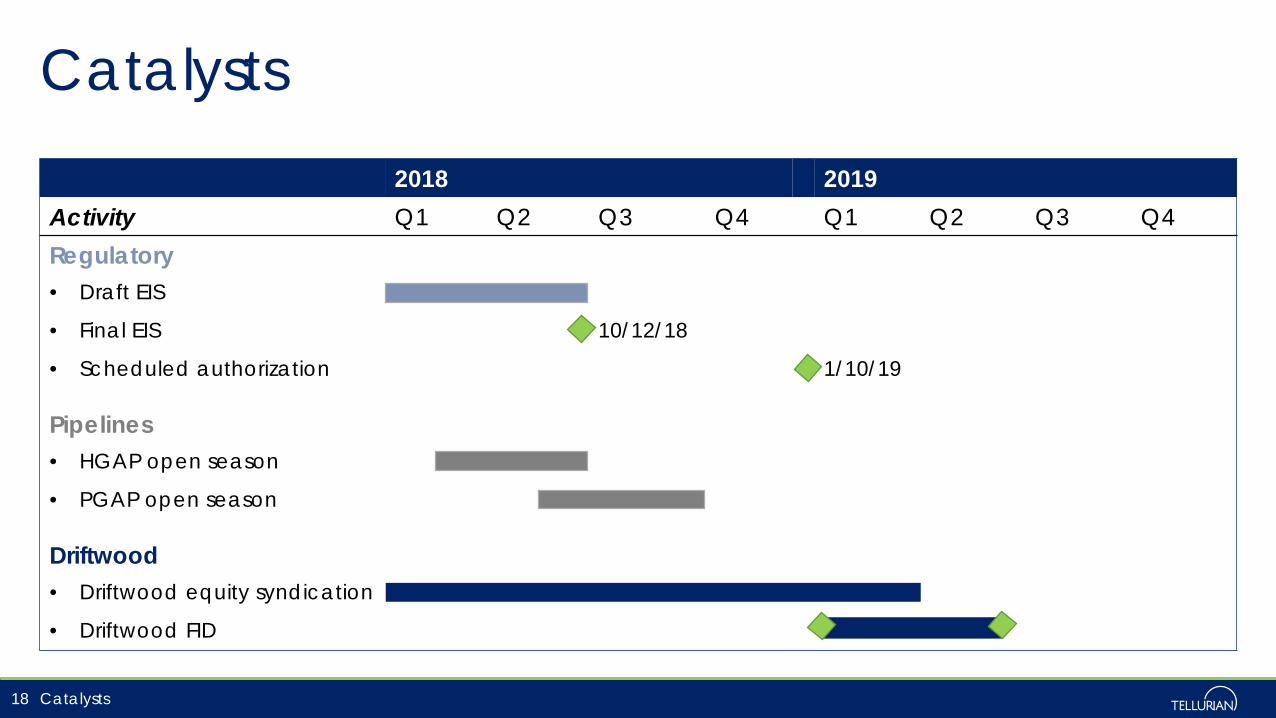
Catalysts
Catalysts
2018 2019Activity Q1 Q2 Q3 Q4 Q1 Q2 Q3 Q4Regulatory• Draft EIS
• Final EIS 10/12/18
• Scheduled authorization 1/10/19
Pipelines• HGAP open season
• PGAP open season
Driftwood• Driftwood equity syndication
• Driftwood FID
18
LNG demand is growing at 11-12% per annum
Netback LNG prices to the U.S. Gulf Coast of > $8.00/mmBtu have signaled that additional liquefaction capacity is needed
The U.S. is best positioned to meet global LNG supply needs with access to abundant low-cost gas and a track record of building low-cost liquefaction
~$170 Bn additional U.S. infrastructure is required to connect supply with growing global demand
Tellurian’s business model is designed to provide investors with access to the U.S. integrated value chain capable of providing low-cost, flexible LNG globally
Conclusions
Source: Kpler
19 Conclusions
Contact us Amit Marwaha
Director, Investor Relations & Finance+1 832 485 [email protected]
Joi LecznarSVP, Public Affairs & Communication+1 832 962 [email protected]
@TellurianLNG
20 Contacts
2017Additional detail
$25 million
$60 million
$207 million Merger $100
million
UpstreamAcquisition
LSTK
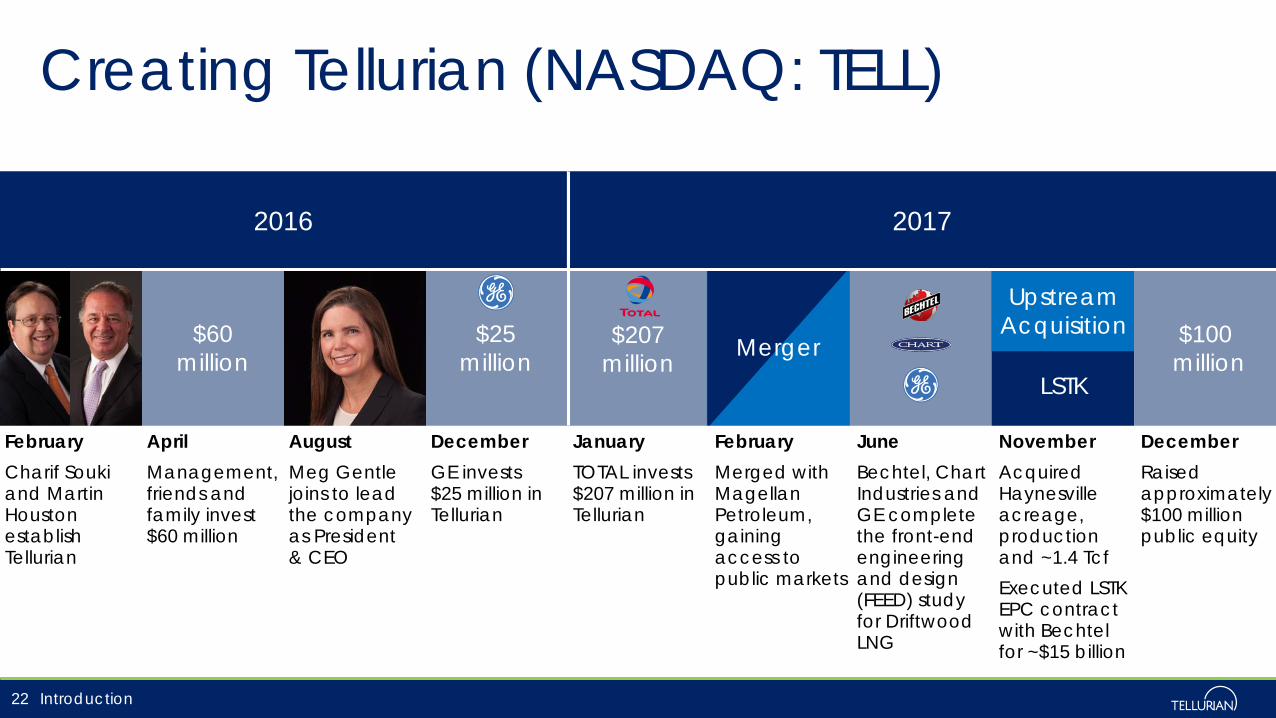
February April August December January February June November DecemberCharif Souki and Martin Houston establish Tellurian
Management, friends and family invest $60 million
Meg Gentle joins to lead the company as President & CEO
GE invests $25 million in Tellurian
TOTAL invests $207 million in Tellurian
Merged with Magellan Petroleum, gaining access to public markets
Bechtel, Chart Industries and GE complete the front-end engineering and design (FEED) study for Driftwood LNG
Acquired Haynesville acreage, production and ~1.4 TcfExecuted LSTK EPC contract with Bechtel for ~$15 billion
Raised approximately $100 million public equity
20172016
Creating Tellurian (NASDAQ: TELL)
22 Introduction
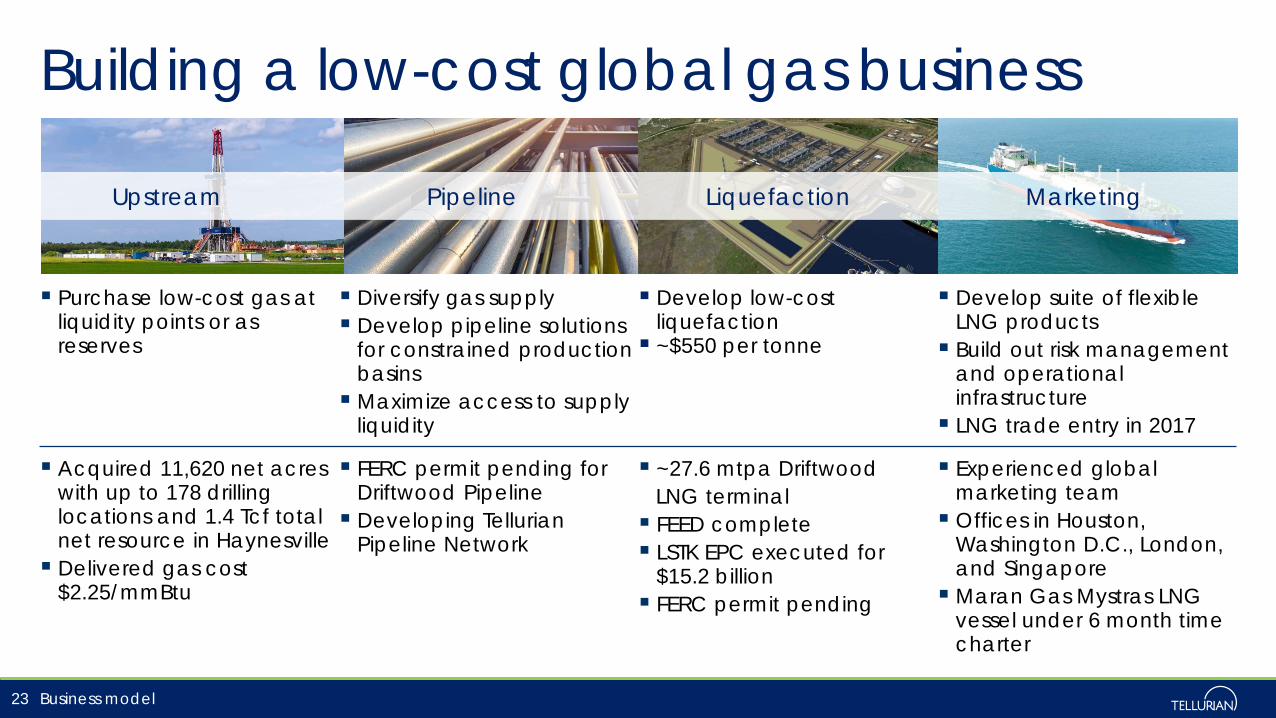
Building a low-cost global gas business
23
Pipeline Liquefaction MarketingUpstream
Purchase low-cost gas at liquidity points or as reserves
Diversify gas supply Develop pipeline solutions
for constrained production basinsMaximize access to supply
liquidity
Develop low-cost liquefaction ~$550 per tonne
Develop suite of flexible LNG products Build out risk management
and operational infrastructure LNG trade entry in 2017
Acquired 11,620 net acres with up to 178 drilling locations and 1.4 Tcf total net resource in Haynesville Delivered gas cost
$2.25/mmBtu
FERC permit pending for Driftwood Pipeline Developing Tellurian
Pipeline Network
~27.6 mtpa Driftwood LNG terminal FEED complete LSTK EPC executed for
$15.2 billion FERC permit pending
Experienced global marketing team Offices in Houston,
Washington D.C., London, and SingaporeMaran Gas Mystras LNG
vessel under 6 month time charter
Business model
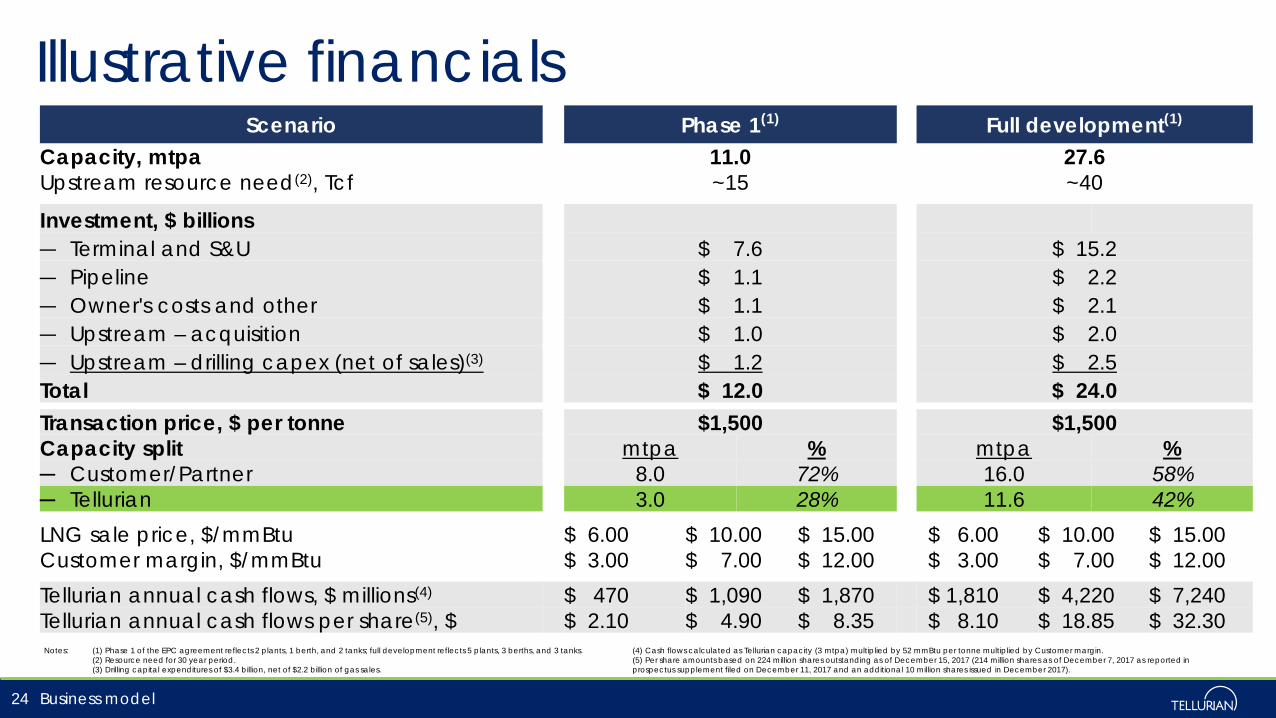
Illustrative financials
Business model24
Notes: (1) Phase 1 of the EPC agreement reflects 2 plants, 1 berth, and 2 tanks; full development reflects 5 plants, 3 berths, and 3 tanks.(2) Resource need for 30 year period.(3) Drilling capital expenditures of $3.4 billion, net of $2.2 billion of gas sales.
(4) Cash flows calculated as Tellurian capacity (3 mtpa) multiplied by 52 mmBtu per tonne multiplied by Customer margin.(5) Per share amounts based on 224 million shares outstanding as of December 15, 2017 (214 million shares as of December 7, 2017 as reported in prospectus supplement filed on December 11, 2017 and an additional 10 million shares issued in December 2017).
Scenario Phase 1(1) Full development(1)
Capacity, mtpa 11.0 27.6Upstream resource need(2), Tcf ~15 ~40
Investment, $ billions― Terminal and S&U $ 7.6 $ 15.2― Pipeline $ 1.1 $ 2.2― Owner's costs and other $ 1.1 $ 2.1― Upstream – acquisition $ 1.0 $ 2.0― Upstream – drilling capex (net of sales)(3) $ 1.2 $ 2.5Total $ 12.0 $ 24.0Transaction price, $ per tonne $1,500 $1,500Capacity split mtpa % mtpa %─ Customer/Partner 8.0 72% 16.0 58%─ Tellurian 3.0 28% 11.6 42%LNG sale price, $/mmBtu $ 6.00 $ 10.00 $ 15.00 $ 6.00 $ 10.00 $ 15.00Customer margin, $/mmBtu $ 3.00 $ 7.00 $ 12.00 $ 3.00 $ 7.00 $ 12.00Tellurian annual cash flows, $ millions(4) $ 470 $ 1,090 $ 1,870 $ 1,810 $ 4,220 $ 7,240Tellurian annual cash flows per share(5), $ $ 2.10 $ 4.90 $ 8.35 $ 8.10 $ 18.85 $ 32.30
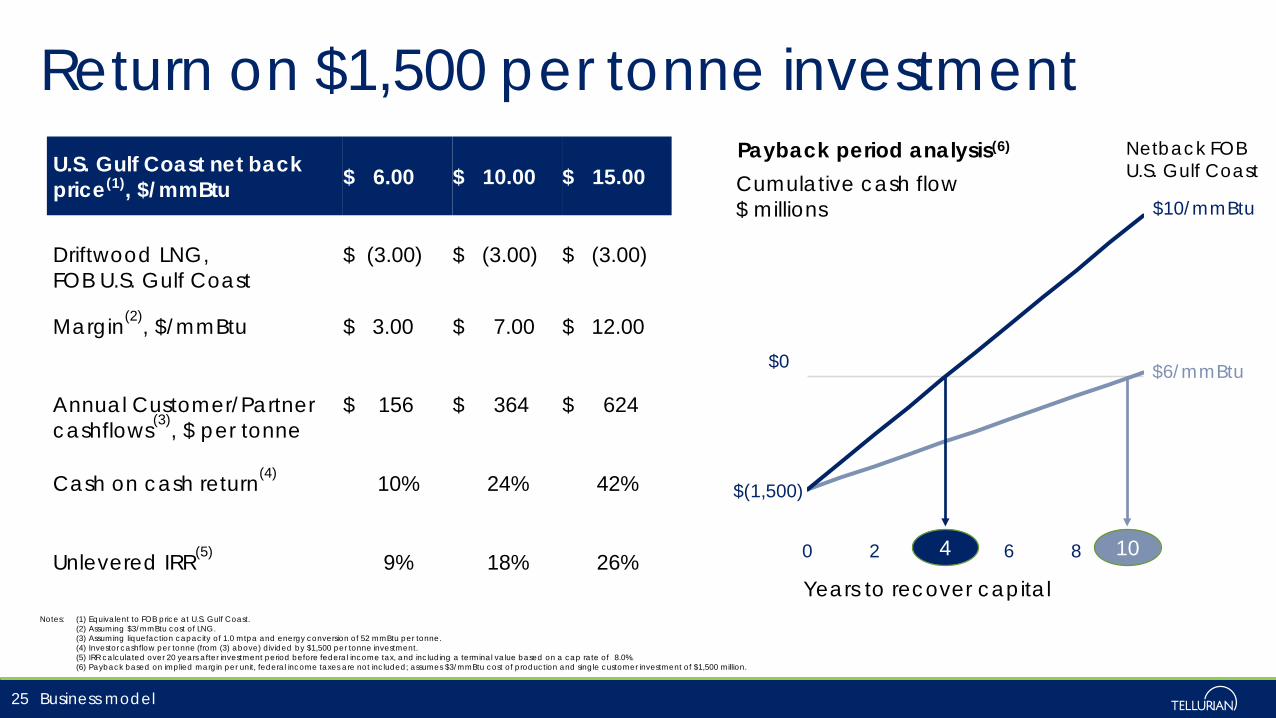
Return on $1,500 per tonne investment
25 Business model
0 2 4 6 8 10
Payback period analysis(6)
Years to recover capital
$0
$(1,500)
Cumulative cash flow$ millions $10/mmBtu
$6/mmBtu
Netback FOB U.S. Gulf Coast
4 10
Notes: (1) Equivalent to FOB price at U.S. Gulf Coast.(2) Assuming $3/mmBtu cost of LNG.(3) Assuming liquefaction capacity of 1.0 mtpa and energy conversion of 52 mmBtu per tonne.(4) Investor cashflow per tonne (from (3) above) divided by $1,500 per tonne investment.(5) IRR calculated over 20 years after investment period before federal income tax, and including a terminal value based on a cap rate of 8.0%.(6) Payback based on implied margin per unit, federal income taxes are not included; assumes $3/mmBtu cost of production and single customer investment of $1,500 million.
U.S. Gulf Coast net back price(1), $/mmBtu $ 6.00 $ 10.00 $ 15.00
Driftwood LNG, FOB U.S. Gulf Coast
$ (3.00) $ (3.00) $ (3.00)
Margin(2), $/mmBtu $ 3.00 $ 7.00 $ 12.00
Annual Customer/Partnercashflows(3), $ per tonne
$ 156 $ 364 $ 624
Cash on cash return(4) 10% 24% 42%
Unlevered IRR(5) 9% 18% 26%
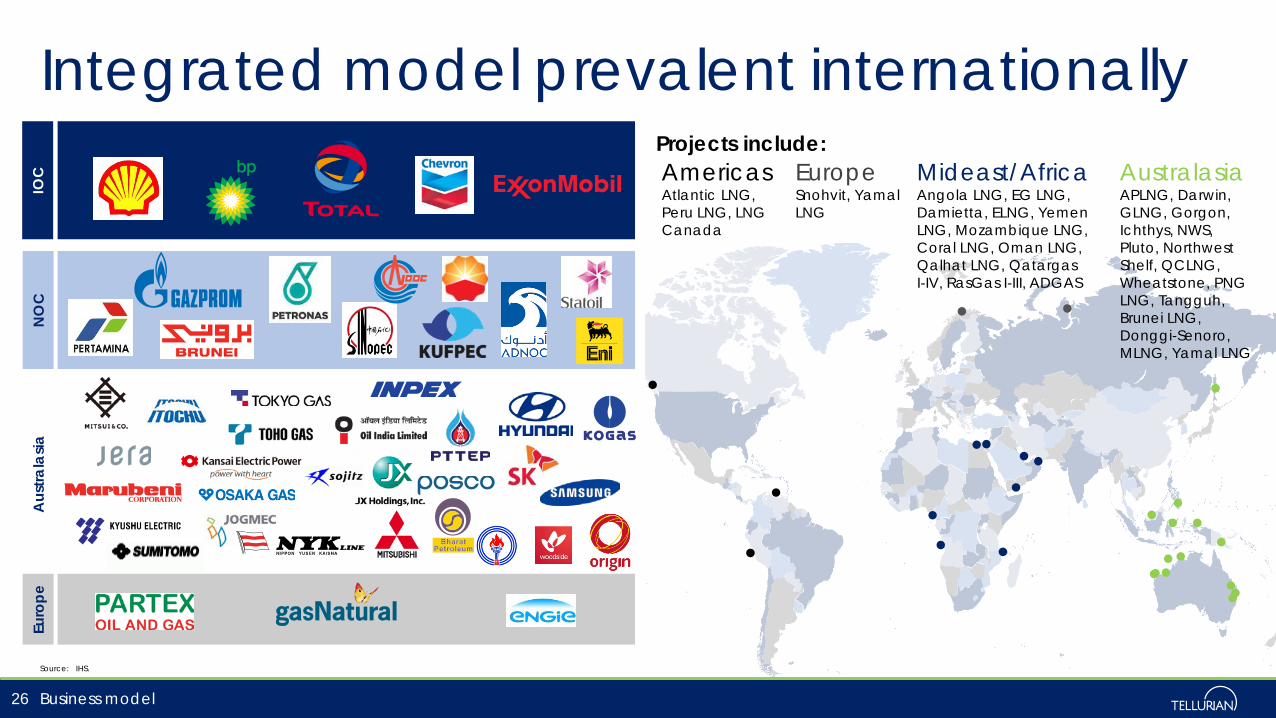
Integrated model prevalent internationally
Source: IHS.
26
Projects include:AustralasiaAPLNG, Darwin, GLNG, Gorgon, Ichthys, NWS, Pluto, Northwest Shelf, QCLNG, Wheatstone, PNG LNG, Tangguh, Brunei LNG, Donggi-Senoro, MLNG, Yamal LNG
Mideast/Africa Angola LNG, EG LNG, Damietta, ELNG, Yemen LNG, Mozambique LNG, Coral LNG, Oman LNG, Qalhat LNG, QatargasI-IV, RasGas I-III, ADGAS
AmericasAtlantic LNG, Peru LNG, LNG Canada
EuropeSnohvit, Yamal LNG
Euro
peA
ustra
lasia
NO
CIO
C
Business model
- 12 24 36 48
Sabine
Cameron
Cove Point
Corpus
Southern
Freeport
DWLNG
Magnolia
Golden Pass
Lake Charles
Venture Global
Pre-filing FERC application
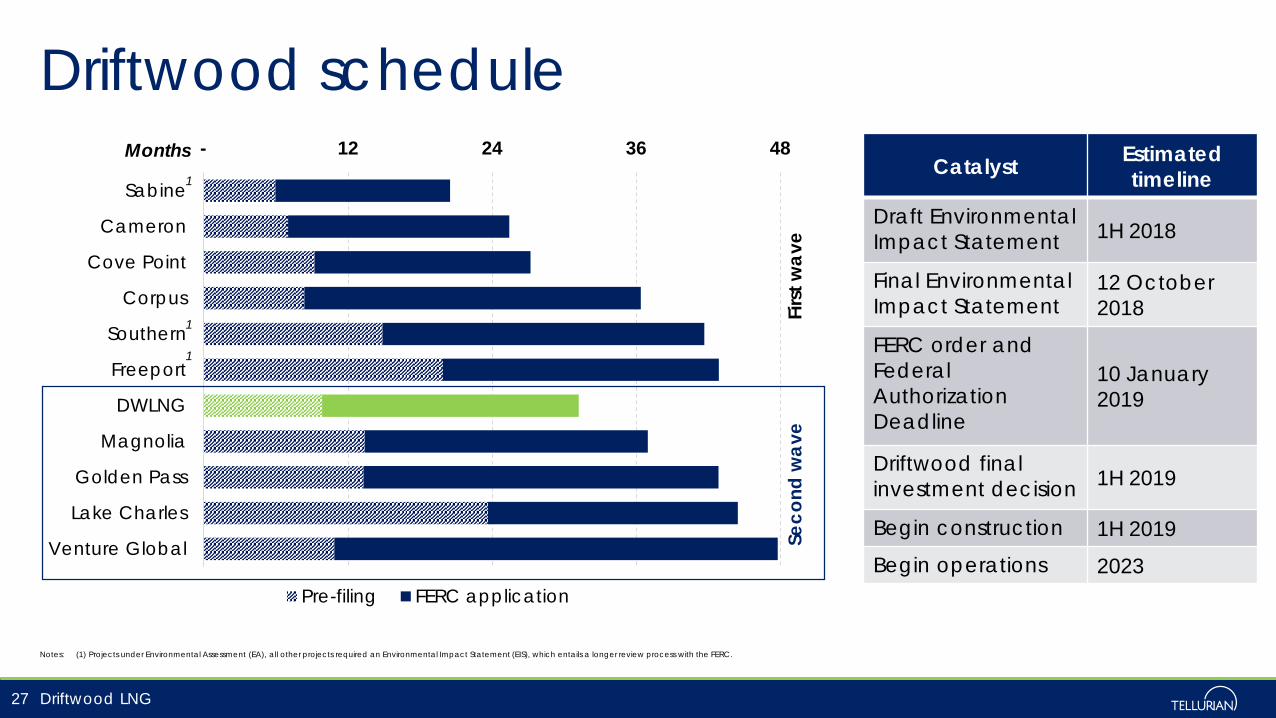
Driftwood schedule
Driftwood LNG
Notes: (1) Projects under Environmental Assessment (EA), all other projects required an Environmental Impact Statement (EIS), which entails a longer review process with the FERC.
27
Seco
nd w
ave
Firs
t wav
e
Catalyst Estimated timeline
Draft Environmental Impact Statement 1H 2018
Final Environmental Impact Statement
12 October 2018
FERC order and Federal Authorization Deadline
10 January 2019
Driftwood final investment decision 1H 2019
Begin construction 1H 2019Begin operations 2023
Months1
1
1
$700 per tonne
$490 $500
$380
~$550
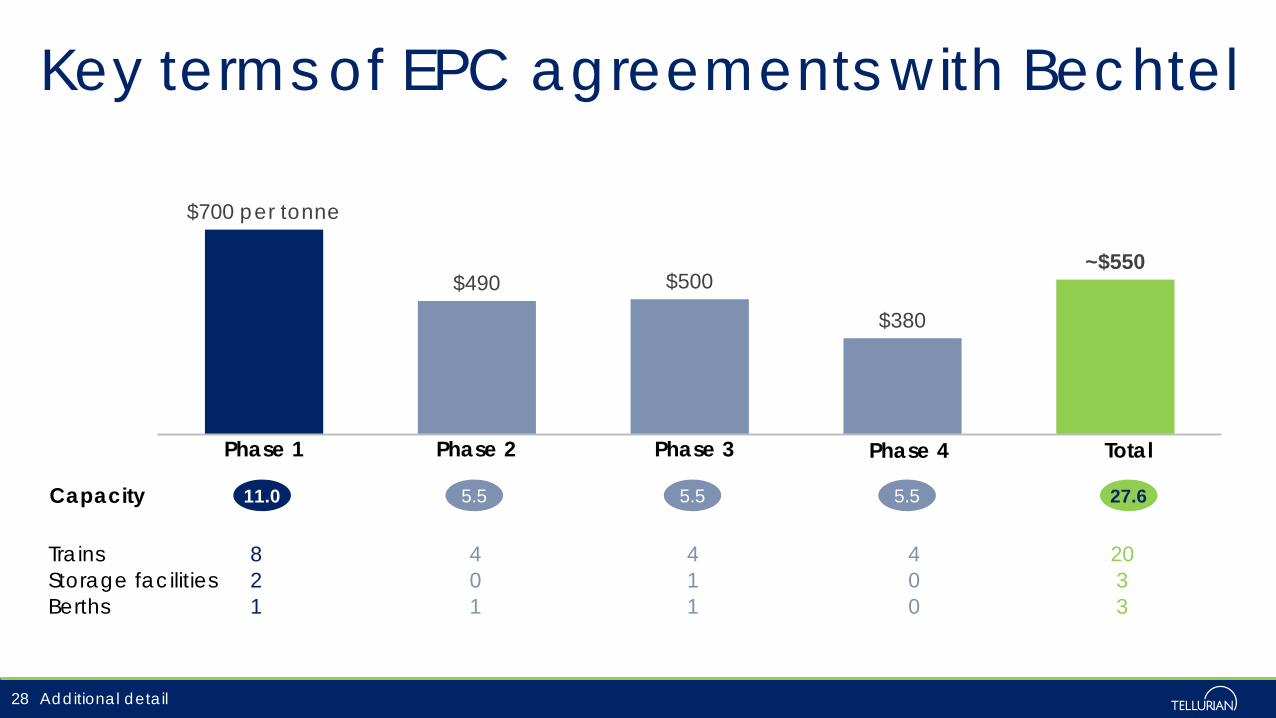
Key terms of EPC agreements with Bechtel
Additional detail28
Phase 1 Phase 2 Phase 3 Phase 4 Total
11.0 5.5 5.5 5.5 27.6
Trains 8 4 4 4 20Storage facilities 2 0 1 0 3Berths 1 1 1 0 3
Capacity
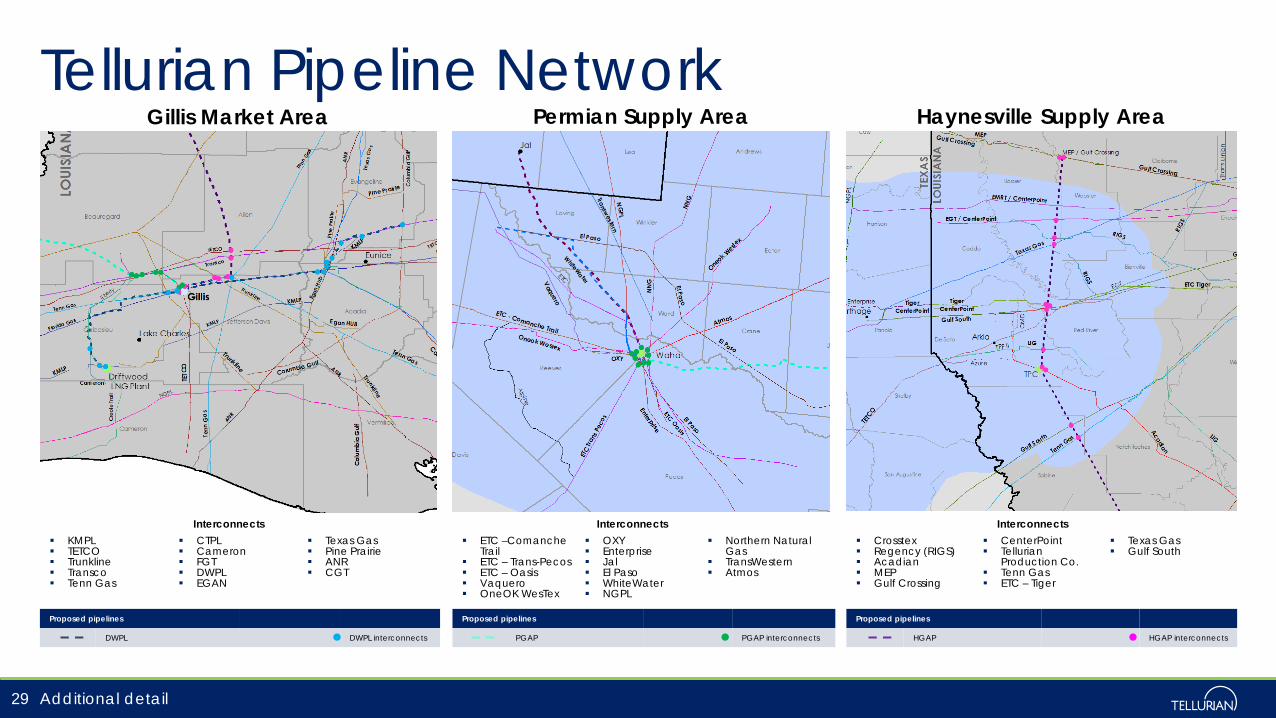
Tellurian Pipeline Network
29
Gillis Market Area
KMPL TETCO Trunkline Transco Tenn Gas
CTPL Cameron FGT DWPL EGAN
Texas Gas Pine Prairie ANR CGT
Interconnects
Permian Supply Area
ETC –Comanche Trail
ETC – Trans-Pecos ETC – Oasis Vaquero OneOK WesTex
OXY Enterprise Jal El Paso WhiteWater NGPL
Northern Natural Gas
TransWestern Atmos
Interconnects
Haynesville Supply Area
Crosstex Regency (RIGS) Acadian MEP Gulf Crossing
CenterPoint Tellurian
Production Co. Tenn Gas ETC – Tiger
Texas Gas Gulf South
Interconnects
Proposed pipelines
DWPL DWPL interconnects
Additional detail
Proposed pipelines
PGAP PGAP interconnects
Proposed pipelines
HGAP HGAP interconnects
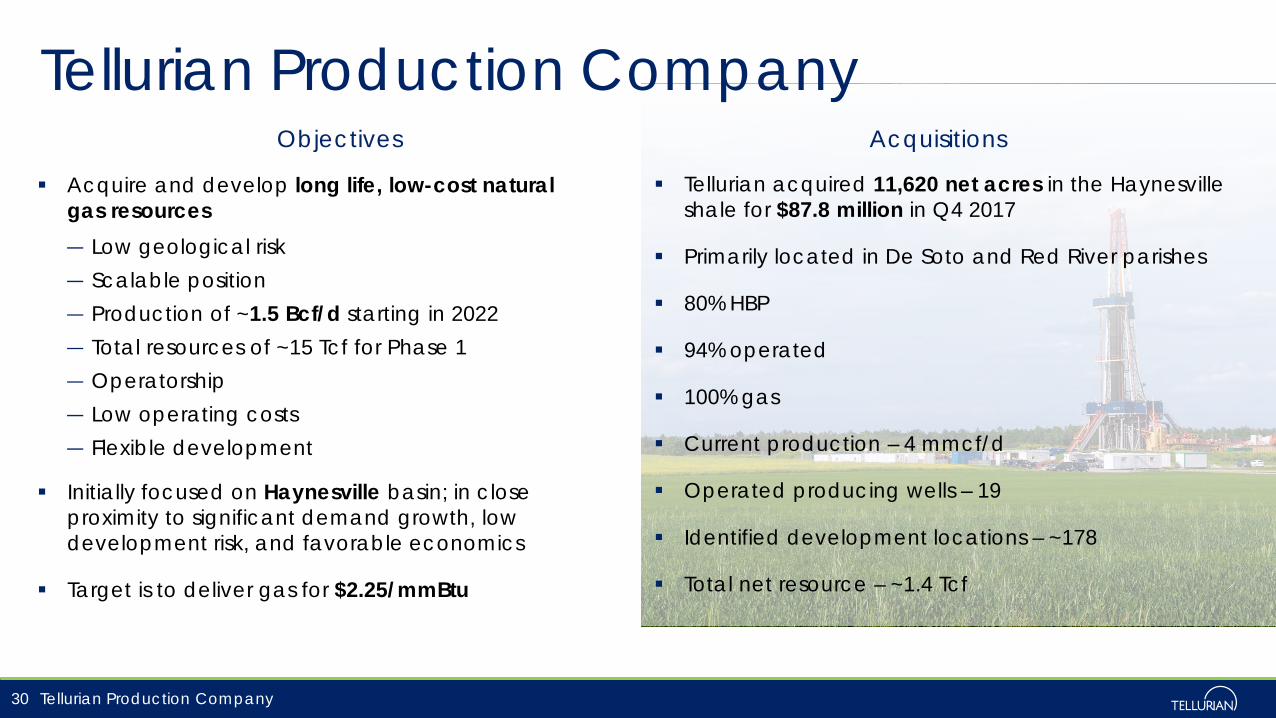
Tellurian Production Company
Acquire and develop long life, low-cost natural gas resources ― Low geological risk― Scalable position― Production of ~1.5 Bcf/d starting in 2022― Total resources of ~15 Tcf for Phase 1― Operatorship― Low operating costs ― Flexible development
Initially focused on Haynesville basin; in close proximity to significant demand growth, low development risk, and favorable economics
Target is to deliver gas for $2.25/mmBtu
Tellurian acquired 11,620 net acres in the Haynesville shale for $87.8 million in Q4 2017
Primarily located in De Soto and Red River parishes
80% HBP
94% operated
100% gas
Current production – 4 mmcf/d
Operated producing wells – 19
Identified development locations – ~178
Total net resource – ~1.4 Tcf
Tellurian Production Company
Objectives Acquisitions
30
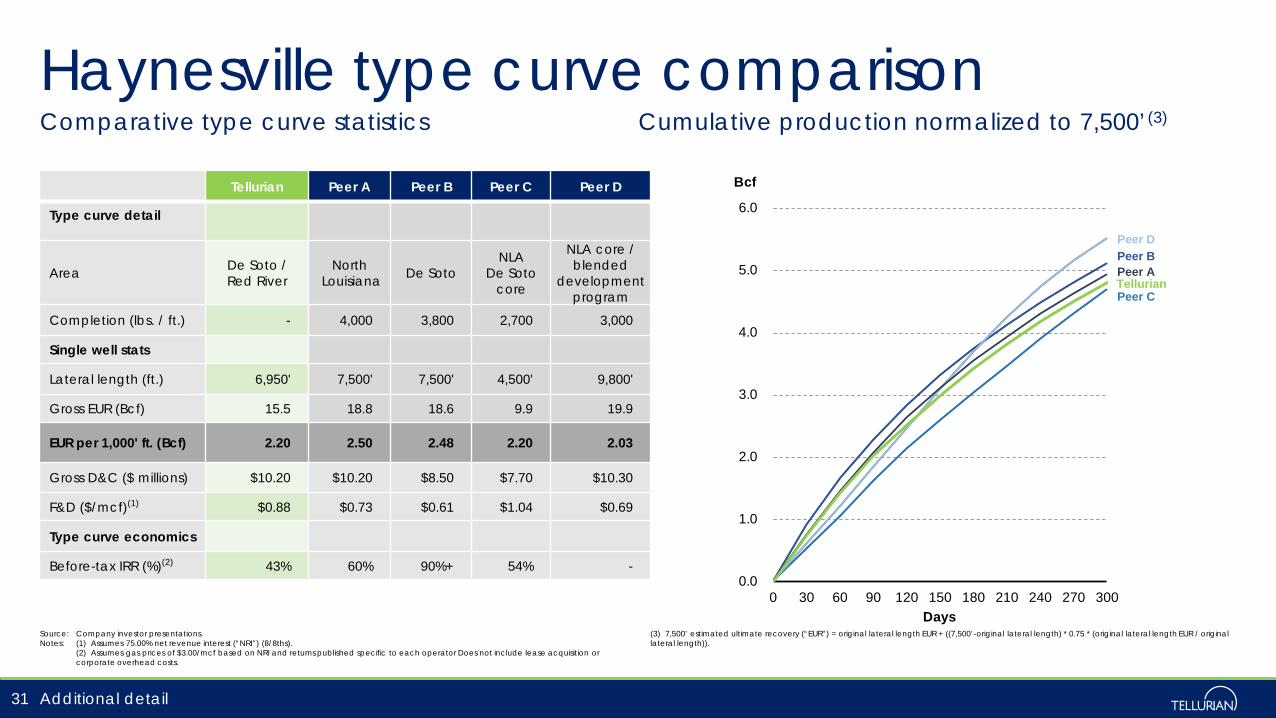
Haynesville type curve comparisonComparative type curve statistics Cumulative production normalized to 7,500’(3)
Source: Company investor presentations.Notes: (1) Assumes 75.00% net revenue interest (“NRI”) (8/8ths).
(2) Assumes gas prices of $3.00/mcf based on NRI and returns published specific to each operator Does not include lease acquisition or corporate overhead costs.
(3) 7,500’ estimated ultimate recovery (“EUR”) = original lateral length EUR + ((7,500’-original lateral length) * 0.75 * (original lateral length EUR / original lateral length)).
31
0.0
1.0
2.0
3.0
4.0
5.0
6.0
0 30 60 90 120 150 180 210 240 270 300
Bcf
Days
Peer BPeer D
Peer A
Peer CTellurian
Tellurian Peer A Peer B Peer C Peer D
Type curve detail
Area De Soto /Red River
NorthLouisiana De Soto
NLADe Soto
core
NLA core / blended
development program
Completion (lbs. / ft.) - 4,000 3,800 2,700 3,000
Single well stats
Lateral length (ft.) 6,950' 7,500' 7,500' 4,500' 9,800'
Gross EUR (Bcf) 15.5 18.8 18.6 9.9 19.9
EUR per 1,000' ft. (Bcf) 2.20 2.50 2.48 2.20 2.03
Gross D&C ($ millions) $10.20 $10.20 $8.50 $7.70 $10.30
F&D ($/mcf)(1) $0.88 $0.73 $0.61 $1.04 $0.69
Type curve economics
Before-tax IRR (%)(2) 43% 60% 90%+ 54% -
Additional detail