valentina bonavita
TRANSCRIPT

Expe
rimen
tal s
tudy
on
the
in�u
ence
of t
extil
e re
info
rcem
ent o
n th
e st
ruct
ural
resp
onse
of r
educ
ed s
cale
ram
med
ear
th b
uild
ings
Va
lent
ina
Bona
vita
Spai
n
2017
Valentina Bonavita
Experimental study on the in�uence of textile reinforcement on the structural response of reduced scale rammed earth buildings.
University of Padova

Valentina Bonavita
Experimental study on the in�uence of textile reinforcement on the structural response of reduced scale rammed earth buildings.
Spain 2017

Experimental study on the influence of textile reinforcement on the structural response of reduced scale rammed earth buildings
Erasmus Mundus Programme
ADVANCED MASTERS IN STRUCTURAL ANALYSIS OF MONUMENTS AND HISTORICAL CONSTRUCTIONS i
DECLARATION
Name: Valentina Bonavita
Email: [email protected]
Title of the
Msc Dissertation:
Experimental study on the influence of textile reinforcement on the structural response of reduced
scale rammed earth buildings
Supervisors: Ernest Bernat, Lluís Gil
Year: 2017
I hereby declare that all information in this document has been obtained and presented in accordance
with academic rules and ethical conduct. I also declare that, as required by these rules and conduct, I
have fully cited and referenced all material and results that are not original to this work.
I hereby declare that the MSc Consortium responsible for the Advanced Masters in Structural Analysis
of Monuments and Historical Constructions is allowed to store and make available electronically the
present MSc Dissertation.
University: Technical University of Catalonia
Date: 14/07/2017
Signature:
___________________________

Experimental study on the influence of textile reinforcement on the structural response of reduced scale rammed earth buildings
Erasmus Mundus Programme
ii ADVANCED MASTERS IN STRUCTURAL ANALYSIS OF MONUMENTS AND HISTORICAL CONSTRUCTIONS

Experimental study on the influence of textile reinforcement on the structural response of reduced scale rammed earth buildings
Erasmus Mundus Programme
ADVANCED MASTERS IN STRUCTURAL ANALYSIS OF MONUMENTS AND HISTORICAL CONSTRUCTIONS iii

Experimental study on the influence of textile reinforcement on the structural response of reduced scale rammed earth buildings
Erasmus Mundus Programme
iv ADVANCED MASTERS IN STRUCTURAL ANALYSIS OF MONUMENTS AND HISTORICAL CONSTRUCTIONS
ACKNOWLEDGEMENTS
I’d like to express my gratitude towards my supervisors Ernest Bernat end Lluís Gil from the
Department of Strength of Materials and Engineering Structures of the Technical University of
Catalonia, Campus of Terrassa, who guided me and helped me in carrying out the present work.
I’d like to thanks the SACH Consortium for having assigned me the scholarship.
My gratitude goes to all my colleagues who shared with me the experience of the master, they made it
special and unforgettable.
Thankyou to Elitsa Ivanova Teneva for having helped me in the laboratory activities, and RosaMaria
Codispoti for having encouraged me to undertake the SACH master
A special thanks to my family.

Experimental study on the influence of textile reinforcement on the structural response of reduced scale rammed earth buildings
Erasmus Mundus Programme
ADVANCED MASTERS IN STRUCTURAL ANALYSIS OF MONUMENTS AND HISTORICAL CONSTRUCTIONS v

Experimental study on the influence of textile reinforcement on the structural response of reduced scale rammed earth buildings
Erasmus Mundus Programme
vi ADVANCED MASTERS IN STRUCTURAL ANALYSIS OF MONUMENTS AND HISTORICAL CONSTRUCTIONS
ABSTRACT
Rammed building is an ancient building technique spread in all the five continents as well as other
earthen construction technique.
Currently almost the 30%-40% of the world population live in earthen dwellings.
The rammed earth diffusion is due to the large availability of the row material that doesn’t require any
processing, hence a low skilled manpower is required.
Nowadays this technique is appreciated from the point of view of environmental and social
sustainability, because of the absence of energy consumption, none of the less for its affordability.
Rammed earth is characterized by a satisfactory compressive strength, whereas the tensile strength id
very low. The latter factor often is the cause of severe and damage collapse due to earthquake since
the diffusion of earthen construction mostly, involves seismic prone area.
The aim of this work is to evaluate the effectiveness of the glass fiber mesh as seismic reinforcement
and strengthening system in existing and new Rammed Earth building as well.
For this purpose, compressive test and shear test are performed on three reduced scaled models
namely: an unreinforced sample, a retrofitted sample by mean of glass fiber mesh applied on the two
surfaces of the wall, a reinforced sample by two layer of glass fiber mesh, internally placed in the
thickness of the scaled wall model.
From the present experimental work aroused that glass fiber mesh allows to increase considerably the
ductility of rammed earth wall, while the strength is conferred by the compacted soil.
Furthermore, the internal reinforcement demonstrates also a greatly contribution to the performance of
rammed earth constructions in compression and in tension as well, even though further experimental
studies are required. In conclusion glass fiber mesh can be considered an effective and promising
strengthening option for historical rammed earth constructions.

Experimental study on the influence of textile reinforcement on the structural response of reduced scale rammed earth buildings
Erasmus Mundus Programme
ADVANCED MASTERS IN STRUCTURAL ANALYSIS OF MONUMENTS AND HISTORICAL CONSTRUCTIONS vii

Experimental study on the influence of textile reinforcement on the structural response of reduced scale rammed earth buildings
Erasmus Mundus Programme
viii ADVANCED MASTERS IN STRUCTURAL ANALYSIS OF MONUMENTS AND HISTORICAL CONSTRUCTIONS
RESUMO
El tapial es una antigua técnica constructiva que, como otras técnicas de construcción en tierra, está
extendida por los cinco continentes.
Actualmente casi el 30 %- 40 % de la población mundial habita en viviendas de tierra.
El tapial debe su gran propagación al uso de un material que no requiere de procesado, y por tanto,
necesita poca mano de obra.
Hoy en día, esta técnica desde el punto de vista medioambiental y sostenible, valorando la ausencia
de consumo de energía y a parte de su asequibilidad.
El tapial se caracteriza por tener una satisfactoria resistencia a compresión, pero una resistencia a
tracción muy baja. Este último factor causa a menudo daños severos y colapsos producidos por
terremotos, ya que la construcción en tierra esta mayormente distribuida en lugares altamente
sísmicos.
El objetivo de este trabajo es evaluar la eficacia del uso de una malla de fibra de vidrio como refuerzo
sísmico en edificios de tapial nuevos y existentes.
Con este fin, se realizan experimentos a compresión y a cizalladura en tres modelos de escala
reducida: en una muestra sin refuerzo, en una muestra con refuerzo de fibra de vidrio aplicada en las
dos superficies de la pared y en una muestra con dos capas de malla de fibra de vidrio situadas
dentro del grosor del modelo a escala.
Del presente trabajo experimental se deduce que la malla de fibra de vidrio permite un crecimiento
considerable de la ductilidad del muro de tapial, mientras la resistencia se confiere a la tierra
compactada.
Asimismo, el refuerzo interno también demuestra una gran contribución al rendimiento de las
construcciones de tapial en compresión y en tensión, aunque más trabajos experimentales deben ser
realizados. En conclusión, la malla de fibra de vidrio puede considerarse una técnica de refuerzo
efectiva y una prometedora opción para los edificios históricos.

Experimental study on the influence of textile reinforcement on the structural response of reduced scale rammed earth buildings
Erasmus Mundus Programme
ADVANCED MASTERS IN STRUCTURAL ANALYSIS OF MONUMENTS AND HISTORICAL CONSTRUCTIONS ix

Experimental study on the influence of textile reinforcement on the structural response of reduced scale rammed earth buildings
Erasmus Mundus Programme
x ADVANCED MASTERS IN STRUCTURAL ANALYSIS OF MONUMENTS AND HISTORICAL CONSTRUCTIONS
RESUMÉ
STUDIO SPERIMENTALE SULL’INFLUENZA DEI RINFORZI TESSILI SUL
COMPORTAMENTO STRUTTURALE DI MODELLI IN SCALA RIDOTTA DI
EDIFICI IN TERRA BATTUTA
La terra battuta è un’antica tecnica costruttiva presente in tutti e cinque i continenti, così come altre
tecniche e costruttive in terra cruda.
Attualmente circa il 30%-40% della popolazione mondiale abita in dimore in terra battuta.
La diffusione della terra battuta è dovuta alla grande disponibilità delle materie prime che non richiede,
peraltro, un complesso processo di lavorazione, dunque non è richiesta nemmeno una manodopera
che sia particolarmente qualificata.
Attualmente questa tecnica è molto apprezzata dal punto di vista della sostenibilità ambientale ed
economica, per l’assenza di consumo energetico, cionondimeno per la sua economicità.
La terra battuta è caratterizzata da una buona resistenza a compressione, ma da una bassa
resistenza a trazione. Quest’ultima è spesso la causa di grossi danni e collassi in caso di sisma,
poiché la diffusione di questa tecnica costruttiva spesso coincide non zone ad rischio sismico.
Lo scopo del presente lavoro è di valutare l’efficacia di maglie in fibra di vetro come sistema di rinforzo
antisismico in costruzioni di terra battuta esistenti, così come in quelle di nuova produzione.
A tal fine prove di resistenza a taglio e compressione sono state effettuate su tre modelli di muro in
scala ridotta: uno non rinforzato di riferimento, un provino rinforzato da due maglie in fibra di vetro
applicate sulle due superfici del muretto, un provino rinforzato con due strati posti all’interno dello
spessore del provino stesso.
Dal presente lavoro sperimentale è emerso che le maglie in fibra di vetro permettono di aumentare
notevolmente la duttilità, mentre la resistenza è affidata alla terra compatta.
Inoltre il rinforzo interno contribuisce notevolmente al buon comportamento delle costruzioni in terra
battuta in compressione e tensione, nonostante siano necessari ulteriori studi sperimentali
In conclusione le maglie in fibra di vetro possono essere considerate una valida alternativa come
sistema di rinforzo per costruzioni storiche in terra battuta.

Experimental study on the influence of textile reinforcement on the structural response of reduced scale rammed earth buildings
Erasmus Mundus Programme
ADVANCED MASTERS IN STRUCTURAL ANALYSIS OF MONUMENTS AND HISTORICAL CONSTRUCTIONS xi
Experimental study on the influence of textile reinforcement on the structural response of reduced scale rammed earth buildings
Erasmus Mundus Programme
xii ADVANCED MASTERS IN STRUCTURAL ANALYSIS OF MONUMENTS AND HISTORICAL CONSTRUCTIONS
TABLE OF CONTENTS
1. INTRODUCTION ............................................................................................................................. 1
1.1. Motivation................................................................................................................................. 1
1.2. Objectives ................................................................................................................................ 1
1.3. Structure of the work ................................................................................................................ 1
2. STATE OF THE ART ....................................................................................................................... 3
2.1. Rammed earth constructions ................................................................................................... 3
2.2. Experimental research context ................................................................................................ 4
2.2.1. Mechanical properties ...................................................................................................... 4
2.2.2. In-plane cyclic shear-compression .................................................................................. 6
2.2.3. Monotonic lateral loading ............................................................................................... 10
2.2.4. Diagonal compression test ............................................................................................ 12
3. Experimental program ................................................................................................................... 13
3.1. Material Characteristics ......................................................................................................... 13
3.1.1. Physical characterization ............................................................................................... 14
3.1.1.1. Soil grading ................................................................................................................ 14
3.1.1.2. Moisture content and Compaction ............................................................................. 15
3.1.2. Compressive and flexural strength ................................................................................ 17
3.1.3. Description of the scaled wall models ........................................................................... 18
3.2. Laboratory phases ................................................................................................................. 19
3.2.1. Preparation of the mould ............................................................................................... 19
3.2.2. Preparation of the mixture ............................................................................................. 20
3.2.3. Samples production ....................................................................................................... 22
4. Experimental Tests ........................................................................................................................ 31
4.1. Mechanical characterization .................................................................................................. 31
4.1.1. Unconfined compressive test. ........................................................................................ 31
4.1.2. Three point bending test ................................................................................................ 36
4.2. In-plane cyclic shear-compression ........................................................................................ 40
4.2.1. Test set-up ..................................................................................................................... 40
4.2.2. Test execution and outcomes ........................................................................................ 41
4.3. In-plane monotonic shear-compression test .......................................................................... 44
4.4. Diagonal Compression test.................................................................................................... 45
4.4.1. Test set-up ..................................................................................................................... 45
4.4.2. Test execution and outcomes ........................................................................................ 47
4.4.3. Results Comparison ...................................................................................................... 51
4.5. Interpretation of the tests ....................................................................................................... 54
5. Conclusions ................................................................................................................................... 57
6. Further research developments ..................................................................................................... 59

Experimental study on the influence of textile reinforcement on the structural response of reduced scale rammed earth buildings
Erasmus Mundus Programme
ADVANCED MASTERS IN STRUCTURAL ANALYSIS OF MONUMENTS AND HISTORICAL CONSTRUCTIONS xiii
7. REFERENCES .............................................................................................................................. 60
LIST OF FIGURES
Figure 1 c)Traditional and a)modern rammed earth building technique; b)crawling formwork 3
Figure 2 a)Earthen building diffusion; b) Seismic hazard map ................................................ 4
Figure 3 Mohr-Coulomb envelope .......................................................................................... 4
Figure 4 Specimen production phases, Miccoli 2004 ............................................................. 6
Figure 5 in-plane shear compression test: a) test set-up; b)failure mode (Miccoli, 2016) ....... 7
Figure 6 FEM model shear behavior ...................................................................................... 8
Figure 7 In-plane lateral cyclic loading test (Arslan 2016) ...................................................... 8
Figure 8 Load- displacement envelopes (Arslan 2016) .......................................................... 9
Figure 9 a) Energy dissipation ; b) Stiffness degradation (Arslan 2016) ............................... 10
Figure 10 Reinforced specimens and test set-up (Lui 2015) ................................................ 11
Figure 11 Diagonal test (Miccoli 2015): a) test set-up; b) Shear stress-shear strain curves . 12
Figure 12- Particle size distribution of the soil components .................................................. 15
Figure 13-PSD of the soil mixture compared with suitability recommendations: AFNOR XP-
P13 901 [9], CRATerre (ARSO) [14], MOPT [20], Houben [23] and CRATerre (Rigassi) [24]
............................................................................................................................................ 15
Figure 14-Standard and modified compaction curves for Crosby B. .................................... 16
Figure 15-Specimens for mechanical characterization ......................................................... 17
Figure 16-Designed scaled walls specimens ....................................................................... 18
Figure 17-Construction of the mould .................................................................................... 19
Figure 18 Execution of the mould......................................................................................... 20
Figure 19 Clay Sieving operations ....................................................................................... 20
Figure 20-Mixing phases ...................................................................................................... 21
Figure 21 Moulding and compaction .................................................................................... 22
Figure 22 Dry oven test ........................................................................................................ 23
Figure 23- Demolding operations ......................................................................................... 24
Figure 24- Produced scaled wall models.............................................................................. 24
Figure 25- UPV results in sample 1 before being reinforced ................................................ 25
Figure 26 Execution of the external reinforcement on sample RE_W1.EXT ......................... 26
Figure 27- UPV results in sample 1 after the reinforcement ................................................. 27
Figure 28- UPV test result in the unreinforced sample ......................................................... 29
Figure 29-Unconfined compressive test ............................................................................... 31

Experimental study on the influence of textile reinforcement on the structural response of reduced scale rammed earth buildings
Erasmus Mundus Programme
xiv ADVANCED MASTERS IN STRUCTURAL ANALYSIS OF MONUMENTS AND HISTORICAL CONSTRUCTIONS
Figure 30 Load displacement curves_compressive test RE_W2.INT_CO ............................ 32
Figure 31-Load Displacement curves RE_W1.INT ............................................................... 33
Figure 32-Load displacement curves of compression test on RE_W3.UNR ......................... 34
Figure 33-a),b)Three point bending test; c),d) Compression test .......................................... 36
Figure 34-Flexural test curves of the plaster ........................................................................ 37
Figure 35-Compression test on plaster samples .................................................................. 38
Figure 36-Flexural strength of the unreinforced specimen .................................................... 39
Figure 37Compression test on RE_W3.UNR prismatic samples .......................................... 39
Figure 38-In-plane shear compression test set-up ............................................................... 40
Figure 39-in-plan shear compression test on RE_W0 .......................................................... 41
Figure 40-In-plane cyclical loading test: a)Cycle displacement schedule; b)load pattern;
c)hysteretic loops ................................................................................................................. 42
Figure 41 In-plane cyclical behavior on RE_W2.INT: a) Cycle displacement; b) Load pattern
............................................................................................................................................ 43
Figure 42- In-plane cyclical behavior on RE_W2.INT: a) Hysteresis curves: b) Envelope
curve .................................................................................................................................... 44
Figure 43-damage patter on RE_W2.INT after the cyclical shear test .................................. 44
Figure 44-Load displacement curve of the monotonic shear test on RE_W2.INT ................. 45
Figure 45-Diagonal compression test first set-up ................................................................. 46
Figure 46-Diagonal Compression test, second set-up .......................................................... 46
Figure 47-Diagonal test performed with the first set-up on the sample RE_W2.INT ............. 47
Figure 48-Load-displacement curve of Diagonal Compression test RE_W2.NT_D1 ............ 47
Figure 49-Diadonal compression test performed on the specimen RE_W1.EXT with the set-
up D1 ................................................................................................................................... 48
Figure 50-Load-displacement curves of the diagonal test D1performed on the sample
RE_W1.INT .......................................................................................................................... 48
Figure 51-Diagonal compression test performed on RE_W3.UNR with the second set-up D2
............................................................................................................................................ 49
Figure 52-Load displacement curve of the diagonal compression test D2 on RE_W1.EXT .. 49
Figure 53-Failure mode RE_W1.INT_D2 ............................................................................. 50
Figure 54- load- displacement curve diagonal test D2 on RE_W1.EXD ............................... 51
Figure 55-Diadonal test D1- load displacement curves ........................................................ 51
Figure 56-Load-displacement curves on the diagonal compression test D2 ......................... 52
Figure 57- Load displacement curves of the tests performed on the specimen RE_W2.EXT 53

Experimental study on the influence of textile reinforcement on the structural response of reduced scale rammed earth buildings
Erasmus Mundus Programme
ADVANCED MASTERS IN STRUCTURAL ANALYSIS OF MONUMENTS AND HISTORICAL CONSTRUCTIONS xv
Figure 58- a) Evaluation of the input energy in One loading cycle; b)Evaluation of dissipated
energy in one loading cycle (Tomaževič 1996) ................................................................... 55
Figure 59-k Diagonal compression test. Loading scheme (on the left) and stress state at the
centre of the panel in Mohr’s representation (on the right). (Lagomarsino et al. 2010) ........ 56
LIST OF TABLES
Table 1 Mohr Coulomb properties .......................................................................................... 5
Table 2 Literary review about rammed earth's mechanical properties (Miccoli et al. 2014) .... 5
Table 3 Specimens identification (Arslan 2016) ..................................................................... 9
Table 4-Density of the soil mixture ....................................................................................... 14
Table 5 Recommended soil fractions ................................................................................... 14
Tabl 6 soil fractions .............................................................................................................. 15
Table 7-Glass fiber mesh properties .................................................................................... 17
Table 8 Soil mixture composition ......................................................................................... 21
Table 9-Moisture contents determined by mean of the dry oven test ................................... 23
Table 10 Specimens identification codes ............................................................................. 24
Table 11-test identification code .......................................................................................... 24
Table 12- UPV results in sample 1 before being reinforced.................................................. 25
Table 13 UPV results in sample 1 after the reinforcement ................................................... 27
Table 14- UPV test result in the unreinforced sample .......................................................... 29
Table 15- Density RE_W2.INT ............................................................................................. 32
Table 16 Compressive strength RE_W1_CO ....................................................................... 32
Table 17-Unreinforced sample density ................................................................................. 34
Table 18 Stiffness and apparent young modulus RE_W3.UNR_CO ................................... 35
Table 1919-Dimensions of the Plaster prismatic sample ...................................................... 36
Table 20-Linear shrinkage of the plaster .............................................................................. 36
Table 21-Flexural strength of the plaster .............................................................................. 37
Table 22-Compressive strength of the plaser ....................................................................... 38
Table 23 Linear shrinkage of the unreinforced specimen ..................................................... 38
Table 24-Flexural strength of the unreinforced sample ........................................................ 38
Table 25-Compressive strength RE_W3.UNR on prismatic samples ................................... 39
Table 26- Amplitudes of the reversed cycles ........................................................................ 41
Table 27-Maximum loads reached in the diagonal compression test by each sample .......... 52
Table 28-Diagonal tensile strength....................................................................................... 56

Experimental study on the influence of textile reinforcement on the structural response of reduced scale rammed earth buildings
Erasmus Mundus Programme
xvi ADVANCED MASTERS IN STRUCTURAL ANALYSIS OF MONUMENTS AND HISTORICAL CONSTRUCTIONS

Experimental study on the influence of textile reinforcement on the structural response of reduced scale rammed earth buildings
Erasmus Mundus Programme
ADVANCED MASTERS IN STRUCTURAL ANALYSIS OF MONUMENTS AND HISTORICAL CONSTRUCTIONS 1
1. INTRODUCTION
1.1. Motivation
Rammed building is a very ancient building technique spread in all the five continents as well as other
earthen construction technique.
Currently almost the 30%-40% of the world population live in earthen dwellings.
The rammed earth diffusion is due to the large availability of the row material that doesn’t require any
processing, hence a low skilled manpower is required.
Nowadays this technique is appreciated from the point of view of environmental and social
sustainability, because of the absence of energy consumption, none of the less for its affordability.
1.2. Objectives
The aim of this work is to evaluate the effectiveness of the glass fiber mesh as reinforcement and
strengthening system in existing and new Rammed Earth building as well.
For this purpose, compressive test and shear test are performed on three reduced scaled models
namely: an unreinforced sample, a retrofitted sample by mean of glass fiber mesh applied on the two
surfaces of the wall, a reinforced sample by two layer of glass fiber mesh, internally placed in the
thickness of the scaled wall model.
1.3. Structure of the work
Firstly, the most recent and remarkable experimental researches about rammed earth properties and
reinforcement methods are presented.
Subsequently, the experimental methodology a procedures carried out in this work are described,
including production process and test assembling.
Further on, the obtained experimental results are presented and discussed.

Experimental study on the influence of textile reinforcement on the structural response of reduced scale rammed earth buildings
Erasmus Mundus Programme
2 ADVANCED MASTERS IN STRUCTURAL ANALYSIS OF MONUMENTS AND HISTORICAL CONSTRUCTIONS

Experimental study on the influence of textile reinforcement on the structural response of reduced scale rammed earth buildings
Erasmus Mundus Programme
ADVANCED MASTERS IN STRUCTURAL ANALYSIS OF MONUMENTS AND HISTORICAL CONSTRUCTIONS 3
2. STATE OF THE ART
2.1. Rammed earth constructions
The rammed earth building technique consist in rising monolithic wall by adding and compacting layer
of wet soil between removable wooden boards.
It is historically spread worldwide, the names, used in different languages, to identifies this technique,
refers to the compacting action of ramming: ‘pisé’ in French, ‘tapial’ in Spanish, ‘taipa’ in Portuguese,
‘terra battuta’ in Italian and ‘Stampflehm’ in German.
The timber formwork has the function to stand the load due to the compaction effort, hence it needs to
be provided with some stabilizing devices.
The execution of the walls occurs by recourses, thus the traditional timber formworks, that surrounds
horizontally the walls, are moved vertically to the next level once that the current layer of soil has been
compacted. The crawling formwork are usually supported by the built portion of wall below, in this
case putlogs holes are visible on the surfaces of the constructions. Seldom the formwork are self
supporting and provided of scaffoldings. The compaction used to be traditionally applied manually by
mean of wooden elements. In modern constructions, continuous formworks and pneumatic or
vibratory rammers are utilized (Figure 1).
a)
b)
c)
Figure 1 c)Traditional and a)modern rammed earth building technique; b)crawling formwork
The origins of earthen construction techniques have been found in China (221-581 A.D.) and in the
Mediterranean areas, particularly in the Iberian peninsula and northern Africa by the Phoenicians (800
B.C.).
Later, Islamic military fluxes again built earthen fortresses in the Iberian Peninsula.
Spanish and Portuguese settlement brought earthen techniques building in Southern America.
European settlers spread the technique in Australia and New Zealand and north America.
It has to be noticed that most of the earthen building diffusion coincides with seismic prone areas.
(Figure 2)

Experimental study on the influence of textile reinforcement on the structural response of reduced scale rammed earth buildings
Erasmus Mundus Programme
4 ADVANCED MASTERS IN STRUCTURAL ANALYSIS OF MONUMENTS AND HISTORICAL CONSTRUCTIONS
a)
b)
Figure 2 a)Earthen building diffusion; b) Seismic hazard map
2.2. Experimental research context
In this paragraph, some remarkable researches about the topic in exam are presented. It has to be
noticed that the most significant campaigns about shear tests and mechanical characterization on
reinforced rammed earth construction are quite few and recent.
The researches studies are presented according to the typology of test program adopted, that are the
same tests typology performed in the present work. Nonetheless, the reinforcement technique
proposed are noteworthy as well as the data collected about the mechanical characterization of the
rammed earth.
2.2.1. Mechanical properties
As strength criterion for rammed earth Mohr Coulomb is adopted as commonly happens for soils.
It states that if at any point on any plane within the soil the shear stress becomes equal to the shear
strength of the soil then failure will occur at that point (Craig, 2004).
𝜏 = 𝜎tan𝜑 + 𝑐 (1)
The latter equation represents the Mohr Coulomb envelope, intended as failure envelope in normal-
shear space. Shear stress is a linear function of the normal stress, the envelope is tangent to the Mohr
coulomb circles that represent the stress state at shear failure on a failure surface (fig.3).
Figure 3 Mohr-Coulomb envelope
In the equation n.1 τ is the shear stress, σ is the normal stress, υ and c are material properties or
shear strength parameters, specifically υ is the stress dependent component defined as angle of
shearing resistance or angle of internal friction since it depend from the frictional resistance in sliding
between the particles, c is called apparent cohesion and it’s the resultant of chemical, electrochemical
and suction forces within the soil.

Experimental study on the influence of textile reinforcement on the structural response of reduced scale rammed earth buildings
Erasmus Mundus Programme
ADVANCED MASTERS IN STRUCTURAL ANALYSIS OF MONUMENTS AND HISTORICAL CONSTRUCTIONS 5
The strength parameters of the soil mixture implied in this work are reported in Table 1 Mohr Coulomb
properties.These parameters has been determined during a previous research carried out by the UPC
in the campus of Terrassa.
Shear strength parameters
c [Mpa] Φ[°]
0,64 38
Table 1 Mohr Coulomb properties
Rammed earth layered structure is not homogeneous, it shows increasing density up along the same
layer and different values between the layers, specifically, the lasts layer are weaker because less
confined than the ones underneath. Moreover, the interfaces between the layers has to be considered.
From an experimental research carried out by Q.-B. Bui, J.-C. Morel (2009), emerged that as long as
the layer remain adherent one to each other, rammed earth can be considered as an isotropic
material.
Unconfined compressive tests, unloading-reloading cyclical tests were carried out on Equivalent
Volume of Rammed earth and on homogenized Compressed Earth Blocks, along both directions
perpendicular and parallel to the layer.
The failure modulus, defined as the ratio between the maximum stress and the corresponding
deformation, resulted to be equal one to each other, at roughly 70 MPa, in the two directions.
The difference between the compressive strengths obtained in the two directions, was less than 10%.
The average elastic modulus for unloading and reloading were quite the same in the two directions for
preloading load of 0.4 MPa.
Further investigation are needed on site buildings, regarding the anisotropy of rammed earth, however
in the present work, as it’s shown hereafter, the scaled wall specimens can be considered isotropic
since they are constituted only by one compressed soil layer. Noteworthy is the work published in
2014 by Miccoli et al. In latter, an experimental campaign aimed to compare the mechanical properties
achieved in the main earthen building techniques is presented. Moreover an exhaustive literary
review is proposed. Here after the attention is focused on the information concerning the rammed
earth.
Bulk density (kg/m3)
Compressive strength (MPa)
Young's modulus(Mpa)
References
2100–2300 2.40–3.00 650 Dierks K. 2000
1800 1.00 90–105 Bui Q.B. 2009
1700–2400 1.50–4.00 750 Rölen 2010
2020–2160 0.75–1.46a nd Hall M. 2014
1870–2170 1–80-2.00 nd Lilley DM. 1995
nd 0.60–0.70 60 Jaquin PA 2007
1850 3.88 205 Maniatidis 2007
1850 2.46 160 Ziegert 2003
1763–2027 0.62–0.97 60–70 Ziegert 2003
Table 2 Literary review about rammed earth's mechanical properties (Miccoli et al. 2014)

Experimental study on the influence of textile reinforcement on the structural response of reduced scale rammed earth buildings
Erasmus Mundus Programme
6 ADVANCED MASTERS IN STRUCTURAL ANALYSIS OF MONUMENTS AND HISTORICAL CONSTRUCTIONS
The soil implied to produce the sample of the experimental campaign was characterized by a
shrinkage of 0,5%, a bulk density of 2190 kg/m3 a particle size range 0-16mm.
The rammed earth specimen were produced with a moisture content of 10% in 10 cm deep soil layer
manually compacted.
Compression test was carried out under force control by mean of a 1 MN universal testing machine on
wallettes of size of size 500 x 500 x 110 mm3. LVDTs sensors were utilized to measure the
displacements. The obtained results are namely: Compressive strength equal to 3,73 MPa, Young
modulus of 4143 MPa, Poisson modulus equal to 0,27.
Figure 4 Specimen production phases, Miccoli 2004
2.2.2. In-plane cyclic shear-compression
In 2016 the BAM institute in collaboration with the Institute of Theoretical and Applied Mechanics
(ITAM) of Prague, inside the framework of a NIKER project, carried out an experimental campaign
about the shear behavior of Rammed earth walls (Miccoli 2016).
The experimental research was followed by a work of numerical modeling by mean of a finite element
method software.
The experimental program foresaw to perform in plane compression shear tests on three full scale
rammed earth wall samples. The size of the walls was 1300mm x 1050mm x 250mm, the bulk density
equal to 2190 kg/m3, maximum particle size of 16 mm. The soil mixture were produced with a moisture
content of 9-10% by mass, than poured in a plywood formwork and compacted in thirteen layer. The
compaction process were performed using a mechanical rammer, that lowered each layer from an
initial height level of 150 mm to 100 mm. the moisture content at the testing moment was about 2-3%
by mass.
Preliminary static tests were carried out on wallets with a size on 150mm x 150mm x 100mm to
determine the following mechanical characteristics:
Uniaxial compressive strength :fc =3,73 N/mm2 ;
Shear strength τmax = 0,70 N/mm2 ;
Young modulus E= 4143 N/mm2;
Shear modulus G=1582 N/mm2.

Experimental study on the influence of textile reinforcement on the structural response of reduced scale rammed earth buildings
Erasmus Mundus Programme
ADVANCED MASTERS IN STRUCTURAL ANALYSIS OF MONUMENTS AND HISTORICAL CONSTRUCTIONS 7
For the in plane shear compression test, the test-set up(Figure 5 a) was designed in order to allow the
walls to behave like a cantilever beam, clamped at the base and loaded at the top.
Specifically, at the top of the walls a C profile steel beam was place in order to transmit the loads from
the actuator to the samples and, at the same time, to avoid the sliding. A constant compressive
tension σ of 0,56 N/mm2,
equal to the 25% of the compressive strength, was imposed by mean of
three hydraulic actuators connected to the capping beam. The shear test was carried out imposing
increase of 2,5 mm each step in the displacement amplitude with a frequency of 0,1 Hz. The peaks in
the displacement amplitude were repeated three time each step.
Displacements, flexural and shear deformations were measured by six linear variable differential
transformers LDVT sensors, while the loads were registered by load cells linked to the actuators.
a) b)
Figure 5 in-plane shear compression test: a) test set-up; b)failure mode (Miccoli, 2016)
The test was stopped when the measured load started to decrease.
During the test execution four limit states were identified and the corresponding lateral load H, lateral
displacement δ and rotation angle θ were registered.
Specifically, the first non linearity, was qualitatively observed, the second one, coincided with the
opening of the first crack, while the third limit state corresponded to the formation of a diagonal strut
associated to the appearance of crossing cracks throughout the rammed earth layers, nonetheless the
maximum values of lateral load an displacement are reached.
The fourth limit state corresponded to the collapse of the walls.
The failure mode Figure 5 b) was constituted by the typical diagonal shear cracks. In two of the three
sample, X shape cracks appeared, while a diagonal crack marked the third sample.

Experimental study on the influence of textile reinforcement on the structural response of reduced scale rammed earth buildings
Erasmus Mundus Programme
8 ADVANCED MASTERS IN STRUCTURAL ANALYSIS OF MONUMENTS AND HISTORICAL CONSTRUCTIONS
Figure 6 FEM model shear behavior
A FEM numerical model, based on the experimental results of the described campaign, was
elaborated (Figure 6). Total strain rotating crack model for the rammed earth layers and Mohr
Coulomb failure criterion for the layer interfaces, were adopted as constitutive laws.
In the same year, 2016, M. E. Arslan et al, from the university of Düzce in Turkey, published their
work about the assessment of the structural behavior of rammed earth walls under lateral cyclic
loading in comparison with stabilized rammed earth walls and other traditional masonry building
techniques. Specifically the experimental program was carried out upon six sample with dimensions of
150cm x 150 cm x 20 cm: one made of non stabilized rammed earth, three made of stabilized rammed
earth, one of brick masonry and one of aerated concrete blocks (Table 3 Specimens identification (Arslan
2016)).
Figure 7 In-plane lateral cyclic loading test (Arslan 2016)

Experimental study on the influence of textile reinforcement on the structural response of reduced scale rammed earth buildings
Erasmus Mundus Programme
ADVANCED MASTERS IN STRUCTURAL ANALYSIS OF MONUMENTS AND HISTORICAL CONSTRUCTIONS 9
Figure 8 Load- displacement envelopes (Arslan 2016)
Code Description of the specimens
NSR Non-Stabilized Rammed Earth
Wall
MBW Masonry Brick Wall
MACW Masonry Aerated Concrete wall
C5BFS5R 5% Cement + 5% Blast furnace
slag stabilization
C10R 10% Cement stabilization
C10GF1R 10% Cement stabilization+
1% glass fiber
Table 3 Specimens identification (Arslan 2016)
The compressive strength of each mixture was determined by mean of compression test executed on
three cylindrical sample with dimensions of Ø150 x 300 mm. From the latter tests emerged that the
stabilizing additives increase the compressive strength, moreover glass fiber allow to decrease the
amount of cement in view of an acceptable loss of resistance.
The lateral reversed cyclic loading set-up was constituted by a steel frame hinged at the joints that
was surrounding the walls. A servo-hydraulic actuator transmitted the lateral loads to the sample. The
presence of the hinges allowed to measure the real values of load and displacement of the wall inside
the frame without the contribution of columns and beams. The reversed displacement cycles were
applied with the following drift ratios each three cycles 0.15%, 0.20%, 0.25%, 0.35%, 0.50%, 0.75%,
1.00%, 1.40%, 1.75%, 2.20%, 2.75%, 3.50%, 4.00%, 4.50%, 5.00%, 5.50%, 6.00%, 6.50%.
The lateral loads was measured by mean of a load cell with 500 kN of capacity, moreover a linear
potentiometric displacement transducer (LPDT) was applied.
The comparison between the load displacement envelope curves shows that the higher lateral load
carrying capacity is obtained by the Masonry Aerated Concrete wall, followed by the rammed earth
wall stabilized with cement and glass fiber, whereas, the lowest load carrying capacity was obtained in
masonry hollow bricks wall.
Similarly, higher values of total energy dissipated were associated to the aerated concrete wall and
the rammed earth wall stabilized with cement and glass fiber.

Experimental study on the influence of textile reinforcement on the structural response of reduced scale rammed earth buildings
Erasmus Mundus Programme
10 ADVANCED MASTERS IN STRUCTURAL ANALYSIS OF MONUMENTS AND HISTORICAL CONSTRUCTIONS
a)
b)
Figure 9 a) Energy dissipation ; b) Stiffness degradation (Arslan 2016)
Furthermore the secant stiffness, determined as the slope of the line that connect the peak load in
push and pull direction for each cycle were determined in correspondence of each drift ratio. In fig is
represented the stiffness degradation, the secant stiffness decrease for increasing drift ratio. the
highest initial stiffness is obtained for the two cement stabilized rammed earth walls.
Regarding the failure mode, for the two 10 % cement stabilized walls, the typical crack pattern of
shear walls laterally loaded, constituted by X-shaped cracks was observed, while the non reinforced
rammed earth wall and in the cement and blast furnace slag stabilized wall, sliding plane coinciding
with the separation rammed earth layer where more evident.
In the hollow brick masonry walls shear surfaces in the joints appeared after that diagonal cracks
appeared. In the aerated cement wall, scattered diagonal cracks characterized the failure mode.
2.2.3. Monotonic lateral loading
Subsequently to the earthquake occurred in the Yunnan Province in China in 2014, the Normal
University of Beijin and the Academy of Disaster Reduction and Emergency Management of Beijin,
undertook an experimental campaign in order to refine a strengthening technique that could enhance
the seismic performance of shear rammed earth walls (Liu et al.2015).
Lateral load capacity of four specimens (2400 mm x 2100 mm x 600mm) and ductility were evaluated
by mean of monotonic later load test. One of the specimen was left unreinforced as reference, the
other three were reinforced with 20 cm wide tarpaulin strips. The latter were bonded on two walls in
horizontal direction, respectively, in one and two overlaid layers, while, on the last specimen they were
placed in diagonal directions.
Moreover, preliminary debonding test were carried out to evaluate the performance in term of strength,
workability, ductility, availability and cost of different fiber materials and adhesives, namely: canvas,
bamboo shavings, and tarpaulin as fiber and: epoxy adhesive, sodium silicate and NF compound as
bonding materials.

Experimental study on the influence of textile reinforcement on the structural response of reduced scale rammed earth buildings
Erasmus Mundus Programme
ADVANCED MASTERS IN STRUCTURAL ANALYSIS OF MONUMENTS AND HISTORICAL CONSTRUCTIONS 11
Finally Tarpaulin and NF compound were chosen as reinforcing materials. The rammed earth walls
were constructed by local builders with the soil commonly used in the region of Yunnan for the
construction of rural dwelling.
The test set-up was arranged as follows: the walls were connected to a concrete footing provided of
coarse stone to reproduce the traditional technique used in order to better connect the walls to the
foundations.
Figure 10 Reinforced specimens and test set-up (Lui 2015)
On top of the specimens, a concrete beam was casted in situ in order to transfer lateral and vertical
loads, specifically a constant compressive stress of 0,06 MPa were transmitted by mean of a steel
beam placed over the top concrete beam to simulate the weight of the roof. The inertial seismic action
was produced as lateral load at the end of the concrete loading beam.
The test was executed in load control with increments of 2kN from the lateral load hydraulic jack.
The load were measured by load cells connected to the jacks, lateral displacements were registered
by displacements gauges, and the strain of the tarpaulin was measured by strain gauges.
The unreinforced wall reached a maximum load corresponding to an ultimate displacement of 57 mm
before showing a softening behavior. In this case the crack pattern is characterized by the appearance
of diagonal cracks starting from the loading point and propagating until the failure, clearly occurred
due to shear.
The wall reinforced with two layer of tarpaulin horizontally placed, achieved an increase of 22% of
lateral load carrying capacity, and 63% of ultimate displacement in comparison with the unreinforced
specimen. Beneath the strips of reinforcement, the wall presented an x-shaped crack pattern.
A similar but slighter failure mode was showed by the wall strengthened with three layer of tarpaulin,
that besides, presented a 75% higher load capacity and a 38% bigger ultimate displacement.
Finally the wall reinforced with diagonally placed tarpaulin strips, exhibited scattered diagonal crack
along the strips starting from the loaded corner to the diagonally opposite one, with increases in load
carrying capacity and ultimate displacement respectively of 82% and 29%.
The described reinforcements provided enhance in the stiffness and in the strength of the walls that,
thanks to the bonding effect of the strips, could maintain its integrity and reach the maximum load
capacity. In spite of the presence of crack, and subsequently to the loss of bonding, undewent to
higher deformation.

Experimental study on the influence of textile reinforcement on the structural response of reduced scale rammed earth buildings
Erasmus Mundus Programme
12 ADVANCED MASTERS IN STRUCTURAL ANALYSIS OF MONUMENTS AND HISTORICAL CONSTRUCTIONS
2.2.4. Diagonal compression test
Rui A. Silva, Daniel V. Oliveira, Lorenzo Miccoli and Luc Schueremans, published a work about
modeling rammed earth walls under shear loading by mean of FEM method.
The experimental program foresaw to test in axial and diagonal compression 5 rammed earth wallets
of 499mm x 505 mm x 117 mm, respectively.
The soil mixture used in the BAM institute of Berlin to executed samples, had a bulk density of 2190
kg/m3, moreover the particle composition was about 11% clay , 25% silt and 64% sand and gravel,
respectively.
The axial compressive test was performed under displacement control, imposing that the failure would
have occurred in a range of 20-30min. LVDTs were applied on the surfaces of the sample in order to
measure vertical and horizontal deformation. The following average values of mechanical
characteristics were obtain from the described test:
Compressive strength (fc=3,7 N/mm2);
Young modulus E0= 4207 N/mm2;
Poisson ratio ν=0,27
The diagonal compression test were carried out in accordance with the standard ASTM E 519-10.
LVDTs sensors were placed on both surfaces of the wallettes (Figure 11).The average values
obtained were: shear strength fs=0.70 N/mm2;
shear modulus G0=1582 N/mm2.
The curves stress strain for the shear in Figure 11 b, show that that an early peak of shear stress
appears at the end of the elastic phase of the is followed by a long hardening branch.
a)
b)
Figure 11 Diagonal test (Miccoli 2015): a) test set-up; b) Shear stress-shear strain curves
The crack pattern exhibited initial cracks in correspondence of the early peaks of stress shear,
subsequently, diagonal cracks developed in the middle of the specimen from the bottom to the top
corner. Cracks appeared also between the rammed layers’ interfaces.

Experimental study on the influence of textile reinforcement on the structural response of reduced scale rammed earth buildings
Erasmus Mundus Programme
ADVANCED MASTERS IN STRUCTURAL ANALYSIS OF MONUMENTS AND HISTORICAL CONSTRUCTIONS 13
3. Experimental program
In the present chapter the properties of the materials implied and all the operations involved in the
production of the samples are illustrated.
3.1. Material Characteristics
The behavior of the soil as building material is not deeply defined and investigated as much as other
building materials, most of the knowledge comes from the geotechnical engineering.
References from literature, i.e: handbooks, guidelines, technical documents, often provide incomplete,
and contradictory indications. More reliable, results come from experimental researches, even though
criteria that could universally be applied in a standardized way are far to be available.
Some countries provided themselves of National Code namely: New Mexico (NMAC 14.7.4. 2003 New
Mexico Earthen Building Materials Code); India (Indian standard Code of practice for in situ
construction of walls in buildings with soil-cement); New Zeland (NZS 4297- 4298-4299, 1998);Perù
(NTE E 080,2000); Regional Africa (ARSO 1996); Zimbabwe SAZS 724, 2001).
In other Countries, instead, Guidelines with the validity of Normative documents are presents: Uk
(Rammed earth design and construction guidelines); Germany (Lehmbau Regeln ,1999); Australia
(HB 195, 2002, Bullettin 5, 1995, EBAA, 2001; Spain MOPT 1992, IETC cc (1971).
Technical documents are edited by research institute like CRAterre (Rigassi V 1995), or universities
and other authors i.e. Spence and Cook 1983, Smith and Austin 1996, OIA 1970, Mc Henry PG 1984,
Houben And Guillaud 1994; Office of Internatinal Affairs (Delgado 2007).
In any case the common tendency is to relate the properties of the initial soil to the performance
requirements of the earthen products (Ciancio 20013) in order to define suitability criteria to select and
test soilt, during the production of rammed earth constructions.
The main suitability criteria concerning the physical properties of the row material are: particle size
distribution PSD, Plasticity index, clay content, moisture content, compactability, linear shrinkage.
The main performance requirements are: Compressive strength, flexural strength, drying shrinkage.
Specifically , the compressive strength depends on the dry density. The main factors that influence the
density are grain size distribution and the moisture content, since the maximum density is reach when
the voids between particles are filled as much as possible.
The water content is defined as the ratio the mass of water Mw and the mass of Ms soil solids
w =Mw
Ms∗ 100 (2)
Density is distinguished in dry density ρs and wet or apparent density ρ:
𝜌𝑠 =Ms
Vs (3)
ρ =Mw +Ms
Vt=
Mt
Vt (4)

Experimental study on the influence of textile reinforcement on the structural response of reduced scale rammed earth buildings
Erasmus Mundus Programme
14 ADVANCED MASTERS IN STRUCTURAL ANALYSIS OF MONUMENTS AND HISTORICAL CONSTRUCTIONS
where:
Mt is the total mass comprehensive of water Mw and solid soil Ms;
Vt in the total volume;
Vs is the volume of the solid soil.
The attended values of the used mixture for these two properties are presented in Table 4
ρs g/cm3 ρ apparent g/cm
3
1,74 1,96
Table 4-Density of the soil mixture
The water content is responsible for the plasticity in cohesive soils. Plasticity can be defined as the
ability of materials to keep a deformation without breaking (Delgado 2007). It is quantified by the
Atterberg limits.
Furthermore clay particles are almost always hydrated in nature, they are surrounded by a layer of
adsorbed water. This phenomenon is due to the dipolar molecular structure of the water and the
consequent hydrogen bonding that it creates with the clay minerals. Water is electrostatically attracted
by clay. The dimension of clay minerals and hence their exposed specific surfaces determines the
activity. For the reason seen above, clay soil are particularly sensitive to the moisture.
Typically the drying process of wet soil led to a decrease of volume often accompanied by the
appearance of cracks.
3.1.1. Physical characterization
3.1.1.1. Soil grading
Similarly to the concrete, also in rammed earth there is a fraction with a binding role, specifically silt
and clay that are cohesive soils, and an aggregate fraction: sand and gravels.
Particle size distribution PSD and moisture content are used in this work as reference for the
evaluation of the soil suitability, in accordance with the recommendation prescribe by the quoted
documents. Specifically minimum and maximum percentages of contents of the soil fractions (clay, silt,
sand, gravel) are given as recommended granularity. In Table 5, the limit value of soil fractions for
rammed earth are reported (Delgado et. al.2005):
Document Clay % Silt % Sand% Gravel%
SAZS 724 -2001 5–15 15–30 Sand+ fine gravel 50-70
MOPT-1992 5–26 - - -
IETCC 1971 10–40 20–40 10–40 10–20 fine gravel
Table 5 Recommended soil fractions

Experimental study on the influence of textile reinforcement on the structural response of reduced scale rammed earth buildings
Erasmus Mundus Programme
ADVANCED MASTERS IN STRUCTURAL ANALYSIS OF MONUMENTS AND HISTORICAL CONSTRUCTIONS 15
In the present experimental work the composition in Tabl 6 is used for the production of the wallettes
in accordance with the IETCC recommendation.
Clay+silt % Small sand % Big sand%
40 45 15
Tabl 6 soil fractions
The granulometric curve of the soil mixtures falls, approximately within the field defined by the two
curves of admissibility, indicated as optimum for earthen construction techniques by some of the
quoted literature references (Figure 12;Figure 13).
Figure 12- Particle size distribution of the soil components
Figure 13-PSD of the soil mixture compared with suitability recommendations: AFNOR XP-P13 901 [9], CRATerre (ARSO) [14], MOPT [20], Houben [23] and
CRATerre (Rigassi) [24]
3.1.1.2. Moisture content and Compaction
In order to obtain the desired level of density and compressive strength, moisture content and
compact energy were designed and tested.
Compaction is intended as the process that brings about an increase in soil density and a decrease in
air volume.
According to the Proctor compaction theory the optimum moisture content OMC is the one for which
the maximum dry density is obtained for a given compactive effort.( Holts and Covaks 1981).
Compaction curves are obtained increasing the water content for different compactive effort applied on
the same type of soil. The curves, experimentally obtained, show that increasing the compactive effort,
higher dry density are reached for lower optimum moisture content.
Adding progressively water to the soil means that the clay particles are enveloped by larger layer of
water until the water takes the place of the particles, therefore the maximum dry density can’t be
reached for saturation. This is the reason way after the peak points in the compaction curves, the dry
density start decreasing in correspondence of an increase of water content.
0
20
40
60
80
100
120
0,0010,010,1110
Passin
g p
erc
enta
ge (
%)
Particle size (mm)
Used mixture
Small sand
Big sand
Clay
Experimental study on the influence of textile reinforcement on the structural response of reduced scale rammed earth buildings
Erasmus Mundus Programme
16 ADVANCED MASTERS IN STRUCTURAL ANALYSIS OF MONUMENTS AND HISTORICAL CONSTRUCTIONS
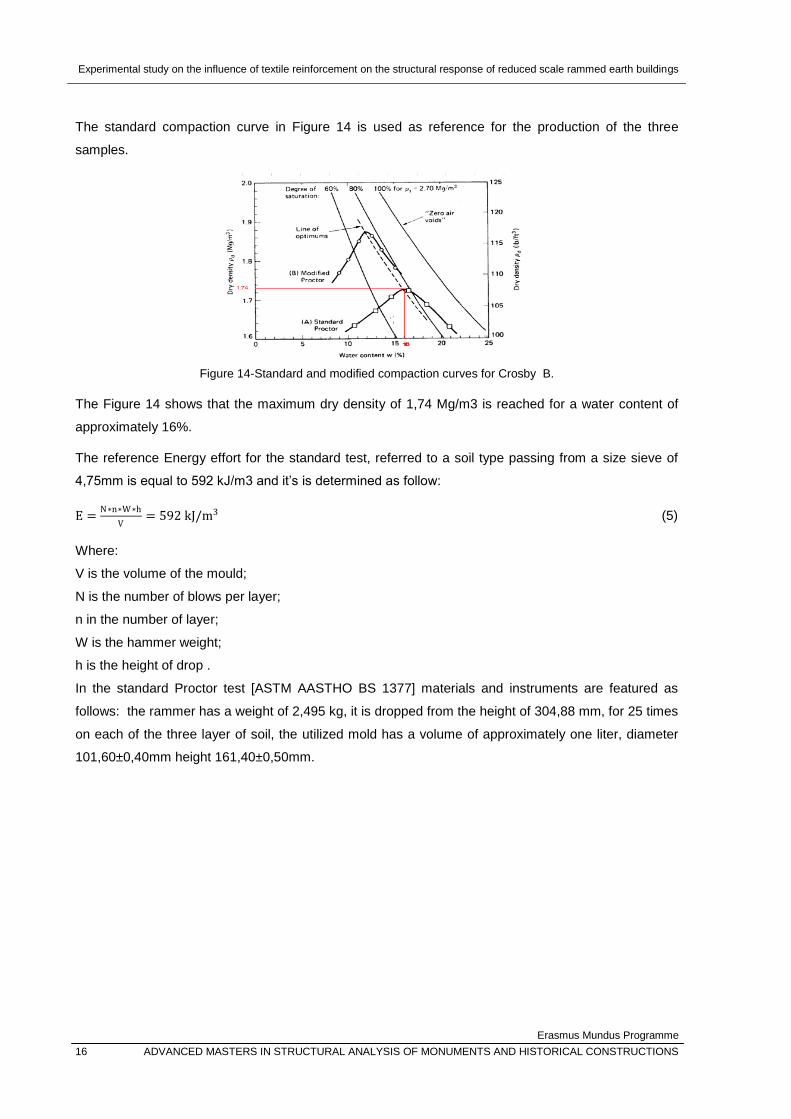
The standard compaction curve in Figure 14 is used as reference for the production of the three
samples.
Figure 14-Standard and modified compaction curves for Crosby B.
The Figure 14 shows that the maximum dry density of 1,74 Mg/m3 is reached for a water content of
approximately 16%.
The reference Energy effort for the standard test, referred to a soil type passing from a size sieve of
4,75mm is equal to 592 kJ/m3 and it’s is determined as follow:
E =N∗n∗W∗h
V= 592 kJ/m3 (5)
Where:
V is the volume of the mould;
N is the number of blows per layer;
n in the number of layer;
W is the hammer weight;
h is the height of drop .
In the standard Proctor test [ASTM AASTHO BS 1377] materials and instruments are featured as
follows: the rammer has a weight of 2,495 kg, it is dropped from the height of 304,88 mm, for 25 times
on each of the three layer of soil, the utilized mold has a volume of approximately one liter, diameter
101,60±0,40mm height 161,40±0,50mm.

Experimental study on the influence of textile reinforcement on the structural response of reduced scale rammed earth buildings
Erasmus Mundus Programme
ADVANCED MASTERS IN STRUCTURAL ANALYSIS OF MONUMENTS AND HISTORICAL CONSTRUCTIONS 17
3.1.2. Compressive and flexural strength
From the same mixture produced for each scaled model wall, five cylindrical sample had been
extracted in order to perform unconfined compressive tests.
a) demoulding cylindrical
samples for compressive tests
b) cylindrical samples for compressive tests
c) moulded samples for flexural characterization
d) samples for flexural
characterization
Figure 15-Specimens for mechanical characterization
Specifically, as the UK National guidelines (Appendix A) for rammed earth prescribes, Unconfined
compressive strength is obtained by testing cylinders having a height to diameter ratio of 2
The samples are high 9 mm and have a diameter of 4,5 mm (Figure 15-b)
To characterize the samples in flexure and tension three point bending flexural test is performed on
rectangular cross section specimens 40mmx40mmx160mm (Figure 15-c, d)
Description of the tests and results are presented hereafter in chapter 4.
The characteristics of the glass fiber mesh are reported in Table 7.
The tensile strength is determined on a sample wide 5 cm.
mesh Tested specimen maximum traction load
weight 65g/m2 width 5 cm longitudinal direction 891,8 N
size of the openings 5mmx5mm clamps distance 20 cm transverse direction 1117,2 N
Table 7-Glass fiber mesh properties

Experimental study on the influence of textile reinforcement on the structural response of reduced scale rammed earth buildings
Erasmus Mundus Programme
18 ADVANCED MASTERS IN STRUCTURAL ANALYSIS OF MONUMENTS AND HISTORICAL CONSTRUCTIONS
3.1.3. Description of the scaled wall models
In order to investigate the effectiveness of textile reinforcement in rammed earth, three scaled walls
have been designed to be tested under shear and compression in plane.
According to the African code for the rammed earth constructions, a slenderness ratio (width:height) of
1:8 for a wall panel has been chosen, therefore the dimensions of an hypothetic wall panel are: 2,80 m
in height and length; 35 cm in thickness.
A scale of 1:5 had been used to reduce the model, consequently, the dimensions of the samples were
56 cm in height and length; 7 cm in thickness. (Fig. 5).
a) Unreinforced Sample
b) Externally reinforced sample
c) Internally reinforced sample
Figure 16-Designed scaled walls specimens
Besides one unreinforced sample, to be used as reference for comparisons, other two reinforced
samples had been designed. The purpose of testing the reinforced sample was to assess the behavior
of glass fibers meshes, both as strengthening system for existing structure, and as reinforcing system
for new constructions (Figure 16).
In the first case the fibers had been placed on the opposite surfaces of the cured panel. The adhesion
between the wall and glass fiber meshes is given by a clay render in which the meshes are supposed
to be embedded (Figure 16-b).
In the second case the reinforcing meshes had been placed in the wet mixture during the moulding
process of the wall (Figure 16-c). In order to pursuit this aim, the internally reinforced wall needed to be
produced horizontally contrarily to real building technique. Even though with the traditional technique it
wouldn’t be immediate the application of this reinforcing system, the objective of this work is to f ind
out if the described one, could be an effective reinforcing system for rammed earth new buildings.
In order to be able to compare the result of the tests, all the three sample had been built following the
same procedure and using the same horizontal mould.

Experimental study on the influence of textile reinforcement on the structural response of reduced scale rammed earth buildings
Erasmus Mundus Programme
ADVANCED MASTERS IN STRUCTURAL ANALYSIS OF MONUMENTS AND HISTORICAL CONSTRUCTIONS 19
3.2. Laboratory phases
The production process of the scaled walls is described in this section.
The main phases were:
Construction of the mould:
Preparation of the soil mixture;
Molding and compaction of the samples;
Samples demoulding;
Monitoring of drying period.
3.2.1. Preparation of the mould
For the purpose pointed out above, an horizontal wooden mould (Figure 17) had been designed and
assembled.
It was constituted by:
a portable base able to support vertically the quite slender samples during the curing period;
a removable frame fixed to the base and a back plate, to confine the wet soil during the
moulding process and stabilize the sample during the curing time (Figure 17-f);
a removable back plate, fixed to the base and to the frame (Figure 17-f), to contain the wet
mixture during the moulding and ramming process, to be removed during the curing time;
a front plate to distribute the compaction load (Figure 17-g).
Every wooden component had been cut by mean of an electric saw, after being clamped to a stable
horizontal surface (Figure 17b, c).
a) Wooden components
b) Tools implied
c) Cutting of the components
Figure 17-Construction of the mould
Laterafter, the wooden plates had been screwed one each other to form the mould, except for the front
plate (Figure 17-g) thatwas completely removable and it had to be placed inside the frame in the
horizontal position.

Experimental study on the influence of textile reinforcement on the structural response of reduced scale rammed earth buildings
Erasmus Mundus Programme
20 ADVANCED MASTERS IN STRUCTURAL ANALYSIS OF MONUMENTS AND HISTORICAL CONSTRUCTIONS
d) Assembling by screwing
e) Assembled mould
f) ready standing mould
g) Front plate
h) Demoulding phase:
removal of the back plate
i) Disassembled mould
Figure 18 Execution of the mould
The back plate and the frame, could be easily unscrewed one from each other and both from the base
in order to be coupled with a new base and form a new mould (Figure 18-h, i)
3.2.2. Preparation of the mixture
Particular care has been paid to the treatment of the clay due its high sensitivity to moisture as seen in
3.1.
It had been sieved (Figure 19 Clay Sieving operations) and then stored in the hygrometric stable
environment of the laboratory for 10 days.
a) Picking unsieved clay
c b) Raft Clay sieving c) Clay Sieving with 2mm sieve diameter
Figure 19 Clay Sieving operations

Experimental study on the influence of textile reinforcement on the structural response of reduced scale rammed earth buildings
Erasmus Mundus Programme
ADVANCED MASTERS IN STRUCTURAL ANALYSIS OF MONUMENTS AND HISTORICAL CONSTRUCTIONS 21
For the production of the three scaled walls a total wet density of 2130 kg/m3, had been used as
reference, from previous researches carried out by the UPC University in Terrassa (tab. 5), therefore,
for a volume of the designed specimen (0,56mx0,56mx0,07m), 46,7 kg of mixture had been required.
49kg of soil mixture had been produced indeed, in order to be employed also in the production of
specimens for mechanical characterization and for moisture content determination as well.
Reference proportions
Mixture proportions
Material Amount [g]
Material Amount [g]
water 2100
water 6652
clay 5347
clay 16938
small sand 6016
small sand 19057
big sand 2005
big sand 6351
Tot 15468
Tot 49000
solid mass [g] 13368
solid mass [g] 42347,56
designed MC % 15,71
designed MC % 15,71
Table 8 Soil mixture composition
First the dry soil fractions are manually mixed (fig. 7). Then, water had been added and mixed
together with the soil.
a) Weighing soils fractions
b) Dry mixing
c) Adding water
d) Hand drop test
Figure 20-Mixing phases

Experimental study on the influence of textile reinforcement on the structural response of reduced scale rammed earth buildings
Erasmus Mundus Programme
22 ADVANCED MASTERS IN STRUCTURAL ANALYSIS OF MONUMENTS AND HISTORICAL CONSTRUCTIONS
3.2.3. Samples production
In order to verify the suitable moisture content, the hand drop test has been performed (Figure 20-d) in
accordance to the New Zealand Code.
An handful of wet mixture has to be dropped on to an hard flat surface from a distance of 1,50 m.
If the amount of water is not sufficient, then it will not be possible to form a ball or the handful shatters
into a star-shaped pattern of powder. If the water content is excessive, then the lump will not break
almost at all. The water content is suitable if the handful breaks into a star-shaped smaller pattern
containing several lumps. (NZS 4298: 1998).
In Figure 20-d, the mixture shows an appearance close to the one related to an excessive water
content. However, to produce all the samples of wall, the same amount of water had been used in
order to be able to compare the results of the tests.
Figure 21 Moulding and compaction
The wet mixture had subsequently compacted (Figure 21)
The required Impact energy of 592 kJ/m3, seen in 3.1.1.2, corresponds to 13 kJ distributed on the
entire volume of the scaled wall specimen. To release the latter degree of energy, 190 impact with a 8
kg hammer from 80 cm of height had been programmed. That means 5 impact in 36 position of the
wall surface.
Moreover a static compressive load of 180 kg had been applied, since a uniform compaction wasn’t
possible to reach, due to the spread configuration of the soil layer and the high water content.
For each wallette The exact moisture content had been determined, by mean of the oven drying test
according to IS: 2720 (Part II) – 1973. The moisture content is defined as the ratio between the solid
mass and the mass of the water. The amount of water present in the mixture had been determined by
following the steps presented hereafter.

Experimental study on the influence of textile reinforcement on the structural response of reduced scale rammed earth buildings
Erasmus Mundus Programme
ADVANCED MASTERS IN STRUCTURAL ANALYSIS OF MONUMENTS AND HISTORICAL CONSTRUCTIONS 23
Firstly a clean and dry glass container had been weighted, then, the weight of the container filled with
wet mixture was measured. The sample, composed as just described (glass+wet soil), had been left in
oven at a temperature of 110° C for 24 hours, subsequently it had been weighted again (Figure 22).
Figure 22 Dry oven test
Finally the moisture content had been calculate by this relationship:
w =[W2−W3]
[W3−W1]∗ 100% (6)
Where:
w is the water content
W1 is the weight of empty container
W2 is the weight of the container with the wet soil
W3 is the weight of the container with the dry soil.
Specimen w glass [g] w glass + wet soil [g] w glass + dry soil [g] MC [%]
RE_W1.EXT 90,3 369,3 330,7 16,057
RE_W2.INT 92 405,4 365,8 14,463
RE_W3.UNR 92,8 352,8 224,2 15,97
Table 9-Moisture contents determined by mean of the dry oven test
After being compacted the sample had been turned in vertical position.
The demoulding operations (Figure 23) had been led gradually to allow an as fast as possible drying,
though avoiding the appearance of deformations due to shrinkage. The black plate is removed two
days after the production of the wet mixture, while the frame is removed after one week.
The demoulded sample is left drying standing vertically on the base.

Experimental study on the influence of textile reinforcement on the structural response of reduced scale rammed earth buildings
Erasmus Mundus Programme
24 ADVANCED MASTERS IN STRUCTURAL ANALYSIS OF MONUMENTS AND HISTORICAL CONSTRUCTIONS
Figure 23- Demolding operations
Ultrasonic pulse velocity test had been performed in order to monitor the moisture content lowering.
Two cylindrical transducers had been acoustically coupled in direct transmission one on each side of
the wall. The transit time had been registered in different reference points. Those value decreased as
the moisture content decreased.
Figure 24- Produced scaled wall models
IN Table 10 are listed the scaled wall models. Identification label and corresponding description
are reported. The numbering respect the production order.
Specimen Description
RE_W0 Unreinforced low compacted
RE_W1.EXT Externally reinforced
RE_W2.INT Internally reinforced
RE_W3.UNR Unreinforced
Table 10 Specimens identification codes
In the subsequent chapters the abbreviation of the test performed on the specimen it is included in
the label (Table 11).
Label Test
CO Axial compression
Flex Three point flexural
D Diagonal compression
Table 11-test identification code

Experimental study on the influence of textile reinforcement on the structural response of reduced scale rammed earth buildings
Erasmus Mundus Programme
ADVANCED MASTERS IN STRUCTURAL ANALYSIS OF MONUMENTS AND HISTORICAL CONSTRUCTIONS 25
Sample RE_W0
The first produced sample was designed with a water content of 11,22%. Is has been roughly
compacted by mean of a low static load .
It is used to proof the stability of the mould and to calibrate the test instruments.
Sample 1 RE_W1_EXT
The second produced model, hereafter referred to as RE_W1.EXT, was the one designed to be
externally reinforced. In spite of the intention to standardize as much as possible the production of the
reduced scale model of walls, the manufacturing operations presented inevitably some differences
that sometimes could notably affect the characteristics of the products.
During this process it had been noticed that the consistency of the soil mixture resulted to be too
plastic, hence it had been decided to reach only the 14,5% of water content instead of 15,7 as
designed, thus, higher than the one that was supposed to be added. The latter phenomenon is
probably due to a residual adsorbed water as explained in 3.1.
Before being reinforced, the sample had been left curing for three weeks.
The readings of the UPV test are reported in Table 122.
From the recorded values (Table 12) of the transit time it can be observed that in the upper part of the
specimen the drying had been faster and more uniform than in the lower part (Figure 25).
Moreover the gap between two consecutive readings, progressively decrease until becoming
completely stable.
Figure 25- UPV results in sample 1 before being reinforced
Transit time [µs]
Date A B C D E F
22/05/2017 48 51 43 58 55 55
24/05/2017 42 45 37 56,5 56,3 57,5
26/05/2017 36 38 33 51 51 50
29/05/2017 33 35 31 41,6 46 41,4
Table 12- UPV results in sample 1 before being reinforced

Experimental study on the influence of textile reinforcement on the structural response of reduced scale rammed earth buildings
Erasmus Mundus Programme
26 ADVANCED MASTERS IN STRUCTURAL ANALYSIS OF MONUMENTS AND HISTORICAL CONSTRUCTIONS
The glass fiber mesh is applied on both side of the wall as shown in Figure 26.
Figure 26 Execution of the external reinforcement on sample RE_W1.EXT
The dried surfaces needed to be moisturized in order to foster the adhesion of the clay plaster in
which the mesh are embedded.
A first layer of 2 mm circa, had been smeared on the surface of the wall in a rough way to help the
penetration of the soil articles inside the fabric of the mesh. The mesh had been fixed by mean of the
application of a second layer of plaster starting from the corner and the edges of the wall to avoid
wrinkles and movements of the fabric. The outer plaster layer had been subsequently smoothed.
The plaster was made of a clay fraction of 70% and a small sand fraction of 30%.
To limit the appearance of cracks due to the drying shrinkage of a so clayey mixture, the wall is
covered by a plastic envelope a two bowls of water had been placed next to the wall under the
covering, as curing provisions.

Experimental study on the influence of textile reinforcement on the structural response of reduced scale rammed earth buildings
Erasmus Mundus Programme
ADVANCED MASTERS IN STRUCTURAL ANALYSIS OF MONUMENTS AND HISTORICAL CONSTRUCTIONS 27
A new series of UPV test are carried out in order to check the adhesion of the reinforcement to the
wall. (Table 13,Figure 27).
RE_W1.EXT+PLASTER Transit time µs
Dates A B C D E F G
08/06/2017 52,5 56,3 56 56,2 57 84 59
13/06/2017 47,2 43,3 48,2 47,3 46,6 47,2 51,6
19/06/2017 43 41,1 41,8 44,1 43,1 43,7 48,6
21/06/2017 43,3 40,2 43,9 43 42,4 43,6 49,3
23/06/2017 43,1 40,2 43,9 43 42,4 43,6 49
Table 13 UPV results in sample 1 after the reinforcement
Several reference points are taken. From these reading results that the reinforcement is quite good
attached from a distance of 10 cm from the edges. Out of this limit there was no transmission of sonic
waves due to discontinuities in the medium
Figure 27- UPV results in sample 1 after the reinforcement
Sample RE_W2.INT
The scaled wall indicated as sample 2 had been internally reinforced with the insertion of two mesh
inside 0,5mm from the outer wall surface.
After the mixing, a first amount of soil 3,3kg, had been placed in the mould. Subsequently the earth
had been manually mixed to receive the fiber mesh. The remaining amount of soil had been poured
into the mould, except for the quantity earmarked to the production of the samples for the
compressive characterization, besides the same quantity of the outer layer of soil that has to cover the
second mesh.

Experimental study on the influence of textile reinforcement on the structural response of reduced scale rammed earth buildings
Erasmus Mundus Programme
28 ADVANCED MASTERS IN STRUCTURAL ANALYSIS OF MONUMENTS AND HISTORICAL CONSTRUCTIONS
Figure 14-Production of the sample 2 internally reinforced
During the production of this sample, the wet soil had been mixed by mean of an electric mixer.
Moreover a lower compaction effort in term of ramming impact had been applied. Probably these
are the causes of the lumpy texture of the mass.
The UPV test didn’t give any result, hence, as is visible, there is no connection between the layers
defined by the meshes.

Experimental study on the influence of textile reinforcement on the structural response of reduced scale rammed earth buildings
Erasmus Mundus Programme
ADVANCED MASTERS IN STRUCTURAL ANALYSIS OF MONUMENTS AND HISTORICAL CONSTRUCTIONS 29
Sample RE_W3.UNR
The last sample to be produced is the unreinforced one, RE_W3.UNR.
As following , the ultrasonic test readings are reported (Table 14, Figure 28)
RE-W3.UNR Transit time µs
Dates A B C D E F
13/06/2017 53,2 59 54,3 60,3 66 72,8
19/06/20017 40 42,4 40,3 46,4 45,4 38,8
23/06/2017 38,3 40,1 38,2 44,3 42,2 36,2
26/06/20017 38,6 39,6 39,3 41,5 39,7 35,5
Table 14- UPV test result in the unreinforced sample
Figure 28- UPV test result in the unreinforced sample
It has to be noticed that for the last produced specimen, the drying process was faster since it took
place later in summer season.

Experimental study on the influence of textile reinforcement on the structural response of reduced scale rammed earth buildings
Erasmus Mundus Programme
30 ADVANCED MASTERS IN STRUCTURAL ANALYSIS OF MONUMENTS AND HISTORICAL CONSTRUCTIONS

Experimental study on the influence of textile reinforcement on the structural response of reduced scale rammed earth buildings
Erasmus Mundus Programme
ADVANCED MASTERS IN STRUCTURAL ANALYSIS OF MONUMENTS AND HISTORICAL CONSTRUCTIONS 31
4. Experimental Tests
It was decided to test the scaled wall model RE_W2.INT, internally reinforced, and the corresponding
cylindrical samples, since it had been drying for more than three weeks.
Thereafter, the sample RE_W1.EXT had been tested as soon the measurement of the ultrasonic test
were stable, hence the external reinforced plaster was completely dry. Specifically, the sample
RE_W1.EXT had been testes after 20 days from the reinforcement placing and 5 weeks after the
demoulding.
Finally, the unreinforced sample, RE_W3.UNR had been tested after three weeks of curing.
4.1. Mechanical characterization
In order to characterize the material from the mechanical point of view, unconfined compressive tests
and three points flexural test had been performed on samples made with the same soil mixture of the
scaled wall models.
4.1.1. Unconfined compressive test.
For each scaled wall, the unconfined compressive strength is determined, as recommended by the
UK National guidelines for rammed earth. Five cylindrical samples had been produced from the same
mixture used for the wall.
The Uk national guidelines prescribe that the height of the cylinder has to be the double of the
diameter.
The cylindrical specimen underwent to compression along their longitudinal axis in order to determine
the unconfined compressive strength. The latter is defined as the ratio between the maximum load
and the cross section of the sample.
Moreover, for each sample, the compressive strength is associated with the dry density.
In accordance with the British guidelines, the unconfined characteristic compressive strength fc is
determined as in the equation 6:
𝑓𝑐 = 𝑓𝑎 − 1,65𝜎𝑛−1 (6)
Where: fa is the average unconfined compressive strength of test sample;
σn-1 is the standard deviation of test sample.
Figure 29-Unconfined compressive test

Experimental study on the influence of textile reinforcement on the structural response of reduced scale rammed earth buildings
Erasmus Mundus Programme
32 ADVANCED MASTERS IN STRUCTURAL ANALYSIS OF MONUMENTS AND HISTORICAL CONSTRUCTIONS
Specimen RE_W2.INT
The first sample to be tested was the ones produced with the mixture of the internally reinforced
sample.In Table 1 are presented the geometrical characteristics of the cylindrical samples and the
corresponding values of the dry densities.
Specimen W [g] d [cm] h[cm] V cm3 density [g/cm
3] [Kg/m
3]
RE_W2.INT_CO1 217,8 4,2 7,7 106,7 2,0 2041,6
RE_W2.INT_CO2 220,6 4 8,1 101,8 2,2 2167,3
RE_W2.INT_CO3 207,8 4 7,6 95,5 2,2 2175,8
RE_W2.INT_CO4 223 4,2 8 110,8 2,0 2012,0
RE_W2.INT_CO5 215,3 4 7,8 98,0 2,2 2196,5
Average 2,1
dev
0,1
cov %
4,0
Table 15- Density RE_W2.INT
In Table 16 are presented for each specimen, the values of the maximum load resulted from the
uniaxial compressive test and the corresponding compressive strength.
Specimen Cross section area [mm2] F max N f [N/mm
2]
RE_W1_CO_1 1385 946 0,7
RE_W1_CO_2 1257 920 0,7
RE_W1_CO_3 1257 679 0,5
RE_W1_CO_4 1385 1289 0,9
RE_W1_CO_5 1257 368 0,3
Avarage
0,6
dev
0,2
cov %
37,3
Table 16 Compressive strength RE_W1_CO
The unconfined characteristic compressive strength for this specimen is fc=0,24 N/mm2.
In fig. the load displacement curves are provided. It can be noticed that the development of the tests is
quite anomalous and irregular, probably, due to the set-up apparatus, hence not all of the five test are
reliable and it would be better to consider only the result that show lower variance coefficients.
Figure 30 Load displacement curves_compressive test RE_W2.INT_CO

Experimental study on the influence of textile reinforcement on the structural response of reduced scale rammed earth buildings
Erasmus Mundus Programme
ADVANCED MASTERS IN STRUCTURAL ANALYSIS OF MONUMENTS AND HISTORICAL CONSTRUCTIONS 33
Specimen RE_W1.EXT
The same procedure had been followed for the samples of the externally reinforced scaled wall model.
Physical and geometrical properties are presented in the tab.
Specimen W [g] d [cm] h [cm] V [cm3]
density [g/cm
3]
density [Kg/m
3]
RE_W1_CO_1 237,7 4,5 8,5 135,2 1,8 1758,3
RE_W1_CO_2 223,5 4 8 100,5 2,2 2223,2
RE_W1_CO_3 219,6 4 8 100,5 2,2 2184,4
RE_W1_CO_4 219 4 8 100,5 2,2 2178,4
RE_W1_CO_5 225,9 4,1 8,3 109,6 2,1 2061,5
Average
2,1 2081,2
dev
0,2 190,3
cov %
9,1
For this sample the results of only two specimens are presented, since the remaining three are not
interpretable and increase too mach the variance coefficient.
Specimen Cross section
area [mm2]
F max [N] f [N/mm2]
RE_W1_CO_1 1392 845 0,61
RE_W1_CO_3 1343 1054 0,78
Average
0,70
dev st
0,13
cov
18,07 The charachteristic compressive strength is 0,48 N/mm
2
Figure 31-Load Displacement curves RE_W1.INT
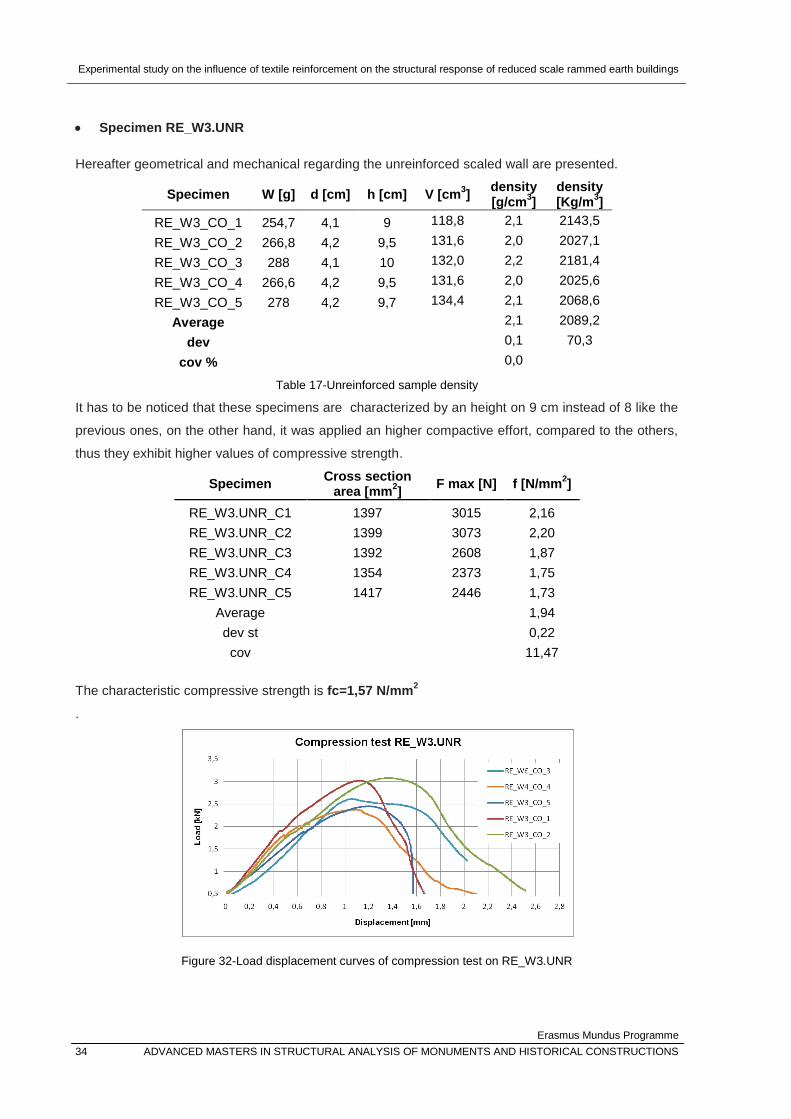
Experimental study on the influence of textile reinforcement on the structural response of reduced scale rammed earth buildings
Erasmus Mundus Programme
34 ADVANCED MASTERS IN STRUCTURAL ANALYSIS OF MONUMENTS AND HISTORICAL CONSTRUCTIONS
Specimen RE_W3.UNR
Hereafter geometrical and mechanical regarding the unreinforced scaled wall are presented.
Specimen W [g] d [cm] h [cm] V [cm3]
density [g/cm
3]
density [Kg/m
3]
RE_W3_CO_1 254,7 4,1 9 118,8 2,1 2143,5
RE_W3_CO_2 266,8 4,2 9,5 131,6 2,0 2027,1
RE_W3_CO_3 288 4,1 10 132,0 2,2 2181,4
RE_W3_CO_4 266,6 4,2 9,5 131,6 2,0 2025,6
RE_W3_CO_5 278 4,2 9,7 134,4 2,1 2068,6
Average
2,1 2089,2
dev
0,1 70,3
cov %
0,0
Table 17-Unreinforced sample density
It has to be noticed that these specimens are characterized by an height on 9 cm instead of 8 like the
previous ones, on the other hand, it was applied an higher compactive effort, compared to the others,
thus they exhibit higher values of compressive strength.
Specimen Cross section
area [mm2]
F max [N] f [N/mm2]
RE_W3.UNR_C1 1397 3015 2,16
RE_W3.UNR_C2 1399 3073 2,20
RE_W3.UNR_C3 1392 2608 1,87
RE_W3.UNR_C4 1354 2373 1,75
RE_W3.UNR_C5 1417 2446 1,73
Average
1,94
dev st
0,22
cov
11,47
The characteristic compressive strength is fc=1,57 N/mm2
.
Figure 32-Load displacement curves of compression test on RE_W3.UNR

Experimental study on the influence of textile reinforcement on the structural response of reduced scale rammed earth buildings
Erasmus Mundus Programme
ADVANCED MASTERS IN STRUCTURAL ANALYSIS OF MONUMENTS AND HISTORICAL CONSTRUCTIONS 35
The latter results can be considered the most reliable ones since the compressive effort is similar the
one applied during the production of the scaled wall.
The values of stiffness and Young modulus are determined as in tee q and reported in tab.
𝐾 =𝑃
𝛿 (7)
𝐸 =𝐾ℎ
𝐴 (8)
Where:
P is the axial load implied to provoke the displacement δ considered between the 30% and the 70% of
the maximum load;
A is the cross section area of the cylindrical specimen;
h is the height of the specimen.
Specimen K [N/mm] E [N/mm2]
RE_W3_CO_1 3010 205
RE_W3_CO_2 2354 161
RE_W3_CO_3 2556 194
RE_W3_CO_4 3061 210
RE_W3_CO_5 2171 152
Average 2630 184
dev 395 26
cov % 15 14
Table 18 Stiffness and apparent young modulus RE_W3.UNR_CO
The young modulus has to be intended as apparent modulus, since the bulk behavior of the material is
not known.

Experimental study on the influence of textile reinforcement on the structural response of reduced scale rammed earth buildings
Erasmus Mundus Programme
36 ADVANCED MASTERS IN STRUCTURAL ANALYSIS OF MONUMENTS AND HISTORICAL CONSTRUCTIONS
4.1.2. Three point bending test
The three point bending test was performed in order to determine the flexural strength and the
compressive strength of the mixture used both for the plaster of the externally reinforced scaled wall,
and for the one used for the walls as well.
As references for the test procedure the standard UNI EN 1015_11 was adopted.
The three points bending test was carried out with a rate of 10 N/s of force control.
On the two half of the prismatic samples obtained, compressive test were carried out under force
control with a rate of 100 N/s
a)
b)
c)
d)
Figure 33-a),b)Three point bending test; c),d) Compression test
The flexural strength in calculated as in the equation (9)
𝑓 = 1,5𝐹𝑙
𝑏𝑑 2 (9)
Where: F is the maximum load
l is the distance between the two supporting points
b is width of the prism
d is high of the prism
RE_W1.INT Plaster
The initial dimensions of the prismatic sample were the one presented in the Table 1919
bi [mm] di [mm] Li [mm] Vi [mm3]
40 40 160 256000
Table 1919-Dimensions of the Plaster prismatic sample
At the moment when the test were performed, the sample presented the value of linear shrinkage
provided in the Table 20:
Specimen L [mm] linear shrinkage %
PLA_flex_1 149,34 6,66
PLA_flex_2 149,73 6,42
PLA_flex_3 149,66 6,46
Average
6,51
dev st
0,13
Cov %
1,99
Table 20-Linear shrinkage of the plaster
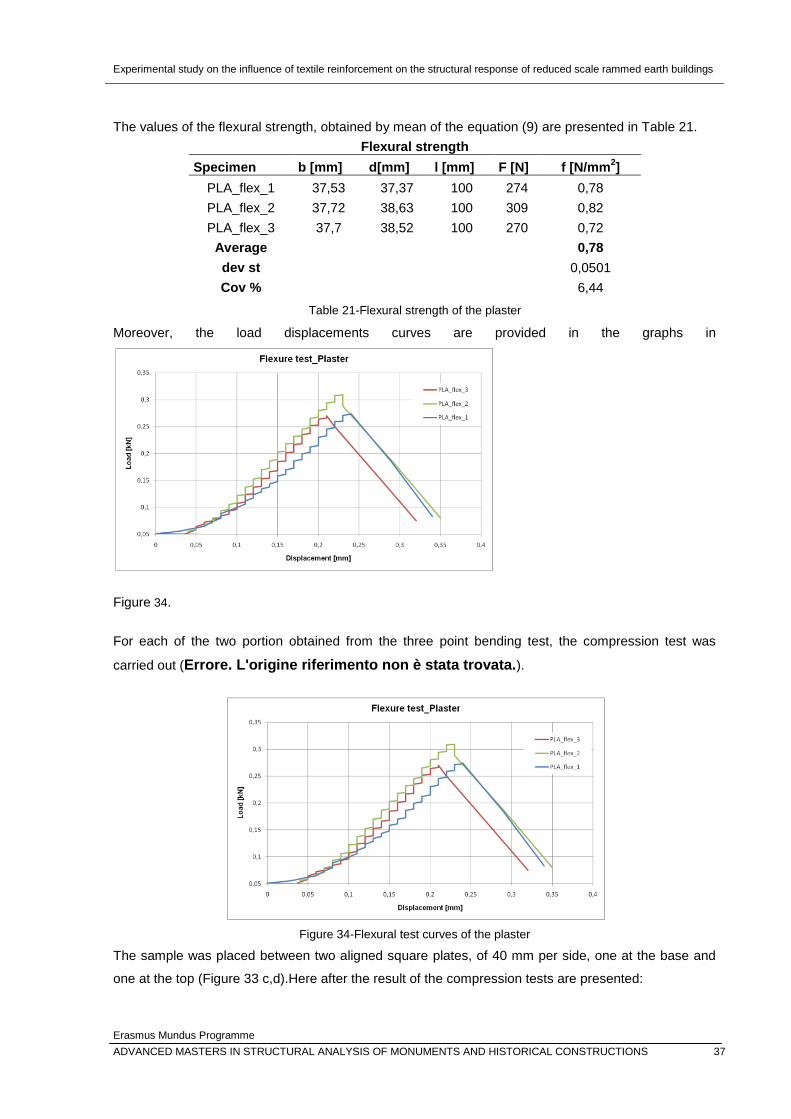
Experimental study on the influence of textile reinforcement on the structural response of reduced scale rammed earth buildings
Erasmus Mundus Programme
ADVANCED MASTERS IN STRUCTURAL ANALYSIS OF MONUMENTS AND HISTORICAL CONSTRUCTIONS 37
The values of the flexural strength, obtained by mean of the equation (9) are presented in Table 21.
Flexural strength
Specimen b [mm] d[mm] l [mm] F [N] f [N/mm2]
PLA_flex_1 37,53 37,37 100 274 0,78
PLA_flex_2 37,72 38,63 100 309 0,82
PLA_flex_3 37,7 38,52 100 270 0,72
Average
0,78
dev st
0,0501
Cov %
6,44
Table 21-Flexural strength of the plaster
Moreover, the load displacements curves are provided in the graphs in
Figure 34.
For each of the two portion obtained from the three point bending test, the compression test was
carried out (Errore. L'origine riferimento non è stata trovata.).
Figure 34-Flexural test curves of the plaster
The sample was placed between two aligned square plates, of 40 mm per side, one at the base and
one at the top (Figure 33 c,d).Here after the result of the compression tests are presented:

Experimental study on the influence of textile reinforcement on the structural response of reduced scale rammed earth buildings
Erasmus Mundus Programme
38 ADVANCED MASTERS IN STRUCTURAL ANALYSIS OF MONUMENTS AND HISTORICAL CONSTRUCTIONS
Figure 35-Compression test on plaster samples
Specimen F [N] fc [N/mm2]
PLA_CO1_A 2327 1,454375
PLA_CO1_B 3442 2,15125
PLA_CO2_A 3681 2,300625
PLA_CO2_B 1724 1,0775
PLA_CO3_A 1229 0,768125
PLA_CO3_B 2197 1,373125
Average
1,52083
dev st
0,5991
Cov %
39,40
Table 22-Compressive strength of the plaser
The variance coefficient highlight the difference between the values of compressive strength,
moreover, as it ‘s clear from the load displacement curves, for the two half of the same specimen, the
evolution of the compressive test it are quite far one from the other.
RE_W3.UNR
The three points bending test was performed also on three prismatic sample having the same
composition of the unreinforced scaled wall RE_W3.UNR.
The results are presented in the graphs and tables below:
Specimen L [mm] linear Shrinkage %
RE_W3.UNR_flex_1 155 3,13
RE_W3.UNR_flex_2 156 2,50
RE_W3.UNR_flex_3 156 2,50
Average
2,71
dev
0,36
cov %
13,32
Table 23 Linear shrinkage of the unreinforced specimen
The linear shrinkage and the flexural strength are inferior than the one of the plasters’ prismatic
specimen that were richer in water and clay.
Flexural strenght
Specimen b [mm] d[mm] l [mm] F [N] f [N/mm2]
RE_W3.UNR_flex_1 39,24 39,23 100 176 0,43
RE_W3.UNR_flex_2 39,58 40,24 100 237 0,55
RE_W3.UNR_flex_3 39,57 40,09 100 202 0,48
Average
0,50
dev
0,06
cov %
12,22
Table 24-Flexural strength of the unreinforced sample

Experimental study on the influence of textile reinforcement on the structural response of reduced scale rammed earth buildings
Erasmus Mundus Programme
ADVANCED MASTERS IN STRUCTURAL ANALYSIS OF MONUMENTS AND HISTORICAL CONSTRUCTIONS 39
Figure 36-Flexural strength of the unreinforced specimen
Also in this case, compressive test were carried out on the two halves of the prisms. The values of
compressive strength obtained and the curves load displacement related to the test are presented in
Table 25-Compressive strength RE_W3.UNR on prismatic samples
Specimen F [N] fc
[N/mm2]
RE_W3.UNR_CO1_A 1816 1,13
RE_W3.UNR_CO1_B 2210 1,38
RE_W3.UNR_CO2_A 3100 1,93
RE_W3.UNR_CO2_B 1855 1,16
RE_W3.UNR_CO3_A 2513 1,57
RE_W3.UNR_CO3_B 2508 1,57
Average
1,46
dev
0,30
cov %
20,67
Table 25-Compressive strength RE_W3.UNR on prismatic samples
The compressive strength obtained on prismatic samples tested under force control is 7% lower than
the one obtained from the cylindric samples tested under displacement control, hence they are quite
the same. The standard variation in the latter test, though is 20% against the 11% on the compression
test performed on the cylindrical samples.
Figure 37Compression test on RE_W3.UNR prismatic samples

Experimental study on the influence of textile reinforcement on the structural response of reduced scale rammed earth buildings
Erasmus Mundus Programme
40 ADVANCED MASTERS IN STRUCTURAL ANALYSIS OF MONUMENTS AND HISTORICAL CONSTRUCTIONS
4.2. In-plane cyclic shear-compression
The main aim of this work is to evaluate the in-plan behavior of reinforced rammed-earth wall,
subjected to seismic action. The horizontal dynamic thrust is simulated by a cyclical shear action,
while the vertical axial compression, due to the weight is supposed to be constant.
To assess the effectiveness of the two different reinforcement systems, and compare the behavior of
the different model configurations under the same load condition, all the scaled walls were initially
designed to be tested with the same set-up for the in-plane cyclic shear-compression. The latter
revealed to be inappropriate, hence, diagonal compression tests were decided to be performed.
4.2.1. Test set-up
To assess the in plane behavior of the scaled walls, the latter had been tested under shear and
compression. The samples were placed on a support that allows the horizontal translation in the shear
plan direction, whereas the same movement wwas restrained at the top of the wall.
The cyclical shear load wass transmitted at the free edge by mean of an horizontal actuator, while a
constant axial compression was applied at the top of the.
The actuator at the base, transmitted the shear by mean of an horizontal frame, made of aluminum
profiles, that was surrounding the perimeter of the wall.
Similarly, another horizontal frame, fixed at the rigid steel frame of the testing apparatus, avoided the
same movement at the top of the wall.
A C steel profile and wooden elements had been used to distribute the compressive load.
This set-up configuration had been utilized for testing the calibration sample RE_W0 and for the
sample internally reinforced RE_W2_INT.
Figure 38-In-plane shear compression test set-up
The two hydraulic actuators were connected to a controller and monitored by two sensors, one for the
load and one for the displacements.

Experimental study on the influence of textile reinforcement on the structural response of reduced scale rammed earth buildings
Erasmus Mundus Programme
ADVANCED MASTERS IN STRUCTURAL ANALYSIS OF MONUMENTS AND HISTORICAL CONSTRUCTIONS 41
4.2.2. Test execution and outcomes
The test procedure is performed following the standard ASTM E 2126 – 02°, method B as reference.
The shear action starts as soon the vertical load reaches the value of 5 kN that is kept constant during
the test.
Horizontal displacements are applied with increasing amplitude each three cycles per step as in the
pattern showed in Table 26- Amplitudes of the reversed cycles.
step cycles Amplitude, % Δu(=20mm) Δd [mm]
1 3 1,25 0,25
2 3 2,5 0,5
3 3 5 1
4 3 7,25 1,5
5 3 10 2
6 3 20 4
7 3 40 8
8 3 60 12
9 3 80 16
10 3 100 20
11 3 120 24
12 3 140 28
13 3 160 32
14 3 180 36
15 3 200 40
Table 26- Amplitudes of the reversed cycles
The actuator displacement wass controlled at a constant cyclic frequency of 0,2 Hz.
The ultimate displacement had been assumed at 20 mm. A first test was firstly performed on the
sample RE_W0 in order to calibrate the test apparatus. An ultimate displacement of 40mm had been
reached until the local damages at the base and partial failure for compression at the top
occurred(Figure 39-in-plan shear compression test on RE_W0).
Figure 39-in-plan shear compression test on RE_W0

Experimental study on the influence of textile reinforcement on the structural response of reduced scale rammed earth buildings
Erasmus Mundus Programme
42 ADVANCED MASTERS IN STRUCTURAL ANALYSIS OF MONUMENTS AND HISTORICAL CONSTRUCTIONS
It wasn’t possible to individuate a clear crack pattern. Only a vertical crack due to vertical compression
is visible. The damages mostly appears locally at the base where the load is applied and at the top
corner where the restrains were applied. The described type of damages were due to the extremely
incoherent consistence of the material.
Moreover the asymmetrical distribution of the damages were due to an incorrect insertion of the input
data. From the graphs on Figure 40. it’s possible to notice that after each cycle, the new starting point
for the application of the next step with amplified displacement is the last of the previous step, hence it
needs to be brought again to the zero level.
In fig. the development of horizontal displacement and horizontal load versus time and hysteretic loop
are reported. Here it’s clear the addition of displacement and load only in one direction, starting from
the last value of the third cycle of each step.
a)
b)
c)
Figure 40-In-plane cyclical loading test: a)Cycle displacement schedule; b)load pattern; c)hysteretic loops

Experimental study on the influence of textile reinforcement on the structural response of reduced scale rammed earth buildings
Erasmus Mundus Programme
ADVANCED MASTERS IN STRUCTURAL ANALYSIS OF MONUMENTS AND HISTORICAL CONSTRUCTIONS 43
Specimen RE_W2.INT
The same test had been performed on the sample RE_W2_INT. the scaled wall was designed and
produced to have two layer of glass fiber reinforcement.
As it described in the 3.2.3, this sample showed an incoherent and uneven consistence since as soon
it had been demoulded. the UPV test proved, moreover the presence of discontinuity end voids in the
thickness of the wall.
During the operation of placing the sample on the testing apparatus, one external layer of dry soil,
completely detached from the fiber mesh That means that the glass fiber mesh didn’t allowed at all the
penetration of the wet soil particles in the bottom layer of the horizontal sample, hence the less
compacted. The latter phenomenon could have been generated due to several causes namely:
Insufficient compactive effort;
High moisture content that increased the internal cohesion of the wet soil clumps more than
the external adhesion inside the whole mass, probably increased by the use of the automatic
kneading.
Excessively small spacing of the glass fiber mesh to allow the penetration of the soil mixture
particles.
The in plane compression shear-cyclical test had been carried out with the same set-up and load
pattern as for the sample RE_W0.
The input data were adjusted so that each cycle start from zero.
In the fig. the Cycle Displacement Schedule, the load pattern and the hysteresis curves are presented
in the Figure 41.
The cycle displacement schedule shows that increments in the displacement amplitude occur every
each three loading cycles.
a)
b)
Figure 41 In-plane cyclical behavior on RE_W2.INT: a) Cycle displacement; b) Load pattern

Experimental study on the influence of textile reinforcement on the structural response of reduced scale rammed earth buildings
Erasmus Mundus Programme
44 ADVANCED MASTERS IN STRUCTURAL ANALYSIS OF MONUMENTS AND HISTORICAL CONSTRUCTIONS
The hysteresis loops and, more clearly the envelope curve, shows a fall in the load values after the
first peak an a successive recovering branch towards a new lower peak.
A similar behavior, for the same sample, occurs also in different type of test hereafter presented.
a)
b)
Figure 42- In-plane cyclical behavior on RE_W2.INT: a) Hysteresis curves: b) Envelope curve
In spite of the compressive load and the ultimate displacement applied, also in this case the failure
didn’t occur due to shear, whereas only local damage are the corner appeared.
Fig
Figure 43-damage patter on RE_W2.INT after the cyclical shear test
Particularly, it has to be noticed that the local crashing in the base corners, where the shear loads are
applied, caused the detachment of the external layer of the specimen that was supposed embedding
the glass fiber mesh (Figure 43).
4.3. In-plane monotonic shear-compression test
In order to pursue the shear behavior, a monotonic test was establish to be performed until failure.
The static in plane shear test, was carried out with the same set-up of the cyclical test.
A vertical load of 15 kN was applied during the entire test, an ultimate lateral displacement of 14,5
mm, was reached before that the test was stopped.
The maximum lateral load reached was equal to 28,13 kN.

Experimental study on the influence of textile reinforcement on the structural response of reduced scale rammed earth buildings
Erasmus Mundus Programme
ADVANCED MASTERS IN STRUCTURAL ANALYSIS OF MONUMENTS AND HISTORICAL CONSTRUCTIONS 45
The curve load displacement (Figure 44) shows a fall in the load development followed by a new
increasing branch towards a new peak as well as in the cyclical test.
Figure 44-Load displacement curve of the monotonic shear test on RE_W2.INT
The only observed failure mode was the intensification of the previous local damages, for this reason
the static test was terminated. It wasn’t possible, neither in this case to observe the failure behavior in
shear nor a clear crack pattern.
Subsequently, it had been decided to change test program, hence diagonal compressive test were
established to be performed.
4.4. Diagonal Compression test
The aim of the diagonal compression test is to measure the diagonal tensile strength of masonry,
indirectly generated by compressive stress.
4.4.1. Test set-up
The very first set up for the diagonal compressive test, was quite essential because it had been
arranged very quickly, as soon as it had been realized that the previous test was ineffective, In order
to carry it out on the sample RE_W2_INT (internally reinforced) that had already undergone to cyclical
and static shear test. It had been possible to use the same sample for different test, since the damage
experienced, effected locally the corners of the scaled model.
Two adjacent triangular steel profile were clamped together to constitute the base for the rectangular
sample diagonally placed. The vertical compressive axial load was transmitted by a triangular steel
profile to the sample. The hydraulic actuator was controlled by displacement at a rate of 10 mm/min.
Some improvement had been brought to test set-up in the successive tests. Specifically in order to
avoid the out of plane overturning for the test RE_W1.INT_D1, two coupled steel profile had been
placed vertically around on opposite faces of the loaded corner. The supported corner at the base was
clamped by mean of wood elements, steel profiles and F clamps in the tests RE_W3.UNR_D2;
RE_W1.INT_D2.

Experimental study on the influence of textile reinforcement on the structural response of reduced scale rammed earth buildings
Erasmus Mundus Programme
46 ADVANCED MASTERS IN STRUCTURAL ANALYSIS OF MONUMENTS AND HISTORICAL CONSTRUCTIONS
Figure 45-Diagonal compression test first set-up
Figure 46-Diagonal Compression test, second set-up
The two set-up are illustrated in Figure 45 and Figure 46. The fist one will be referred as D1, while the
second one, provided of restrains at the top and the bottom corner, is identified as D2.

Experimental study on the influence of textile reinforcement on the structural response of reduced scale rammed earth buildings
Erasmus Mundus Programme
ADVANCED MASTERS IN STRUCTURAL ANALYSIS OF MONUMENTS AND HISTORICAL CONSTRUCTIONS 47
4.4.2. Test execution and outcomes
Specimen RE_W2.INT: Test set-up D1
The Diagonal compression test was firstly performed on the internally reinforced scaled wall, already
tested in in-plane shear.
The failure mode was mainly due to crushing of the loaded corner.
a) Set-up D1
b) Failure
c) Out-of plane overturning
Figure 47-Diagonal test performed with the first set-up on the sample RE_W2.INT
Fractures parallel to the axial plane developed mainly in the thickness, with late and slight effects on
the external surfaces (Figure 457, b).The glass mesh fiber defined a plane of detachment for the
external layer of the sample, although it remained attached to the latter one.
Finally the sample underwent to a complete out-of plane overturning (Figure 457, c).
Figure 48-Load-displacement curve of Diagonal Compression test RE_W2.NT_D1
The maximum load registered is 10565,13 N.
The load versus displacement curve, presents a vertical fall of the load after a first and higher peak,
followed by a recover and another lower peak. A similar behavior has been observed in the in plane
shear test both cyclical and monotonic as well. This phenomenon is probably caused by a
redistribution of the redistribution of the load from the core of the sample to the reinforced layer as the
sequence of the failure mode shown in Figure 47.

Experimental study on the influence of textile reinforcement on the structural response of reduced scale rammed earth buildings
Erasmus Mundus Programme
48 ADVANCED MASTERS IN STRUCTURAL ANALYSIS OF MONUMENTS AND HISTORICAL CONSTRUCTIONS
Specimen RE_W1.EXT: Test set-up D1
The reinforced sample RE_W1.EXT was tested with the set-up D1, excepted for some measures
taken to prevent the out of plane overturning of the quite slender sample.
Figure 49-Diadonal compression test performed on the specimen RE_W1.EXT with the set-up D1
The observed failure behavior involved, once again, the crushing of the loaded corner, furthermore it is
characterized by the delamination of layers parallel to the axial plane of the sample, and the local
detachment of the fiber reinforced plaster.
Figure 50-Load-displacement curves of the diagonal test D1performed on the sample RE_W1.INT
The test was performed two time, for technical problems. The first time that it was performed it showed
higher maximum load and higher stiffness given by the slope in the load-displacement curve.
The maximum load reached during the first test RE_W1.EXT_D1_I is equal to 19 kN. In the second
one RE_W1.EXT the maximum reached load of 13,2 kN remained almost constant until the
interruption of the test. The latter was arrested since a clear shear behavior had not been observed.

Experimental study on the influence of textile reinforcement on the structural response of reduced scale rammed earth buildings
Erasmus Mundus Programme
ADVANCED MASTERS IN STRUCTURAL ANALYSIS OF MONUMENTS AND HISTORICAL CONSTRUCTIONS 49
Specimen RE_W3.UNR, Test set-up D2
The second set-up used for the diagonal compression test foresaw that the loaded and the supported
corner were clamped, in order to avoid premature local damage, due to the excessive fragility of the
material.
Figure 51-Diagonal compression test performed on RE_W3.UNR with the second set-up D2
During the test procedure, vertical cracks appeared and grew throughout the specimen from corner to
corner even though the shape at the top corner is influenced by the tools used to clamp it. Soon after
the removal of all the constrains portions of the sample, two portions of the sample separated one
from the other along the deep cracks, thus the effective failure mode due to diagonal compression is
achieved.
Figure 52-Load displacement curve of the diagonal compression test D2 on RE_W1.EXT
The maximum load registered during the test is 25,181 kN, higher than the one reached for the
internally reinforced sample, with a different test set-up as seen before. In this case, the curve exhibits
a first peak lower and shorter than the one seen for the internally reinforced sample. Moreover the
recovering branch after the fall is almost parallel to the initial loading branch, that means that that
there isn’t any variation in the stiffness.

Experimental study on the influence of textile reinforcement on the structural response of reduced scale rammed earth buildings
Erasmus Mundus Programme
50 ADVANCED MASTERS IN STRUCTURAL ANALYSIS OF MONUMENTS AND HISTORICAL CONSTRUCTIONS
Specimen RE_W2.INT, test set-up D2 The diagonal test, performed on the unreinforced scaled wall model, revealed to be effective and
suitable for testing the specimen object of the present work. The same set-up, that specifically is
provided of clamping systems at the supported and at the load corner, therefore, was implied to test
again the externally reinforced sample RE_W1.EXT. The latter one had been already undergone to
the diagonal test D1.
The specimen was placed in the apparatus to be compressed along the diagonal axis perpendicular to
the one along which the same test was performed with the previous set-up.
Figure 53-Failure mode RE_W1.INT_D2
The failure mode is characterized by severe crushing at the upper edge that shows sharp edges
typical in compression failure. Delamination failure mechanism due concentrated loads, characterize
this failure mode.
Small and few vertical cracks on the two surfaces of the sample are revealed under the glass mesh
fiber.

Experimental study on the influence of textile reinforcement on the structural response of reduced scale rammed earth buildings
Erasmus Mundus Programme
ADVANCED MASTERS IN STRUCTURAL ANALYSIS OF MONUMENTS AND HISTORICAL CONSTRUCTIONS 51
The test is interrupted since big deformation are reached under the maximum load equal to 35kN,
that, nonetheless it’s the highest reached among all the tests.
Figure 54- load- displacement curve diagonal test D2 on RE_W1.EXD
The reinforced plaster is completely detached only after the removal of the restrains. Moreover, the
displacement-load curve confirm that ductility and dissipated energy are visibly increased.
Subsequently, It’s possible to infer that the reinforcement redistributed the stress, and increased
strength and ductility.
4.4.3. Results Comparison
As follows, the load displacement curves related to each one of the two diagonal test set-up are
compared.
In Figure 55 are gathered the curves of the first set-up of diagonal test. This set-up was characterized
by the absence of constrains in out of plane direction on the specimens that underwent trough out of
plane overturning.
Figure 55-Diadonal test D1- load displacement curves
Higher stiffness and higher load carrying capacity were achieved by the externally reinforced sample,
when it was tested the first time in diagonal compression test with the second set-up. It has to be

Experimental study on the influence of textile reinforcement on the structural response of reduced scale rammed earth buildings
Erasmus Mundus Programme
52 ADVANCED MASTERS IN STRUCTURAL ANALYSIS OF MONUMENTS AND HISTORICAL CONSTRUCTIONS
noticed that probably the maximum load is influenced by technical defect. The curve presents a
softening branch.
Subsequently, the second test performed on the same specimen, shows a lower stiffness and a lower
load capacity, whereas the curve development is clearly bilinear. The degradation in the stiffness
between the two tests, performed on the same specimen, is due to the presence of damages.
Similar initial stiffness, conversely, are shown by the curves associated to the diagonal test performed
on the externally reinforced sample, that had been already tested in the racking test, and the one
related to the diagonal test performed for the second time on the RE_W1.EXT sample. The latter
described phenomenon is probably due to the damage state.
Moreover, the second linear branch in the RE_W2.INT, could indicate a redistribution of the stresses
in the reinforcement, that is not noticeable for the externally reinforced scaled wall.
Diagonal compression test Max Load [kN]
RE_W2.INT_D1 11
RE_W1.EXT_D1_I 19
RE_W1.EXT_D1_III 13
RE_W3.UNR_D2 25
RE_W1.EXT_D2 35
Table 27-Maximum loads reached in the diagonal compression test by each sample
Looking at the values of the carrying capacities in Table 27 it’s possible to evaluate the reliability of all
test procedure performed. Higher values are obtained for the second set-up of the diagonal
compression test also for the unreinforced specimen with respect to the internally and externally
reinforced samples tested with the first set up. Thus, clamping the edge corners in the out of plane
direction definitely contributed to channel the tensile stress towards the center of the wallets.
The highest value is obtained for the externally reinforced specimen tested in the second set-up.
Figure 56-Load-displacement curves on the diagonal compression test D2
Moreover, comparing the load-displacements curves, also the ductility increases greatly in the case of
the externally reinforced specimen. The initial stiffness, intended as the slopes of the linear branches

Experimental study on the influence of textile reinforcement on the structural response of reduced scale rammed earth buildings
Erasmus Mundus Programme
ADVANCED MASTERS IN STRUCTURAL ANALYSIS OF MONUMENTS AND HISTORICAL CONSTRUCTIONS 53
of the two curves are very close in the cases, hence the material had the same behavior in the elastic
phase in both specimens. The latter can be assumed as a proof of reliability of the tests and a
validation of the results.
Furthermore, the estimated dissipation energy, approximately determined as the area below the load-
displacement curves, related to the externally reinforced sample diagonally compressed in the second
set-up is 2,32 J, thus five time the one dissipated during the same test performed on the unreinforced
sample equal to 0,454 J.
Regarding the behavior of the Internally reinforced scaled wall model, it remarkable to notice that all
the load displacement curves of the testes that has been performed on it (Figure 1), exhibit a steep
soon after the maximum load reached, subsequently a linear upward branch follows.
a) Envelope curve cyclic loading
b) Monotonic in-plane shear test
c) Diagonal compression test
Figure 57- Load displacement curves of the tests performed on the specimen RE_W2.EXT
The described Phenomenon could be interpreted as the contribution of the reinforcement to the
performance of the sample under compression. Specifically the resistance of the reinforced layer is
activated consequently to development of high strain values, after that the strength of the unreinforced
portion is exceed.

Experimental study on the influence of textile reinforcement on the structural response of reduced scale rammed earth buildings
Erasmus Mundus Programme
54 ADVANCED MASTERS IN STRUCTURAL ANALYSIS OF MONUMENTS AND HISTORICAL CONSTRUCTIONS
4.5. Interpretation of the tests
As seen in the previous paragraph, the shear performance of the specimens tested with the In-plane
cyclic shear-compression procedure, was characterized by damages localized in the edge, due to the
low cohesiveness of the material. In this condition, the Navier hypothesis are no longer verified.
In order to eventually achieve quantitative result in term of mechanical properties and expected
enhancement of the latter ones, some improvements and correction to the implied procedures could
be undertaken as described in the next chapters.
Moreover, if the shear failure would be achieved shear characteristics could have been determined.
The ASTM standards E 2126 – 02, prescribe that at least two identical walls have to be tested in in-
plane shear compression in to determine the shear strength as follows:
𝑉𝑝𝑒𝑎𝑘 =𝑃𝑎𝑤𝑝𝑒𝑎𝑘
𝐿 (10)
Where:
Vpeak is the maximum shear strength
Pave:peak is the maximum lateral load;
L : is the length of the wall.
Moreover, assuming the rammed earth as as isotropic and homogeneous material, in the formulation
proposed by Turšnek Čačovič for masonry, the shear strength is determined as referential tensile
strength ft Equation (10)
Specifically, A wall panel, subjected to in plane compression and lateral loads, experiences a shear
failure characterized by diagonal cracks when the principal tensile stresses σt exceeds the diagonal
tensile strength in correspondence of the maximum lateral load.
𝑓𝑡 = 𝜎𝑡 = (𝜎0
2)2 + (𝑏(𝜏𝑚𝑎𝑥 )2 −
𝜎0
2 (11)
Where τmax is the average shear stress in the horizontal section of the wall at the attained maximum
horizontal load Hmax;
σ0 is the average compressive stress in the horizontal section Aw of the walls due to constant vertical
load N:
𝜎0 =𝑁
𝐴𝑤 (12)
is an index of the ratio between the height and the length of the wall
The wall is assumed to behave like a cantilever, clamped at the base and loaded at the top.
In the ASTM E 2126 – 02 the secant shear modulus calculated as:
G′ =P
Δ∗
H
L (13)

Experimental study on the influence of textile reinforcement on the structural response of reduced scale rammed earth buildings
Erasmus Mundus Programme
ADVANCED MASTERS IN STRUCTURAL ANALYSIS OF MONUMENTS AND HISTORICAL CONSTRUCTIONS 55
Where :
G’ is the shear modulus of the wall obtained test, defines the secant to the force displacement curve at
specified wall displacements;
P is the lateral shear force measured at the top edge of the wall;
Δ is the displacement of the top edge of the wall.
H and L are the height and the length of the shear wall respectively.
Furthermore Tomaževič (Tomaževič 1996) proposes the degradation of secant stiffness as factor to
be evaluated evaluate during the cyclical evolution of the test:
𝐾 =𝐻
𝑑 (14)
The secant stiffness is determined as the ratio between the lateral resisting force H and the lateral
displacement (eq. 14). At the occurrence of the first crack the stiffness is calculated as in the eq (15).
Kc =Hcr
dcr (15)
From the correlation curve of the stiffness and deformation the eq. 16 is obtained,
K
Kcr= α
d
dmax
2
(16)
The parameters of stiffness degradation α and β are related to different test procedure, see Tomaževič
1996.
Moreover, the same author, as a measure of the energy dissipation capacity, proposes the
comparison between cumulative input energy and dissipated hysteretic Energy.
The first one is defined as the work computed by the actuator to push and pull the wall to maximum
displacement amplitudes in one cycle of loading. It is calculated as the sum of areas under the positive
and negative part of hysteresis loop. The second as the area of hysteresis loop between two
consecutive displacement peaks.
Figure 58- a) Evaluation of the input energy in One loading cycle; b)Evaluation of dissipated energy in one loading cycle (Tomaževič 1996)
For masonry, the shear parameters are usually determined also by mean of diagonal compression.
Since the load is applied with an inclination of 45° on the specimen, the diagonal compression test
simulates a pure shear stress state where in which the Mohr circle of the stress state is centered in the
origins of σ–τ axis.
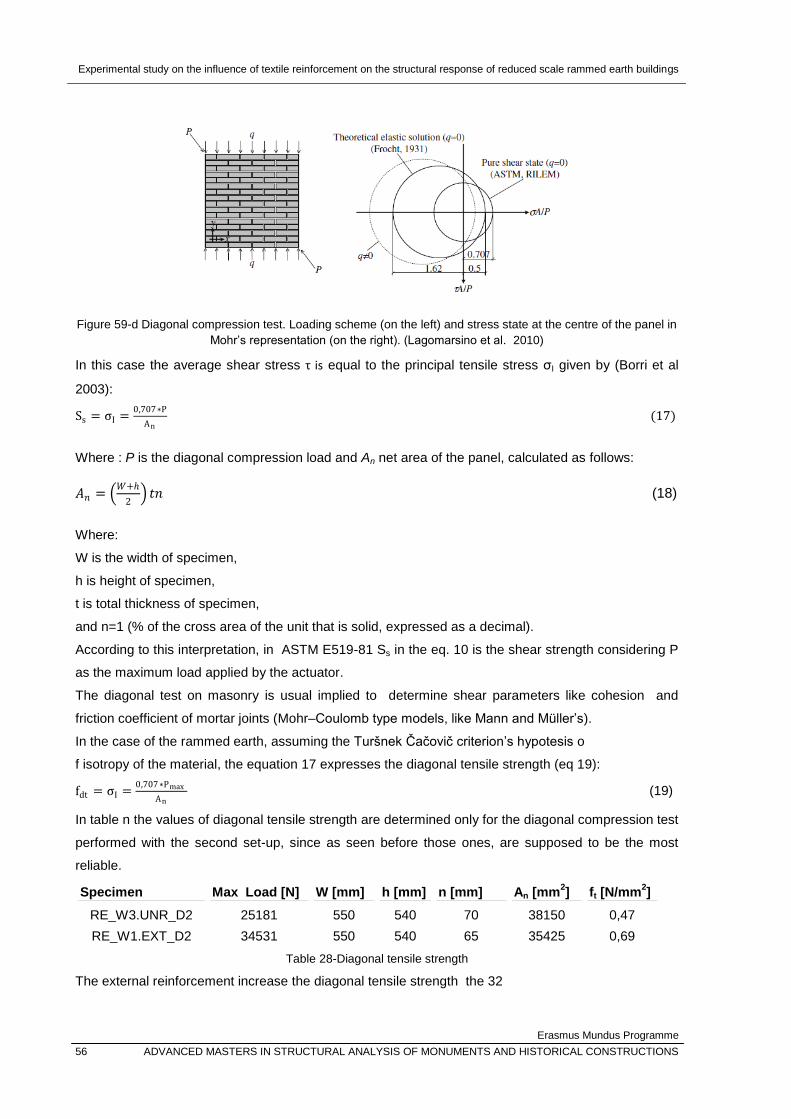
Experimental study on the influence of textile reinforcement on the structural response of reduced scale rammed earth buildings
Erasmus Mundus Programme
56 ADVANCED MASTERS IN STRUCTURAL ANALYSIS OF MONUMENTS AND HISTORICAL CONSTRUCTIONS
Figure 59-d Diagonal compression test. Loading scheme (on the left) and stress state at the centre of the panel in
Mohr’s representation (on the right). (Lagomarsino et al. 2010)
In this case the average shear stress τ is equal to the principal tensile stress σI given by (Borri et al
2003):
Ss = σI =0,707∗P
An (17)
Where : P is the diagonal compression load and An net area of the panel, calculated as follows:
𝐴𝑛 = 𝑊+ℎ
2 𝑡𝑛 (18)
Where:
W is the width of specimen,
h is height of specimen,
t is total thickness of specimen,
and n=1 (% of the cross area of the unit that is solid, expressed as a decimal).
According to this interpretation, in ASTM E519-81 Ss in the eq. 10 is the shear strength considering P
as the maximum load applied by the actuator.
The diagonal test on masonry is usual implied to determine shear parameters like cohesion and
friction coefficient of mortar joints (Mohr–Coulomb type models, like Mann and Müller’s).
In the case of the rammed earth, assuming the Turšnek Čačovič criterion’s hypotesis o
f isotropy of the material, the equation 17 expresses the diagonal tensile strength (eq 19):
fdt = σI =0,707∗Pmax
An (19)
In table n the values of diagonal tensile strength are determined only for the diagonal compression test
performed with the second set-up, since as seen before those ones, are supposed to be the most
reliable.
Specimen Max Load [N] W [mm] h [mm] n [mm] An [mm2] ft [N/mm
2]
RE_W3.UNR_D2 25181 550 540 70 38150 0,47
RE_W1.EXT_D2 34531 550 540 65 35425 0,69
Table 28-Diagonal tensile strength
The external reinforcement increase the diagonal tensile strength the 32

Experimental study on the influence of textile reinforcement on the structural response of reduced scale rammed earth buildings
Erasmus Mundus Programme
ADVANCED MASTERS IN STRUCTURAL ANALYSIS OF MONUMENTS AND HISTORICAL CONSTRUCTIONS 57
5. Conclusions
The most remarkable result obtained during the experimental program carried out in this work is the
good performance of the scaled wall model RE_W2.EXT. The specimen is reinforced by mean single
layers of glass fiber mesh placed on the two faces of the wallet with a clay plaster.
In the diagonal compression test it exhibited higher load capacity, ductility and energy dissipation than
the unreinforced sample RE_W.UNR, moreover the diagonal tensile strength is increased of the 32%
compared to the unreinforced scaled model.
The failure mode was characterized by great deformations in the transverse direction of the load and
few and slight vertical cracks, whereas the unreinforced wall was completely split in the middle after
the test.
These results have been achieved in spite of the heavy presence of cracks due to shrinkage present
on the clay render, crack that didn’t compromised so much the bonding effect between the wall and
the mesh. The mesh fiber was still well embedded in the render even if detached due the big
deformations reached.
Moreover, the behavior exhibited by both samples, externally reinforced and unreinforced one, in the
diagonal test D2, is coherent with the one expected for this test typology, i.e, vertical cracks
propagated in the loading direction, towards the corner edges, starting from the middle of the
specimen. This can be considered a proof of reliability of the test and a confirmation of the
effectiveness of the test set-up where claps at the corners placed vertically were provided.
Regarding the internal reinforce system, it noteworthy the contribution of the glass fiber mesh to the
compressive strength that was activated after the failure of the internal unreinforced core of the wall.

Experimental study on the influence of textile reinforcement on the structural response of reduced scale rammed earth buildings
Erasmus Mundus Programme
58 ADVANCED MASTERS IN STRUCTURAL ANALYSIS OF MONUMENTS AND HISTORICAL CONSTRUCTIONS

Experimental study on the influence of textile reinforcement on the structural response of reduced scale rammed earth buildings
Erasmus Mundus Programme
ADVANCED MASTERS IN STRUCTURAL ANALYSIS OF MONUMENTS AND HISTORICAL CONSTRUCTIONS 59
6. Further research developments
Nonetheless the experimental campaign it has been quite useful to highlighted some kind of
improvements concerning test set-ups and production procedures that could be undertaken
considering furher developments of the present research.
the consistency of the wet mixture could be improved.
Firstly, in order to improve the optimal moisture content could be determined by mean of a series of
tests aiming to the definition of the compaction curves.
Secondly, the adhesion of the fiber mesh could be enhanced implying a mesh with wider spacing
step, since the bonding effect is conferred to the penetration of soil particles inside the voids of the
mesh, especially if the reinforcement is placed internally inside the wall thickness. In this case in fact
inside the soil mixture of the walls is coarser than the one used for the render that showed a good
embedding effect.
The render, moreover, could be also be modified in term of material composition. The research of
Emiroğlu et al 2005, disclosed that a clay plaster with a ratio 1:1 between clay and sand reduces the
appearance of cracks due to shrinkage, in a thin, plastic an clayish layer on soil mixture like the one of
the plaster. Inserting some kind of additives could be also a solution to be evaluated.
The restrains implied in the diagonal test set-up avoided the debonding of the reinforced plaster, thus
foreseeing the presence of transversal connectors would simulate the action of the clamping restrains.
Furthermore, evaluating the bonding strength and the adhesion properties of the reinforced clay
plaster, could be significant.
The set-up of the in-plane shear could be rearranged in order to simulate better the boundary
conditions.
Once achieved satisfactory and reliable result concerning the in plane shear performance of the
scaled walls as designed for the present work, the obtained results could be inversely processed from
the scale model to the real scale dimension according to the Buckingham π theorem.
Subsequently, performing the same test on full scale specimen could help to verify the reliability of the
methodology based on scaled models tests.
Further research paths could be undertaken namely: the effect of the glass fiber mesh around the
opening and in the connection between transversal wall could be inquired.
In conclusion numerical model based on the described test campaign could be performed.

Experimental study on the influence of textile reinforcement on the structural response of reduced scale rammed earth buildings
Erasmus Mundus Programme
60 ADVANCED MASTERS IN STRUCTURAL ANALYSIS OF MONUMENTS AND HISTORICAL CONSTRUCTIONS
7. REFERENCES
Silva, Rui A., et al. "Conservation and new construction solutions in rammed earth." Structural
rehabilitation of old buildings. Springer Berlin Heidelberg, 2014. 77-108.
Miccoli, Lorenzo, Urs Müller, and Patrick Fontana. "Mechanical behaviour of earthen materials: a
comparison between earth block masonry, rammed earth and cob." Construction and Building
Materials 61 (2014): 327-339.
Arslan, Mehmet Emin, Mehmet Emiroğlu, and Ahmet Yalama. "Structural behavior of rammed earth
walls under lateral cyclic loading: A comparative experimental study." Construction and Building
Materials 133 (2017): 433-442.
Miccoli, Lorenzo, Anastasios Drougkas, and Urs Müller. "In-plane behaviour of rammed earth under
cyclic loading: Experimental testing and finite element modelling." Engineering Structures 125 (2016):
144-152.
Liu Kai, Ming Wang, and Yaan Wang. "Seismic retrofitting of rural rammed earth buildings using
externally bonded fibers." Construction and Building Materials 100 (2015): 91-101.
Hamilton III, H. R., John McBride, and Joseph Grill. "Cyclic testing of rammed-earth walls containing
post-tensioned reinforcement." Earthquake spectra 22.4 (2006): 937-959.
Silva, Rui André Martins, et al. "Modelling of rammed earth under shear loading." 9th International
Conference on Structural Analysis of Historical Constructions. 2014.
Vargas, Julio. "Earthquake resistant rammed-earth (tapial) buildings." Simposio Internacional sobre
Prevención de Desastres Sísmicos= International Symposium on Earthquake Disaster Prevention.
México. Centro Nacional de Prevención de Desastes (CENAPRED); Japón. Agencia de Cooperación
Internacional (JICA); NU. Centro para el Desarrollo Regional (UNCRD), 1992.
DELGADO, M. Carmen Jiménez; GUERRERO, Ignacio Cañas. The selection of soils for unstabilised
earth building: A normative review. Construction and building materials, 2007, 21.2: 237-251.
CIANCIO, Daniela; JAQUIN, Paul; WALKER, Peter. Advances on the assessment of soil suitability for
rammed earth. Construction and Building Materials, 2013, 42: 40-47.
MANIATIDIS, V.; WALKER, P. UK National guidelines for rammed earth. In: Proceedings 9th
International Conference on the study and conservation of earthen architecture,. University of Bath,
2003.(Appendix A Physical properties of rammed earth)

Experimental study on the influence of textile reinforcement on the structural response of reduced scale rammed earth buildings
Erasmus Mundus Programme
ADVANCED MASTERS IN STRUCTURAL ANALYSIS OF MONUMENTS AND HISTORICAL CONSTRUCTIONS 61
Bui, Quoc-Bao, and Jean-Claude Morel. "Assessing the anisotropy of rammed earth." Construction
and building Materials 23.9 (2009): 3005-3011.
HOLTZ, Robert D.; KOVACS, William D. An introduction to geotechnical engineering. 1981.
HALL, Matthew; DJERBIB, Youcef. Rammed earth sample production: context, recommendations and
consistency. Construction and Building Materials, 2004, 18.4: 281-286.
Jaquin, Paul A., C. E. Augarde, and C. M. Gerrard. "Analysis of historic rammed earth
construction." Proceedings of the 5th international conference on structural analysis of historical
constructions, New Delhi, India. 2006.
NZS 4298: 1998. Materials and workmanship for earth buildings – incorporating amendment no.
1.Standards New Zealand, Wellington, New Zealand, 1998.
BS 1377: Part 4 :1990 British Standards Methods of test for Soils for Civil engineering purposes; Part
4. Compaction-related test. British Standards Methods, 1990
AASHTO T 99-10: Moisture-Density relation using a 2,5Kg hammer. American Association of State
Highway and Transportation Officials
ASTM D698: Standard Test Methods for Laboratory Compaction Characteristics of Soil Using
Standard Effort (12 400 ft-lbf/ft3 (600 kN-m/m3). American Society for Testing and Materials. 1980
IS: 2720 – 2 Determination of water content. Bureau of Indian Standards (BIS). 1973
UNI, EN. "1015-11.(2007)." Methods of test for mortar for masonry—Part 11.
ASTM E 2126 – 02a: Standard Test Methods for Cyclic (Reversed) Load Test for Shear Resistance of
Walls for Buildings
ASTM E 519 – 02 Standard Test Method for Diagonal Tension (Shear) in Masonry Assemblages
Emiroğlu, Mehmet, Ahmet Yalama, and Yasemin Erdoğdu. "Performance of ready-mixed clay plasters
produced with different clay/sand ratios." Applied Clay Science 115 (2015): 221-229. Render anti
shrinkage
Tomaževič, Miha. "Shear resistance of masonry walls and Eurocode 6: shear versus tensile strength
of masonry." Materials and structures 42.7 (2009): 889-907.
Tomaževič, Miha, and Marjana Lutman. "Seismic behavior of masonry walls: modeling of hysteretic
rules." Journal of structural engineering 122.9 (1996): 1048-1054.

Experimental study on the influence of textile reinforcement on the structural response of reduced scale rammed earth buildings
Erasmus Mundus Programme
62 ADVANCED MASTERS IN STRUCTURAL ANALYSIS OF MONUMENTS AND HISTORICAL CONSTRUCTIONS
Calderini Chiara, Serena Cattari, and Sergio Lagomarsino. "The use of the diagonal compression test
to identify the shear mechanical parameters of masonry." Construction and building materials 24.5
(2010): 677-685.
Corradi Marco, Antonio Borri, and Andrea Vignoli. "Experimental study on the determination of
strength of masonry walls." Construction and Building Materials 17.5 (2003): 325-337.